Embed Size (px)
Citation preview

IRISH LIFE MAPS
The Irish Life Multi Asset Portfolio Funds (MAPS) are available on a range of products provided by Irish Life Assurance, managed by Irish Life Investment Managers (ILIM).
PENSIONS INVESTMENTS LIFE INSURANCE
QUARTER 4 (Q4) 2020 I 1 OCTOBER TO 31 DECEMBER

Market and Irish Life MAPS Overview 3Market Summary – Q4 4Irish Life MAPS Fund Performance 4-5Market Snapshot 6Irish Life MAPS Asset Split 7
Irish Life MAPS Risk Management Strategies 8Irish Life MAPS Diversification 9 Regular Reviews 9 Rebalancing 10 Global Low Volatility Shares 12 & 14 Option Strategy 12 & 15Dynamic Share To Cash Model 11Currency Hedging 12
Asset Classes Explained 131 Shares 14-162 Bonds 17-183 External Managers/Alternatives 194 Property 20
ILIM’s Credentials 21-22
CONTENTS
At Irish Life, we understand that our customers’ financial objectives and attitudes to risk are personal to their circumstances. We worked closely with Irish Life Investment Managers, our award-winning appointed investment managers, to create our diversified flagship Multi Asset Portfolio range (MAPS), which caters to different risk profiles. The funds are suitable for longer-term investors and are rebalanced every quarter to ensure alignment with risk preferences. MAPS can be accessed via our pension, investment and savings plans.
This update discusses key themes driving markets in the fourth quarter and highlights how each of the funds performed.
We also explain the asset mix within each fund and outline how ILIM manages risk across the range.
Lastly, we outline some of the Responsible Investing (Environmental, Social and Governance or ESG) enhancements made to the Global Shares, Low Volatility Shares, Alternatives and Property exposures in MAPS.
As a proud ambassador for the UN-supported Principles for Responsible Investment, ILIM is a leader in driving ESG investing in Ireland – influencing positive change in environmental, social and governance issues, aiming to create more sustainable, long-term investor returns.
WELCOME
Warning: If you invest in these funds you may lose some or all of the money you invest.
Warning: The value of your investment may go down as well as up.
Warning: These funds may be affected by changes in currency exchange rates.

3
MARKET AND IRISH LIFE MAPS OVERVIEW

4
Despite a fall in October, the equity rally continued through the fourth quarter, with markets reaching new all-time highs by year-end. Shares initially fell due to a rise in Covid-19 case numbers and the subsequent reintroduction of restrictions. Concerns that the US presidential election could be contested also contributed to the pullback, as did reduced fiscal supports in the US. Global shares enjoyed a strong end to the year, as uncertainty surrounding the US presidential election was removed, and several Covid-19 vaccine trials concluded successfully. This spurred a sharp market rally. December saw the beginning of Covid-19 vaccination programmes, and the year finished on a high, helped by a $900bn US stimulus package and a Brexit trade agreement.
MAPS – AIMING TO DELIVER RISK MANAGEMENT AND SMOOTHER RETURNS OVER THE LONG TERMOur MAPS funds are built on the belief that diversification offers investors a potentially smoother journey and that risk management aims to reduce the impact of the various ups and downs in the underlying investments. Each of our five MAPS funds invests in a range of assets, reflective of its risk profile. These include shares, bonds, property, cash and external managers/alternatives. You’ll find a full explanation of these asset classes on pages 13–20.
In the table below and on the following page, you can see the individual calendar year returns from each of the five Irish Life MAPS funds, and the annualised return over the last one, three and five years as well as since launch (17 May 2013) to the end of quarter four. Irish Life MAPS is a long-term investment – we would always advise caution when looking at fund performances over time periods of less than five years.
MARKET SUMMARY AND IRISH LIFE MAPS® FUND PERFORMANCE
Source: ‘Moneymate’. Gross returns shown to 01 January 2021 (‘Moneymate), before any fund management charge.
Warning: If you invest in these funds you may lose some or all of the money you invest.
Warning: The value of your investment may go down as well as up.
Warning: These funds may be affected by changes in currency exchange rates.
Warning: Past performance is not a reliable guide to future performance.
Calendar Year Return
2014 2015 2016 2017
2018
2019 2020
6.5%
9.1%
13.6
% 15.5
%
16.1
%
3.9%
6.1%
8.8% 9.
9%
6.4%
4.6%
6.6% 8.
2% 10.0
% 12.8
%
4.7% 7.
0%
9.0%
11.6
% 14.7
%
-2.5
%
-3.3
%
-4.0
%
-4.5
%
-6.2
%
6.6%
10.1
% 12.8
% 15.5
% 18.4
%
1.1%
0.8%
0.2% 1.0%
3.0%
MAP2 MAP3 MAP4 MAP5 MAP6
5
Source: ‘Moneymate’. Gross returns shown to 31 December 2020 (‘Moneymate), before any fund management charge. Launch date – 17 May 2013.
Performance as at 31/12/2020
1 year 3 year p.a.
5 year p.a. Since launch p.a.
1.1% 1.7%
2.9% 3.2%
1 year 3 year p.a.
5 year p.a. Since launch p.a.
0.8% 2.4%
4.1% 4.5%
1 year 3 year p.a.
5 year p.a. Since launch p.a.
0.2% 2.7%
5.0% 6.0%
1 year 3 year p.a.
5 year p.a. Since launch p.a.
1.0% 3.6%
6.3% 7.4%
1 year 3 year p.a.
5 year p.a. Since launch p.a.
3.0% 4.6%
7.8% 7.6%
Warning: If you invest in these funds you may lose some or all of the money you invest.
Warning: The value of your investment may go down as well as up.
Warning: These funds may be affected by changes in currency exchange rates.
Warning: Past performance is not a reliable guide to future performance.
MAP2 MAP3 MAP4
MAP5 MAP6

6
MARKET SNAPSHOT
Source: Cian O’Mahony, Investment Manager, Irish Life Investment Managers (ILIM), 31 December 2020.
Over the quarter, the MSCI AC World equity benchmark rose 12.9% (10.0% in euro terms)
Emerging markets rose 16.1% (14.8% in euro terms), benefiting from a weaker US dollar and expectations of a recovery in global growth in 2021, linked to the rollout out of vaccines.
Pacific Basin shares rose 14.3% (15.1% in euro terms), supported by a robust economic backdrop in China and Asia.
Europe lagged, rising 10.2% (10.5% in euro terms) as the stronger euro acted as a drag on exporters. Meanwhile, growth was relatively weak, due to the severe restrictions put in place to combat the renewed rise in Covid 19 cases.
The UK also underperformed, rising 10.6% (12.1% in euro terms) due to Brexit-related uncertainty and ongoing difficulties in tackling Covid-19.
SHARES BONDS, CURRENCIES & COMMODITIES
The ICE BofA Merrill Lynch Eurozone > 5-year sovereign bond benchmark rose 1.7%
German 10-year yields fell to -0.57%, as the Eurozone economy contracted in the fourth quarter due to the restrictions announced to combat the rise in Covid-19 cases. Yields were also pushed lower by the €500bn increase in asset purchases announced by the European Central Bank (ECB) and the extension of these until March 2022.
Peripheral spreads also continued to narrow, supported by the formal approval of the EU’s Recovery Fund of €750bn, which includes €390bn of grants.
The extension of ECB asset purchases also helped to lower spreads. By quarter-end, Italian 10-year spreads against Germany were down to 111 basis points (bps), Spanish spreads had narrowed to 61ps, while Portuguese spreads had fallen to 60bps.
European investment grade corporate bonds rose 2.0% as yields and spreads fell to 0.33% and 91bps, respectively. Despite the contraction in Eurozone growth in the fourth quarter, concerns over potential defaults continued to ease on the back of the better growth outlook for 2021 and ongoing ECB purchases of investment grade corporate bonds.
The euro rose against the US dollar to 1.2225. The US dollar, which is generally viewed as a ‘safe haven’ asset, suffered in the more ‘risk on’ environment. While the ECB did increase the level of its asset purchases, the failure to cut interest rates also contributed to the euro’s gains against the US dollar. The approval of the EU Recovery Fund, seen as improving the long-term outlook for the Eurozone, was also positive for the euro.
Commodities rose 14.5% (9.7% in euro terms), supported by the expectation of higher demand in 2021 on the back of a rebound in the global economy.
West Texas Intermediate (WTI) oil rose 20.6%, as OPEC slowed its easing of production cuts by announcing an increase of only 500 barrels a day through January. The oil price was also boosted by falling inventory levels. Gold was down slightly, by -0.2%, as reduced demand for defensive assets offset the support provided by the weaker US dollar.
7
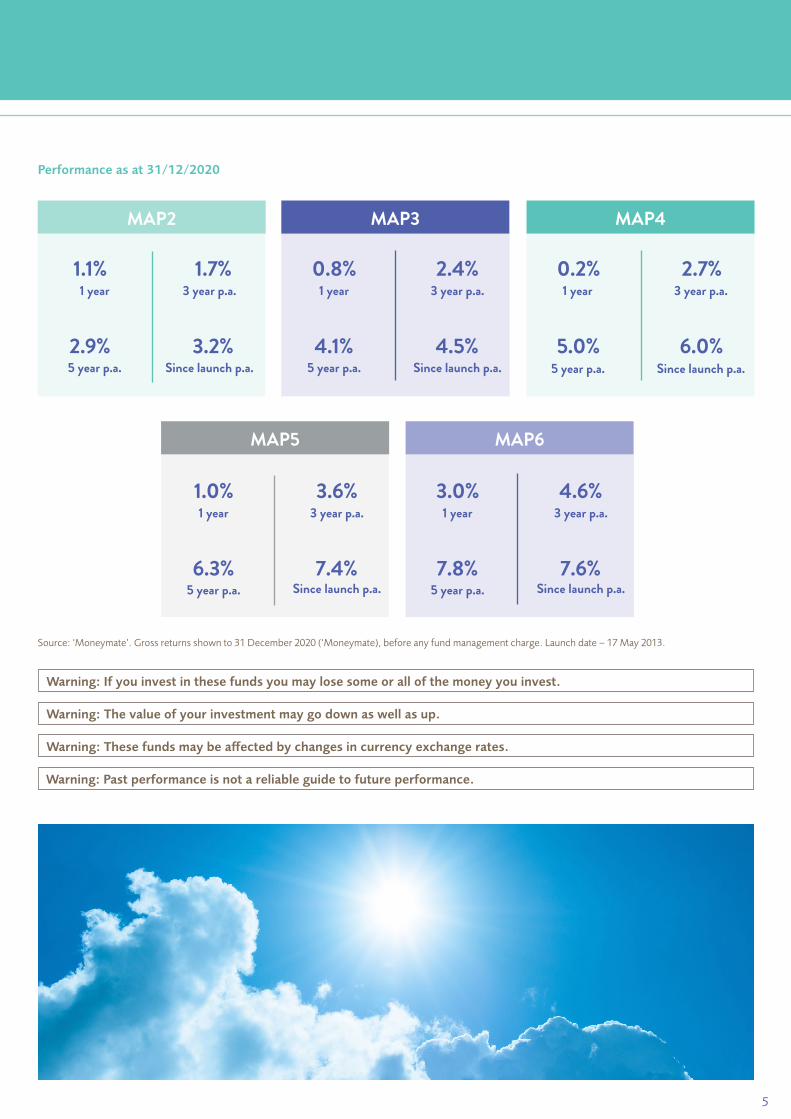
IRISH LIFE MAPS® ASSET SPLIT
There are five Irish Life MAPS funds to suit different attitudes to risk. The table below shows the strategic asset mix for each of the funds. As you can see, the lower-risk fund Multi Asset Portfolio 2 (MAP2) has a very high percentage in bonds and cash, which are traditionally less volatile assets. The higher-risk fund MAP6 is mainly invested in shares, which are traditionally more volatile than bonds or cash but have, in the past, given better long-term returns.
Warning: Past performance is not a reliable guide to future performance.
Source: ILIM, 31 December 2020. *Global Shares use the DSC model – see page 11 for more details.
The table above shows the strategic asset mix before any DSC or tactical movements (where applicable). ILIM rebalances the fund back to this mix on a quarterly basis. For the latest actual Irish Life MAPS fund mixes, which allow for any tactical or DSC changes, for example, see the relevant MAPS fund factsheet at www.irishlife.ie.
ILIM will continue to monitor and review these assets and may change them over time.
FUND NAME MAP2 MAP3 MAP4 MAP5 MAP6
Bonds 45.0% 28.5% 13.5% 4.5% 0.0%
External Managers/Alternatives 18.0% 18.0% 18.0% 7.0% 3.5%
Property 7.0% 8.5% 8.5% 8.5% 6.5%
Emerging Market Shares 0.0% 0.0% 0.0% 10.0% 32.0%
Low Volatility Shares 5.0% 10.0% 15.0% 11.0% 6.5%
Global Shares* 11.0% 22.0% 33.0% 45.0% 45.0%
Infrastructure Shares 1.0% 2.0% 3.0% 2.0% 1.5%
Option Strategy 3.0% 6.0% 9.0% 12.0% 5.0%
Cash 10.0% 5.0% 0.0% 0.0% 0.0%

8
IRISH LIFE MAPS RISK MANAGEMENT STRATEGIES

9
IRISH LIFE MAPS® RISK MANAGEMENT
IRISH LIFE MAPS® DIVERSIFICATIONAs we’ve demonstrated, each of the Irish Life MAPS funds is diversified across a range of asset types – shares, bonds, property, cash and external managers/alternatives.
Within each of these different asset types, there is even further diversification. For example, within the main share asset classes there is an allocation to global shares, low volatility shares, infrastructure shares and the option strategy, which was added in 2018. Each of these generates a return in a different way.
Global shares aim to capture the movement in share markets across the developed and emerging markets. The low volatility strategy invests in shares with certain characteristics that aim to deliver a smoother journey. The infrastructure shares tend to give a more stable return over the longer term.
The option strategy aims to generate a more steady return through the regular sale of ‘put’ options. These provide some downside protection if markets fall, and for which the funds get paid a fee.
The extent and type of diversification that exists in each asset class is shown in more detail on pages 13–20.
This level of diversification aims to ensure that the performance of the funds is not dependent on any one asset type, sector, geographical region, investment manager or investment style. Removing this dependence aims to produce a smoother investment journey over the longer term.
REGULAR REVIEWSILIM undertakes a regular review of Irish Life MAPS, evaluatingthe current asset and manager allocations to ensure they continueto represent the best of ILIM’s thinking and capability with respectto achieving long-term risk and performance objectives.The process takes into account the short, medium and long-termexpected outlook for investment markets, with a view tooptimising the strategic fund mix. Typically in these reviews, ILIMis looking for opportunities to either enhance risk managementand/or increase the expected fund returns. This process involvesreviewing investment opportunities such as new managers, assetclasses, strategies, geographies, developments in quantitativeresearch and simulating how best to incorporate any prospectivechanges into the existing funds allowing for the complexity, time,cost and benefit of doing so.
Warning: The value of your investment may go down as well as up.
Warning: If you invest in these funds you may lose some or all of the money you invest.
Warning: These funds may be affected by changes in currency exchange rates.
RISK MANAGEMENT STRATEGIES
RISK MANAGEMENT STRATEGIES
10
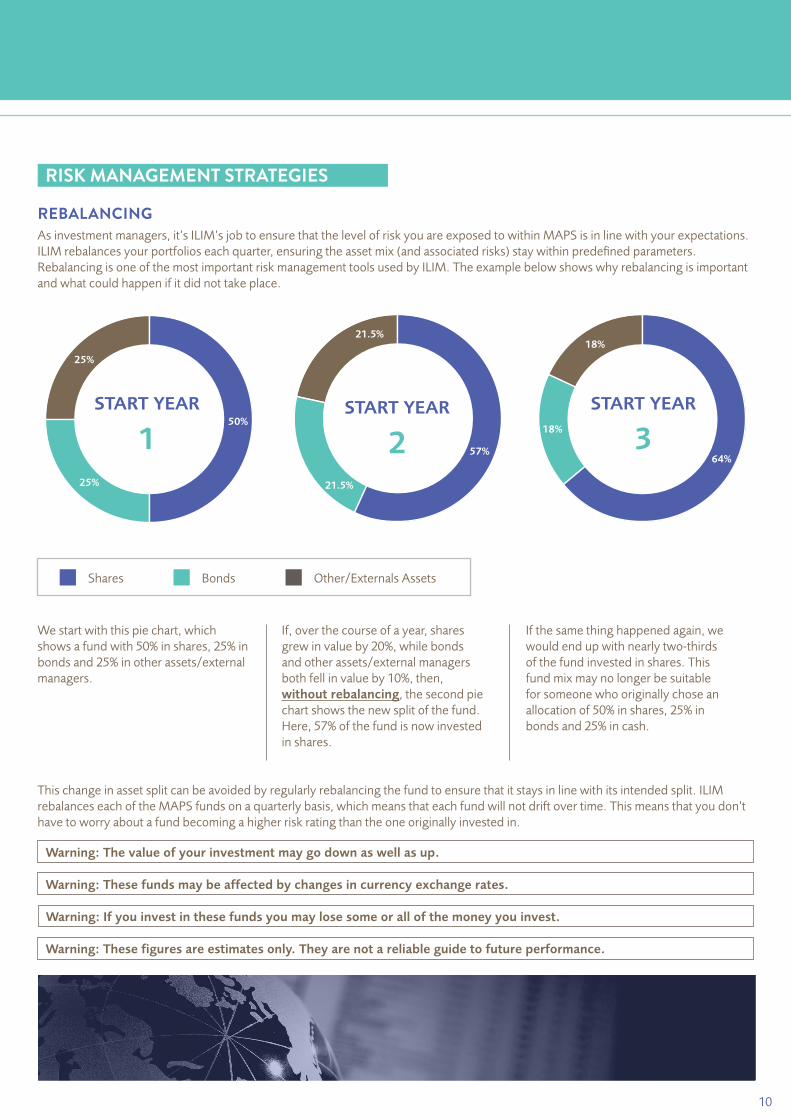
REBALANCINGAs investment managers, it’s ILIM’s job to ensure that the level of risk you are exposed to within MAPS is in line with your expectations. ILIM rebalances your portfolios each quarter, ensuring the asset mix (and associated risks) stay within predefined parameters. Rebalancing is one of the most important risk management tools used by ILIM. The example below shows why rebalancing is important and what could happen if it did not take place.
START YEAR
1START YEAR
2START YEAR
3
Shares Bonds Other/Externals Assets
This change in asset split can be avoided by regularly rebalancing the fund to ensure that it stays in line with its intended split. ILIM rebalances each of the MAPS funds on a quarterly basis, which means that each fund will not drift over time. This means that you don’t have to worry about a fund becoming a higher risk rating than the one originally invested in.
Warning: The value of your investment may go down as well as up.
Warning: These funds may be affected by changes in currency exchange rates.
Warning: If you invest in these funds you may lose some or all of the money you invest.
Warning: These figures are estimates only. They are not a reliable guide to future performance.
We start with this pie chart, which shows a fund with 50% in shares, 25% in bonds and 25% in other assets/external managers.
If, over the course of a year, shares grew in value by 20%, while bonds and other assets/external managers both fell in value by 10%, then, without rebalancing, the second pie chart shows the new split of the fund. Here, 57% of the fund is now invested in shares.
If the same thing happened again, we would end up with nearly two-thirds of the fund invested in shares. This fund mix may no longer be suitable for someone who originally chose an allocation of 50% in shares, 25% in bonds and 25% in cash.
64%
18%
18%
57%
21.5%
21.5%
50%
25%
25%
RISK MANAGEMENT STRATEGIES
11
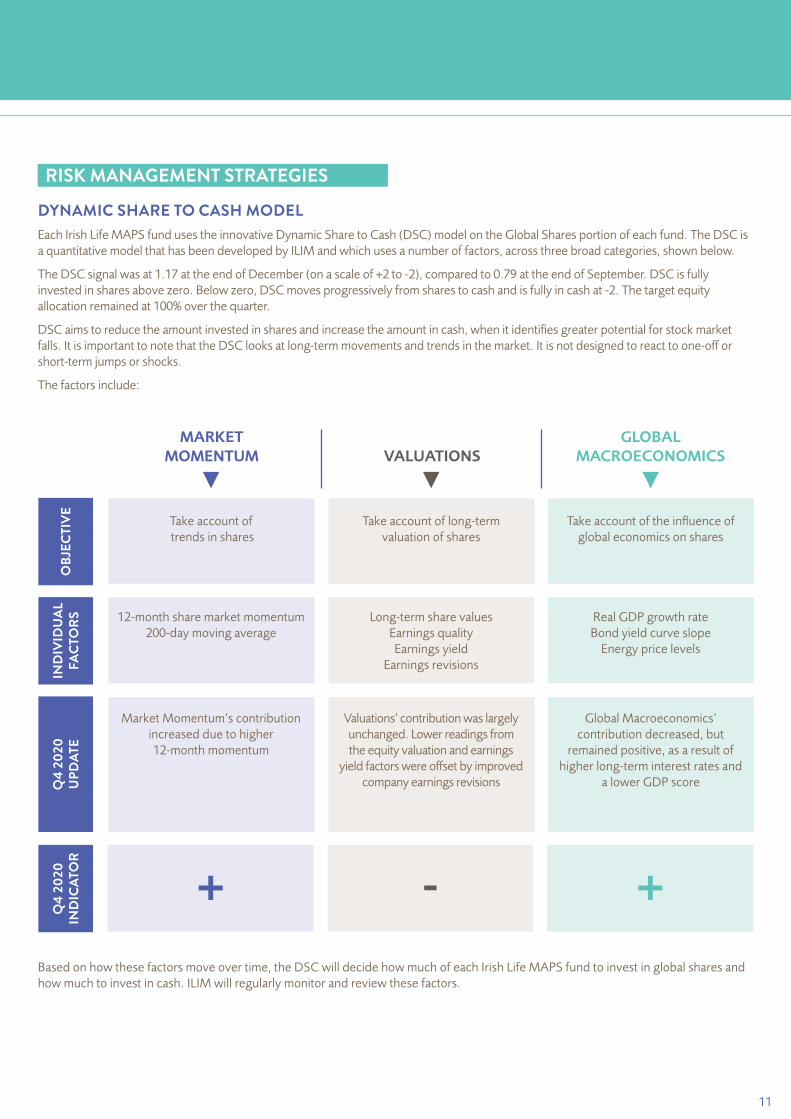
Each Irish Life MAPS fund uses the innovative Dynamic Share to Cash (DSC) model on the Global Shares portion of each fund. The DSC is a quantitative model that has been developed by ILIM and which uses a number of factors, across three broad categories, shown below.
The DSC signal was at 1.17 at the end of December (on a scale of +2 to -2), compared to 0.79 at the end of September. DSC is fully invested in shares above zero. Below zero, DSC moves progressively from shares to cash and is fully in cash at -2. The target equity allocation remained at 100% over the quarter.
DSC aims to reduce the amount invested in shares and increase the amount in cash, when it identifies greater potential for stock market falls. It is important to note that the DSC looks at long-term movements and trends in the market. It is not designed to react to one-off or short-term jumps or shocks.
The factors include:
MARKET MOMENTUM VALUATIONS
GLOBAL MACROECONOMICS
Take account of trends in shares
Take account of long-term valuation of shares
Take account of the influence of global economics on shares
12-month share market momentum 200-day moving average
Long-term share values Earnings quality Earnings yield
Earnings revisions
Real GDP growth rate Bond yield curve slope
Energy price levels
OBJ
ECTI
VEIN
DIV
IDU
AL
FACT
ORS
Market Momentum’s contribution increased due to higher 12-month momentum
Global Macroeconomics’ contribution decreased, but
remained positive, as a result of higher long-term interest rates and
a lower GDP scoreQ4
2020
U
PDAT
EQ
4 20
20
IND
ICAT
OR
+ +-
Based on how these factors move over time, the DSC will decide how much of each Irish Life MAPS fund to invest in global shares and how much to invest in cash. ILIM will regularly monitor and review these factors.
DYNAMIC SHARE TO CASH MODEL
Valuations’ contribution was largely unchanged. Lower readings from the equity valuation and earnings
yield factors were offset by improved company earnings revisions
RISK MANAGEMENT STRATEGIES

12
STRATEGY
HOW IT WORKS
KEY BENEFITS
The strategy aims to reduce the risk of experiencing negative returns from foreign currency moves. This is achieved by hedging non-euro currency exposure when it is beneficial to do so.
ILIM uses a systematic approach to identify key factors (valuations, market momentum, etc) that, when combined, aim to indicate when it is beneficial to hedge foreign currency exposure.
This strategy aims to reduce the volatility of the returns in shares, reduce the potential losses from negative moves in foreign currency and reduce peak-to-trough losses over time.
ILIM manages the risk of exposure to foreign currencies in Irish Life MAPS by partly hedging any exposure. This risk-management process was further enhanced in 2018 by the development of a systematic currency-hedging process. This operates on each of the Irish Life MAP funds.
CURRENCY HEDGING
FOR GLOBAL LOW VOLATILITY SHARES SEE PAGE 14
FOR OPTION STRATEGY SEE PAGE 15
RISK MANAGEMENT STRATEGIES

13
WHAT DOES IRISH LIFE MAPS INVEST IN?ASSET CLASSES EXPLAINED

14
1 SHARESASSET CLASSES EXPLAINED
GLOBAL SHARESILIM tracks the performance of a large, customised, responsible investment (that uses an Environmental, Social and Governance or ESG framework) Global Share index that has enhanced sustainability characteristics. This index aims to have a more positive impact on the environment and society compared to a standard index.
There are over 2,400 individual company shares represented, operating in 11 different sectors. We use the DSC model (explained on page 11) on global shares. Global Shares includes c.10% in Emerging Market Shares.
For the percentage of global shares in each Irish Life MAPS fund, see the latest factsheet on www.irishlife.ie.
The geographic split of the index is illustrated below:
USA 57.3%France 3.0%
UK 3.7%
China 5.2%
Japan 6.8%
Others 24.0%
GLOBAL LOW VOLATILITY SHARES Using a detailed, quantitative strategy, ILIM chooses shares
from a broad global share index which not only have shown lower volatility in the past, but which are also screened for other indicators, such as value, momentum, etc. There is also an additional ESG (Environmental, Social and Governance) focus.
ILIM chooses over 200 shares to make up the Low Volatility Shares fund.
For the percentage of Low Volatility Shares in each Irish Life MAPS fund, see the latest factsheet on www.irishlife.ie.
Financials -4.2%
Information Technology -5.1%
Industrials -1.4%
Consumer Discretionary -4.8%
Materials -0.2%
Telecommunication Services 4.0%
Real Estate 0.7%
Energy -0.3%
Utilities 2.2%
Consumer Staples 4.7%
Healthcare 3.9%
RISK MANAGEMENT STRATEGIES Industry active weight versus MSCI ACWI
Warning: If you invest in these funds you may lose some or all of the money you invest.
Warning: The value of your investment may go down as well as up.
Warning: These funds may be affected by changes in currency exchange rates.
15
INFRASTRUCTURE SHARES ILIM tracks the performance of a large global infrastructure shares index. There are 100 individual company shares represented, investing in sectors such as airports, toll roads, railways, ports, water, gas and
many others. These infrastructure shares come mainly from developed market economies, but also some emerging markets.
For the percentage of infrastructure shares in each Irish Life MAPS fund, see the latest factsheet on www.irishlife.ie.
The geographic split of the index is illustrated below:
Canada 13.9%
USA 47.5%France 5.7%
Switzerland 4.8%UK 6.7%
China 3.3%
Japan 1.8%
Others 2.7%
Mexico 0.9%
Spain 6.5% Italy 3.8%
Hong Kong 2.4%
Australia 4.9%
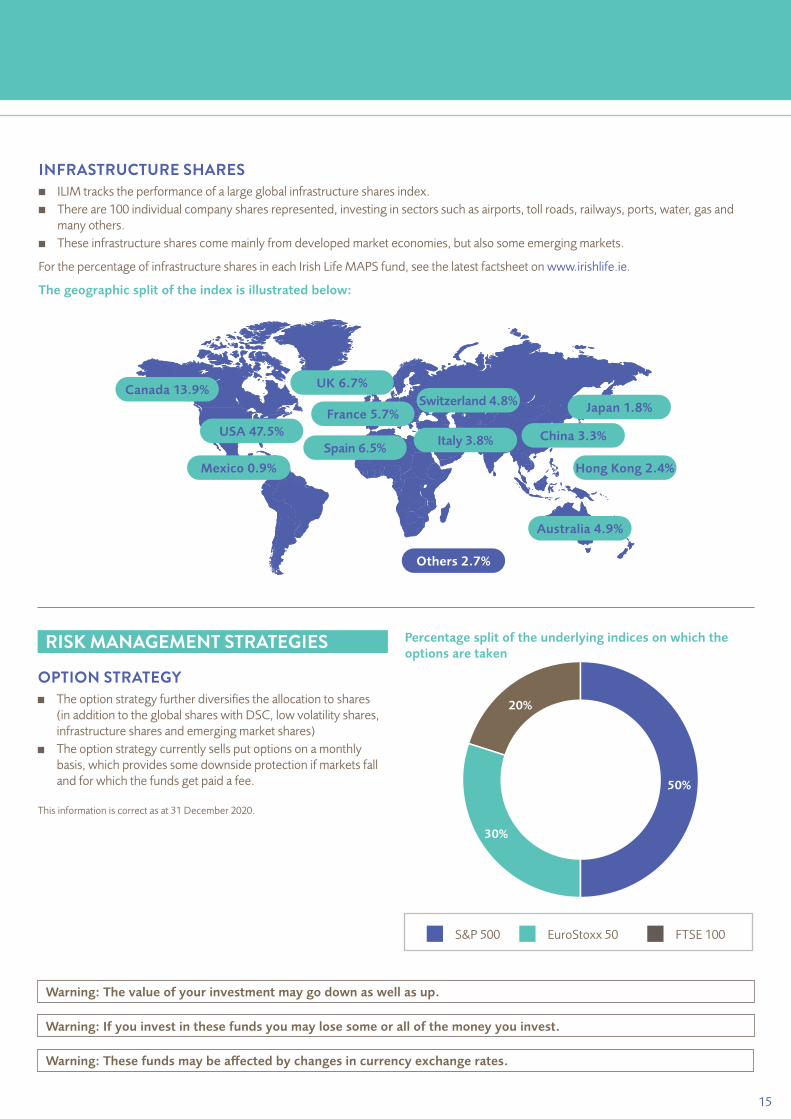
OPTION STRATEGY The option strategy further diversifies the allocation to shares
(in addition to the global shares with DSC, low volatility shares, infrastructure shares and emerging market shares)
The option strategy currently sells put options on a monthly basis, which provides some downside protection if markets fall and for which the funds get paid a fee.
This information is correct as at 31 December 2020.
Warning: The value of your investment may go down as well as up.
Warning: If you invest in these funds you may lose some or all of the money you invest.
Warning: These funds may be affected by changes in currency exchange rates.
Percentage split of the underlying indices on which the options are taken
50%
30%
20%
S&P 500 EuroStoxx 50 FTSE 100
RISK MANAGEMENT STRATEGIES

16
EMERGING-MARKET SHARESILIM tracks the performance of a broad emerging markets share index to provide exposure to emerging market shares.
Emerging market shares include over 1,400 individual companies which operate in 26 different markets.
For the percentage of emerging-market shares in each Irish Life MAPS fund, see the latest factsheet on www.irishlife.ie.
The geographic split of the index is illustrated below:
China 39.1%
South Korea 13.5%
Others 20.3%
Brazil 5.1%
India 9.2%Taiwan 12.8%
Emerging-market shares include over
1,400individual companies,
operating in
26different markets
Warning: The value of your investment may go down as well as up.
Warning: If you invest in these funds you may lose some or all of the money you invest.
Warning: These funds may be affected by changes in currency exchange rates.
This information is correct as at 31 December 2020.

17
2 BONDSASSET CLASSES EXPLAINED
GOVERNMENT BONDS ILIM currently tracks the performance of a recognised and
leading government bond index to provide exposure to shorter-dated government bonds.
Within the bond allocation, ILIM chooses the proportion to invest in government bonds and has discretion in relation to the index that is tracked.
The geographic split of the index is illustrated below:
CORPORATE BONDS ILIM currently tracks the performance of a recognised
and leading corporate bond index to provide exposure to corporate bonds.
Within the bond allocation, ILIM chooses the proportion to invest in corporate bonds and has discretion in relation to the index that is tracked.
The sector split of the index is illustrated below.
Sector Weight (%)
Automotive 6.1Banking 24.3Basic Industry 4.4Capital Goods 3.5Consumer Goods 6.2Energy 5.9Financial Services 5.8Healthcare 6.8Insurance 4.5Leisure 0.2Media 1.0Real Estate 4.7Retail 1.9Services 1.4Technology & Electronics 3.4Telecommunications 6.5Transportation 4.4Utility 8.8
This information is correct as at 31 December 2020.
Warning: The value of your investment may go down as well as up.
Warning: If you invest in these funds you may lose some or all of the money you invest.
Warning: These funds may be affected by changes in currency exchange rates.
Country Weight (%)
France 23.3Italy 24.6Germany 19.9Spain 13.5Belgium 4.1Netherlands 4.4Austria 3.4Portugal 2.3Ireland 1.7Other 2.7

18
EMERGING-MARKET DEBT ILIM currently tracks the performance of recognised and leading emerging-market bond indices, both local and hard currency
(denominated in US dollars), to provide exposure to emerging-market bonds. Within the bond allocation, ILIM chooses the proportion to invest in emerging-market bonds and has discretion in relation to the
indices which are tracked.
The geographic split of the index is illustrated below.
HIGH YIELD BONDS ILIM tracks the performance of a recognised and leading high-yield bond index to provide exposure to global high-yield bonds. The high-yield bond allocation is currently sub-advised by an external manager.
The geographic split of the index is illustrated below.
Country Weight (%)
Brazil 8.4Chile 2.7China 10.0Colombia 5.6Czech Republic 3.8Hungary 4.0Indonesia 9.5Mexico 9.4Dominican Republic 0.2Malaysia 6.9
Others 3.8%
USA 71.3%
UK 3.0%
Italy 4.2%
Canada 3.6%
France 4.8%
Luxembourg 1.5%Germany 2.9%
Netherlands 2.0%
Ireland 1.4%
Spain 1.6%
This information is correct as at 31 December 2020.
Warning: The value of your investment may go down as well as up.
Warning: If you invest in these funds you may lose some or all of the money you invest.
Warning: These funds may be affected by changes in currency exchange rates.
Country Weight (%)
Peru 2.8Philippines 0.2Poland 8.1Romania 3.1Russia 7.4Thailand 8.6Turkey 1.9Uruguay 0.1South Africa 7.6

19
3 EXTERNAL MANAGERS/ALTERNATIVESASSET CLASSES EXPLAINED
ILIM recognises the need to incorporate alternative strategies within the Irish Life MAPS funds and has an active pipeline of external managers that are monitored on an ongoing basis. Blackrock Style Advantage was fully redeemed during quarter four, with the proceeds redistributed across the External/Alternatives portfolio.
There is currently access to eight leading managers and 11 individual fund mandates within each Irish Life MAPS fund’s External Managers/Alternatives allocation. The percentage allocated to External Managers/Alternatives varies for each Irish Life MAPS fund and can be found on the latest factsheet, at www.irishlife.ie. Within this percentage, the target split across the nine managers is shown, as well as details of the managers themselves, along with the funds invested in.
ILIM actively looks for managers that can bring diverse performance, at the right price. ILIM monitors this performance on an ongoing basis and may choose to change the allocation to External Managers, or the target allocation within the External Manager allocation. ILIM may also choose to replace, add or remove External Managers as opportunities arise and market conditions change. ESG (Environmental, Social and Governance) factors are now also included as part of ILIM’s initial and ongoing due diligence process.
Managers Assets managed Fund names
GMOSource www.gmo.com
$60.6 billion(30 November 2020)
GMO Real Return FundSystematic Global Markets (SGM) Fund
PutnamSource www.putnam.com
$188 billion(30 November 2020)
Putnam Multi Asset AbsoluteReturn Strategy (MAARS)Putnam Securitised Credit Fund
AQRSource www.aqr.com
$143 billion(30 September 2020)
AQR Global Risk ParityAQR Style Premia
Dunn Capital ManagementSource www.montlakeucits.com
$1.0 billion(31 December 2020)
Montlake Dunn WMA
MidOceanSource www.midoceanpartners.com
$7.8 billion(30 June 2020)
DB Platinum MidOcean Fund
RamiusSource www.ramius.com
$604 million(31 March 2020)
Ramius Merger Arbitrage Fund
RenaissanceRe Source www.renre.com
$10.9 billion (30 September 2020)
RenRe Medici Fund
LGT ILS Partners $60 billion(31 December 2020)
LGT ILS Cat Bonds Fund
Greencoat Renewables Plc. Source www.lgtcp.com
$864 billion*(31 December 2020)
Greencoat Renewables Plc.
*Market Capitalisation

20
4 PROPERTYASSET CLASSES EXPLAINED
Each Irish Life MAPS fund currently invests in commercial property through an allocation in ILIM’s Pension Property fund, in the form of offices, retail and industrial property. You can see the split between these areas and the funds’ top five holdings below. Other information on this part of the property allocation at the end of December 2020 is also shown below.
ILIM also added extra property diversification through a small exposure to residential property via an investment in the Private Rented Sector (PRS). More broadly, and as part of ILIM’s commitment to responsible investing and sustainability, we have also started integrating ESG (Environmental, Social and Governance) considerations into the MAPS property allocation. The industry standard is the GRESB (Global Real Estate Sustainability Benchmark), against which ILIM was awarded four stars in 2020.
INDUSTRIAL
6.0%RETAIL
21.0%OFFICES
73.0%
TOP
HOLDINGS5
1 2 Grand Canal Square, Dublin
2 1 Georges Quay, Dublin
3 13-18 City Quay, Dublin
4 24-26 City Quay, Dublin
5 Stephen Court, St Stephens Green, Dublin
The information is correct as at 31 December 2020. For the percentage of property invested in each MAP Fund, please see the factsheet on www.irishlife.ie.
OVER 7O INDIVIDUAL PROPERTY ASSETS
LEASED TO OVER 300 TENANTS
BROAD MIX OF COMMERCIAL PROPERTY – WITH EXPOSURE TO OFFICES, RETAIL
AND INDUSTRIAL PROPERTIES
€1.6 bnTOTAL VALUE OF PROPERTY FUND
Warning: The value of your investment may go down as well as up.
Warning: If you invest in these funds you may lose some or all of the money you invest.
Warning: These funds may be affected by changes in currency exchange rates.
21
ILIM’S CREDENTIALS
22
ILIM’S CREDENTIALS
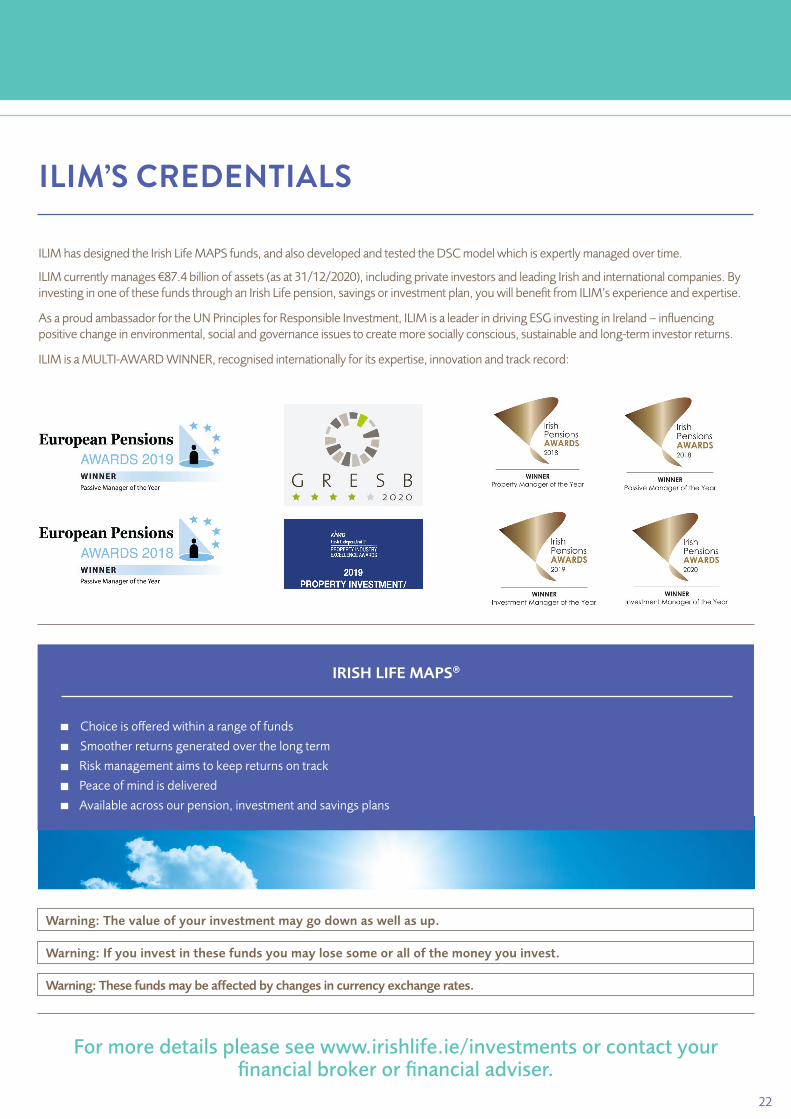
ILIM has designed the Irish Life MAPS funds, and also developed and tested the DSC model which is expertly managed over time.
ILIM currently manages €87.4 billion of assets (as at 31/12/2020), including private investors and leading Irish and international companies. By investing in one of these funds through an Irish Life pension, savings or investment plan, you will benefit from ILIM’s experience and expertise.
As a proud ambassador for the UN Principles for Responsible Investment, ILIM is a leader in driving ESG investing in Ireland – influencing positive change in environmental, social and governance issues to create more socially conscious, sustainable and long-term investor returns.
ILIM is a MULTI-AWARD WINNER, recognised internationally for its expertise, innovation and track record:
IRISH LIFE MAPS®
Warning: The value of your investment may go down as well as up.
Warning: If you invest in these funds you may lose some or all of the money you invest.
Warning: These funds may be affected by changes in currency exchange rates.
For more details please see www.irishlife.ie/investments or contact your financial broker or financial adviser.
Choice is offered within a range of funds
Smoother returns generated over the long term
Risk management aims to keep returns on track
Peace of mind is delivered
Available across our pension, investment and savings plans


Irish Life Investment Managers Limited is regulated by the Central Bank of Ireland.Irish Life Assurance plc is regulated by the Central Bank of Ireland.
ILA 10636 (REV 12-20)