Embed Size (px)
Citation preview
Abstract Whiplash associated disorders (WAD) resulting from rear‐end collisions continue to be a major
concern. This case‐control study is aimed at identifying possible predictors for WAD claims from struck car
occupants using EDR (event data recorder) and insurance data. It made use of the first large‐scale EDR dataset
available in Switzerland. Through analysis of 168 real‐world collisions, calculated crash severity metrics, such as
change of velocity (delta‐v) and mean acceleration, were compared to medical data. The data was separated
into a WAD and a control group. It was shown that the delta‐v and the mean acceleration differed significantly
for the two groups. A corresponding risk curve confirmed an increase in injury risk for higher crash severity.
Mean acceleration was found to be a slightly better predictor for WAD risk than delta‐v. No association was
found between crash severity measures and the QTF score (severity score according to Quebec Task Force). Sick
leave duration did, however, correlate with impact severity, while it did not correlate with the QTF code. The
study confirms previous research in the field by highlighting the link between impact severity and WAD risk.
However, the QTF score seems to be of limited use for WAD claims management.
Keywords Delta‐v, event data recorder, EDR, whiplash associated disorders, WAD.
I. INTRODUCTION
Whiplash associated disorders (WAD) are a major burden in Switzerland, as elsewhere. More than 10,000
cases of WAD after a rear‐end collision are reported every year to the Swiss insurance industry. The yearly
direct costs arising from these cases amount to several hundred million Swiss Francs [1‐2]. About 10% of these
cases tend towards chronification [3], putting the affected persons at a high risk of long‐term sick leave, i.e. a
sick leave of more than 30 consecutive days [4].
In the literature, the change of velocity of a vehicle during an impact (delta‐v) is regarded as a relevant
parameter to assess the WAD risk. It is a metric that describes the crash severity of an impact. As it can be
estimated through classical accident reconstruction approaches (without event data recorder data), it is well
established and widely used in claims management in the insurance industry, as well as in court hearings.
Although there is a debate as to whether other parameters, like the mean acceleration during an impact, might
be better predictors for the WAD risk, currently delta‐v remains the main crash severity parameter for assessing
the WAD risk. Several studies have shown a correlation between delta‐v levels and the risk of sustaining neck
injury [5‐6]. WAD symptoms were found to last longer with higher delta‐v values [5]. Injury thresholds range
from 8 to 15 km/h [7]. Niederer et al. stated that WAD symptoms cannot be explained by biomechanics when
delta‐v is lower than 10 km/h [8]. In Switzerland, this delta‐v threshold for the onset of WAD is widely accepted
today.
More recently, event data recorders (EDR) are available and used in larger vehicle fleets. These devices allow
the impact to be recorded in terms of acceleration. As a result, not only delta‐v but also impact time and mean
acceleration during impact can be precisely determined from EDR. Such devices allow for the investigation of
different hypotheses on the basis of actual crash data. Various studies, conducted mainly in Sweden, have
*B. Jordan (e‐mail: bruno.jordan@axa‐winterthur.ch; phone: +41 58 215 27 44) is Research Engineer in the Accident Research division, D. Bützer was a Master‐Student and B. Zahnd is head of the Accident Research division, all at AXA Winterthur Insurances, Switzerland. K.‐U. Schmitt is senior lecturer at the Swiss Federal Institute of Technology ETH and works at AGU Zurich.
Analysis of whiplash associated disorder claims using real‐world data retrieved from event data recorders: a case‐control study
B. Jordan, K.U. Schmitt, D. Bützer, B. Zahnd*
IRC-16-21 IRCOBI Conference 2016
- 89 -
researched the correlation between EDR data and medical consequences. The impact time was found to have
an effect on injury risk, and the mean acceleration to be the main factor influencing the risk of neck injuries [9].
The AXA Winterthur Insurance Company in Switzerland launched an EDR (called Crash Recorder) in 2008. This
allows complementing previous works by making use of the first large‐scale EDR dataset available in
Switzerland. While previous studies related to WAD were often limited to a specific vehicle type or make, a
larger variety of vehicles is equipped with the Crash Recorder. Today, a fleet of over 40,000 vehicles is equipped
with the Crash Recorder by AXA Winterthur.
Kullgren et al. showed that the injury risk in rear‐end collisions increases with higher delta‐v. The same is true
for mean acceleration [5]. The impact time also appears to be important. Linder et al. stated that the injury risk
for a given change of velocity is increased for shorter duration of the crash pulse [9]. Based on collision analysis,
the delta‐v of the struck car decreases with an increasing mass ratio of the struck vs. the striking car [10].
Moreover, the automotive industry has successfully developed whiplash protection systems [11], mostly
implemented in the car seats. Older cars are not fitted with whiplash protection systems, however. Finally,
Kullgren et al. pointed out that, in a review of 13 studies, females seem to have a higher relative whiplash injury
risk than males [12].
To classify the severity of WAD, the Quebec Task Force (QTF) developed a specific scheme, the so‐called QTF
score [7]. The QTF score ranges from QTF0 to QTF4. Krafft et al. found a correlation between QTF scores and
crash severity measured as delta‐v and mean acceleration [13]. However, Krafft et al. found no significant
correlation between different grades of WAD and crash severity in a study conducted few years before [14].
Krafft et al. and Kullgren et al. found correlations between crash severity, measured in terms of delta‐v and
mean acceleration, and the duration of symptoms [5][13]. Kullgren et al. reported average delta‐v values of 8.8
km/h for uninjured females and 9.2 km/h for uninjured males. For injured occupants with symptoms lasting less
than one month, they reported mean delta‐v values of 11.3 km/h for females and 12.6 km/h for males. For
occupants with symptoms lasting longer than one month, they reported values of 17.8 km/h [5]. Compared to
males, female occupants were found to have a double risk of symptoms lasting longer than one month [12].
Linder et al. found that passengers are more likely to suffer neck pain symptoms than drivers [15]. On the other
hand, Jonsson et al. found a double relative risk for drivers compared to front‐seat passengers [16]. Another
study by Schmitt et al. showed that symptoms were significantly influenced by the patient’s medical history
considering pre‐existing damage of the neck or pre‐existing symptoms [6]. Furthermore, increasing age of struck
car occupants was associated with slower recovery [17].
The aim of this study was to analyse several outcome variables with regard to WAD claimed by struck car
occupants in rear‐end collisions. Specifically, the following hypotheses were addressed: the delta‐v and the
mean acceleration of the struck car have a positive effect on the occurrence of initial WAD symptoms, on the
QTF score and on the sick leave duration. The impact time of the struck car is negatively associated with the
occurrence of initial WAD symptoms, while the age of the struck car is positively associated with it.
Furthermore, it was expected to find that females are more likely to suffer from initial WAD symptoms and also
have a longer average sick leave duration than males. The increased mass ratio of the struck vs. the striking car
was assumed to reduce the risk for the struck car occupants of having initial WAD symptoms. It was also
expected to find a longer sick leave duration for occupants who suffered from previous complaints and a longer
sick leave duration for occupants showing initial neurological symptoms. Further, it was expected that the QTF
score is positively associated with the sick leave duration.
II. METHODS
Data and selection criteria
Crash Recorder, medical, insurance claims and insurance risks data were provided by AXA Winterthur
Insurances, Switzerland. To identify the relevant cases, the following selection criteria were applied: only cars
and light commercial vehicles were included; the collisions had to be rear‐end collisions, as defined by the Swiss
federal roads office (FEDRO) [18], therefore both vehicles had to be oriented in the same direction during the
collision; crashes with reversing vehicles were excluded; maximal collision angles of 30 degrees were accepted;
the car‐to‐car overlap was limited to a minimum of 10%; in collisions with more than two vehicles, the struck
IRC-16-21 IRCOBI Conference 2016
- 90 -
car had to experience a major rear impact followed by a minor front impact; only motor liability cases were
analysed, which means that the client of AXA Winterthur was in the striking car of the analysed collision. The
occupants of the struck car, in contrast, can be clients of any insurance company. Hence, the sample of struck
car occupants is not influenced by the Crash Recorder sales strategy of AXA Winterthur. As a consequence, the
sample of struck car occupants is random and thus represents the whole car and light commercial vehicle
driving population of Switzerland in a good approximation. In this study, only the data of drivers and front‐seat
passengers were included; rear‐seat occupants were excluded. Cases of established fraud were specifically
analysed and excluded in terms of sick leave duration. All cases occurred between 2008 and 2014. The WAD
group was defined as follows: cases where either initial neck pain or a QTF score greater than 0 was reported
were regarded as WAD cases; cases in which occupants did not complain about WAD symptoms built the
control group.
Accident Reconstruction
The AXA Crash Recorder is an autonomous event data recorder (EDR). The key feature of the device is a linear
acceleration sensor, which is able to record acceleration data in three axes up to 50 g (g = acceleration of
gravity, 1 g = 9.81 m/s2). When an internal threshold level for an incident is exceeded, the Crash Recorder saves
crash data with a measurement frequency of 1,000 Hz. The internal threshold level is set at approximately 1 g,
which ensures that minor impacts are also recorded. The measured acceleration data has a maximal error of
10%. Comparing to reference devices according to the SAE J211 technical standard (SAE International), the
Crash Recorder differs between 3% and 5% in the acceleration signal [19]. The software Python(x,y) (Version
2.7.3.1) was used to analyse and display the Crash Recorder data. The data was filtered by the common Channel
Frequency Class (CFC) 60 low‐pass filter [20]. The impact time was defined as the duration of the EDR crash
pulse, according to Linder et al. [9]. Delta‐v, mean acceleration and the impact time were then calculated for
every case. In most cases, however, Crash Recorder data was only available for the striking car, while in all cases
the persons to analyse regarding WAD‐claims sat in the struck car. Consequently, the delta‐v of the struck
vehicle was determined by standard means of accident reconstruction which are based on the conservation of
energy and momentum. In this study, methods as described by Burg et al. were applied [10]. The methodology
was evaluated by using the internal crash test database of AXA. 185 crash tests were selected by applying the
same selection criteria as above. The selected crash tests represent the braking conditions of real‐world
collisions, which are statistically known from the AXA Crash Recorder database where additional data is
available for striking and struck cars. For the struck vehicles, the calculated delta‐v was compared to measured
delta‐v values for all crashes. The mean error over all crash tests was 5.9 %, the corresponding standard
deviation was +/‐ 5.3%. The errors were also analysed for different braking conditions of the struck car. For
unbraked struck cars, the mean error was 5.8% (+/‐ 5.1%, n = 174). For braked struck cars, the mean error was
8.6% (+/‐ 6.6 %, n = 11). Furthermore, no bias was detected and the distribution of the error followed a normal
distribution. However, in the real‐world collisions, the braking condition of the struck car was not known in
many cases. In these cases, the braking condition was assessed based on expert opinions and statistical
information from the AXA Crash Recorder database. The mean acceleration for the struck car was then
calculated as delta‐v of the struck car, divided by the impact time. Thus, all WAD analyses in this study refer to
the calculated crash severity of the struck car.
Medical outcome
Except for sick leave, all information about the occupants and the medical conditions were extracted from the
“documentary file for the first consultation after a cranio‐cervical acceleration trauma” [21]. This medical form
was introduced in Switzerland in 2003, by the Swiss Insurance Association, with the goal of standardising
medical reporting for WAD cases. Only medical doctors are allowed to fill in this questionnaire. In this
standardised form, based on the first physical examination after the collision, the doctor reports the medical
findings of the WAD patient and provides also the QTF score according to the QTF definitions [21]. In a standard
claims management process, the file should be available to the insurance company within one month after the
collision. If no such file was available, as much information as possible was extracted from other medical reports
written by medical doctors. If no medical report was available, only initial complaints, such as neck pain or
IRC-16-21 IRCOBI Conference 2016
- 91 -
headache, reported by the struck car occupant were considered. Sick leave was not directly extracted from the
“documentary file for the first consultation after a cranio‐cervical acceleration trauma”, but from other medical
documents that confirmed the sick leave duration. In this study, sick leave duration is defined as the time span
in which a person is absent from paid work due to medical problems. Furthermore, sick leave had to be caused
by WAD symptoms. According to this, it was assumed that the WAD symptoms were present at least until the
sick leave duration ended. Hence the sick leave duration can be compared to duration of symptoms from other
studies. Sick leave was split into two durations: 100% sick leave duration and total sick leave duration. 100% sick
leave duration describes for the length of time during which the occupant could not work at all. Total sick leave
duration was composed out of the 100% sick leave duration plus the sick leave duration when the occupant
could work, but could not fulfil the total workload. Struck car occupants who had a workload of 0% before the
collision were excluded in terms of sick leave. The quality of the medical forms was checked. Medical reports
were accepted in this study and regarded as valid as long as no other information available in the insurance file
disproved this validity. Every report in this study was verified in this sense.
Statistics
The data was analysed by means of the statistics software R Studio (Version 0.98.1102) and Microsoft Excel
(2010). Assumptions for parametric and non‐parametric statistical tests were verified. T‐test (t), Mann‐Whitney
(W) and Chi‐squared (Χ²) tests were used to compare groups with a 5% significance level. Thereby, 95%
confidence intervals (CI) and standard errors (SE) were calculated for the estimated parameters. Mean (M),
standard deviation (SD) and median (Mdn) were calculated. Risk, such as the WAD risk and the risk of sick leave,
was calculated as the proportion of number of suffering from WAD over the total number of occupants in the
corresponding delta‐v group. This procedure was adapted from Kullgren et al. [5] and therefore intervals with
less than three observations were excluded and no mathematical function was used, simply a scatterplot with
interpolated lines in Microsoft Excel [5].
III. RESULTS
Description of the sample
In this study, a total of 168 real‐world rear‐end collisions were analysed. From 62 of these collisions, a total of
66 persons reported initial WAD symptoms, which formed the WAD group. In 106 collisions, no WAD symptoms
were reported. These cases formed the control group.
The mean age of the striking cars was 8.3 years (SD=5.7, N=168) and the mean of the struck cars was 7.1
years (SD=5.2, N=162). Mean masses were 1231.7 kg (SD=244.5, N=168) for the striking cars and 1430.4 kg
(SD=313.1, N=168) for the struck cars.
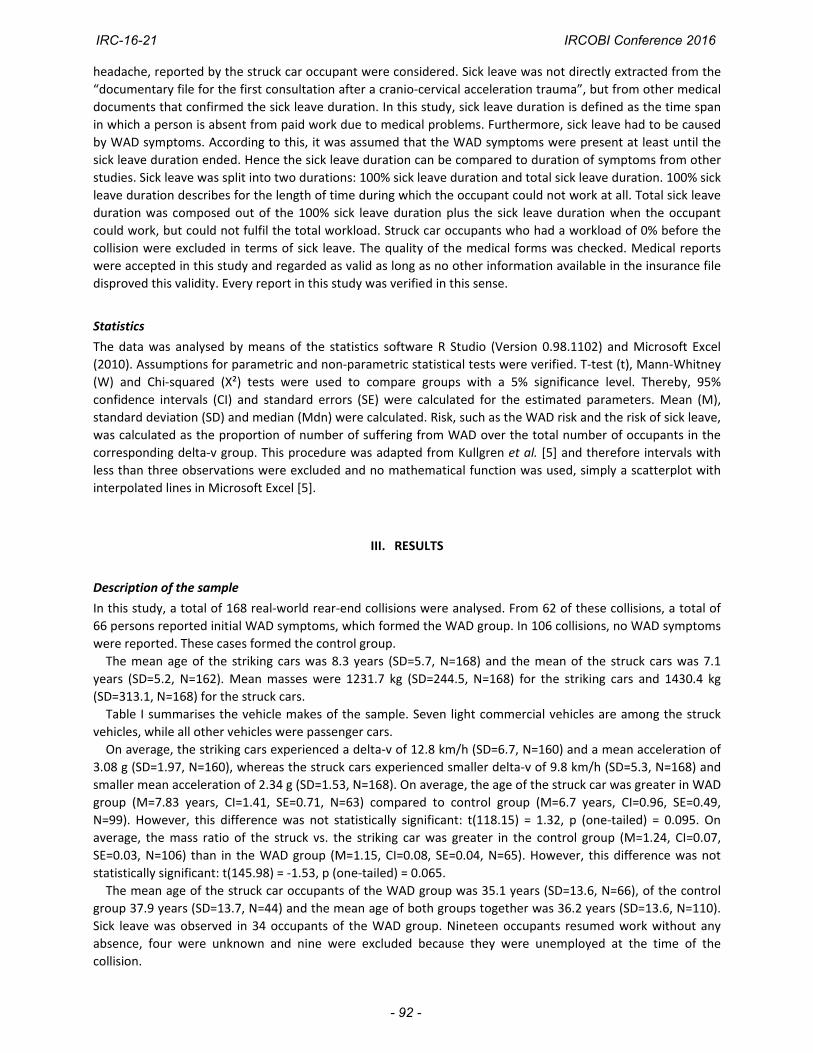
Table I summarises the vehicle makes of the sample. Seven light commercial vehicles are among the struck
vehicles, while all other vehicles were passenger cars.
On average, the striking cars experienced a delta‐v of 12.8 km/h (SD=6.7, N=160) and a mean acceleration of
3.08 g (SD=1.97, N=160), whereas the struck cars experienced smaller delta‐v of 9.8 km/h (SD=5.3, N=168) and
smaller mean acceleration of 2.34 g (SD=1.53, N=168). On average, the age of the struck car was greater in WAD
group (M=7.83 years, CI=1.41, SE=0.71, N=63) compared to control group (M=6.7 years, CI=0.96, SE=0.49,
N=99). However, this difference was not statistically significant: t(118.15) = 1.32, p (one‐tailed) = 0.095. On
average, the mass ratio of the struck vs. the striking car was greater in the control group (M=1.24, CI=0.07,
SE=0.03, N=106) than in the WAD group (M=1.15, CI=0.08, SE=0.04, N=65). However, this difference was not
statistically significant: t(145.98) = ‐1.53, p (one‐tailed) = 0.065.
The mean age of the struck car occupants of the WAD group was 35.1 years (SD=13.6, N=66), of the control
group 37.9 years (SD=13.7, N=44) and the mean age of both groups together was 36.2 years (SD=13.6, N=110).
Sick leave was observed in 34 occupants of the WAD group. Nineteen occupants resumed work without any
absence, four were unknown and nine were excluded because they were unemployed at the time of the
collision.
IRC-16-21 IRCOBI Conference 2016
- 92 -
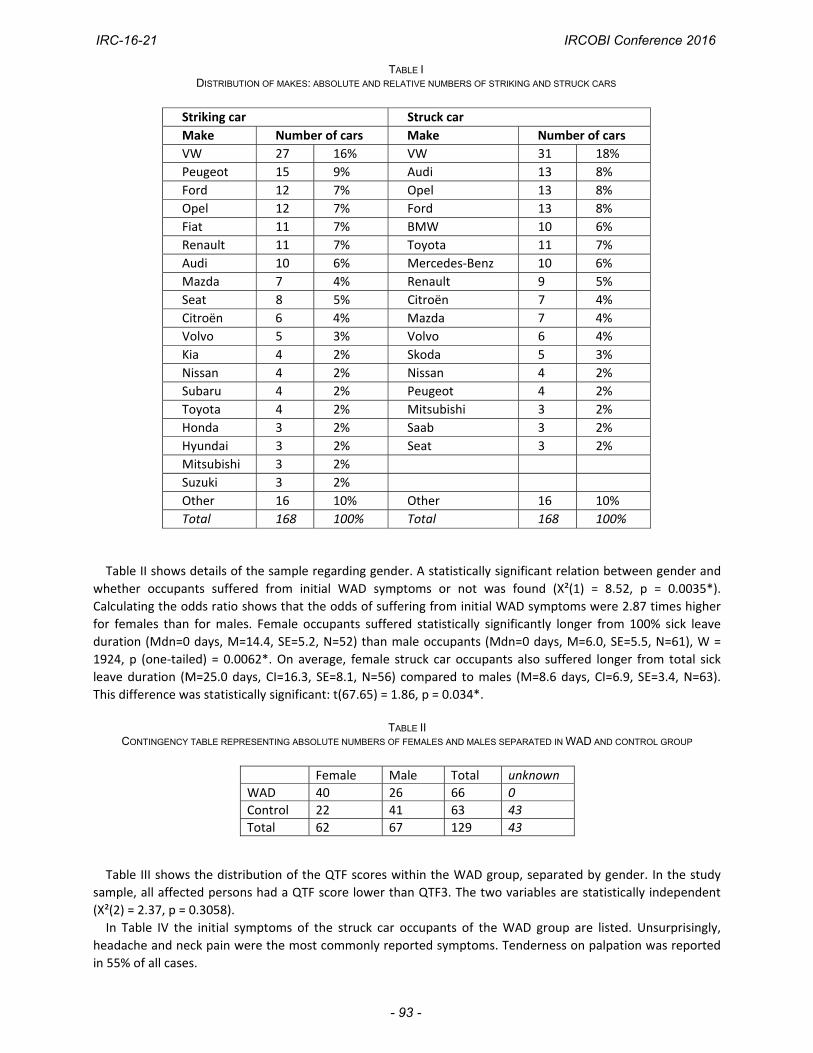
TABLE I DISTRIBUTION OF MAKES: ABSOLUTE AND RELATIVE NUMBERS OF STRIKING AND STRUCK CARS
Striking car Struck car
Make Number of cars Make Number of cars
VW 27 16% VW 31 18%
Peugeot 15 9% Audi 13 8%
Ford 12 7% Opel 13 8%
Opel 12 7% Ford 13 8%
Fiat 11 7% BMW 10 6%
Renault 11 7% Toyota 11 7%
Audi 10 6% Mercedes‐Benz 10 6%
Mazda 7 4% Renault 9 5%
Seat 8 5% Citroën 7 4%
Citroën 6 4% Mazda 7 4%
Volvo 5 3% Volvo 6 4%
Kia 4 2% Skoda 5 3%
Nissan 4 2% Nissan 4 2%
Subaru 4 2% Peugeot 4 2%
Toyota 4 2% Mitsubishi 3 2%
Honda 3 2% Saab 3 2%
Hyundai 3 2% Seat 3 2%
Mitsubishi 3 2%
Suzuki 3 2%
Other 16 10% Other 16 10%
Total 168 100% Total 168 100%
Table II shows details of the sample regarding gender. A statistically significant relation between gender and
whether occupants suffered from initial WAD symptoms or not was found (Χ²(1) = 8.52, p = 0.0035*).
Calculating the odds ratio shows that the odds of suffering from initial WAD symptoms were 2.87 times higher
for females than for males. Female occupants suffered statistically significantly longer from 100% sick leave
duration (Mdn=0 days, M=14.4, SE=5.2, N=52) than male occupants (Mdn=0 days, M=6.0, SE=5.5, N=61), W =
1924, p (one‐tailed) = 0.0062*. On average, female struck car occupants also suffered longer from total sick
leave duration (M=25.0 days, CI=16.3, SE=8.1, N=56) compared to males (M=8.6 days, CI=6.9, SE=3.4, N=63).
This difference was statistically significant: t(67.65) = 1.86, p = 0.034*.
TABLE II
CONTINGENCY TABLE REPRESENTING ABSOLUTE NUMBERS OF FEMALES AND MALES SEPARATED IN WAD AND CONTROL GROUP
Table III shows the distribution of the QTF scores within the WAD group, separated by gender. In the study
sample, all affected persons had a QTF score lower than QTF3. The two variables are statistically independent
(Χ²(2) = 2.37, p = 0.3058).
In Table IV the initial symptoms of the struck car occupants of the WAD group are listed. Unsurprisingly,
headache and neck pain were the most commonly reported symptoms. Tenderness on palpation was reported
in 55% of all cases.
Female Male Total unknown
WAD 40 26 66 0
Control 22 41 63 43
Total 62 67 129 43
IRC-16-21 IRCOBI Conference 2016
- 93 -
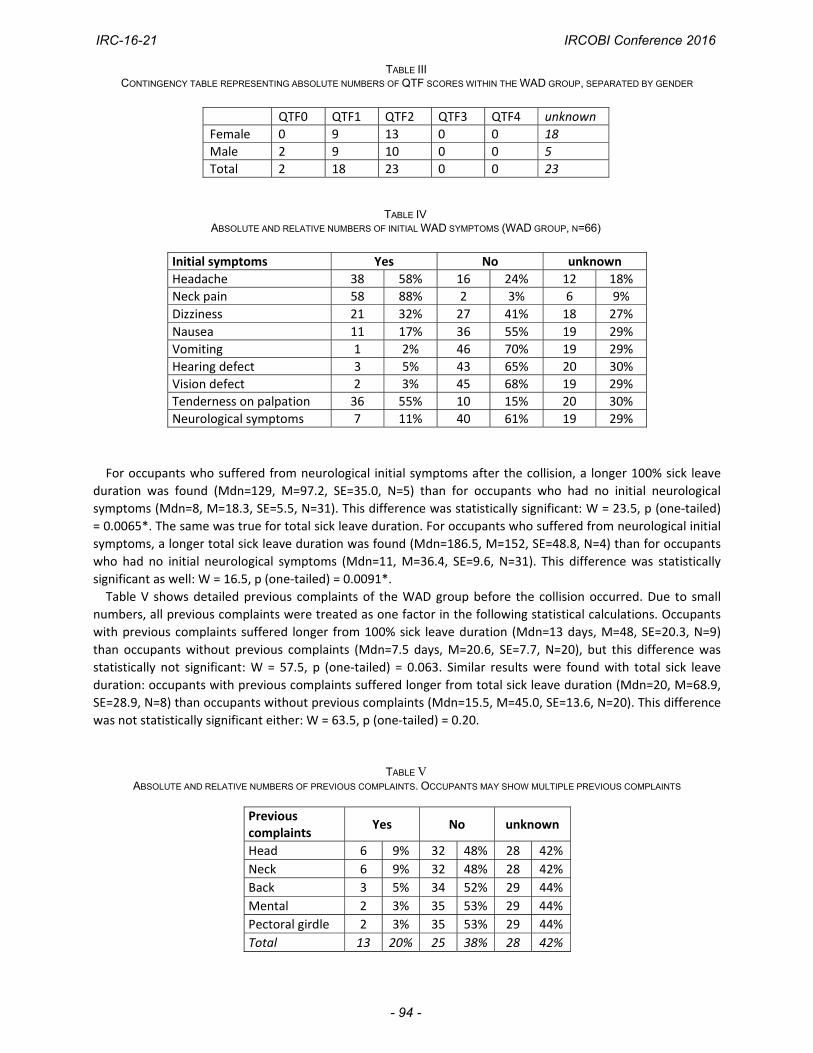
TABLE III CONTINGENCY TABLE REPRESENTING ABSOLUTE NUMBERS OF QTF SCORES WITHIN THE WAD GROUP, SEPARATED BY GENDER
TABLE IV ABSOLUTE AND RELATIVE NUMBERS OF INITIAL WAD SYMPTOMS (WAD GROUP, N=66)
For occupants who suffered from neurological initial symptoms after the collision, a longer 100% sick leave
duration was found (Mdn=129, M=97.2, SE=35.0, N=5) than for occupants who had no initial neurological
symptoms (Mdn=8, M=18.3, SE=5.5, N=31). This difference was statistically significant: W = 23.5, p (one‐tailed)
= 0.0065*. The same was true for total sick leave duration. For occupants who suffered from neurological initial
symptoms, a longer total sick leave duration was found (Mdn=186.5, M=152, SE=48.8, N=4) than for occupants
who had no initial neurological symptoms (Mdn=11, M=36.4, SE=9.6, N=31). This difference was statistically
significant as well: W = 16.5, p (one‐tailed) = 0.0091*.
Table V shows detailed previous complaints of the WAD group before the collision occurred. Due to small
numbers, all previous complaints were treated as one factor in the following statistical calculations. Occupants
with previous complaints suffered longer from 100% sick leave duration (Mdn=13 days, M=48, SE=20.3, N=9)
than occupants without previous complaints (Mdn=7.5 days, M=20.6, SE=7.7, N=20), but this difference was
statistically not significant: W = 57.5, p (one‐tailed) = 0.063. Similar results were found with total sick leave
duration: occupants with previous complaints suffered longer from total sick leave duration (Mdn=20, M=68.9,
SE=28.9, N=8) than occupants without previous complaints (Mdn=15.5, M=45.0, SE=13.6, N=20). This difference
was not statistically significant either: W = 63.5, p (one‐tailed) = 0.20.
TABLE V
ABSOLUTE AND RELATIVE NUMBERS OF PREVIOUS COMPLAINTS. OCCUPANTS MAY SHOW MULTIPLE PREVIOUS COMPLAINTS
QTF0 QTF1 QTF2 QTF3 QTF4 unknown
Female 0 9 13 0 0 18
Male 2 9 10 0 0 5
Total 2 18 23 0 0 23
Initial symptoms Yes No unknown
Headache 38 58% 16 24% 12 18%
Neck pain 58 88% 2 3% 6 9%
Dizziness 21 32% 27 41% 18 27%
Nausea 11 17% 36 55% 19 29%
Vomiting 1 2% 46 70% 19 29%
Hearing defect 3 5% 43 65% 20 30%
Vision defect 2 3% 45 68% 19 29%
Tenderness on palpation 36 55% 10 15% 20 30%
Neurological symptoms 7 11% 40 61% 19 29%
Previous complaints
Yes No unknown
Head 6 9% 32 48% 28 42%
Neck 6 9% 32 48% 28 42%
Back 3 5% 34 52% 29 44%
Mental 2 3% 35 53% 29 44%
Pectoral girdle 2 3% 35 53% 29 44%
Total 13 20% 25 38% 28 42%
IRC-16-21 IRCOBI Conference 2016
- 94 -
Fig. 3. Delta‐v of struck car compared between WAD and control group. The error bars denote the 95% confidence intervals.
Fig. 2. Risk curve for initial WAD symptoms in intervals of delta‐v (N=168).
Fig. 4. Mean acceleration of struck car compared between WAD and control group. The error bars denote the 95% confidence intervals.
Initial WAD Symptoms
Figure 1 shows the absolute numbers of struck car occupants sorted by increasing delta‐v groups and by WAD
versus control group. Figure 2 illustrates the risk of suffering from WAD initial symptoms in relation to delta‐v of
the struck car. On average, occupants who suffered from WAD initial symptoms experienced greater delta‐v
(M=11.1 km/h, CI=1.4, SE=0.7, N=66) than non‐injured occupants (M=8.9 km/h, CI=0.9, SE=0.5, N=106). This
difference was statistically significant: t(117.63) = 2.47, p (one‐tailed) = 0.0074*. Corresponding box‐ and bar‐
plots can be found in Fig. 3.
On average, occupants who suffered from initial WAD symptoms experienced greater mean acceleration
(M=2.87 g, CI=0.44, SE=0.22, N=66) than non‐injured occupants (M=2.02 g, CI=0.24, SE=0.12, N=106). This
difference was statistically significant: t(103.2) = 3.38, p (one‐tailed) = 0.00051*. Corresponding box‐ and bar‐
plots can be found in Fig. 4.
Triggered by the findings of the descriptive analysis, the influence of impact time was tested. Occupants who
suffered from WAD initial symptoms experienced statistically significant shorter impact times (Mdn=114 ms,
M=113.1, SE=2.4, N=66) than non‐injured occupants (Mdn=131.5 ms, M=133.8, SE=3.0, N=106): W = 2138.5, p
(one‐tailed) < 0.0001*. Four cases of the control group had impact times of more than 200 ms. While this is
uncommon in rear‐end bumper‐to‐bumper collisions, it can happen when the striking car under‐rides the struck
car or in small overlap collisions.
Fig. 1. Numbers of occupants suffering from initial WAD symptoms and uninjured occupants in intervals of delta‐v.
IRC-16-21 IRCOBI Conference 2016
- 95 -
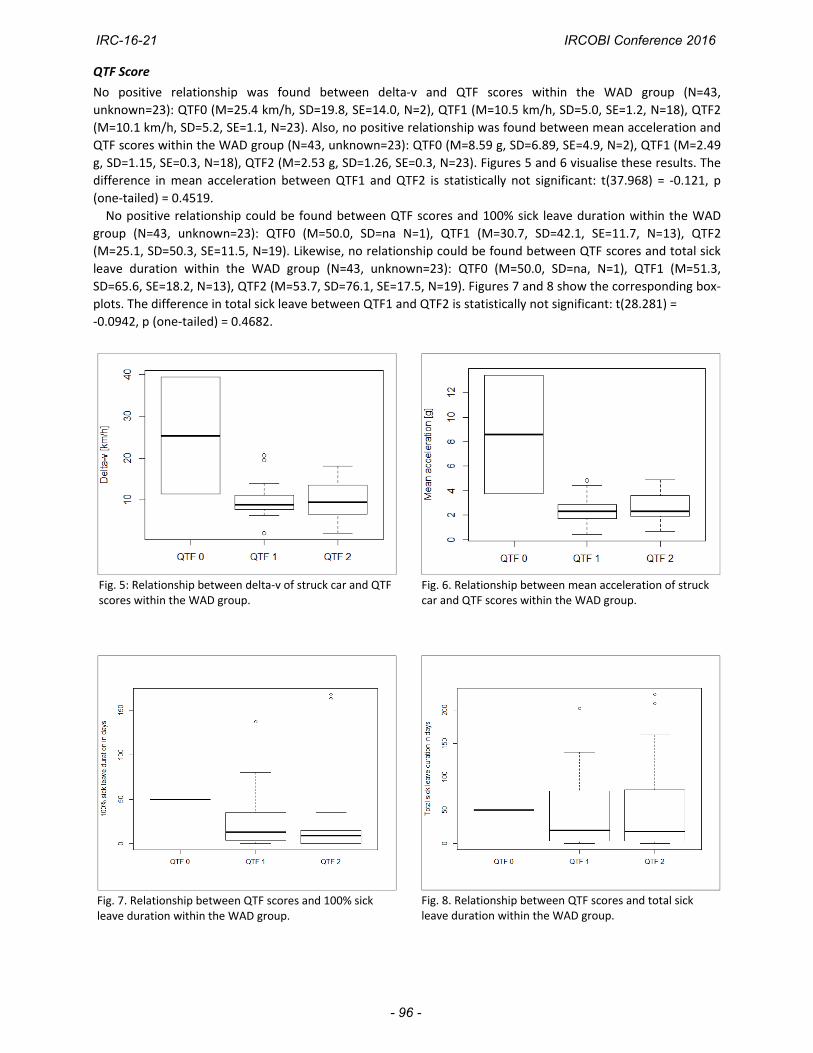
Fig. 5: Relationship between delta‐v of struck car and QTF scores within the WAD group.
Fig. 7. Relationship between QTF scores and 100% sick leave duration within the WAD group.
Fig. 8. Relationship between QTF scores and total sick leave duration within the WAD group.
Fig. 6. Relationship between mean acceleration of struck car and QTF scores within the WAD group.
QTF Score
No positive relationship was found between delta‐v and QTF scores within the WAD group (N=43,
unknown=23): QTF0 (M=25.4 km/h, SD=19.8, SE=14.0, N=2), QTF1 (M=10.5 km/h, SD=5.0, SE=1.2, N=18), QTF2
(M=10.1 km/h, SD=5.2, SE=1.1, N=23). Also, no positive relationship was found between mean acceleration and
QTF scores within the WAD group (N=43, unknown=23): QTF0 (M=8.59 g, SD=6.89, SE=4.9, N=2), QTF1 (M=2.49
g, SD=1.15, SE=0.3, N=18), QTF2 (M=2.53 g, SD=1.26, SE=0.3, N=23). Figures 5 and 6 visualise these results. The
difference in mean acceleration between QTF1 and QTF2 is statistically not significant: t(37.968) = ‐0.121, p
(one‐tailed) = 0.4519.
No positive relationship could be found between QTF scores and 100% sick leave duration within the WAD
group (N=43, unknown=23): QTF0 (M=50.0, SD=na N=1), QTF1 (M=30.7, SD=42.1, SE=11.7, N=13), QTF2
(M=25.1, SD=50.3, SE=11.5, N=19). Likewise, no relationship could be found between QTF scores and total sick
leave duration within the WAD group (N=43, unknown=23): QTF0 (M=50.0, SD=na, N=1), QTF1 (M=51.3,
SD=65.6, SE=18.2, N=13), QTF2 (M=53.7, SD=76.1, SE=17.5, N=19). Figures 7 and 8 show the corresponding box‐
plots. The difference in total sick leave between QTF1 and QTF2 is statistically not significant: t(28.281) =
‐0.0942, p (one‐tailed) = 0.4682.
IRC-16-21 IRCOBI Conference 2016
- 96 -
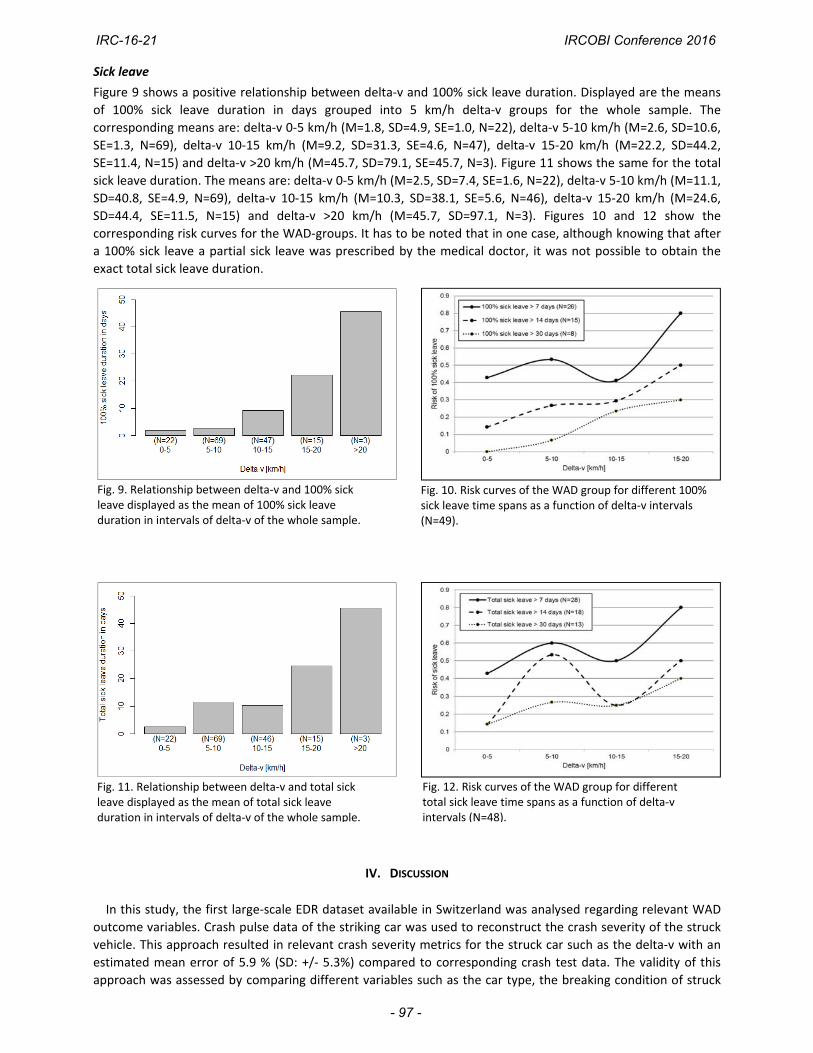
Sick leave
Figure 9 shows a positive relationship between delta‐v and 100% sick leave duration. Displayed are the means
of 100% sick leave duration in days grouped into 5 km/h delta‐v groups for the whole sample. The
corresponding means are: delta‐v 0‐5 km/h (M=1.8, SD=4.9, SE=1.0, N=22), delta‐v 5‐10 km/h (M=2.6, SD=10.6,
SE=1.3, N=69), delta‐v 10‐15 km/h (M=9.2, SD=31.3, SE=4.6, N=47), delta‐v 15‐20 km/h (M=22.2, SD=44.2,
SE=11.4, N=15) and delta‐v >20 km/h (M=45.7, SD=79.1, SE=45.7, N=3). Figure 11 shows the same for the total
sick leave duration. The means are: delta‐v 0‐5 km/h (M=2.5, SD=7.4, SE=1.6, N=22), delta‐v 5‐10 km/h (M=11.1,
SD=40.8, SE=4.9, N=69), delta‐v 10‐15 km/h (M=10.3, SD=38.1, SE=5.6, N=46), delta‐v 15‐20 km/h (M=24.6,
SD=44.4, SE=11.5, N=15) and delta‐v >20 km/h (M=45.7, SD=97.1, N=3). Figures 10 and 12 show the
corresponding risk curves for the WAD‐groups. It has to be noted that in one case, although knowing that after
a 100% sick leave a partial sick leave was prescribed by the medical doctor, it was not possible to obtain the
exact total sick leave duration.
IV. DISCUSSION
In this study, the first large‐scale EDR dataset available in Switzerland was analysed regarding relevant WAD
outcome variables. Crash pulse data of the striking car was used to reconstruct the crash severity of the struck
vehicle. This approach resulted in relevant crash severity metrics for the struck car such as the delta‐v with an
estimated mean error of 5.9 % (SD: +/‐ 5.3%) compared to corresponding crash test data. The validity of this
approach was assessed by comparing different variables such as the car type, the breaking condition of struck
Fig. 10. Risk curves of the WAD group for different 100% sick leave time spans as a function of delta‐v intervals (N=49).
Fig. 9. Relationship between delta‐v and 100% sick leave displayed as the mean of 100% sick leave duration in intervals of delta‐v of the whole sample.
Fig. 12. Risk curves of the WAD group for different total sick leave time spans as a function of delta‐v intervals (N=48).
Fig. 11. Relationship between delta‐v and total sick leave displayed as the mean of total sick leave duration in intervals of delta‐v of the whole sample.
IRC-16-21 IRCOBI Conference 2016
- 97 -
car and the delta‐v range of the striking car. As anticipated, delta‐v has an effect on the onset of initial WAD
symptoms. Kullgren et al. stated that the WAD risk increases with higher delta‐v values [5]. In this study, from
delta‐v values between approximately 9 and 12 km/h, the risk of complaining about initial WAD symptoms
starts to increase strongly with the delta‐v. According to Krafft et al. and Kullgren et al., longer sick leave
durations were expected for higher delta‐v values [5][13]. This is true for 100% sick leave as well as total sick
leave duration; 100% sick leave duration rises strongly for delta‐v values higher than 10 km/h. This finding is in
line with a threshold value as suggested by Niederer et al. [8]. The means of the two groups, with regard to
initial WAD symptoms, also statistically reflect the threshold of 10 km/h, as the mean of the WAD group is
above and the mean of the control group is below 10 km/h. However, this is a purely statistical observation and
thus not suitable for assessment of individual cases, which can be seen by the fact that a considerable number
of occupants who experienced a delta‐v below 10 km/h claimed initial WAD symptoms. These claims need to be
assessed on an individual basis and also with regard to other parameters, such as a medical history of previous
complaints or neurological symptoms, as highlighted by the findings of this sample. Thus, a biomechanical,
rather than a purely technical, assessment of the event is mandatory.
Similarly to delta‐v, mean acceleration can be seen as a risk factor for WAD [5]. However, in contrast to the
delta‐v, the 95% confidence intervals for mean acceleration did not overlap and the p‐value was smaller. This
indicates that the mean acceleration is a better predictor for WAD initial symptoms than the delta‐v. According
to Linder et al., mean acceleration has been found to be the main factor influencing the risk of AIS1 neck injuries
[9]. Furthermore, Krafft et al. stated that the mean acceleration is a better predictor for duration of symptoms
[22]. Though mean acceleration seems to be a better predictor, delta‐v nonetheless remains important.
According to Linder et al., the injury risk for a given change of velocity increased with a shorter duration of
the crash pulse [9]. The findings of this study support this. Consequently it can be hypothesized that under‐
riding may have a protective effect for the occupants of the struck car, as the impact time increases.
Regarding for the age of the struck cars, the results of this study confirm the corresponding hypothesis.
Kullgren et al. were able to show that the automotive industry has successfully developed whiplash protection
systems [11]. Newer cars are more likely to have such protecting systems. However, in this study no information
about the seat was available.
As for gender, various studies report a higher relative whiplash injury risk for females than males [12]. The
same outcome was observed here for the initial WAD symptoms. The calculated odds ratio of 2.87 point in the
same direction as the finding of Kullgren et al., i.e. that female occupants have approximately double risk of
symptoms lasting longer than one month [12]. However, as the findings of this study are based on the initial
WAD symptoms, the results might not be directly comparable.
As for previous complaints, Schmitt et al. showed that symptoms were significantly influenced by the
patient’s medical history considering pre‐existing damage of the neck or pre‐existing symptoms [6]. The results
of this study indicate a tendency that sick leave duration is influenced by previous complaints, but this finding
was statistically not significant. However, a larger sample size is needed for a more specific analysis.
Despite the fact that the number of occupants who suffered from neurological initial symptoms was small,
the results were statistically significant. Suissa et al. already concluded that whiplash patients presenting with
neurological signs and symptoms will have a longer recovery period [17]. The results of this study support this
statement.
Krafft et al. found a correlation between QTF scores and delta‐v [13]. However, in a different study conducted
previously Krafft et al. found no significant correlation between different grades of WAD and crash severity [14].
In this study no relationship was found between delta‐v and QTF scores or between mean acceleration and QTF.
In addition, no positive relationship between QTF scores and 100% sick leave duration or total sick leave
duration within the WAD group was found. According to these results, QTF scores should not be deemed a good
predictor for sick leave. This is consistent with existing literature [6][23].
V. CONCLUSION
The large‐scale introduction of EDRs in Switzerland allows detailed analysis of WAD claims. Using calculated
EDR data can improve the quality of the corresponding accident reconstruction. This study confirms previous
IRC-16-21 IRCOBI Conference 2016
- 98 -
research in the field by highlighting the link between impact severity and WAD risk of struck car occupants in rear‐end collisions. Both the short‐term occurrence of initial WAD symptoms and the long‐term sick leave consequences are positively associated with the crash severity measures delta‐v and mean acceleration. Furthermore, evidence was found that the mean acceleration describes the WAD risk better than the delta‐v. However, the data also revealed that starting from a delta‐v of 10 km/h, a WAD claim is more frequent. Other factors, like the mass ratio of the involved vehicles, the age of the struck vehicle, the impact time, gender and previous medical complaints of the occupants and the presence of neurological initial symptoms, also play an important role in the WAD risk assessment. However, the QTF score seems to be of limited use for WAD claims management.
VI. ACKNOWLEDGEMENTS
We thank our colleagues from the Accident Analysis department within AXA Winterthur Insurances
Switzerland, Peter Strauss, Matthias Widmer and Michele Riatsch, for their support on topics around accident reconstruction. We thank our colleagues from the medical department within AXA Winterthur Insurances Switzerland, Dr Urs Hürlimann and Dr Pieter‐Jan Wild, for their support on medical questions. We thank as well our colleagues from the Accident Research department within AXA Winterthur Insurances Switzerland, Thomas Eichholzer and Tobias Aberle, for their support on general accident research topics. We also thank Dr Christina Ratmoko from AXA Winterthur Insurances Switzerland, Dr Markus Muser from AGU Zürich and Prof. Dr William Taylor from ETH Zürich for their support.
VII. REFERENCES
[1] Comité Européen des Assurances (CEA). Minor Cervical Trauma Claims: Comparative Study, 2004.
[2] AXA Winterthur Insurances, Switzerland (AXA). Internal data, 2016.
[3] Swiss Insurance Association (SIA), Schadenleiterkommission SLK / Task Force HWS. Schlussbericht über die
HWS‐Studien des Schweizerischen Versicherungsverbandes, 24 March 2004.
[4] Swiss Accident Insurance Agency (SUVA). Aufgaben und Rollen bei Kurz‐ und Langzeitabsenzen im Überblick.
[5] Kullgren, A. and Krafft, M. Influence on change of velocity and acceleration on whiplash injury risk: results from real‐world crashes. 2008. [6] Schmitt, K‐U., Muser, M. H., Vetter, D., Walz, F. (2003) Biomechanical Assessment of Soft Tissue Neck Injuries in Cases with Long Sick Leave Times. Traffic Injury Prevention. 4(2): pp. 162–8.
[7] Schmitt, K‐U., Niederer, P. F., Cronin, D. S., Muser, M. H., Walz, F. (2014) Trauma Biomechanics: An Introduction to Injury Biomechanics. Springer, NY. [8] Niederer, P. F., Walz, F., Muser, M. H., Zollinger, U. (2001) Was ist ein "schwerer", was ein "leichter" Verkehrsunfall? Schweizerische Ärztezeitung. [9] Linder, A., Avery, M., Krafft, M., Kullgren, A. (2003) Change of velocity and pulse characteristics in rear impacts: real world and vehicle tests data. Proceedings of 18th ESV Conference,2003, Nagoya. [10] Burg, H., Moser, A. (2007) Handbuch Verkehrsunfallrekonstruktion, pages 219‐268, Friedr. Vieweg & Sohn Verlag, Germany.
IRC-16-21 IRCOBI Conference 2016
- 99 -
[11] Kullgren, A., Krafft, M., Lie, A., Tingvall, C. (2007) The effect of whiplash protection systems in real‐life crashes and their correlation to consumer crash test programmes. Proceedings of 20th ESV Conference, 2007, Lyon. [12] Kullgren, A., Krafft, M. (2010) Gender analysis on whiplash seat effectiveness: results from real‐world crashes. Proceedings of IRCOBI Conference, 2010, Hamburg. [13] Krafft, M., Kullgren, A., Malm, S., Ydenius, A. (2005) Influence on crash severity on various whiplash injury symptoms: a study based on real‐life rear‐end crashes with recorded crash pulses. Proceedings of 19th ESV Conference, 2005, Washington D.C. [14] Krafft, M., Kullgren, A., Tingvall, C., Boström, O., Fredriksson, R. (2000) How crash severity in rear impacts influences short‐ and long‐term consequences to the neck. Accident Analysis and Prevention, 32(2): pp.187–95. [15] Linder, A., Olsen, S., Eriksson, J., Svensson, M. Y., Carlsson, A. (2012) Influence of Gender, Height, Weight, Age, Seated Position and Collision Site related to Neck Pain Symptoms in Rear End Impacts. Proceedings of IRCOBI Conference, 2012, Dublin. [16] Jonsson, B., Tingvall, C., Krafft, M., Bjornstig, U. (2013) The risk of whiplash‐induced medical impairment in rear‐end impacts for males and females in driver seat compared to front passenger seat. IATSS Research, 37(1): pp.8–11. [17] Suissa, S., Harder, S., Veilleux, M. (2001) The relation between initial symptoms and signs and the prognosis of whiplash. Eur Spine J, 2001, 10(1): pp.44–9. [18] Swiss Federal Roads Office (FEDRO). Instruktionen zum Umfallaufnahmeprotokoll (UAP), Anhang 1: Unfalltypen [Version 4.21], 6 Dez. 2010. [19] AXA Winterthur Accident Research, DTC Dynamic Test Center, AGU Zürich. Vergleich der Crash Recorder (CR) Daten mit Daten eines kalibrierten Messsystems, 28 Feb. 2011. [20] Society of Automotive Engineers (SAE International), SAE J211‐1: Instrumentation for Impact Test, Part 1, Electronic Instrumentation, 2003. [21] Swiss Insurance Association (SIA), „Dokumentationsbogen für Erstkonsultation nach kranio‐zervikalem Beschleunigungstrauma“, Internet: [http://www.svv.ch/de/medizin/Personenschadenfall/dokumentationsbogen‐fuer‐erstkonsultation‐nach‐krani], Date Updated [2016‐06‐01]. [22] Krafft, M., Kullgren, A., Ydenius, A., Tingvall, C. (2002) Influence of Crash Pulse Characteristics on Whiplash Associated Disorders in Rear Impacts ‐ Crash Recording in Real Life Crashes. Traffic Injury Prevention, 3(2): pp.141–9. [23] Kivioja, J., Jensen, I., Lindgren, U. (2008) Neither the WAD‐classification nor the Quebec Task Force follow‐up regimen seems to be important for the outcome after a whiplash injury. A prospective study on 186 consecutive patients. Eur Spine J, 17(7): pp.930–35.
IRC-16-21 IRCOBI Conference 2016
- 100 -


![Investigation of Parameters Affecting Brain Model ... · IRC-17-58 IRCOBI Conference 2017-410-displacement histories of all NDTs, in all directions and for all impact cases [22‐27]](https://img.pdfslide.us/doc/110x75/5b85840a7f8b9aef498e8cba/investigation-of-parameters-affecting-brain-model-irc-17-58-ircobi-conference.jpg)


![IRC-18-32 IRCOBI conference 2018 Development of Human‐Body … · multi‐body human model including the muscles of the neck, arms, and legs was developed in [8]. In this model,](https://img.pdfslide.us/doc/110x75/5ecd6645a9dc6e3f690e2b21/irc-18-32-ircobi-conference-2018-development-of-humanabody-multiabody-human.jpg)
![IRC-16-30 IRCOBI Conference 2016 Comparison of Helmeted … · Santiago De Grau is a MSc student in ... masses [14], smaller heads, and skate at slower speeds it would be assumed](https://img.pdfslide.us/doc/110x75/5bf0d28209d3f2fb7d8b8ecf/irc-16-30-ircobi-conference-2016-comparison-of-helmeted-santiago-de-grau-is.jpg)

![IRC-16-53 IRCOBI Conference 2016 · whiplash score (2 points, respectively) [38]. First, a mesh was made from the two seats using 3D scans. Next, numerical](https://img.pdfslide.us/doc/110x75/5ec29b46f0affb088a26ba09/irc-16-53-ircobi-conference-whiplash-score-2-points-respectively-38-first.jpg)