Embed Size (px)
Citation preview
]
Powered Two‐Wheeler Accidents in Germany with Severe Injury Outcome ‐ Accident Scenarios, Injury
Sources and Potential Countermeasures
Abstract Powered two‐wheeler riders is a group for who fatalities are not decreasing at the same rate as for other road users. It is also a group that is likely to increase in the future due to traffic congestion. To develop countermeasures to protect powered two‐wheeler drivers it is necessary to understand accident events in detail, the injuries and their sources.
The German database GIDAS was queried for powered two‐wheeler crashes where the driver was severely
injured (AIS3+), resulting in 332 cases, where the injuries, pre‐crash scenarios and injury sources were studied in
detail.
The most common pre‐crash scenarios were found to be powered two‐wheelers losing control, or that another
vehicle did not notice the powered two‐wheeler. The most common injury source for the powered two‐wheeler
driver was the surrounding, with cars second. The road surface was the dominating surrounding injury source. An
interesting finding was that leg injuries were over‐represented in car impacts, and thorax injuries similarly for the
surrounding as injury source.
Countermeasures with highest potential to mitigate or prevent severe (AIS3+) injury, include leg and chest
protection for the rider, vehicle‐mounted warning or automatic emergency braking systems and vehicle‐to‐
powered two‐wheeler (V2X) communication.
Keywords AIS3+, injury, injury source, powered two‐wheelers (PTW), pre‐crash scenario
INTRODUCTION
Worldwide, half of the 1.25 million traffic fatalities yearly are vulnerable road‐users. The largest group of these
are motorized 2‐3wheeler riders: every year 285,000 M2‐3W riders are killed in traffic accidents, which makes up
23% of all traffic deaths [2]. In Europe motorized or powered two‐wheelers (PTW) make up 18% of fatalities in
road traffic, and although there has been a reduction in PTW fatalities in Europe, it has been a slower decline
than for overall traffic fatalities and therefore its share is increasing [3].
In a report, presented in 2008, 921 PTW accidents in five countries in Europe were studied [4]. A large majority
of the injured PTW riders were male, and the head was the most commonly injured body part. A frequent accident
partner and injury source were passenger cars, but for fatal accidents a larger share were single accidents. In the
PTW‐to‐car crashes, the most common part impacted was the side of the car, and a majority of the car accidents
occurred at intersections. In the 1980s, an extensive study on US motorcycle accidents was performed [5]. This
study also showed the frequent scenario of motorcycle‐to‐car crashes at intersections, where the car violated the
motorcycle’s right‐of‐way. Further, the study pointed out the problem of conspicuity, i.e. the problem that other
road‐users failed to detect the powered two‐wheeler. In a German study of all injury levels, it was highlighted
that PTW accidents often occur in junctions in conflict with a car where the PTW had priority , or as a single
accident with the PTW losing control [6].
Various countermeasures could be considered to address this. Helmets are effective countermeasures to
reduce head injury [5,7,8]. Anti‐lock brakes (ABS) are already introduced widely on motorcycles and have proven
to be effective in reducing accidents and injuries [9,10]. Also there are indications that PTWs with ABS, even when
crashes occur, are more likely to keep the rider in an upright position before crash [11]. Other countermeasures
introduced recently, although not yet proven efficient, include motorcycle airbags [12], inflatable jackets [13] and
stability control [14]. Rizzi has studied the potential of different countermeasures and concluded that ABS on the
PTW and safe intersections on rural roads to be most promising countermeasures [15,16]. Autonomous
R. Fredriksson, Ph.D., is a Senior Specialist at Autoliv Research in Sweden (+46‐(0)322‐626376, [email protected]). B. Sui, M.Sc., is Accident
Analysis Engineer at Autoliv China Technical Center, China.
Rikard Fredriksson, Bo Sui
IRC-16-11 IRCOBI Conference 2016
- 8 -
Emergency Braking (AEB), now common on passenger cars, has also been proposed and the indication is that it is
promising also for PTWs [17‐20]
The authors performed in 2015 a study on fatal PTW accidents using the German In‐Depth Accident Study
(GIDAS) database [21]. The aim of that study was to use the most extensive on‐scene, in‐depth fatal accident data
available to understand injuries, pre‐crash accident scenarios and in‐crash injury sources, to finally conclude
countermeasures with high potential to prevent or mitigate fatal PTW crashes. That study concluded that head
followed by thorax were the main body regions for fatal injury. Further, PTW losing control and that the PTW was
not noticed by another vehicle were the most common accident scenarios leading to a fatal PTW crash. The most
common injury sources were passenger cars, especially the lower parts of the cars, followed by surrounding
objects, mainly guard‐rails and trees. The study concluded that countermeasures with high potential included
innovative helmet or jacket designs, improved PTW visibility, guard‐rail redesign, PTW ABS and stability control,
vehicle‐mounted warning and auto‐brake systems, improved car frontal energy absorption and under‐run
protection for heavy vehicles.
It would be interesting to compare the previous fatal study [21] with less severe crashes to see how this
influences the results. While the fatal crashes were often high speed, loss of control accidents with motorcycles
(>125 cc) in rural settings, it would be interesting to see if this sample had a larger share of urban crashes with
smaller PTWs. The aim of the current study was therefore to use identical sampling criteria and data sources as
in the previous fatal study [21], but include all severely injured (AIS3+) to be able to compare directly to the fatal
study, but also to draw conclusions about this severely injured group regarding injuries, scenarios and injury
sources to conclude most effective countermeasures for severely injured PTW riders, including driver protection
as well as PTW‐ and car‐mounted countermeasures.
METHODS
Database and inclusion criteria
The GIDAS database was used to extract crash data for this study. GIDAS accident investigation teams operate
in Dresden and Hannover and their surroundings. The sample area contains both rural and urban traffic and is
chosen to represent, as closely as possible, a mini Germany. Work shifts are equally distributed between night
and day, with investigators attending accident sites using blue‐light vehicles, along with police and ambulance
personnel, when personal injuries are suspected. To investigate both vehicular and human factors in maximum
detail, the GIDAS teams consist of both technical and medical personnel. At least one confirmed personal injury
is required for inclusion in the database.
The GIDAS database was queried for accidents with injured riders of PTWs. The parameter ZWART (type of two‐
wheeled vehicle) was used to define PTWs, where the following were included in the study: motorized bicycle,
pedal moped, moped, moped with less than 50 cc, motorcycle with less than 125 cc, motorcycle, scooter up to
80 cc, scooter over 80 cc. Not included from the ZWART category were bicycle, motorcycle with sidecar, trike,
quad, motorized scooter trikes, other and unknown. Cases with passengers were excluded, due to the complexity
of understanding injury patterns. Only cases with complete reconstructions were included.
The following inclusion criteria were applied:
cases collected 1999–2014;
powered (motorized) two‐wheeler;
driver‐only cases (cases with passenger excluded);
all PTW driver ages;
at least one AIS3+ injury.
This query resulted in 3361 injured PTW drivers, with at least one AIS1+ injury (AIS 2005). Of these, 332 PTW
drivers sustained at least one AIS3+ injury.
Injury sources
In this study, sources of the AIS3+ injuries of the PTW driver were analyzed. Injury sources were grouped into
Surrounding, Car, Heavy vehicle, Other PTW, Own body motion, Fire, Own PTW and others/unknown. Objects from
the road, infrastructure and off‐road objects were then defined as Surrounding. Surrounding was then further
divided into the sub‐groups Guard‐rail, Other fixed objects, Road surface, Off‐road. Off‐road objects were defined
as any object that was not part of the road or built‐up infrastructure, so these then included trees, stones, water
IRC-16-11 IRCOBI Conference 2016
- 9 -
passages or ditches. Rails along the road designed to keep a vehicle from leaving the road were defined Guard‐
rail. Other fixed objects included street poles, lamp‐posts, masts, curb stones, buildings or parked cars. When a
passenger car or van was concluded as the injury source, this was defined as Car. When the injury source on the
car was concluded to be located below the waist line of the car, this was defined as a low impact. High impacts
were then to the glass parts, or the A‐, B‐ and C‐pillars. In the Heavy vehicle category, vehicles such as trucks,
buses or tractors were included. When the injury source was found to be from the parts of the PTW, including
PTW front/side fairing, handle bar, fuel tank, engine/gearbox tank or frame, then it was defined as Own PTW”.
Injury source of Own body motion was found when e.g. biting a tongue. When it was concluded that the PTW
driver sustained the injury from being driven over of the car of heavy vehicle, this was defined as Run over.
RESULTS
As mentioned in the Methods section, cases with passengers were not included in the study. The average
driver was a male (97%) and 36 years old. Ninety % of the drivers wore a helmet. 212 (64%) of the drivers rode a
motorcycle (>125 cc), 14% a moped (>50 cc), 9% a light motorcycle (<=125 cc), 7% a scooter (<=80 cc), 4% a
scooter (>80 cc), 2% a moped (<=50 cc) and 1 % a pedal moped. The mean travelling speed was 66 km/h before
the event started, and reached an average speed of 53 km/h at the time of impact. Crashes occurred at impact
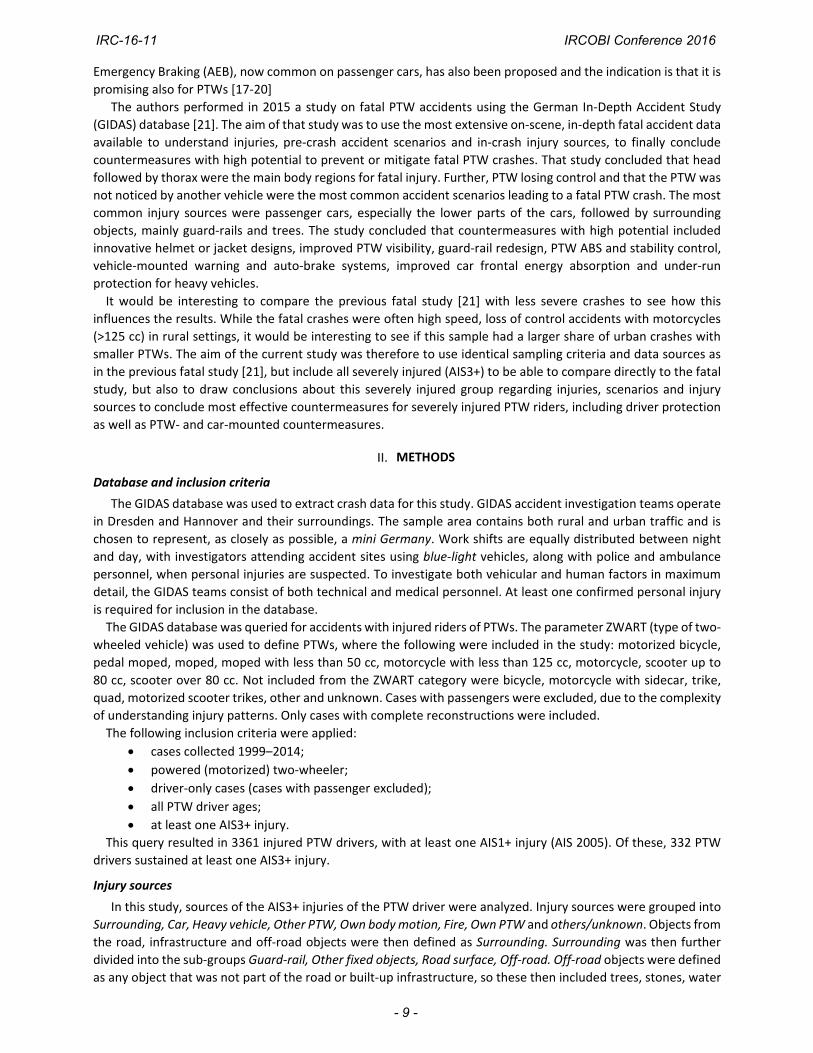
speeds from 4 km/h up to 185 km/h, and 58% of the accidents happened in an urban setting (TABLE I). Lower
extremity injuries were the most common cause of AIS3+ injuries (sustained by 59% of the drivers), followed by
chest AIS3+ injury (42%), combining thorax, cervical spine and abdomen, and 25% sustained head and face injury
(Fig 1). (In this figure thorax, abdomen and cervical spine was both presented separately and combined into a
group called “chest”. In the combined “chest” group a driver was only counted once if he e.g. sustained AIS3+
injuries to both thorax and abdomen. Therefore the combined group has a smaller percentage than simply adding
up the three sub‐groups.)
TABLE I
CRASH DETAILS (N=332)
Mean Min. Max.
Age (years) 36 13 94
Travelling speed (km/h) 66 4 185
Impact speed (km/h) 53 4 185
Registration year 1995 1967 2011
Male 97%
Helmet 90%
Urban/rural 58%/42%
IRC-16-11 IRCOBI Conference 2016
- 10 -
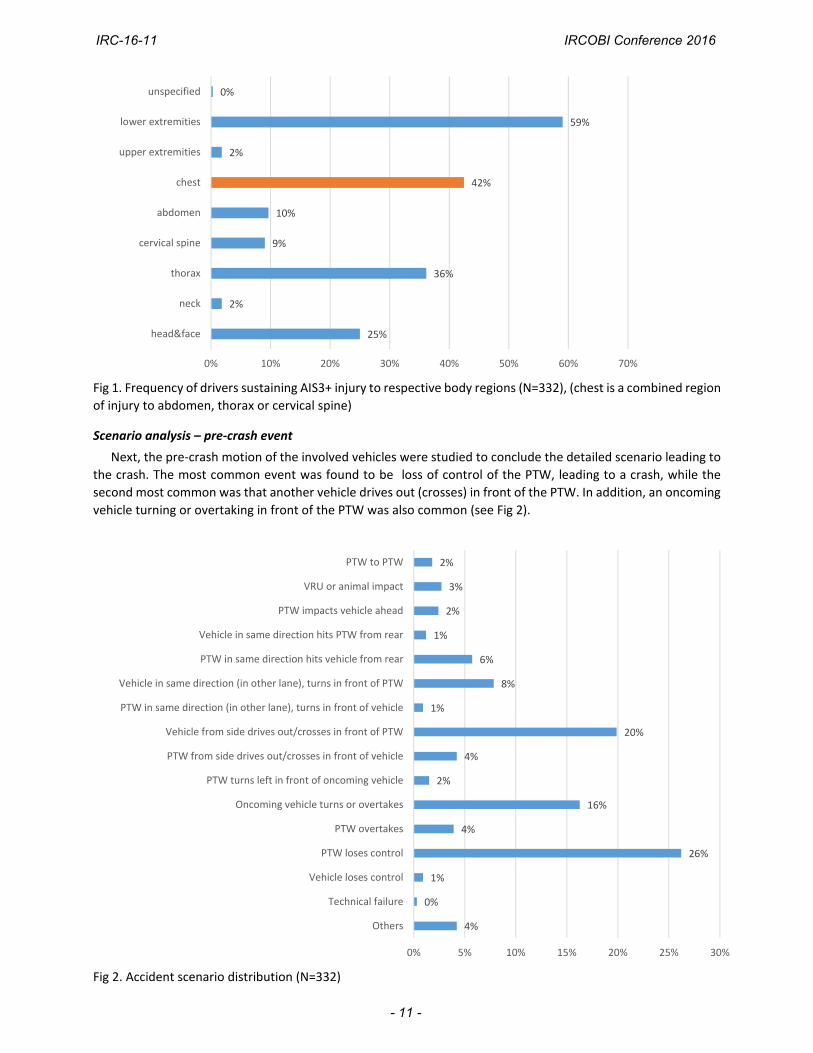
Fig 1. Frequency of drivers sustaining AIS3+ injury to respective body regions (N=332), (chest is a combined region
of injury to abdomen, thorax or cervical spine)
Scenario analysis – pre‐crash event
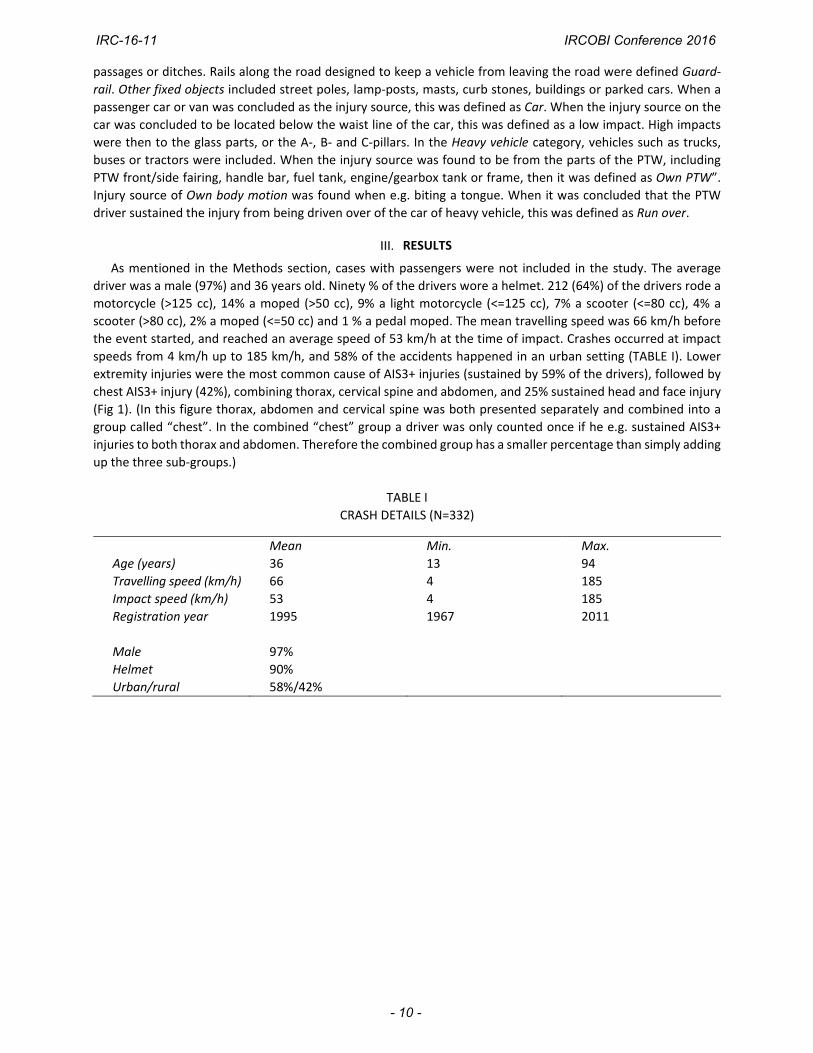
Next, the pre‐crash motion of the involved vehicles were studied to conclude the detailed scenario leading to
the crash. The most common event was found to be loss of control of the PTW, leading to a crash, while the
second most common was that another vehicle drives out (crosses) in front of the PTW. In addition, an oncoming
vehicle turning or overtaking in front of the PTW was also common (see Fig 2).
Fig 2. Accident scenario distribution (N=332)
25%
2%
36%
9%
10%
42%
2%
59%
0%
0% 10% 20% 30% 40% 50% 60% 70%
head&face
neck
thorax
cervical spine
abdomen
chest
upper extremities
lower extremities
unspecified
2%
3%
2%
1%
6%
8%
1%
20%
4%
2%
16%
4%
26%
1%
0%
4%
0% 5% 10% 15% 20% 25% 30%
PTW to PTW
VRU or animal impact
PTW impacts vehicle ahead
Vehicle in same direction hits PTW from rear
PTW in same direction hits vehicle from rear
Vehicle in same direction (in other lane), turns in front of PTW
PTW in same direction (in other lane), turns in front of vehicle
Vehicle from side drives out/crosses in front of PTW
PTW from side drives out/crosses in front of vehicle
PTW turns left in front of oncoming vehicle
Oncoming vehicle turns or overtakes
PTW overtakes
PTW loses control
Vehicle loses control
Technical failure
Others
IRC-16-11 IRCOBI Conference 2016
- 11 -
The most frequent scenarios were studied in further detail in order to gain more understanding about the
details of the events and the sources of injury. When the PTW loses control occurred (n=87), the driver most
commonly impacted an object (n=38) (see Fig 3). The object was, in most cases, a tree or a curb. In some of the
cases the PTW driver fell to the ground, and then impacted with object (n=18).
Fig 3. Detailed scenario distribution of scenario PTW loses control (n=87)
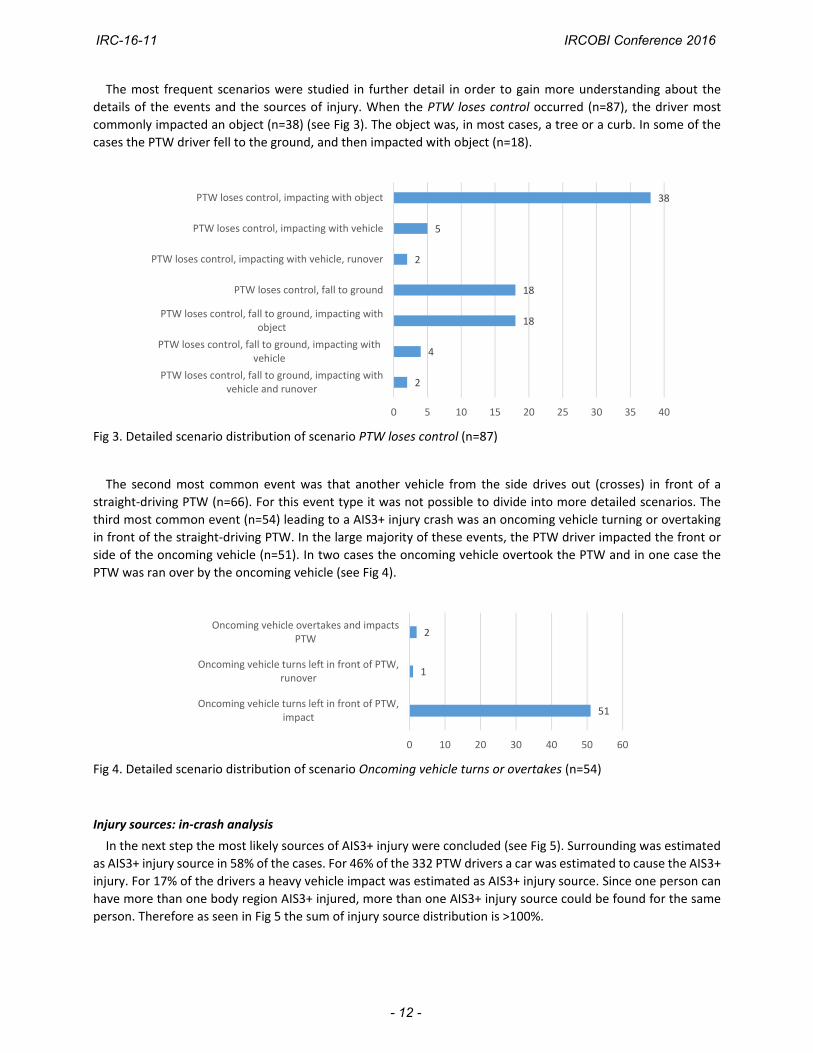
The second most common event was that another vehicle from the side drives out (crosses) in front of a
straight‐driving PTW (n=66). For this event type it was not possible to divide into more detailed scenarios. The
third most common event (n=54) leading to a AIS3+ injury crash was an oncoming vehicle turning or overtaking
in front of the straight‐driving PTW. In the large majority of these events, the PTW driver impacted the front or
side of the oncoming vehicle (n=51). In two cases the oncoming vehicle overtook the PTW and in one case the
PTW was ran over by the oncoming vehicle (see Fig 4).
Fig 4. Detailed scenario distribution of scenario Oncoming vehicle turns or overtakes (n=54)
Injury sources: in‐crash analysis
In the next step the most likely sources of AIS3+ injury were concluded (see Fig 5). Surrounding was estimated
as AIS3+ injury source in 58% of the cases. For 46% of the 332 PTW drivers a car was estimated to cause the AIS3+
injury. For 17% of the drivers a heavy vehicle impact was estimated as AIS3+ injury source. Since one person can
have more than one body region AIS3+ injured, more than one AIS3+ injury source could be found for the same
person. Therefore as seen in Fig 5 the sum of injury source distribution is >100%.
2
4
18
18
2
5
38
0 5 10 15 20 25 30 35 40
PTW loses control, fall to ground, impacting withvehicle and runover
PTW loses control, fall to ground, impacting withvehicle
PTW loses control, fall to ground, impacting withobject
PTW loses control, fall to ground
PTW loses control, impacting with vehicle, runover
PTW loses control, impacting with vehicle
PTW loses control, impacting with object
2
1
51
0 10 20 30 40 50 60
Oncoming vehicle overtakes and impactsPTW
Oncoming vehicle turns left in front of PTW,runover
Oncoming vehicle turns left in front of PTW,impact
IRC-16-11 IRCOBI Conference 2016
- 12 -
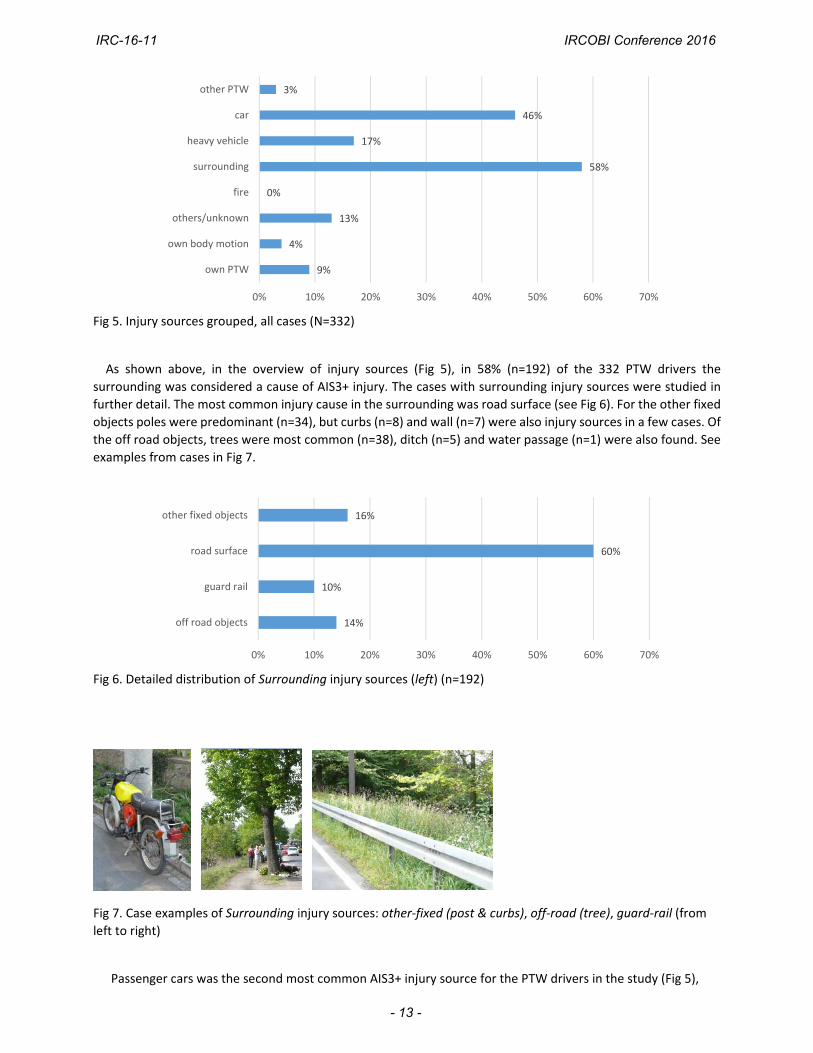
Fig 5. Injury sources grouped, all cases (N=332)
As shown above, in the overview of injury sources (Fig 5), in 58% (n=192) of the 332 PTW drivers the
surrounding was considered a cause of AIS3+ injury. The cases with surrounding injury sources were studied in
further detail. The most common injury cause in the surrounding was road surface (see Fig 6). For the other fixed
objects poles were predominant (n=34), but curbs (n=8) and wall (n=7) were also injury sources in a few cases. Of
the off road objects, trees were most common (n=38), ditch (n=5) and water passage (n=1) were also found. See
examples from cases in Fig 7.
Fig 6. Detailed distribution of Surrounding injury sources (left) (n=192)
Fig 7. Case examples of Surrounding injury sources: other‐fixed (post & curbs), off‐road (tree), guard‐rail (from
left to right)
Passenger cars was the second most common AIS3+ injury source for the PTW drivers in the study (Fig 5),
3%
46%
17%
58%
0%
13%
4%
9%
0% 10% 20% 30% 40% 50% 60% 70%
other PTW
car
heavy vehicle
surrounding
fire
others/unknown
own body motion
own PTW
16%
60%
10%
14%
0% 10% 20% 30% 40% 50% 60% 70%
other fixed objects
road surface
guard rail
off road objects
IRC-16-11 IRCOBI Conference 2016
- 13 -
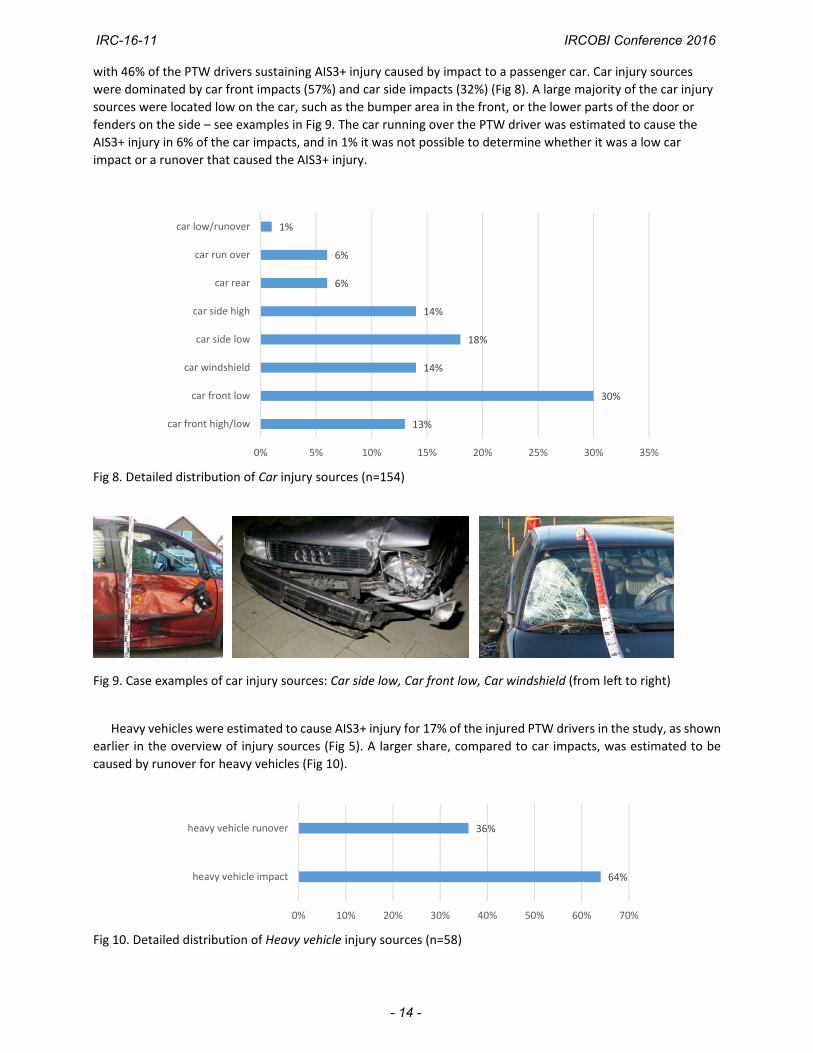
with 46% of the PTW drivers sustaining AIS3+ injury caused by impact to a passenger car. Car injury sources
were dominated by car front impacts (57%) and car side impacts (32%) (Fig 8). A large majority of the car injury
sources were located low on the car, such as the bumper area in the front, or the lower parts of the door or
fenders on the side – see examples in Fig 9. The car running over the PTW driver was estimated to cause the
AIS3+ injury in 6% of the car impacts, and in 1% it was not possible to determine whether it was a low car
impact or a runover that caused the AIS3+ injury.
Fig 8. Detailed distribution of Car injury sources (n=154)
Fig 9. Case examples of car injury sources: Car side low, Car front low, Car windshield (from left to right)
Heavy vehicles were estimated to cause AIS3+ injury for 17% of the injured PTW drivers in the study, as shown
earlier in the overview of injury sources (Fig 5). A larger share, compared to car impacts, was estimated to be
caused by runover for heavy vehicles (Fig 10).
Fig 10. Detailed distribution of Heavy vehicle injury sources (n=58)
1%
6%
6%
14%
18%
14%
30%
13%
0% 5% 10% 15% 20% 25% 30% 35%
car low/runover
car run over
car rear
car side high
car side low
car windshield
car front low
car front high/low
64%
36%
0% 10% 20% 30% 40% 50% 60% 70%
heavy vehicle impact
heavy vehicle runover
IRC-16-11 IRCOBI Conference 2016
- 14 -
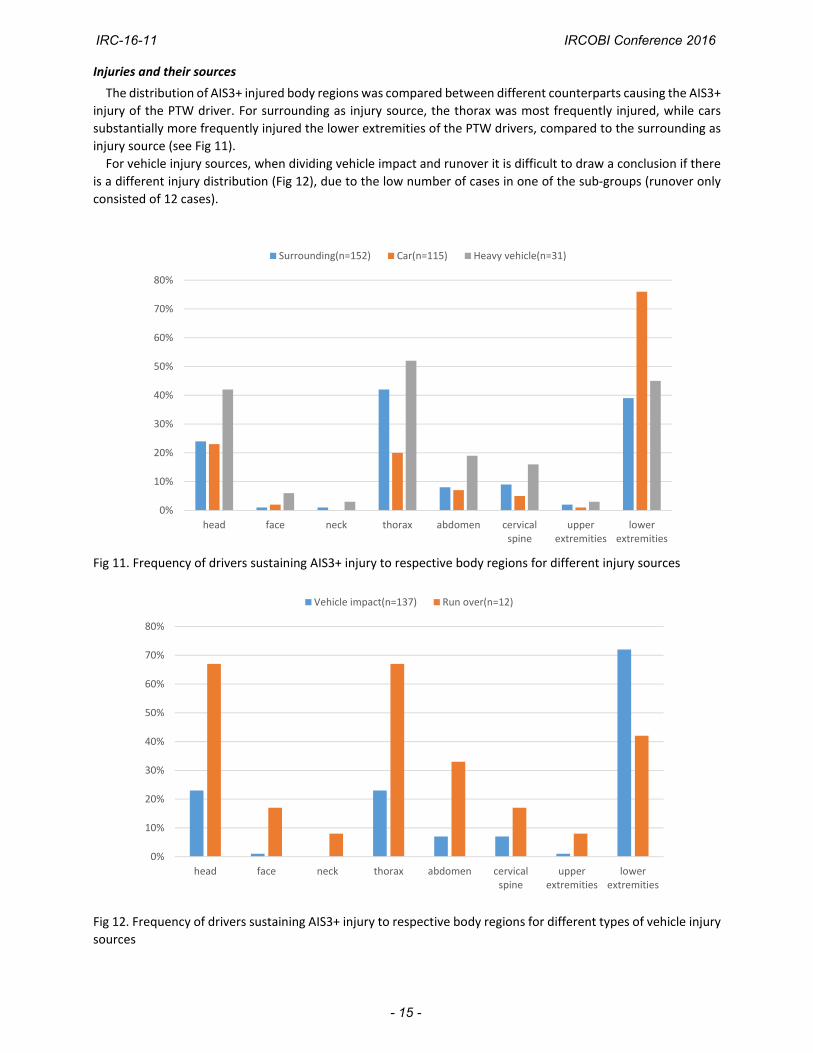
Injuries and their sources
The distribution of AIS3+ injured body regions was compared between different counterparts causing the AIS3+
injury of the PTW driver. For surrounding as injury source, the thorax was most frequently injured, while cars
substantially more frequently injured the lower extremities of the PTW drivers, compared to the surrounding as
injury source (see Fig 11).
For vehicle injury sources, when dividing vehicle impact and runover it is difficult to draw a conclusion if there
is a different injury distribution (Fig 12), due to the low number of cases in one of the sub‐groups (runover only
consisted of 12 cases).
Fig 11. Frequency of drivers sustaining AIS3+ injury to respective body regions for different injury sources
Fig 12. Frequency of drivers sustaining AIS3+ injury to respective body regions for different types of vehicle injury
sources
0%
10%
20%
30%
40%
50%
60%
70%
80%
head face neck thorax abdomen cervicalspine
upperextremities
lowerextremities
Surrounding(n=152) Car(n=115) Heavy vehicle(n=31)
0%
10%
20%
30%
40%
50%
60%
70%
80%
head face neck thorax abdomen cervicalspine
upperextremities
lowerextremities
Vehicle impact(n=137) Run over(n=12)
IRC-16-11 IRCOBI Conference 2016
- 15 -
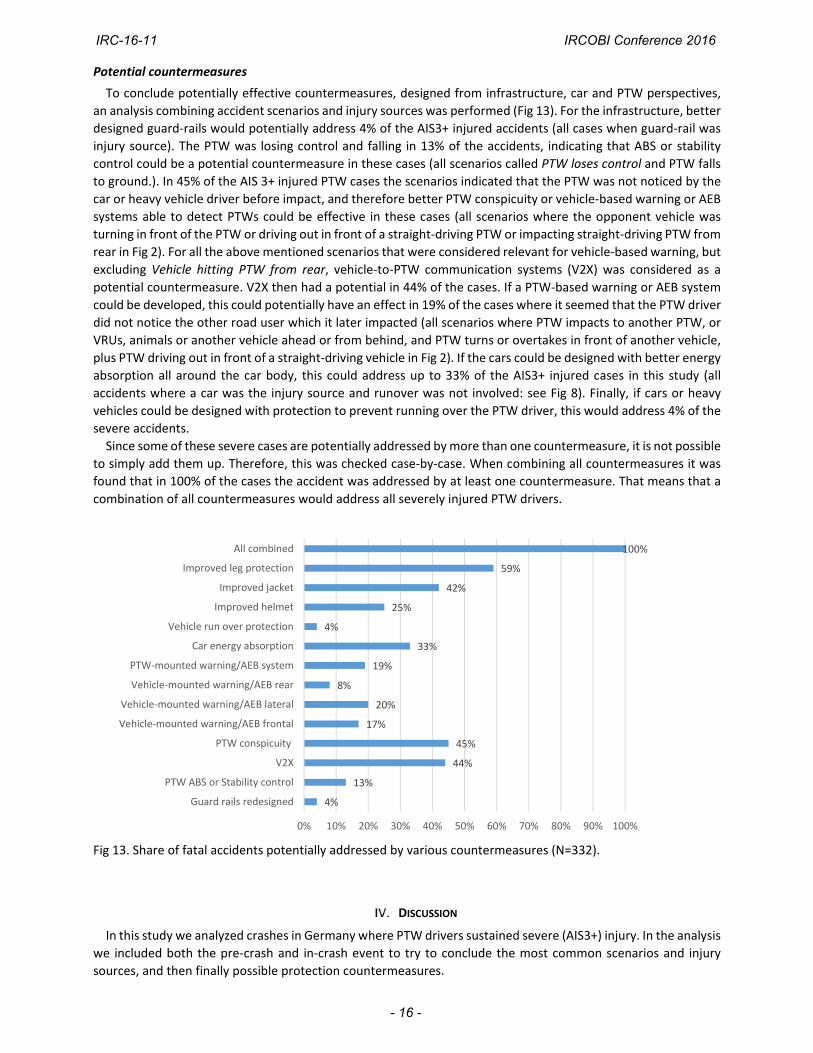
Potential countermeasures
To conclude potentially effective countermeasures, designed from infrastructure, car and PTW perspectives,
an analysis combining accident scenarios and injury sources was performed (Fig 13). For the infrastructure, better
designed guard‐rails would potentially address 4% of the AIS3+ injured accidents (all cases when guard‐rail was
injury source). The PTW was losing control and falling in 13% of the accidents, indicating that ABS or stability
control could be a potential countermeasure in these cases (all scenarios called PTW loses control and PTW falls
to ground.). In 45% of the AIS 3+ injured PTW cases the scenarios indicated that the PTW was not noticed by the
car or heavy vehicle driver before impact, and therefore better PTW conspicuity or vehicle‐based warning or AEB
systems able to detect PTWs could be effective in these cases (all scenarios where the opponent vehicle was
turning in front of the PTW or driving out in front of a straight‐driving PTW or impacting straight‐driving PTW from
rear in Fig 2). For all the above mentioned scenarios that were considered relevant for vehicle‐based warning, but
excluding Vehicle hitting PTW from rear, vehicle‐to‐PTW communication systems (V2X) was considered as a
potential countermeasure. V2X then had a potential in 44% of the cases. If a PTW‐based warning or AEB system
could be developed, this could potentially have an effect in 19% of the cases where it seemed that the PTW driver
did not notice the other road user which it later impacted (all scenarios where PTW impacts to another PTW, or
VRUs, animals or another vehicle ahead or from behind, and PTW turns or overtakes in front of another vehicle,
plus PTW driving out in front of a straight‐driving vehicle in Fig 2). If the cars could be designed with better energy
absorption all around the car body, this could address up to 33% of the AIS3+ injured cases in this study (all
accidents where a car was the injury source and runover was not involved: see Fig 8). Finally, if cars or heavy
vehicles could be designed with protection to prevent running over the PTW driver, this would address 4% of the
severe accidents.
Since some of these severe cases are potentially addressed by more than one countermeasure, it is not possible
to simply add them up. Therefore, this was checked case‐by‐case. When combining all countermeasures it was
found that in 100% of the cases the accident was addressed by at least one countermeasure. That means that a
combination of all countermeasures would address all severely injured PTW drivers.
Fig 13. Share of fatal accidents potentially addressed by various countermeasures (N=332).
DISCUSSION
In this study we analyzed crashes in Germany where PTW drivers sustained severe (AIS3+) injury. In the analysis
we included both the pre‐crash and in‐crash event to try to conclude the most common scenarios and injury
sources, and then finally possible protection countermeasures.
4%
13%
44%
45%
17%
20%
8%
19%
33%
4%
25%
42%
59%
100%
0% 10% 20% 30% 40% 50% 60% 70% 80% 90% 100%
Guard rails redesigned
PTW ABS or Stability control
V2X
PTW conspicuity
Vehicle‐mounted warning/AEB frontal
Vehicle‐mounted warning/AEB lateral
Vehicle‐mounted warning/AEB rear
PTW‐mounted warning/AEB system
Car energy absorption
Vehicle run over protection
Improved helmet
Improved jacket
Improved leg protection
All combined
IRC-16-11 IRCOBI Conference 2016
- 16 -
Lower extremities and the chest were the most common body regions to sustain severe injury, according to
this study of AIS3+ injured PTW drivers, while head injury placed third. Compared to an earlier study on fatal
crashes but otherwise with identical setup, data source and selection criteria, the fatal study was dominated by
head injuries [21]. The difference is probably due to the high use of helmets in this population, combined with
the lower energy in these crashes. Both travelling and impact speed was considerably lower in these serious
crashes. This was also reflected by the higher share of urban crashes in the group sustaining serious injury
compared to the group with fatal outcome. A majority of the serious crashes occurred in urban areas, while the
fatal crashes most commonly occurred in rural settings. Mean age of the drivers were very similar between the
two groups. Improved leg protection as well as an improved jacket seems to have high potential for seriously
injured PTW drivers, since these body regions were the most commonly injured. There have been studies showing
that boxer engines reduce leg injury [22], so there is a possibility to look into improved designs, or even in‐crash
activated protection for the lower extremity. For the chest there are also rider jacket design ideas with inflatable
structures that may be worth looking into.
The most common scenario was the PTW losing control, but in contrast to the earlier fatality study, in a large
number of these cases the PTW driver did not fall to the ground. The two other common scenarios was a vehicle
driving out (crossing) in front of the PTW and violating the PTW’s right‐of‐way, and an oncoming vehicle turning
or overtaking in front of the PTW. In both these later scenarios the PTW was driving straight and was apparently
not noticed by the vehicle. Combined these three scenarios were the dominating scenarios covering more than
60% of all crashes. Compared to fatal crashes, the PTW losing control and falling is less common, while a vehicle
driving out (crossing) in front of a PTW is more common in the serious crashes. ABS and stability control as well
as vehicle‐mounted warning or AEB systems could be potential countermeasures to address the most common
scenarios for seriously injured PTW drivers. ABS is now common on new motorcycles and has proven to be
effective [9,10] and stability control has also been introduced [14]. Vehicle‐to‐PTW communication systems (V2X)
could also be worth looking into, and it may be sufficient that the PTW is sending, not receiving, since in a majority
of cases the other vehicle did not notice the PTW and violating its right‐of‐way.
The most common injury source was the surrounding, closely followed by cars. In the earlier fatality study the
order was vice versa, with cars causing most injury. The road surface was the dominating part of the surrounding
causing serious injury, which was very different to the fatality study where guard‐rails and off‐road objects were
the dominating injury sources in the surrounding. So, for the seriously injured PTW drivers from the surrounding,
it seems to be most efficient to focus on ABS/stability control of the PTW as well as enhanced self‐protection of
the PTW driver. For the car injury sources, the lower car front was dominating, similar to the earlier fatal study.
It is possible that the improved car front energy absorption of later car model years, due to recent enhanced
pedestrian protection requirements may have an effect in the near future. In a crash database there is always a
lag since the majority of cars are not new, it will take some time to see such an effect. In the same way also the
rapid increase of ABS equipped PTWs could change the impact pattern with higher and more upright impacts,
due to the change in kinematics with less cases of sliding before the crash [11]. The case PTWs in this study were
checked manually and it was found that very few of them were equipped with ABS. Heavy vehicles are not as
common as injury sources, but for the cases we have runover is common. It is therefore important to develop
better runover prevention measures. When we looked into more detail of injury mechanisms, i.e. injury sources
of different body regions, the results indicated that leg injuries were predominantly caused by car impacts, while
thorax injuries are more common when the surrounding was the injury source.
This study was performed with the aim to conclude possible countermeasures to address drivers of PTWs.
Both pre‐crash and in‐crash (active and passive) countermeasures were considered. In the pre‐crash phase, it was
found that vehicle mounted warning systems or AEB systems would have high potential since in most cases, when
a PTW and vehicle collides it is the vehicle which made a maneuver or crossing which indicates it did not notice
the approaching PTW. Vehicle‐to‐PTW (V2X) communication could potentially also address this, and in this case
it would be effective that the PTW only sends out a signal (receiving not as important). Another solution to address
this is of course to equip the PTW driver with more visible clothing, but this has been addressed for a long time
and it seems difficult to make improvements there. ABS is likely an effective countermeasure, since many
accidents were caused by the PTW losing control and falling. ABS is already common on later model years, so
hopefully we will see the result from this soon in reduced frequency of this accident type. New systems have also
been shown for stability control, and if they are introduced successfully they may also be important to reduce
IRC-16-11 IRCOBI Conference 2016
- 17 -
this common accident type. For passive (in‐crash) protection this study indicates that leg protection for car
impacts, and thorax protection for road surface impact would have high potential. Possibly a deployable leg
protection device and inflatable jackets could address this. With more ABS‐equipped PTWs we will have a larger
share of upright impacts, which implies that PTW airbags could have a higher protection potential. Although more
or less all drivers in this study were equipped with helmets, head injury was still frequent, indicating that
development should continue on helmet design. Finally, the study showed that if we combined a number of these
countermeasures we could address a substantial part of these severe accidents involving PTW riders.
CONCLUSIONS
This is a follow‐up study to an earlier fatality PTW accident study using otherwise same data source and
inclusion criteria [21]. We found both similarities and differences to the fatal study. The severe crashes (in this
study) occurred naturally at lower speeds, but also more frequently in urban settings. The majority of severe
crashes were in urban areas, and the contrary for fatal crashes. The typical PTW driver was, just like in the fatal
crashes, young, male and wearing a helmet. While head injuries dominated in fatal crashes, leg and chest injuries
dominated in the severe crashes.
The pre‐crash scenarios that most commonly led to these accidents was the PTW losing control, or that
another vehicle did not notice the PTW so therefore crossing in front of a straight‐driving PTW or overtaking or
turning in front of an oncoming PTW leading to a crash. The vehicle crossing scenario was the most obvious
difference with higher frequency than fatal crashes, most likely due to the more urban setting in severe crashes.
The most common injury source for the PTW driver was the surrounding, with cars second. This was contrary
to the fatal crashes which had reverse order of these injury sources. The road surface was the dominating
surrounding injury source in the severe crashes, while on‐ and off‐road objects dominated in the fatal crashes.
For the car injury sources the car lower front dominated for both groups. An interesting finding was that leg
injuries were over‐represented in car impacts, and thorax injuries similarly for the surrounding as injury source.
To conclude, this study and the earlier fatal study, showed that both preventive (active) and protective
(passive) devices could have high potential to protect PTW drivers. The protective measures have highest
potential on the PTW (not other vehicles) for leg and chest protection. Possible devices are deployable structures
for leg protection on the PTW and inflatable jackets for the chest. Despite the high helmet use, the severely
injured still sustained a fair amount of head injuries, and for fatally injured it was the main cause. This shows that
innovative improvement in helmet design would have high potential. The rapid increase of ABS equipped PTWs
is likely to have a large effect on keeping the driver more upright changing the impact kinematics with other
vehicles with possibly higher and more controlled impacts, as well as less loss‐of‐control accidents. This leads to
larger protection potential of equipping PTWs with airbags. Preventive (active) measures would have most effect
if placed on the cars and trucks, since accident causes are dominated by these other vehicles not noticing the
PTW, not vice versa. The most common scenarios are junction or overtaking scenarios, so they need to have omni‐
directional capability. V2X communication systems could also have high potential, and here only a sending signal
(not receiving) from the PTW would have high effect.
ACKNOWLEDGEMENT
The authors would like to thank Matteo Rizzi, Folksam, for fruitful discussions and important input to the
analysis and conclusions of this study.
REFERENCES
[1] Rizzi, M., Strandroth, J., Holst, J., and Tingvall, C. Does the improved stability offered by Motorcycle Antilock Brakes (ABS) make sliding crashes less common? In-depth analysis of fatal crashes involving motorcycles fitted with ABS.
[2] World Health Organization. Global status report on road safety 2015. 2015, World Health Organization: Geneva, Switzerland.
[3] European Road Safety Orbservatory (ERSO). "CARE database - Traffic safety basic facts 2015 - Motorcycles & Mopeds" Internet http://ec.europa.eu/transport/road_safety/pdf/statistics/dacota/bfs2015_motomoped.pdf. 2016-03-31].
[4] MAIDS. In-depth investigations of accidents involving powered two wheelers. 2008, ACEM: Brussels, Belgium. [5] Hurt Jr., H.H., Ouellet, J.V., and Thom, D.R. Motorcycle accident cause factors and identification of countermeasures,
IRC-16-11 IRCOBI Conference 2016
- 18 -
Volume 1: Technical report, N.H.T.S.A. US Department of Transportation, Editor. 1981, Traffic Safety Center, University of Southern California: Los Angeles, USA.
[6] Liers, H. Analysis of the accident scenario of powered two-wheelers on the basis of real-world accidents. Proceedings of Expert Symposium on Accident Research, 2013. Hannover, Germany
[7] Mallory, A., Duffy, S., and Rhule, H. Head Injuries to Helmeted and Unhelmeted Motorcyclists in US Trauma Data. Proceedings of IRCOBI (International Research Council On the Biomechanics of Impact) Conference - short communication, 2013. Göteborg, Sweden
[8] USDoT. Traffic Safety Facts, 2008. Data – Motorcycles. 2008, Department of Transportation: Washington DC, USA. [9] Teoh, E.R. Effectiveness of Antilock Braking Systems in Reducing Fatal Motorcycle Crashes. 2010, Insurance Institute
for Highway Safety: USA. [10] Rizzi, M., Strandroth, J., and Tingvall, C. The effectiveness of Antilock Brake Systems (ABS) on Motorcycles in
Reducing real-life Crashes and Injuries. Traffic Inj Prev, 2009. 10: p. 479-487 [11] Rizzi, M., Strandroth, J., Holst, J., and Tingvall, C. Does the improved stability offered by Motorcycle Antilock Brakes
(ABS) make sliding crashes less common? In-depth analysis of fatal crashes involving motorcycles fitted with ABS. Traffic Inj Prev, 2016: p. 0
[12] Kuroe, T., Namiki, H., and Iijima, S. Exploratory study of an airbag concept for a large touring motorcycle: further research second report. Proceedings of 19th International Technical Conference on the Enhanced Safety of Vehicles (ESV), 2005. Washington DC, USA
[13] BikeBone. "Hit-Air Motorcycle Airbag Vests and Jackets" Internet http://www.bikebone.com/page/BBSC/CTGY/AT. 2015-03-28].
[14] Sgambati, F. and Lich, T. The safety benefits of motorcycle stability control. Proceedings of SAE Government & Industry meeting, 2015. Washington DC, USA
[15] Rizzi, M., Strandroth, J., Johansson, R., and Lie, A. The potential of different countermeasures in reducing motorcycle fatal crashes: what in-depth studies tell us in 22nd International Technical Conference on the Enhanced Safety of Vehicles (ESV). 2011: Washington DC, USA.
[16] Rizzi, M., Kullgren, A., and Tingvall, C. The combined benefits of motorcycle antilock braking systems (ABS) in preventing crashes and reducing crash severity. Traffic Injury Prevention, 2016. 17(3): p. 297-303
[17] Savino, G., Giovannini, F., Baldanzini, N., Pierini, M., and Rizzi, M. Assessing the potential benefits of the motorcycle autonomous emergency braking using detailed crash reconstructions. Traffic Inj Prev, 2013. 14 Suppl: p. S40-9
[18] Savino, G., Pierini, M., Rizzi, M., and Frampton, R. Evaluation of an autonomous braking system in real-world PTW crashes. Traffic Inj Prev, 2013. 14(5): p. 532-43
[19] Savino, G., Pierini, M., Thompson, J., Fitzharris, M., and Lenne, M.G. Exploratory Field Trial Of Motorcycle Autonomous Emergency Braking (MAEB): Considerations On The Acceptability Of Unexpected Automatic Decelerations. Traffic Inj Prev, 2016: p. 0
[20] Savino, G., Rizzi, M., et al. Further development of Motorcycle Autonomous Emergency Braking (MAEB), what can in-depth studies tell us? A multinational study. Traffic Inj Prev, 2014. 15 Suppl 1: p. S165-72
[21] Fredriksson, R. and Sui, B. Fatal Powered Two-Wheeler (PTW) crashes in Germany – an in-depth study of the events, injuries and injury sources, in IRCOBI (International Research Council On the Biomechanics of Impact) Conference. 2015: Lyon, France. p. 22-33.
[22] Rizzi, M. Can a Boxer Engine Reduce Leg Injuries Among Motorcyclists? Analysis of Injury Distributions in Crashes Involving Different Motorcycles Fitted with Antilock Brakes (ABS). Traffic Inj Prev, 2015. 16(7): p. 739-46
IRC-16-11 IRCOBI Conference 2016
- 19 -