Embed Size (px)
Citation preview
IR Learning Remote Attachment for Occupancy Sensors to Switch
Off Air Conditioners During Unoccupied Hours for Saving Energy
by
Vishal Garg, Niranjan K., Surekha Tetali
in
Submitted to Automation in Construction
Report No: IIIT/TR/2009/176
Centre for IT in Building ScienceInternational Institute of Information Technology
Hyderabad - 500 032, INDIANovember 2009

IR learning remote attachment for occupancy sensors to switch off air-
conditioner during unoccupied hours for saving energy
Abstract
This paper reports the development of an IR learning remote which when attached to
occupancy sensors can switch off air conditioners during unoccupied durations and thereby
save energy. This IR learning remote acts as an interface between occupancy sensor and
AC by transmitting the control signal of occupancy sensor to the AC, by sending
appropriate IR command. Generally, window and split air conditioners cannot be connected
to BMS and regular occupancy sensors with relays designed for smaller loads. Such ACs’
can be controlled by occupancy sensors with the help of the IR remote developed in this
work. As this system does not need any wiring and uses IR signals to control AC, the
system can also be used for retrofit applications. This paper describes the development of
the IR learning remote and the energy savings observed during the experiment. Further,
energy simulations performed using EnergyPlus show that for a typical office with two
hours of unoccupied duration during 8.5 office hours in a day, savings of 20% in air
conditioning and 23.5% in lighting can be achieved in composite climate by switching OFF
the AC and lights when the room is unoccupied. The percentage savings in air conditioning
energy consumption is less than that of lighting even when both the AC and the lights are
switched off for the same duration is due to the fact that AC has to remove the heat that
comes into the space during the unoccupied duration. Simple pay back of this device is
about two months.
Keywords: Energy saving, Motion Sensor, Occupancy sensor, Air Conditioner, IR Learning
Remote.
i

ii
1. Introduction
In this urbanized world, air conditioners are being widely used. According to a study [1]by
US Department of Energy, about 25% of annual energy consumption in commercial
buildings goes into space-conditioning and a similar percentage goes into lighting.
According to an article [2] published in Times of India, an Indian news paper, if officers
and employees of corporate and government organizations switch off their air-conditioning
systems and lighting when the space is unoccupied, up to 26% of electricity can be saved.
Manufacturers claim savings of 15% to 85% in lighting, although there is little published
research to support the magnitude or timing of reductions. Energy savings and performance
are directly related to the total wattage of the load being controlled, effectiveness of the
previous control method, occupancy patterns within the space, and proper sensor
commissioning. Case studies of energy savings have had varied results due largely to
differences in human factors, previous control strategies and proper sensor commissioning
[3].The possible energy savings by switching OFF the lights using occupancy sensors
would vary from 10%-19% in a typical small office as reported by Floyd, D. et. al [3].
Occupancy sensors have long been used in detecting occupancy and several algorithms
have been developed to improve their performance [4][5]. Using the simple ON/OFF
control occupancy sensors, it is easy to control small loads (such as lights and fans) but
controlling the HVAC systems is difficult because they consume large amount of current
which may not be handled by the occupancy sensors’ relays. There has been substantial
work in controlling AC using various communication media such as RF, and direct wire
connection, and with various communication protocols [6][7][8][9]. However all these
require a separate communication port in the ACs. There are various prior art technologies
which belong to relay base controls, Bluetooth based and PSTN based, which require these
features to be existent in the AC which they control. These may also involve a tedious
installation process and increase the initial investments.
As most of the stand alone AC have IR receiver, in this project, IR based system has
been developed which does not require any extra wiring, any extra attachment in the AC
and uses simple protocol. An IR learning remote attachment to occupancy sensor has been

developed to control AC in a similar fashion as their remote control. Whenever the
occupancy sensor changes the state of its output this attachment would change the state of
the AC through IR command.
The objective of the IR learning module developed is to switch ON & OFF the air-
conditioner when the given space is occupied and unoccupied respectively to save energy
consumed by the AC during unoccupied hours. This is achieved by connecting the IR
learning remote with an occupancy sensor. This IR Learning remote acts according to the
output from occupancy detector. A micro controller (ATmega8L) has been used in
developing the IR learning remote. The learning algorithm and control algorithm were
implemented within the same microcontroller. The system has been developed and
functionally tested in this work. Details on the development of the system are given Section
2 of this paper.
The concept of energy savings through switching off AC during unoccupied period
has been validated by conducting an experiment. The experiment has been performed in
two identical rooms located in Hyderabad. Sensors were installed to measure temperature,
electrical consumption, and weather data at the experimental site. A data logger has been
used to monitor and record readings of sensors. Indoor air temperatures and power
consumption of the AC have been monitored simultaneously in two rooms in a scenario
where the AC in one room is switched off during unoccupied hours and in the other room
the AC continues to function even during unoccupied hours. Further the collected data is
analyzed to calculate energy savings. The experiment conducted has been explained in
detail in Section3 for the paper.
Further, to support the experimental validation, energy simulation has been
performed for a similar scenario as of the experiment, and for a typical office schedule.
Simulations were performed using Energy Plus version-3.1 for various cases based on
length of unoccupied durations such as 2hours, 1hour, 30minutes and 15minutes. The
simulation results showed a saving of 20% in a typical office when the office is unoccupied
for two hours. The simulations are discussed in detail in Section 4.
3

2. Development of the system
2.1 Introduction
The overall system is built around a PIR motion sensor and an IR learning remote as shown
in Figure 1. Output from motion sensor is connected to input of IR learning remote. This IR
remote switches ON/OFF the air-conditioner based on the output of occupancy sensor. This
system can be used to control various appliances in a home or office which have IR remote
controlling facility.
Figure 1 Block diagram of the system
2.2 Overview of IR Learning Remote
IR Learning Remote can also be referred as learning remote or universal remote. A learning
remote or universal remote is a remote control that can be programmed to operate various
consumer electronic devices irrespective of their make. An IR learning remote can be used
to emulate the existing IR remote originally supplied by manufacturer [10]. This module
can be connected to any occupancy detector available commercially to control air-
conditioner or any other such devices which can be controlled through IR remote. The
prototype of the IR learning remote developed is as seen in Figure 2 The schematic of the
IR learning remote is shown in Figure 3
4

Figure 2 IR Learning Remote
Figure 3 Schematic of IR Learning Remote
As shown in the Figure 2, the IR Learning remote module has various blocks such as
Microcontroller, IR Transmitter/Receiver, Attenuator, Key Interface and Power supply. For
microcontroller block a low power, high performance AVR Atmega8L microcontroller has
been used in this design The package (32 Pin TQFP) of the device has been chosen to
minimize the overall module size. In the IR Transmitter/Receiver block TSOP1738 IR
demodulator has been used to receive IR signals and an IR LED with a MOSFET driver is
used to transmit IR signals. A capacitor and resistor voltage divider circuit is used for
attenuator block. This is vital because commercially available occupancy detector output is
5

about 220 volts. This cannot be connected directly to a microcontroller I/O pins. Three push
switches are provided on board for user interface to control various operations. A 5volts
DC power supply or 2AA batteries can be used to power up the module.
2.3 The Software
Two independent routines were implemented in micro controller. One is to activate
learning functionality and the second is to control air conditioner based on occupancy
detector’s output.
In a typical remote controller infrared (IR) pulses (typically 950-nm wavelength)
are emitted by an LED in response to the buttons pushed on its keypad. Each key triggers a
unique series of pulses that distinguish a particular function. A pulse actually is a burst of
IR at carrier frequency. To prevent interference from ballasts of fluorescent lights, lamps
and sunlight, most IR remote controllers digitally modulate a carrier whose frequency
usually ranges from 30 kHz to 56 kHz. Pulse width measurement and pulse counting has
be deployed for learning the IR signals in this IR remote. This is implemented with inbuilt
timer module available in ATmega8L microcontroller. Infrared demodulator is used to
receive and demodulate infrared signals. Output of demodulator is connected to one of the
I/O ports available on microcontroller. At each high to low and low high transition on port
pin, timer is triggered and it starts incrementing value. Here value in timer registers gives
width of the pulse and on every triggering register values are copied in to memory. The
same procedure continues for maximum of 250 pulses and stored. Maximum limit taken
here is 250 pulses because majority of manufacturers don’t use more than 100 data bits to
represent a command (each pulse correspond to a data bit logic “1” or “0”). If number of
pulses are less than the maximum count microcontroller stops the process of counting and
measuring width of pulse.
A simple technique is used to control air conditioner. Output of occupancy detector is
connected to an I/O port pin of microcontroller. When microcontroller detects change of
status on I/O pin it controls device accordingly. If status on pin is at logic high
microcontroller sends “on” command to air conditioner and if status on pin is logic low it
sends the “off” command.
6

2.4 Operational Details
The IR remote can operate in four different operating modes learning/playback mode,
normal operating (ON and OFF) mode, only OFF mode and bypass mode.
In learning/playback mode IR remote can learn new IR codes which are emitted from the
other IR remote controller. This mode allows only to learn new codes and learned codes
can be played back to test proper action. Normal operating mode puts IR remote to sense
occupancy sensor output. If occupancy sensor detects motion and sends the ON command,
IR remote switches ON the air conditioner by transmitting ON command and if room or
place is unoccupied and the occupancy sensor send OFF command then the IR remote
sends OFF command to switch off air conditioner. In the OFF mode, IR remote does not
switch ON air conditioner even if place is occupied and it only switches OFF air
conditioner if place is unoccupied for long duration. The bypass mode is like switching
OFF the IR remote. In this mode IR remote does not respond to occupancy sensor output
i.e., it cannot switch on or off the air conditioner.
3. Experimental Setup
3.1 Location of the experiment
The concept of energy savings when the AC is switch OFF during unoccupied hours has
been validated through an experiment. Two rooms (Room A and Room B) of identical floor
area from the Palash Bhavan (boys hostel) of IIIT Hyderabad were selected for the
experiment. The experiment has been performed in parallel in both the rooms to reduce
differences which may occur due to the change in climatic conditions. The experiment has
been performed in April 2009.
The rooms are on the top (third) floor of the building with the roof exposed. Brick
wall with cement plastering, RCC roof and single pane glass windows are the key features
of rooms’ construction. Equipment such as, fans and lights, of same wattage were used in
both the rooms. Two-1ton capacity air conditioners of the similar make where fitted in each
room. Table 1 summaries some of the important features of the rooms and Figure 4 shows
the plan of the two rooms selected.
7

NNNN
Figure 4 Layout of rooms
Due to the practical availability of rooms, two identical rooms which slightly differ in their
orientation were selected. For overcoming this difference measures such as window
shading, permanent closure of the windows and cool roof were employed. Also the
experiment has been performed during nights to reduce the effect of sun radiation over the
rooms.
Table 1 Experiment room properties
Dimensions 3.46m X 3.37m Tube light - 1 Internal loads Ceiling fan
Building envelope Wall Mass construction with brick, cement and sand Floor Tile flooring Roof RCC roof Window Metal frame Glazing Single glazing Air conditioner System tonnage 1 ton System COP 2.85
8

3.2 Equipment used in the experiment
In this experiment a data logger from Campbell Scientific [11] model CR 1000 has been
used to measure and store different sensor readings such as temperature, humidity, solar
radiation and electricity consumption. To monitor the internal room air temperature
Campbell Scientific model 108 temperature probes were used. The 108L is a general
purpose temperature sensor that can be used to accurately measure the temperature of a
variety of media, most commonly air, water, and soil. The 108L consists of a thermistor
encapsulated in cylindrical aluminum housing. The probe measures temperature from -5° to
+95°C and is designed for durability and ease of installation and removal [11] The
photograph of the data logger and the temperature probe as installed on site is as seen in
Figure 5. To measure solar radiation CM3 pyranometer from Kipp & Zonen was used. The
CM3 pyranometer is designed for continuous outdoor use. For monitoring the outside air
humidity and temperature HMP45C relative humidity and temperature probe was used.
To measure electricity consumption the Continental Control Systems LLC WattNode has
been installed as seen in Figure 6. The Advanced Pulse WattNode is a true RMS AC watt-
hour transducer with pulse output proportional to kWh consumed.
Figure 5 Data logger and indoor air temperature sensor
9

Figure 6 Watt node installed in the experiment room
Using all this equipment, an experiment has been conducted to observe the saving in power
with AC switched off during unoccupied hours. In Room A the AC was turned off during
the unoccupied hours and in Room B the AC was continuously ON even during the
unoccupied hours. Power savings in Room A with respect to Room B were measured.
3.3 Testing of the setup
Before the actual experiment was performed, two tests were performed to ensure that both
the rooms and their respective equipment have similar thermal behavior. In Test 1 the
indoor air temperatures in both the rooms were monitored over a period of two days, to
observe the thermal behavior of both the rooms. Test 2 was done to check the thermal
behavior of the AC equipment. Air conditioners were installed in both the rooms and were
switched ON continuously for a period of 24 hours at a set point 24 deg C. Power
consumption and indoor air temperatures were monitored during this period.
3.3.1 Test 1: Thermal behavior of the rooms
This test was mainly performed to check the thermal behavior of the rooms. This has been
observed by plotting the indoor air temperature data of both the rooms. Indoor air
10

temperature was monitored over a period of 48 hours in both Room A and Room B without
AC as seen in Figure 7
Indoor Air Temperature
20
22
24
26
28
30
32
34
36
38
40
15:0
0
16:3
0
18:0
0
19:3
0
21:0
0
22:3
0
0:00
1:30
3:00
4:30
6:00
7:30
9:00
10:3
0
12:0
0
13:3
0
15:0
0
16:3
0
18:0
0
19:3
0
21:0
0
22:3
0
0:00
1:30
3:00
4:30
6:00
7:30
9:00
10:3
0
12:0
0
13:3
0
Time
Tem
pera
ture
(deg
C)
Room A (Inside Air Temperature) Room B (Inside Air Temperature)
Figure 7 Indoor Air temperature in Room A and Room B which has been monitored without switching
ON the AC. The average temperature over a period of 24hr, in Room A is 31.50C and in Room B is
30.70C. Temperature in Room A is 0.780C greater than that in Room B
Indoor air temperatures in both the rooms were monitored over a period of two days.
Observations show that, there is a difference of 0.780C in their average room temperatures.
The major reason for this difference is possibly the difference in orientation of the rooms.
3.3.2 Test 2: Behavior of HVAC equipment
In Test 2, the ACs in both the rooms were switched ON for a period of 24 hours and the
indoor air temperatures and the power consumption readings were monitored. Test 2 has
been performed to observe the thermal behavior of the ACs installed, and the setpoint
temperatures maintained by both the ACs. Power consumption and the indoor air
temperatures of both the rooms where plotted over a period of 24hours as seen in Figure 8
11

Test 2: Room temperature & Power
20
21
22
23
24
25
26
27
28
29
3011
:04
AM
12:0
4 PM
1:04
PM
2:04
PM
3:04
PM
4:04
PM
5:04
PM
6:04
PM
7:04
PM
8:04
PM
9:04
PM
10:0
4 PM
11:0
4 PM
12:0
4 A
M
1:04
AM
2:04
AM
3:04
AM
4:04
AM
5:04
AM
6:04
AM
7:04
AM
8:04
AM
9:04
AM
10:0
4 A
M
11:0
4 A
M
Time
Indo
or te
mpe
ratu
re (d
eg C
)
0
0.2
0.4
0.6
0.8
1
1.2
1.4
Pow
er (k
W)
.
Room A temp Room B temp Room A power Room B power
Figure 8 Indoor Air temperatures and AC power consumption of both the rooms when the ACs’ were
continuously ON, with the set point of 240C in both the rooms. Average indoor air temperature of
Room A is 0.40C higher than that of Room B Power consumption for cooling in Room B is 3.8% more
than Room A.
The set point temperature of 240C is closely maintained in both the rooms. Average indoor
air temperature of Room A is 0.40C higher than that of Room B. Power consumption for
cooling in Room B is 3.8% more than Room A. The indoor air temperature of Room A is
slightly greater than its set point temperature, which might have resulted in low power
consumption when compared to Room B.
Both these tests show that the two rooms and setup are not perfectly identical
however they are close enough for the purposes of this experiment and these differences
would be accounted for during the experiment.
3.4 Observation and results
The experiment has been performed during nights to reduce the impact of slight difference
in orientation between the two rooms. Air conditioners in both the rooms were switched
12

ON for a period of 12 hours (8pm-8am). In Room A, the AC is switched OFF for a period
of 1 hr 45 mins (11pm-12.45am) assuming the time delay of occupancy sensor to be
15mins, where as in Room B the AC is continuously ON through out. The power and
indoor air temperatures were monitored and analyzed to understand the power savings as
seen in Figure 9.
Room temperature & Power
22
24
26
28
30
32
34
36
38
40
8:03
PM
8:33
PM
9:03
PM
9:33
PM
10:0
3 PM
10:3
3 PM
11:0
3 PM
11:3
3 PM
12:0
3 A
M
12:3
3 A
M
1:03
AM
1:33
AM
2:03
AM
2:33
AM
3:03
AM
3:33
AM
4:03
AM
4:33
AM
5:03
AM
5:33
AM
6:03
AM
6:33
AM
7:03
AM
7:33
AM
Time
Indo
or te
mpe
ratu
re (d
eg C
) )
0
0.5
1
1.5
2
2.5
Ave
rage
AC
pow
er in
eve
ry 5
min
sin
terv
al (k
W)
.
Room A temp Room B temp Room A power Room B power
Figure 9 Indoor Air temperature and AC power in Room A and Room B over a period of 12 hrs, with
AC turned OFF in Room A during the unoccupied hours. Room A temperature rises to 290C when the
AC is switched OFF. Room A average (5min interval) power ranges between 0.9 kW - 1.7 kW. As the
AC is switched ON after 1 hr 45 mins, Room A reaches a peak consumption of around 2.3 kW which
includes extra power consumed to reach set point. Power savings in Room A is 12.43% when compared
to Room B.
A sudden dip in the power reading has been observed in Room A when the AC is switched
OFF for 1hr 45mins. As the AC is switched ON, the power consumption increased. At this
point of time the AC power in Room A is more than that in Room B. This extra power was
put in by the AC for bringing down the temperature from 290C (as in Figure 9) to the set
point of 240C. From 1 am till 3am in the morning, the power consumed by AC in Room A
was higher than that in Room B. It has been observed that Room A is consumed 16.23%
less power for air conditioning than Room B. But since Room A by default is consuming
13

3.8% less than Room B (as observed in Test 2), necessarily the actual saving in power in
Room A when compared to that in Room B is 12.43%.
Total consumption by Room B in 12 hours: 14.6 kWh
Assuming no heat gain is there during unoccupied duration, then Room A (if identical to
Room B) would have consumed: (10.25/12)*14.6 kWh = 12.5 kWh
However, as per Test 2, Room A consumes 3.8% less than Room B hence Room A should
have consumed (assuming no heat gain is there during unoccupied times): 0.962 X 12.5
kWh= 12 kWh.
However the actual observation for Room A is: 11.8 kWh
The difference between the observed and perceived consumption (assuming no heat gain is
there during unoccupied times) is: 0.2 kWh which is due to the heat gain that happens
during the unoccupied period, which has to be removed by the AC when it starts.
4. Simulations
The concept of energy savings through switch OFF of AC during unoccupied hours has
also been theoretically supported with the simulation results. Energy simulation was
performed using EnergyPlus Version 3.1[12], for a building block assumed in Hyderabad.
Case 1 is developed assuming that the AC is switched ON throughout the occupied and
unoccupied hours and Case 2 is developed assuming AC is switched OFF the AC during
the unoccupied hours. The simulations are performed for two scenarios one being a typical
office schedule- a daytime use building and the other is the night time use building as in
case of the experiment.
4.1 Details of the simulation model
The building has been simulated for Hyderabad weather to match with the location of the
experimental setup.
Building geometry:
The block model which has been considered for the simulation is of square foot print with
one side dimension of 5m. A 4m x 1.6m window is placed centrally on the south wall of the
14

block above a sill of 0.75 m. An overhang of 0.8m depth and 4m width has been modeled
to reduce the direct radiation coming inside.
The block model is of 25 sq m built up area and single floor. The floor to floor height is 3.2
m. Roof, wall and floor construction material meet the U value as per the prescriptive
requirements of ASHRAE 90.1-2004 code for Indian climate. These building materials are
same for both the scenarios.
Internal load and schedules:
An occupancy density of 10 sq m/person has been considered in the model. Internal
lighting load o 10.8 W/ sq m and equipment load of 21.52 W/ sq m are considered.
Air conditioning:
A PTAC system has been modeled with the set point temperatures of heating and cooling
as 200C and 250C respectively.
4.2 Simulation scenarios and results:
The model has been simulated in two major scenarios, a daytime used building- typical
office schedule and second is a night time use building, as in the experiment conducted.
Each scenario has been modeled for the base case and a proposed case based on the switch
OFF of the AC.
4.2.1 Scenario 1: Daytime use building:
In the first scenario, the building has been modeled for a typical office schedule. The
working hours of the office are considered from 9.30 am to 6.00 pm. During these office
hours the building is assumed to be unoccupied for half an hour (10 am -10.30 am) during
the morning, one hour during the lunch (1 pm- 2pm) and half an hour in the evening (5 pm-
5.30 pm), totaling to 2hrs of unoccupied period in the whole day. During these unoccupied
hours it is assumed that the AC and lights are turned OFF completely in Case 2. AC
consumption and indoor air temperatures are plotted to understand the thermal behavior of
the space and the resulted savings.
Figure 10 shows the AC consumption for Case 1 and Case 2. It can be seen that there are
three unoccupied durations as given above. In these durations AC power goes down to zero
15

for Case 2 and the room indoor temperature rises in Case 2. Further it can be observed that
once the AC is started after the unoccupied duration there is an overshoot in the AC power
consumption. This overshoot is because of the extra heat that has entered the room during
unoccupied duration and is to be removed by the AC. Similar behavior is not seen in the
Figure 11 which shows the lighting power consumption for both the cases. Because of this
overshoot in AC consumption, the actual savings are less than the perceived savings. In
case of lighting the actual and perceived savings are same which is equal to 23.5% however
in case of air conditioning the perceived saving is 23.5% and the actual saving is 20%.
HVAC energy consumption and indoor temperatures-AC switch OFF during unoccupied time
20
22
24
26
28
30
32
34
36
38
40
9:30
AM
10:0
0 A
M
10:3
0 A
M
11:0
0 A
M
11:3
0 A
M
12:0
0 PM
12:3
0 PM
1:00
PM
1:30
PM
2:00
PM
2:30
PM
3:00
PM
3:30
PM
4:00
PM
4:30
PM
5:00
PM
5:30
PM
Time
Indo
or te
mpe
ratu
re (d
eg C
) )
0
50000
100000
150000
200000
250000
300000
350000
400000
AC
con
sum
ptio
n (J
)
Case 1 indoor temperature Case 2 indoor temperature Case 1 cooling consumption Case 2 cooling consumption
Figure 10 AC consumption and indoor air temperatures of Case 1 and Case 2. A clear overshoot in the
energy consumption can be observed as and when the AC is switch ON with after the occupied period
of time in Case 2. The resulted saving is AC consumption is 20%. Indoor air temperature during the
unoccupied hour of the day reached to a maximum of 310C during the afternoons.
16

Interior lighting consumption-lights switched OFF during unoccupied time
0
10000
20000
30000
40000
50000
60000
70000
80000
90000
9:30
AM
10:0
0 A
M
10:3
0 A
M
11:0
0 A
M
11:3
0 A
M
12:0
0 PM
12:3
0 PM
1:00
PM
1:30
PM
2:00
PM
2:30
PM
3:00
PM
3:30
PM
4:00
PM
4:30
PM
5:00
PM
5:30
PM
Time
Lig
htin
g co
nsum
ptio
n (J
)
Case 1 lighting consumption Case 2 lighting consumption
Figure 11 Lighting energy consumption, assuming that lighting is switch OFF during the unoccupied
hours. The total amount of unoccupied hours when lights are turned OFF is 23.5% of the office hours.
The resulted saving in lighting consumption is equal to 23.5%
4.2.2 Scenario 2: Night time use building
In this scenario a night time use building has been considered and the savings are calculated
for different switch OFF periods of the AC. Four different time periods of 2 hrs, 1hr, 30
mins and 15 mins are considered for unoccupied periods. In all the four conditions the AC
energy consumption and the indoor air temperature are analyzed.
17
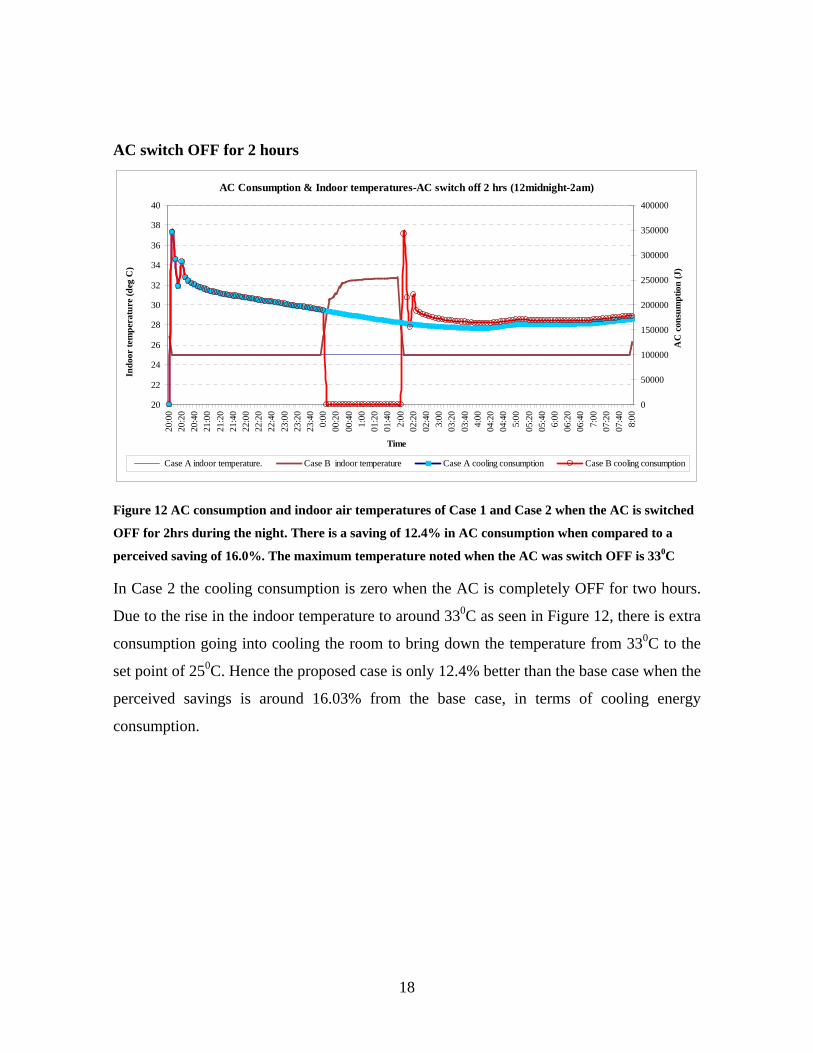
AC switch OFF for 2 hours
AC Consumption & Indoor temperatures-AC switch off 2 hrs (12midnight-2am)
20
22
24
26
28
30
32
34
36
38
40
20
:00
20
:20
20
:40
21:0
0
21:2
0
21:4
022
:00
22
:20
22
:40
23:0
0
23:2
0
23:4
00:
00
00:2
0
00:4
01:
00
01:2
0
01:4
02:
00
02:2
0
02:4
03:
00
03:2
0
03:4
04:
00
04:2
0
04:4
05:
00
05:2
0
05:4
06:
00
06:2
0
06:4
07:
00
07:2
0
07:4
08:
00
Time
Indo
or te
mpe
ratu
re (d
eg C
)
0
50000
100000
150000
200000
250000
300000
350000
400000
AC
con
sum
ptio
n (J
)
Case A indoor temperature. Case B indoor temperature Case A cooling consumption Case B cooling consumption
Figure 12 AC consumption and indoor air temperatures of Case 1 and Case 2 when the AC is switched
OFF for 2hrs during the night. There is a saving of 12.4% in AC consumption when compared to a
perceived saving of 16.0%. The maximum temperature noted when the AC was switch OFF is 330C
In Case 2 the cooling consumption is zero when the AC is completely OFF for two hours.
Due to the rise in the indoor temperature to around 330C as seen in Figure 12, there is extra
consumption going into cooling the room to bring down the temperature from 330C to the
set point of 250C. Hence the proposed case is only 12.4% better than the base case when the
perceived savings is around 16.03% from the base case, in terms of cooling energy
consumption.
18

Similarly the simulations have been performed for the AC switch OFF duration of 1hr,
30min and 15mins. In has been clearly observed that as the switch OFF duration of AC is
less, the percentage difference in perceived savings and actual savings is more. This is due
to the fact that, when the AC is switched OFF for a lesser duration, the increase in the
indoor air temperature is less; hence the extra cooling consumption which is required for
bringing back the room temperature to the set point temperature is more. This can be
observed from the savings shown in Table 2. From this it can be observed that when the
AC is switched OFF for a lesser duration, the difference between actual savings and
perceived savings is more.
AC switch off period Perceived saving in kWh
(A)
Actual saving in kWh
(B)
% Difference
(A-B)
2 hours 1.17 0.91 22.7%
1 hour 0.56 0.41 27.7%
30 minutes 0.28 0.18 33.6%
15minutes 0.13 0.08 43.4%
Table 2 Savings for various switch off durations of AC
This difference in the perceived and actual savings, hence, depends on the duration for
which the AC is turned OFF and also on the time at which this is switched OFF (day or
night).
19

5. Conclusion
The IR learning remote attachment has been developed to save energy by switching OFF
the AC in a space during unoccupied durations. This concept of energy savings has been
supported by an experiment and simulations. In the experiment conducted, power
consumption in two rooms has been monitored over a period of 12 hours during the night.
In Room A where the AC is switched OFF during the unoccupied time (for 2hrs) there is a
savings of 15% in power consumption despite of the extra power which is consumed to
decrease the indoor air temperature to the set point once the AC is switched ON. To further
support this concept simulations have been performed. Two scenarios, a daytime use and a
night time use building are considered. The simulation for the daytime use building has
been done with a typical office schedule (9.30 am- 6pm). The resulted AC energy saving in
this case was 20% where as the perceived savings was 23.5% which is equal to the savings
in lighting. The night time use building has been modeled in four different conditions
depending of the duration of unoccupied time. A savings of 12% was resulted in the
scenario when the AC is switched OFF for 2 hrs, when the perceived saving is 16%. It has
been observed that for a particular conditioned space these savings are dependent on the
total duration of time for which the AC was switched ON, also the duration for which AC
was switched OFF (when there is no occupancy) and time period of the day when the
building is conditioned (day/ night). With the decrease in the duration for which the AC is
turned OFF, the difference in the actual resulted savings and the perceived savings increase.
In the existing experimental setup, the cooling consumption in Room B where AC is
switched continuously ON for 12 hours is 14.6 kWh per day and in Room A where the AC
is switched OFF for two unoccupied hours is 11.8 kWh per day. Hence there is a saving of
2.75 kWh per day. An initial investment of around INR 1000 would go into the product.
With the electricity cost assumed as INR 6/kWh there would be a saving of INR 16.5 per
day. It is assumed that one sensor would serve an area of about 20 sq m. Since one sensor
would serve the whole experimental room area, the pay back in this case would be around
60days.
20

21
References:
[1] US Dept. of Energy, "2008 Buildings Energy Data Book" (2008), sec 3.1.4
[2] Payam Sudhakaran, “Lights OUT”, Times of India - Hyderabad; April 27, 2007; pp
25.
[3] Floyd, D. et. al. “Measured Field Performance and Energy Savings of
OccupancySensors: Three Case Studies.” FSEC-PF309, 1997. [Online].Available:
http://www.fsec.ucf.edu/en/publications/html/FSEC-PF-309-96/, accessed
11/02/2009
[4] Vishal Garg, N. K. Bansal, “Smart occupancy sensors to reduce energy
consumption,” Volume 32, Issue 1, Energy and Buildings, Elsevier, 2000, pp 81-87.
[5] Thananchai Leephakpreeda, Adaptive Occupancy-based Lighting Control via Grey
Prediction, Building and Environment,Elsevier,2004,881-886
[6] Michael L. Simmons, Robert J.Goldsborough, Automatic room occupancy
controlled fuel savings system for air conditioning/heater units, United States
Patent, Patent No.: 5,538,181, Jul. 23, 1996.
[7] Jia-Ren Chang Chien; Cheng-Chi Tai, The information home appliance control
system - a Bluetooth universal type remote controller, Networking, Sensing and
Control, Volume 1,IEEE International Conference, 2004, pp.399 – 400.
[8] In Gyu Park, The remote control system for the next generation air conditioners,
Consumer Electronics, Issue 1,Volume 47, IEEE Transactions, 2001, pp:168 –178.
[9] Kwan Joo Myoung, Jae Min Lee, Dong-Sung Kim, Wook Hyun Kwon, Home
Network Control Protocol for Networked Home Appliances, Volume 52, IEEE
Transactions on Consumer Electronics,2006, pp.802-810
[10] C. S. Choy, An Infra-Red Remote Control System Designed for Universal
Control, Volume 41, IEEE Transactions on Consumer Electronics, 1995, pp. 1089-
1094,
[11] Data logger and Sensors, www.campbellsci.com.
[12] US Department of Energy, EnergyPlus Energy Simulation Software,
http://apps1.eere.energy.gov/buildings/energyplus/