Embed Size (px)
Citation preview
IPCC andCarbon Management
Responding to Climate Change, Spring 2011
Peter Schlosser, Juerg Matter

The problem• Developed and developing countries are using
increasing amounts of primary energy• Most of this primary energy is produced by burning
of fossil fuel• This has already led to significant increases in the
atmospheric concentrations of the greenhouse gas CO2 accounting for roughly one half of the anthropogenically induced Greenhouse Gas Effect
• Future projections point towards at least doubling of the natural atm CO2 concentrations (560 ppm)
• The projected global warming would be in the vicinity of 3 degrees Celsius (IPCC 2007)

IPCC 2007• Recognizing the problem of potential global climate change, the
World Meteorological Organization (WMO) and the United Nations Environment Programme (UNEP) established the Intergovernmental Panel on Climate Change (IPCC) in 1988. It is open to all members of the UN and WMO.
• The role of the IPCC is to assess on a comprehensive, objective, open and transparent basis the scientific, technical and socio-economic information relevant to understanding the scientific basis of risk of human-induced climate change, its potential impacts and options for adaptation and mitigation. The IPCC does not carry out research nor does it monitor climate related data or other relevant parameters. It bases its assessment mainly on peer reviewed and published scientific/technical literature. Its role, organisation, participation and general procedures are laid down in the "Principles Governing IPCC Work"
http://www.ipcc.ch/index.html

IPCC 2007
http://www.ipcc.ch/SPM2feb07.pdf

IPCC 2007
http://www.ipcc.ch/SPM2feb07.pdf

IPCC 2007
http://www.ipcc.ch/SPM2feb07.pdf

Global Fossil Fuel CO2 emissions
Fossil fuel CO2 emissions based on data of Marland and Boden (DOE, Oak Ridge) and
British Petroleum.Source: Hansen and Sato, PNAS, 98, 14778, 2001.

Global Fossil Fuel CO2 emissions
Global fossil fuel CO2 emissions with division into portions that remain airborne or are soaked up by the ocean and land. Source: Hansen and Sato, PNAS, 101, 16109, 2004.

Primary Energy sources
Source: EIA International Energy Outlook, 2006
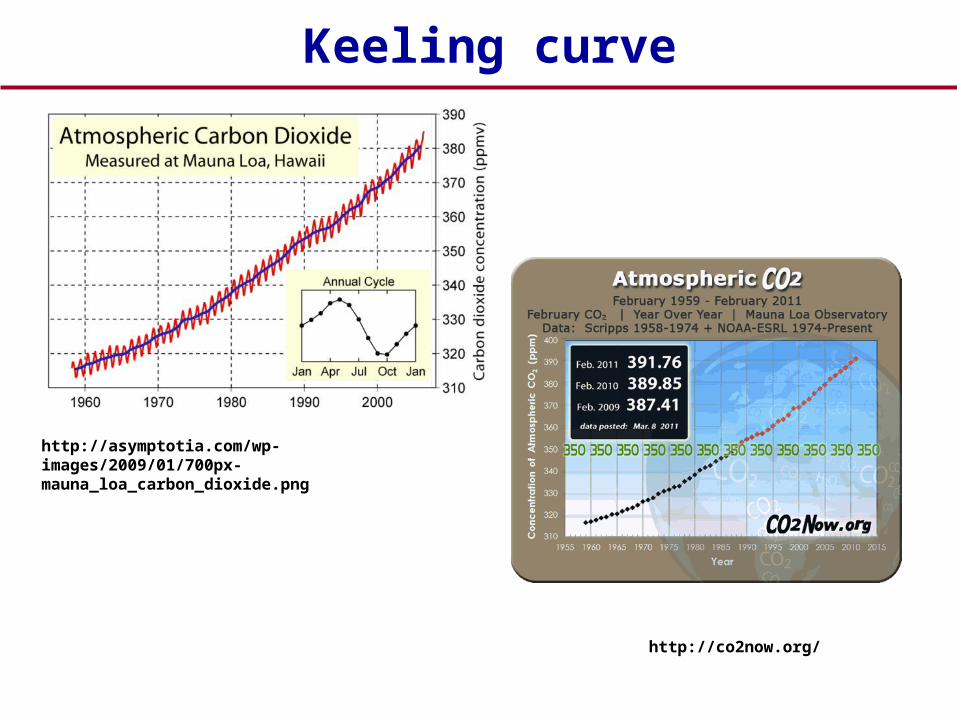
Keeling curve
http://asymptotia.com/wp-images/2009/01/700px-mauna_loa_carbon_dioxide.png
http://co2now.org/

IPCC 2007
http://www.ipcc.ch/SPM2feb07.pdf

IPCC 2007
http://www.ipcc.ch/SPM2feb07.pdf

IPCC 2007
http://www.ipcc.ch/SPM2feb07.pdf

Virgin Earth Challenge
http://www.virginearth.com/

Carbon Capture and Storage
Why And How?
Contributions from
Klaus S. Lackner
Columbia University
Earth Institute
School of Engineering & Applied Sciences
0.01
0.1
1
10
100
100 1000 10000 100000
GDP ($/person/year)
Pri
ma
ry E
ne
rgy
Co
ns
um
pti
on
(k
W/p
ers
on
)
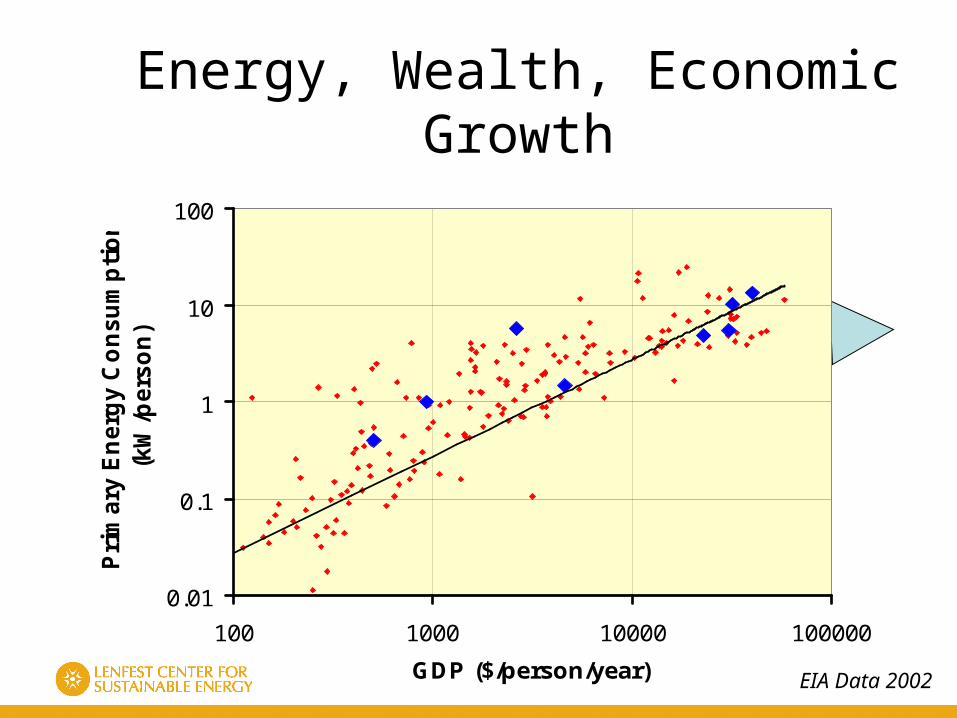
Norway USA France UK
Brazil
Russia
India
China
$0.38/kWh (primary)
Energy, Wealth, Economic Growth
EIA Data 2002

Energy, Wealth, Economic Growth
EIA Data 2002

IPCC Model Simulations of CO2 Emissions

Energy Will Not Run Out
H.H. Rogner, 1997

Fossil Fuel Resources
Source: BP, Stat. Review 2005
bnboe = billion barrels of oil equivalentUSA Total Oil Consumption: 7.5 billion barrels per year

• currently world’s 2nd largest producer and consumer
• 50% of U.S. electricity generation
• total consumption projected to increase ~30% by 2030
U.S. Coal Facts

Coal Facts
fastest growing energy source in the world
plentiful and inexpensive compared to oil and natural gas
10 billion metric tons of CO2 emissions per year (global CO2 emissions are 25 billion metric tons per year)
USA: 154 new 500 megawatt, coal-fired electricity plants between 2005 and 2030
China: Construction of the equivalent of one large coal-fired power plant per week
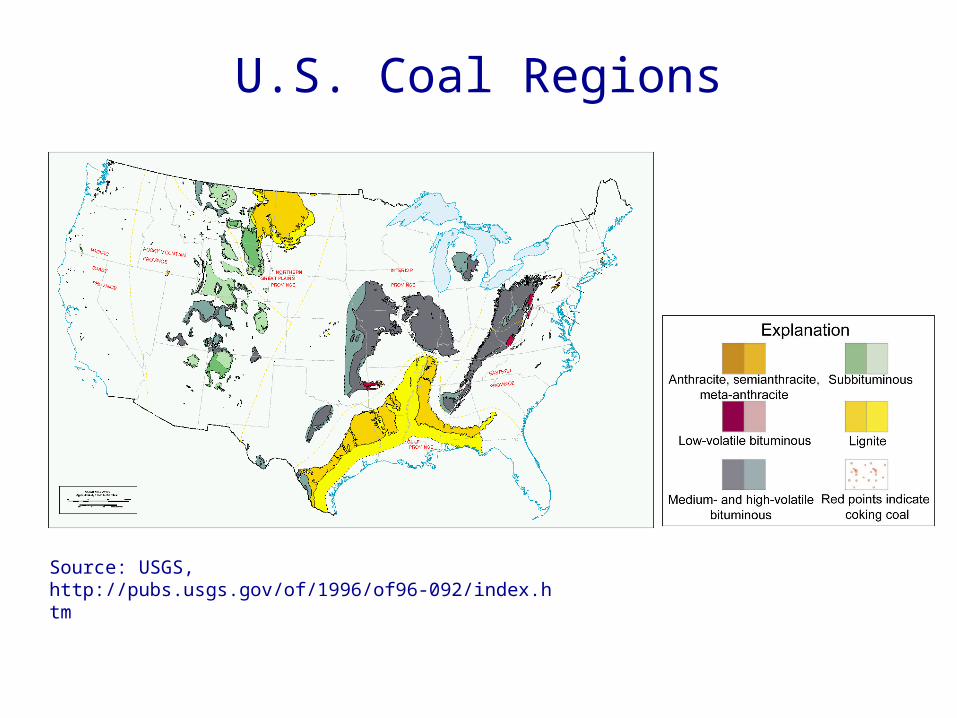
U.S. Coal Regions
Source: USGS, http://pubs.usgs.gov/of/1996/of96-092/index.htm
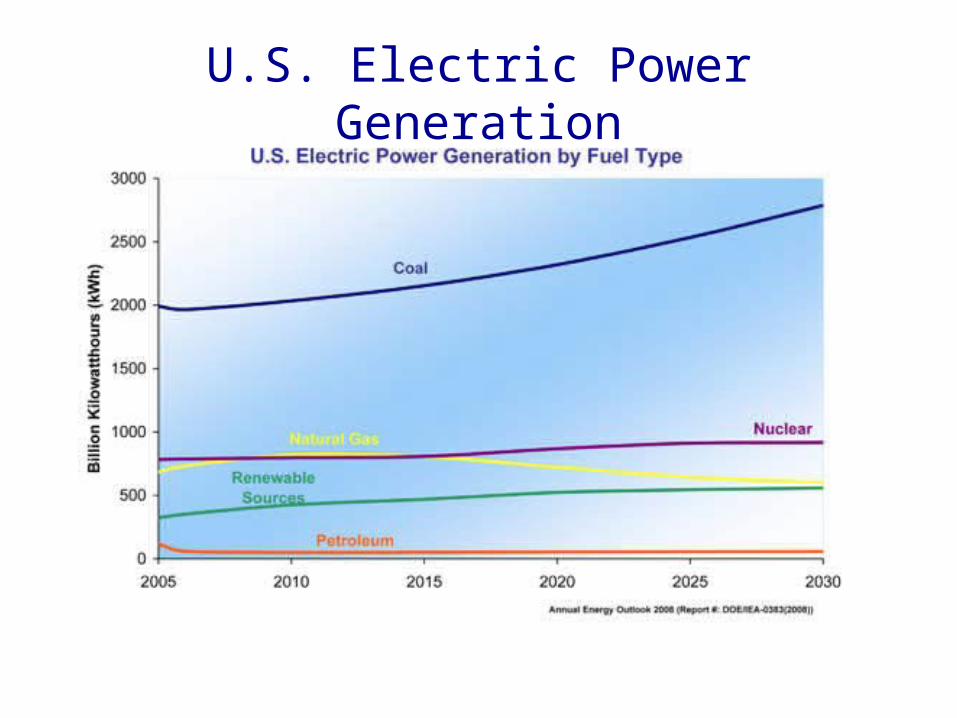
U.S. Electric Power Generation

Cumulative CO2 Emissions
Lifetime fossil fuel emissions from existing and planned power plants by 2030 will be comparable to the sum of all emission from the past 252 years

The Mismatch in Carbon Sources and Sinks
43
1
2
5
1800-
2000
Fossil Carbon Consumption to
date
180ppmincrease in
the air 30% ofthe Oceanacidified
30% increase inSoil Carbon
50%increase
inbiomass
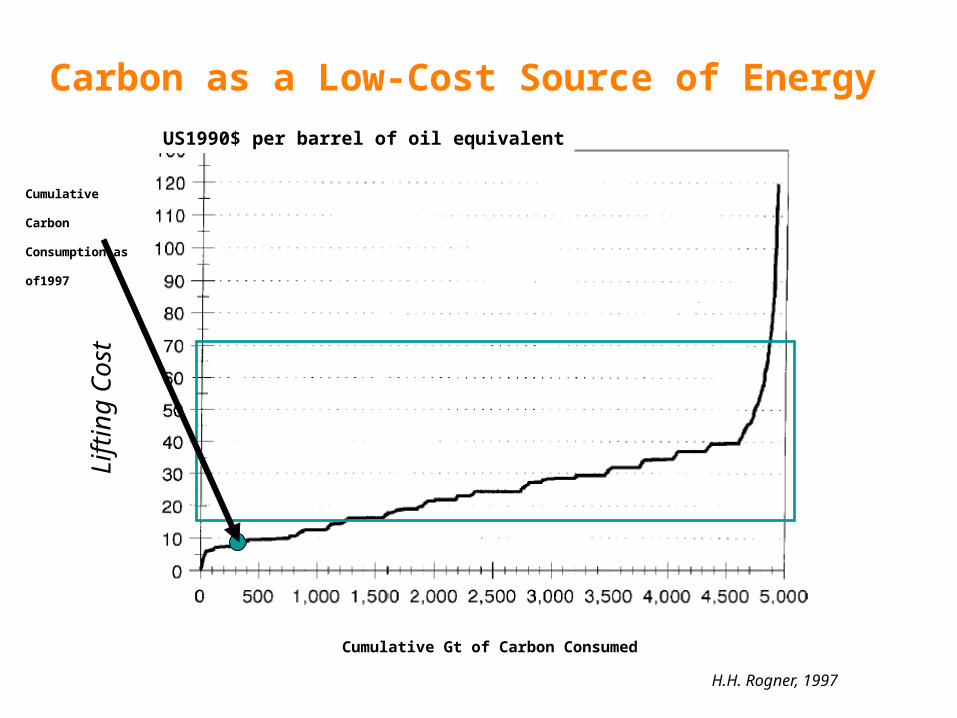
Carbon as a Low-Cost Source of Energy
H.H. Rogner, 1997
Lift
ing
Cost
Cumulative Gt of Carbon Consumed
US1990$ per barrel of oil equivalent
Cumulative
Carbon
Consumption as
of1997

Refining
Carbon
Diesel
Coal
Shale
Fossil fuels are fungible
Tar
Oil
NaturalGas
Jet Fuel
Heat
Electricity
Ethanol
Methanol
DME
Hydrogen
SynthesisGas

The Challenge:Holding the Stock of CO2 constant
Constant emissions at
2010 rate
33% of 2010 rate
10% of 2010 rate
0% of 2010 rate
Extension of
Historic Growth
Rates
560 ppm
280 ppm

What do we know?• Demand for energy services will grow
– Increased demand can be accommodated
• Environmental constraints will tighten– Bigger output, less tolerance for pollution– Climate change threat
• Cost of carbon dioxide emissions will rise– Very difficult to saturate demand for CO2 emission reductions

What do we not know?• Price of carbon
– Form of regulation is highly uncertain– Time line is difficult to estimate
• could be very fast• Tipping point has been reached
• Price of oil and gas– Are we at Hubbert’s Peak?– Gas could last much longer than thought
• Deep sources, hydrates• Technology Advances
– Fuel cells, Carbon Capture and Storage, Nuclear• Ultimate Efficiency and Energy Intensity
– Surprises could go both ways
M. King Hubbert's original 1956 prediction of world petroleum production rates

Options• Greater efficiency / Reduction in consumption• Change fuel mix • Substitute renewables for fossil fuels• Nuclear• Carbon capture and storage
Introduction of Carbon Free Sources• Renewable Energy
– Hydro Electricity– Tides and Waves– Wind– Geothermal– Biomass– Waste Energy– Solar Energy
• Nuclear Energy– Fission– Fusion
Driven by Fossil Fuel Pricesand
Carbon Price

Stabilization Wedges - A Concept and Game
"Stabilization Wedges: Solving the Climate Problem for the next 50 Years with Current Technologies,” S. Pacala and R. Socolow, Science, August 13, 2004.

Billions of Tons Carbon Emitted per Year
Historical emissions
0
8
16
1950 2000 2050 2100
Historical Emissions
Source: Carbon Mitigation Initiative

1.6
Interim Goal
Billions of Tons Carbon Emitted per Year
Historical emissions Flat path
Stabilization Triangle
0
8
16
1950 2000 2050 2100
The Stabilization Triangle
Source: Carbon Mitigation Initiative

1.6
Interim Goal
Billions of Tons Carbon Emitted per Year
Historical emissions Flat path
Stabilization Triangle
0
8
16
1950 2000 2050 2100
The Stabilization Triangle
Tougher CO2 target
~500 ppm
~850 ppm
Easier CO2 target
Source: Carbon Mitigation Initiative

1.6
Billions of Tons Carbon Emitted per Year
Current p
ath = “ramp”
Historical emissions Flat path
0
8
16
1950 2000 2050 2100
16 GtC/y
Eight “wedges”
Goal: In 50 years, sameglobal emissions as today
The Stabilization Triangle
Source: Carbon Mitigation Initiative

What is a “Wedge”?A “wedge” is a strategy to reduce carbon emissions that grows in 50 years from zero to 1.0 GtC/yr. The strategy has already been commercialized at scale somewhere.
1 GtC/yr
50 years
Total = 25 Gigatons carbon
Cumulatively, a wedge redirects the flow of 25 GtC in its first 50 years.
A “solution” to the CO2 problem should provide at least one wedge.

Energy Efficiency & Conservation (4)
CO2 Capture & Storage (3)
Stabilization Triangle
Renewable Fuels& Electricity (4)
Forest and Soil Storage (2)
Fuel Switching(1)
15 Wedge Strategies in 4 Categories
Nuclear Fission (1)
2007 20578 GtC/y
16 GtC/y
TriangleStabilization
Source: Carbon Mitigation Initiative
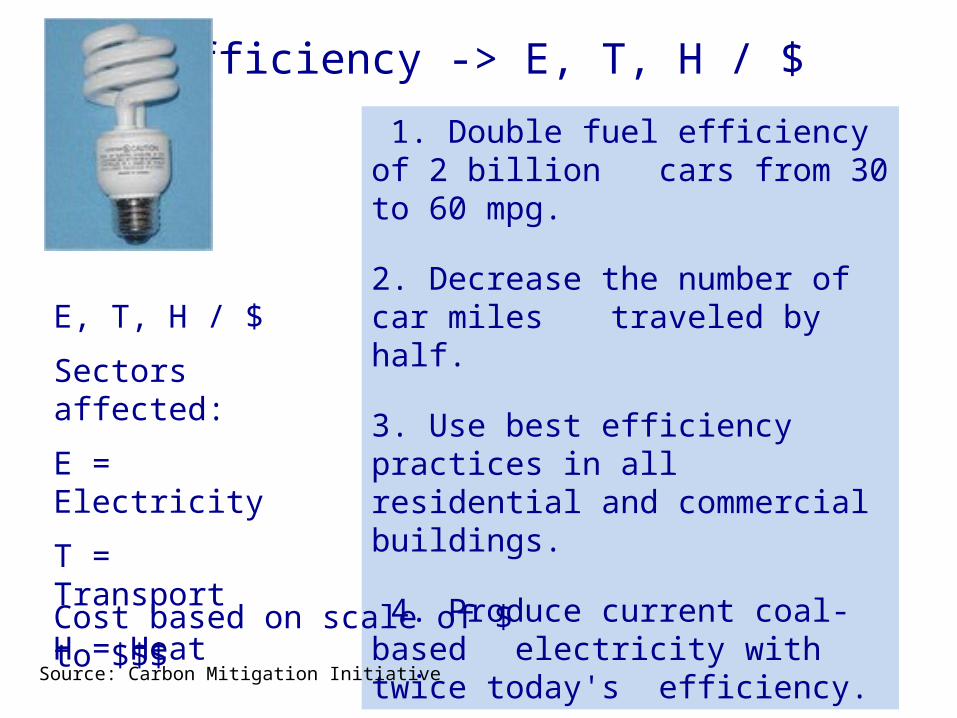
Efficiency -> E, T, H / $
1. Double fuel efficiency of 2 billion cars from 30 to 60 mpg.
2. Decrease the number of car miles traveled by half.
3. Use best efficiency practices in all residential and commercial buildings.
4. Produce current coal-based electricity with twice today's efficiency.
E, T, H / $
Sectors affected:
E = Electricity
T = Transport
H = Heat
Cost based on scale of $ to $$$
Source: Carbon Mitigation Initiative

Fuel Switching -> E, H / $
Photo by J.C. Willett (U.S. Geological Survey).
Substitute 1400 natural gas electric plants for an equal number of coal-fired facilities.
Requires an amount of natural gas equal to that used for all purposes today.
Source: Carbon Mitigation Initiative

Carbon Capture and Storage (CCS) -> E, T, H / $$
Graphic courtesy of Alberta Geological Survey
Implement CCS:
• 800 GW coal electric plants or
• 1600 GW natural gas electric plants or
• 180 coal synfuels plants or
• 10 times today’s capacity of hydrogen plants
There are currently three CCS projects that inject 1 million tons of CO2 per year.
We need 3500 CCS projects by 2055.Source: Carbon Mitigation Initiative

Nuclear Electricity -> E / $$
Triple the world’s nuclear electricity capacity by 2055
The rate of installation required for a wedge from electricity is equal to the global rate of nuclear expansion from 1975 – 1990.
Source: Carbon Mitigation Initiative

Wind Electricity -> E, T, H / $-$$
Install 1 million 2 MW windmills to replace coal-based
electricity
Use 2 million windmills to produce hydrogen fuel
A wedge worth of wind electricity will require increasing current capacity by a factor of 30.
Source: Carbon Mitigation Initiative
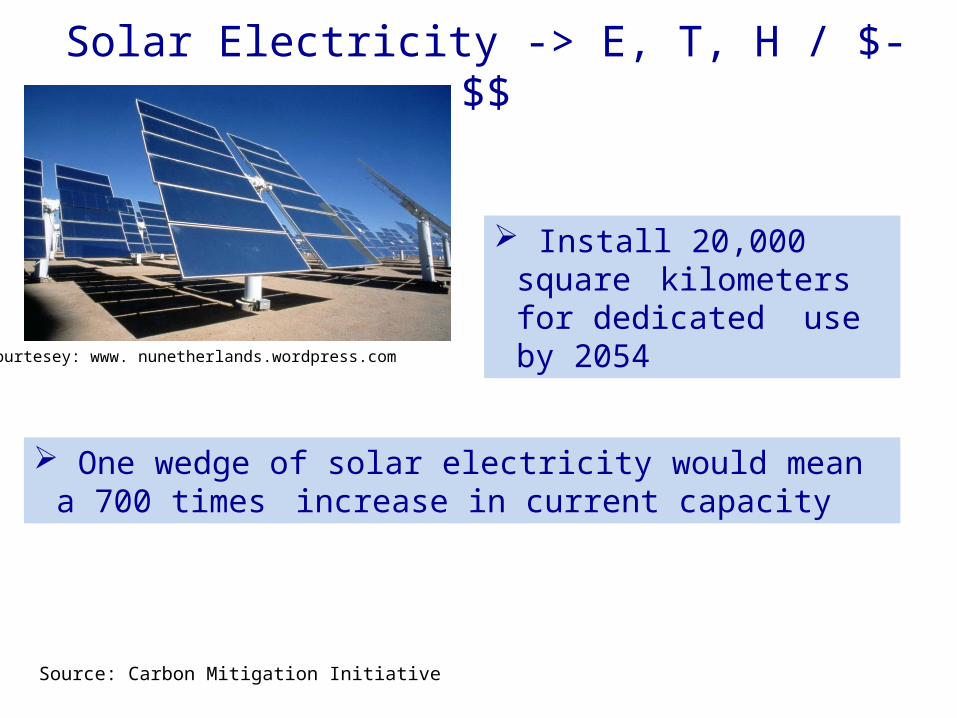
Solar Electricity -> E, T, H / $-$$
Courtesey: www. nunetherlands.wordpress.com
Install 20,000 square kilometers for dedicated
use by 2054
One wedge of solar electricity would mean a 700 times increase in current capacity
Source: Carbon Mitigation Initiative
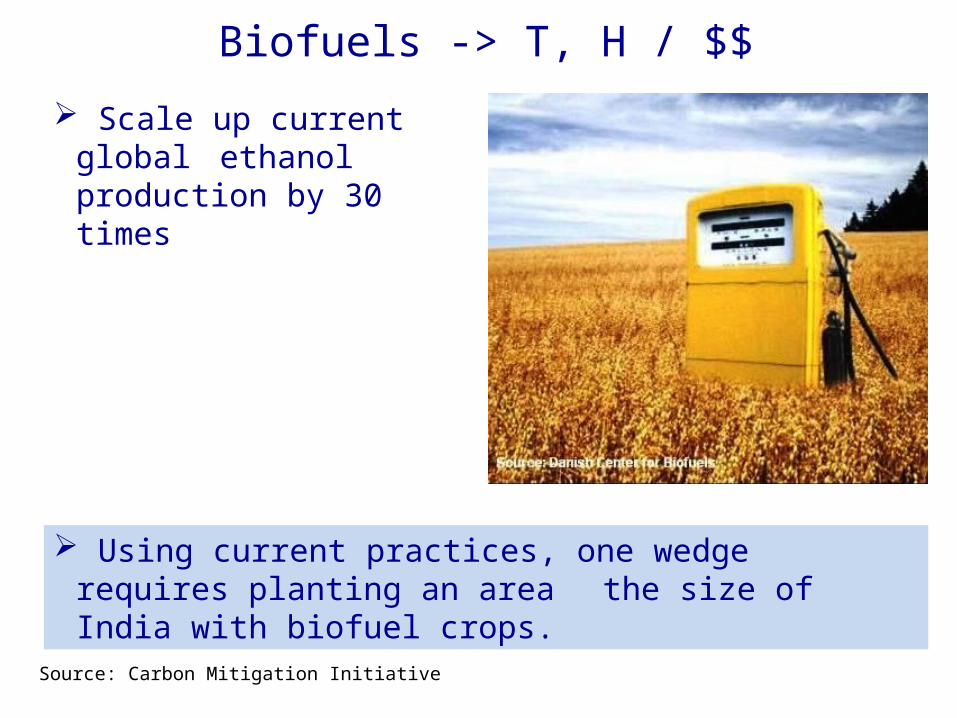
Biofuels -> T, H / $$
Scale up current global ethanol production by 30 times
Using current practices, one wedge requires planting an area the size of India with biofuel crops.
Source: Carbon Mitigation Initiative
Carbon Capture and Storage• Capture at the plant• Capture from the air• Long term disposal
Driven solely by carbon price
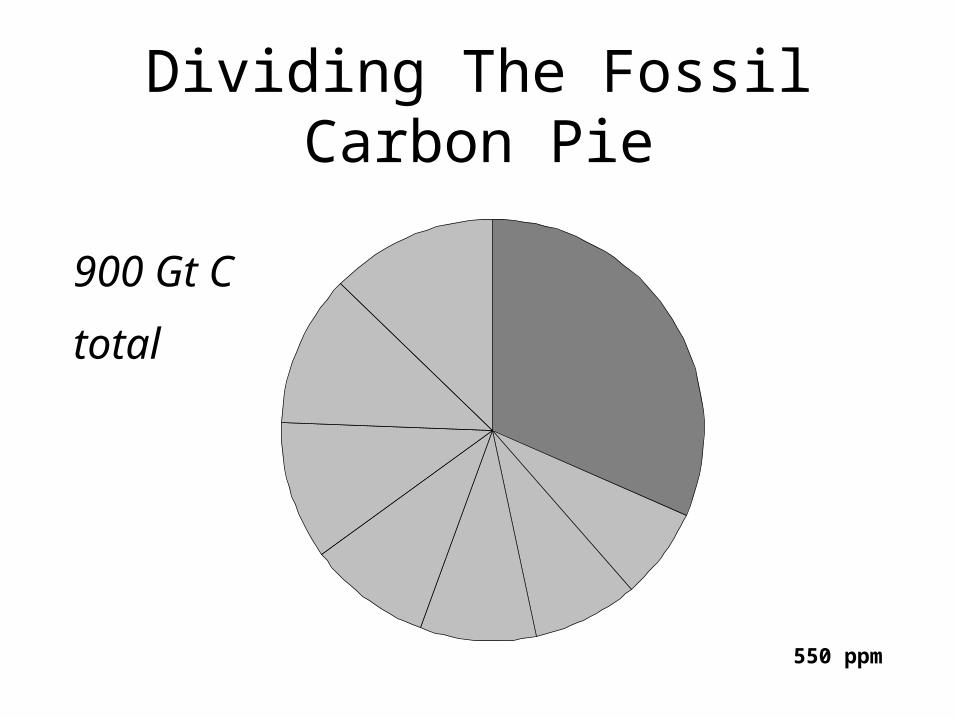
Dividing The Fossil Carbon Pie
900 Gt C
total
550 ppm
Past
10yr

Removing the Carbon Constraint
5000 Gt C
totalPast

Options exist• Triad of large options• Myriad small contributors
How does one create the right incentives?

A Triad of Large Scale Options
• Solar– Cost reduction and mass-manufacture
• Nuclear– Cost, waste, safety and security
• Fossil Energy– Zero emission, carbon storage and
interconvertibility
Markets will drive efficiency, conservation and alternative energy

Small Energy Resources• Biomass
– Sun and land limited
• Wind– Stopping the air over Colorado every day?
• Geothermal– Geographically limited
• Tides, Waves & Ocean Currents– Less than human power generation
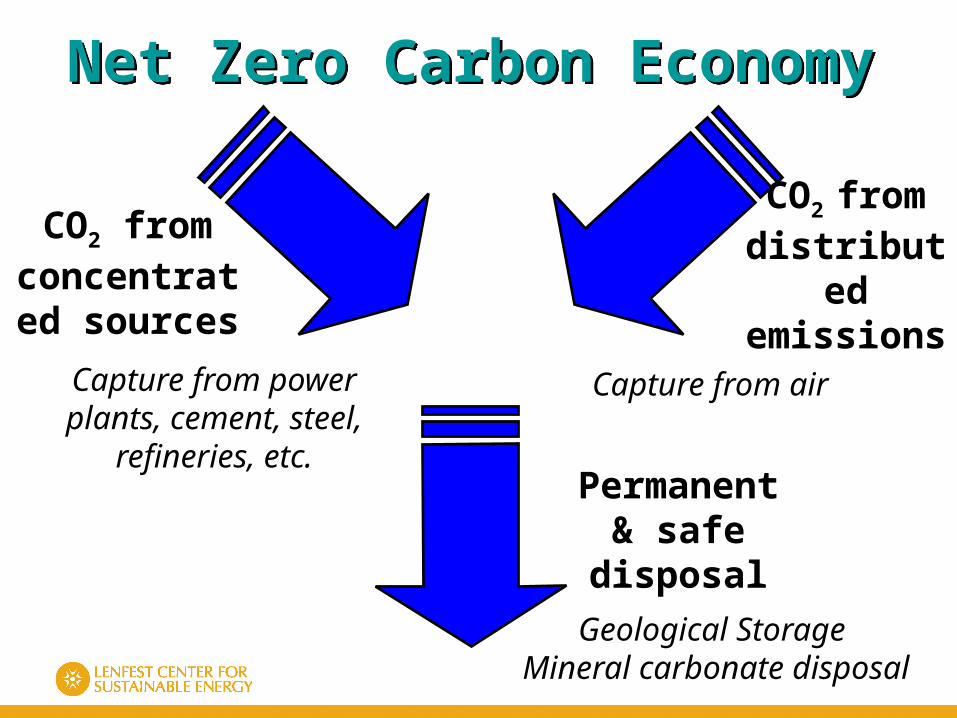
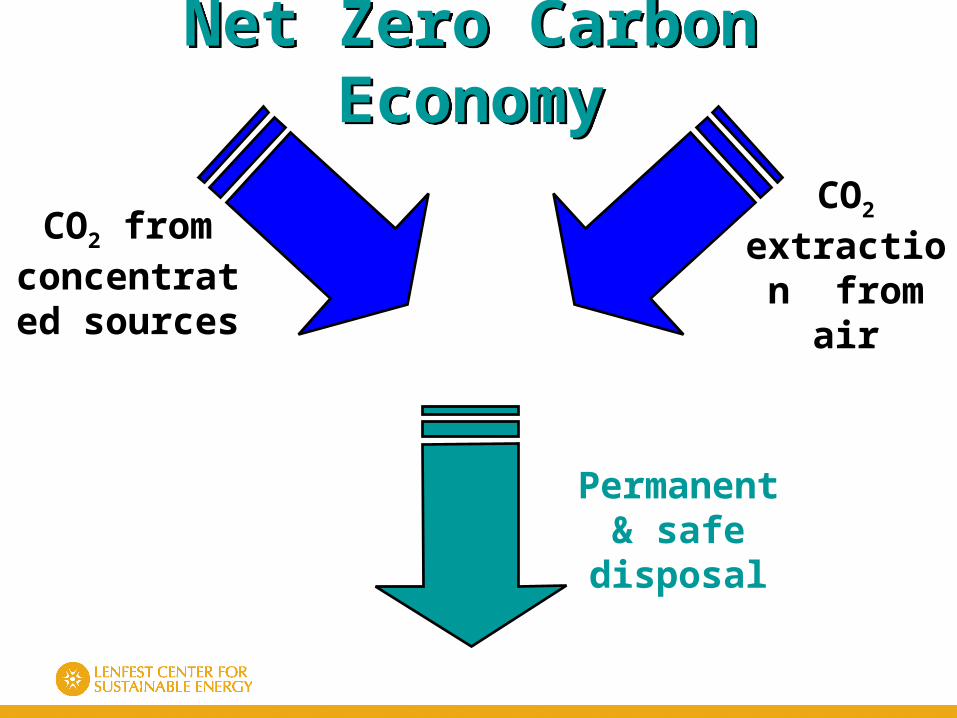
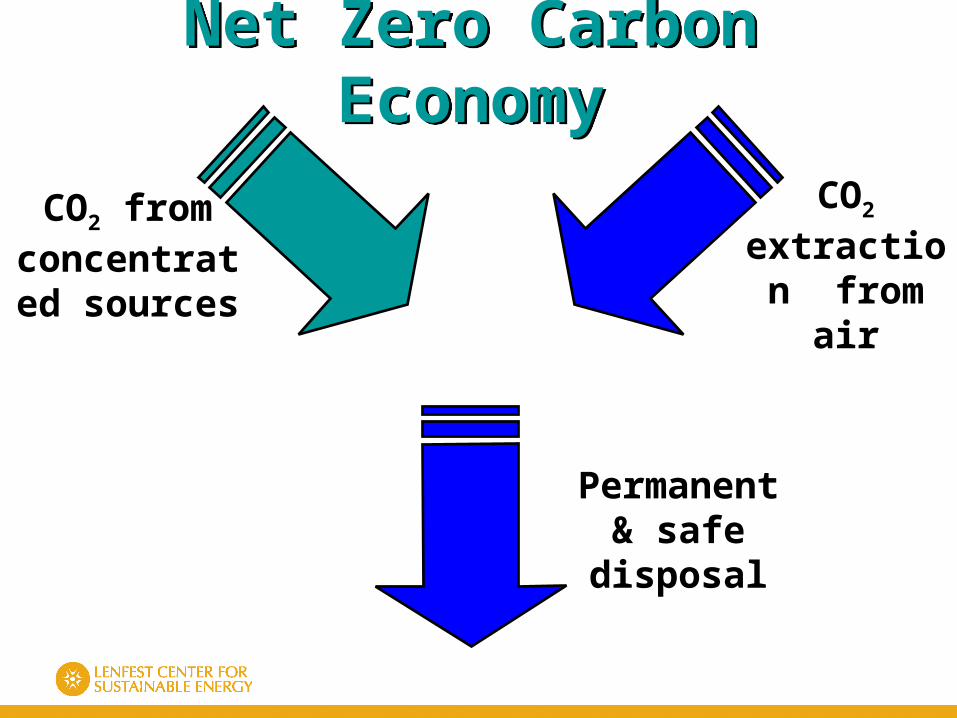
Net Zero Carbon EconomyNet Zero Carbon Economy
CO2 from distributed emissions
Permanent & safe disposal
CO2 from concentrated
sources
Capture from power plants, cement, steel,
refineries, etc.
Geological Storage Mineral carbonate disposal
Capture from air
CO2
extraction from air
Permanent & safe disposal
CO2 from concentrated
sources
Net Zero Carbon EconomyNet Zero Carbon Economy

Lake Michigan
21st century carbon dioxide emissions could exceed the mass of water in Lake Michigan
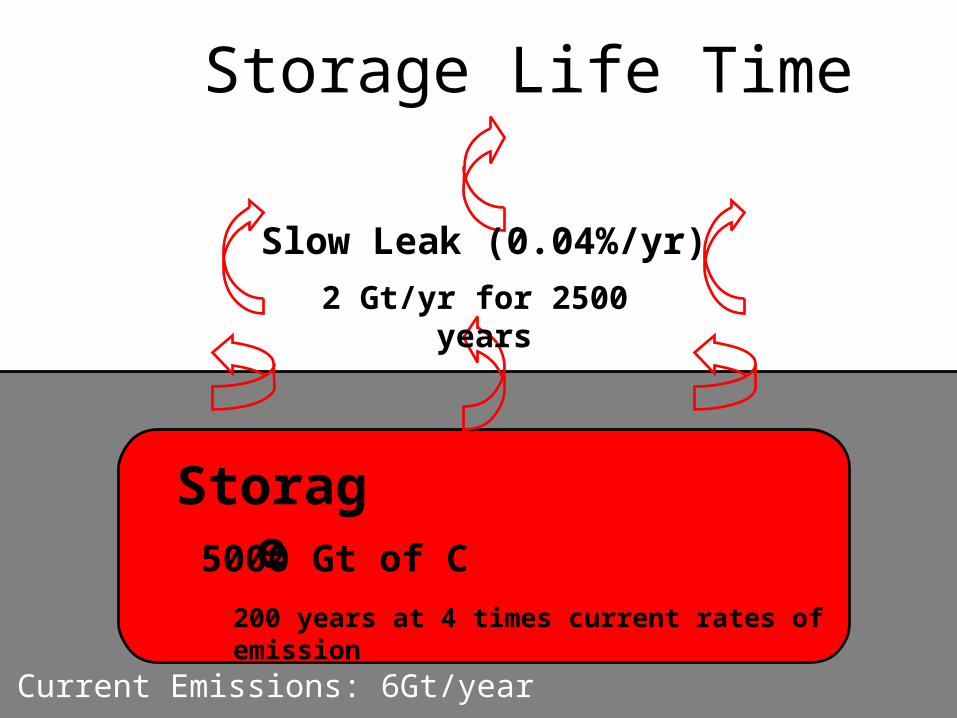
Storage Life Time
5000 Gt of C
200 years at 4 times current rates of emission
Storage
Slow Leak (0.04%/yr)
2 Gt/yr for 2500 years
Current Emissions: 6Gt/year

Underground Injection
statoil
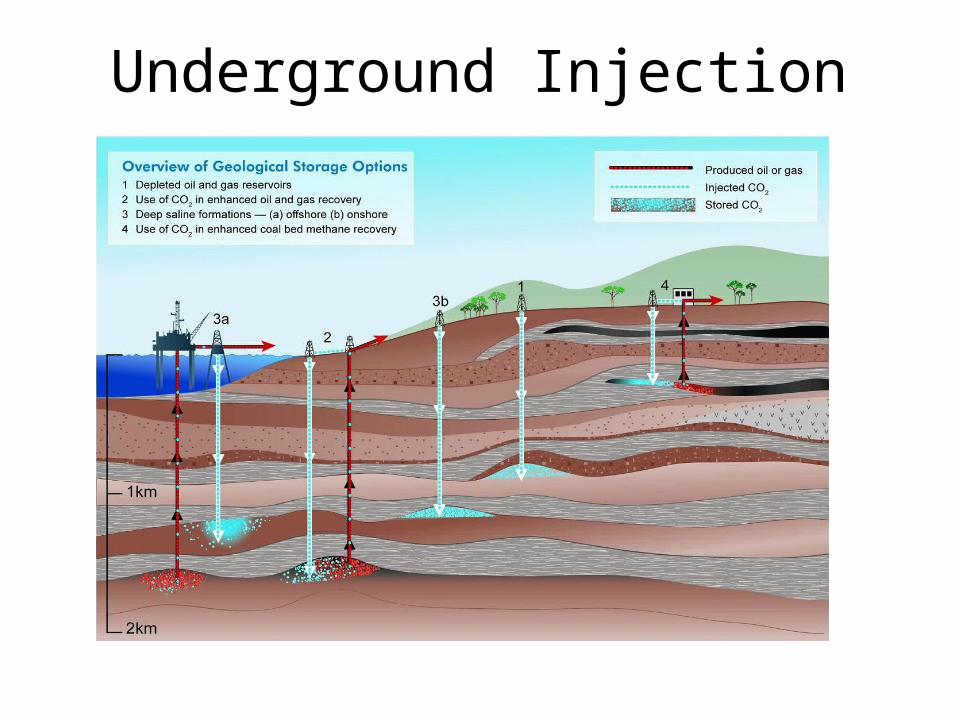
Underground Injection

US Geologic Storage Capacity
Assumption: only 1 – 4% of geologic capacity can be used for CO2 storage.
total estimated geological CO2 storage: 3,600 – 12,900 billion tons of CO2.
To put that in perspective, the United States’ current annual CO2 emissions are about ~ 7 billion tons per year.

Source: www.westcarb.org
Risk of Leakage

Killer Lake
In 1986, an explosion of CO2 from Lake Nyos, West of Cameroon, killed more than 1700 people and livestock up to 25 km away. Two lakes still contain large amounts of CO2 (10 and 300 millions m3 in Monoun and Nyos, respectively)

Gravitational TrappingSubocean Floor Disposal
With Buoyancy Cap

Locations for injections

Energy States of Carbon
Carbon
Carbon Dioxide
Carbonate
400 kJ/mole
60...180 kJ/mole
The ground state of carbon is a mineral
carbonate
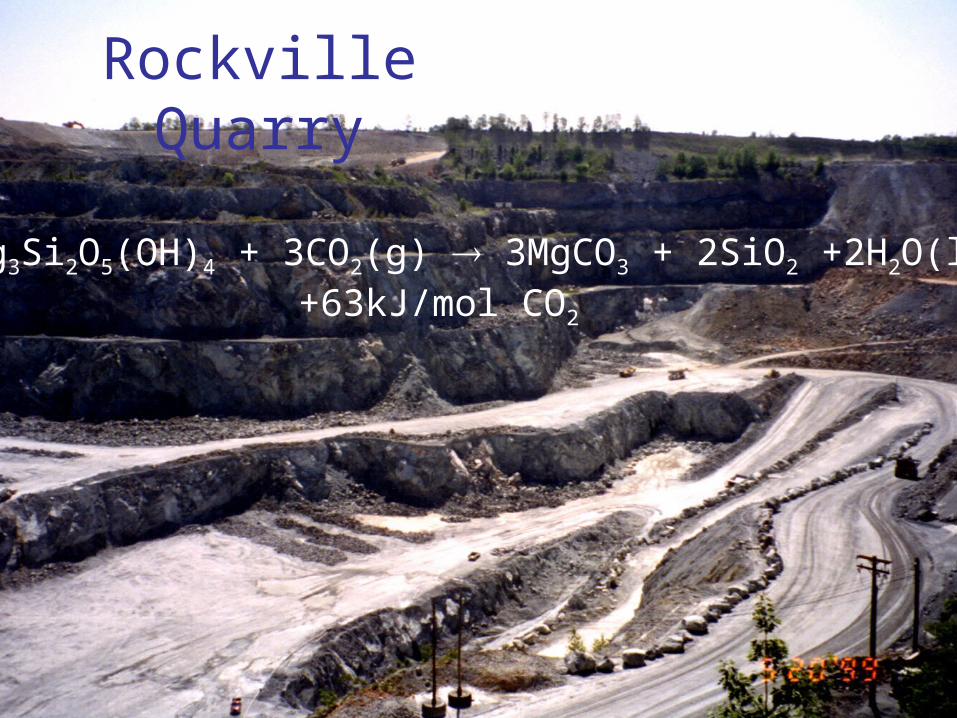
Rockville Quarry
Mg3Si2O5(OH)4 + 3CO2(g) 3MgCO3 + 2SiO2 +2H2O(l)+63kJ/mol CO2

IPCC, 2005: Carbon Capture and Storage Special Report
CO2
extraction from air
Permanent & safe disposal
CO2 from concentrated
sources
Net Zero Carbon EconomyNet Zero Carbon Economy

CO2 N2
H2OSOx, NOx and
other Pollutants
Carbon
Air
Zero Emission Principle
Solid Waste
Power Plant
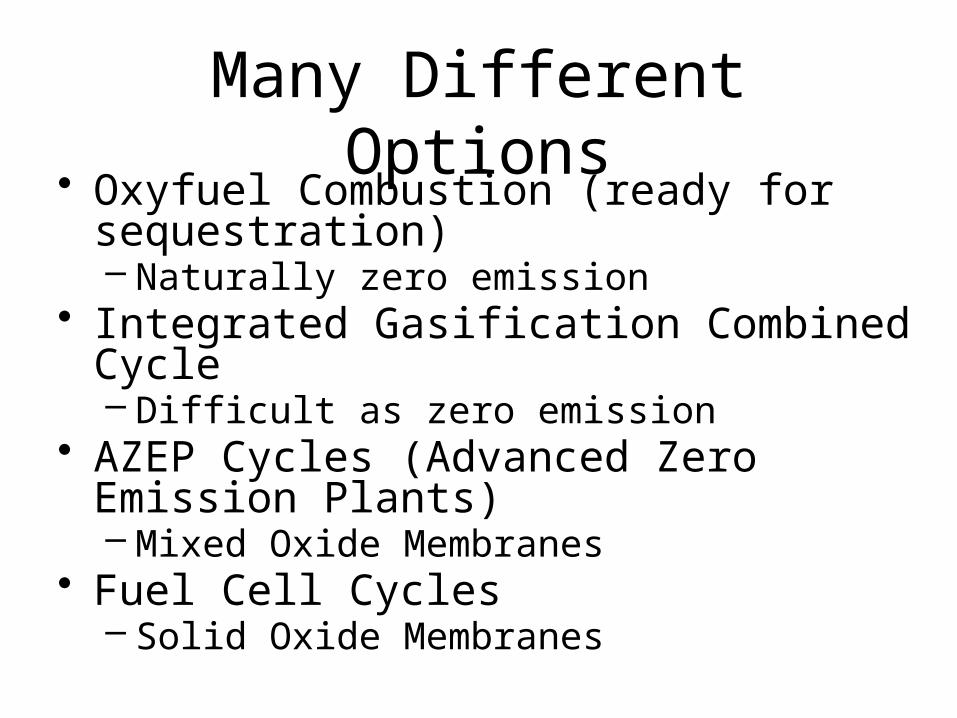
Many Different Options
• Oxyfuel Combustion (ready for sequestration)– Naturally zero emission
• Integrated Gasification Combined Cycle– Difficult as zero emission
• AZEP Cycles (Advanced Zero Emission Plants)– Mixed Oxide Membranes
• Fuel Cell Cycles– Solid Oxide Membranes

Hydrogenation

CO2
extraction from air
Permanent & safe disposal
CO2 from concentrated
sources
Net Zero Carbon EconomyNet Zero Carbon Economy

Relative size of a tank
Electrical, mechanical
storage
Batteries etc.
hydrogen
gasoline

Air Flow
Ca(OH)2 Calcium hydroxide solution
CO2 diffusion
CO2 mass transfer is limited by diffusion in air boundary layer
Ca(OH)2 as an absorbent
CaCO3 precipitate

CO2
1 m3of Air
40 moles of gas, 1.16 kg
wind speed 6 m/s
0.015 moles of CO2
produced by 10,000 J of gasoline
2
20 J2
mv
Volumes are drawn to scale
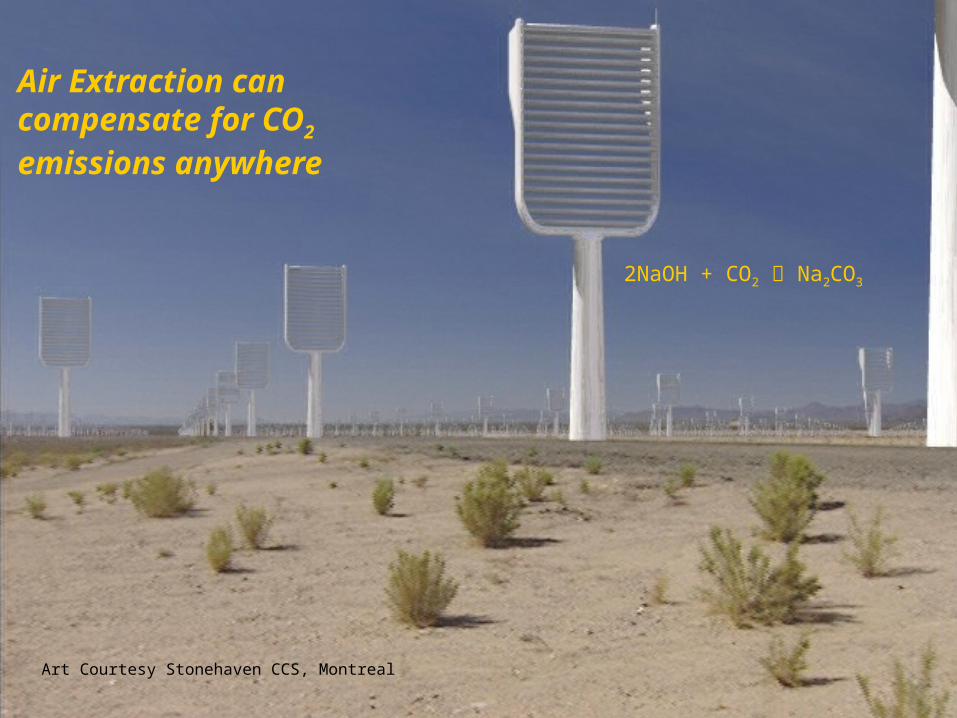
Air Extraction can compensate for CO2 emissions anywhere
Art Courtesy Stonehaven CCS, Montreal
2NaOH + CO2 Na2CO3
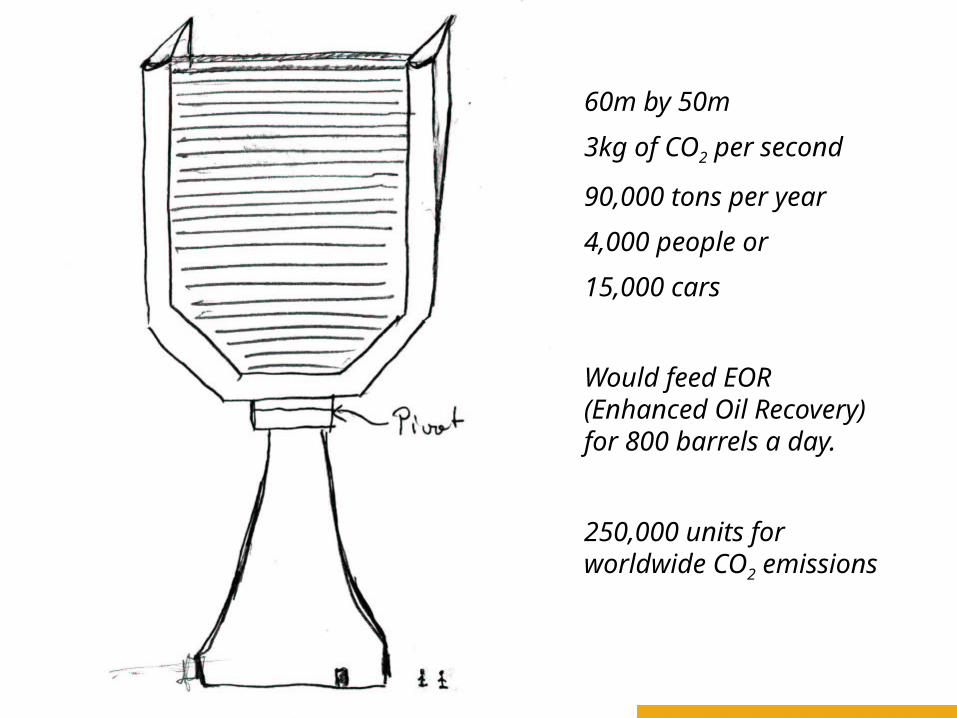
60m by 50m
3kg of CO2 per second
90,000 tons per year
4,000 people or
15,000 cars
Would feed EOR (Enhanced Oil Recovery) for 800 barrels a day.
250,000 units for worldwide CO2 emissions
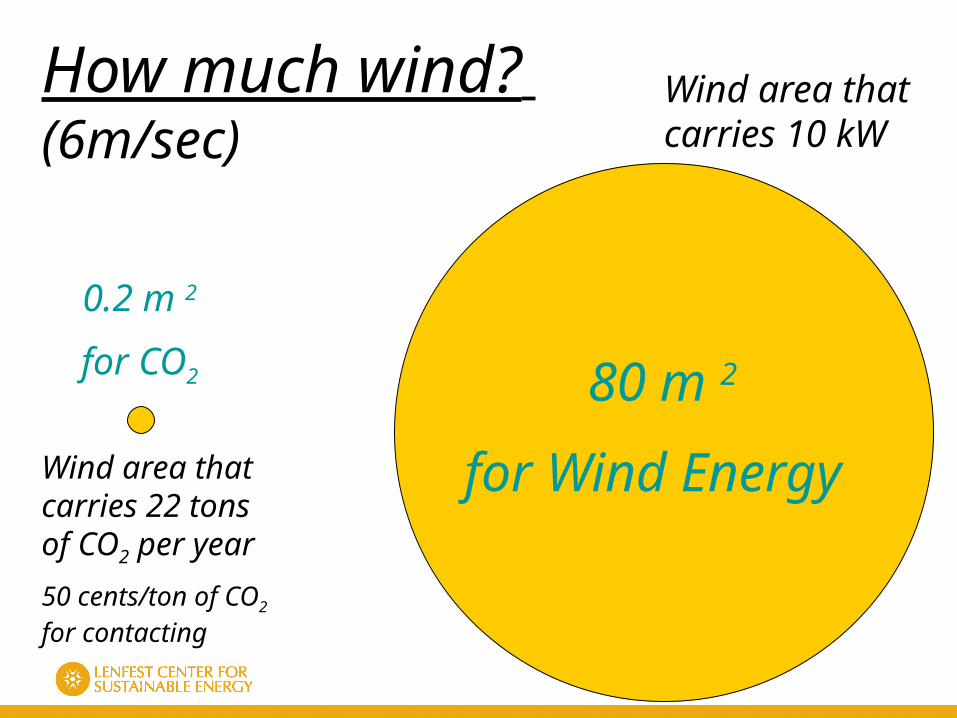
Wind area that carries 22 tons of CO2 per year
Wind area that carries 10 kW
0.2 m 2
for CO2 80 m 2
for Wind Energy
How much wind? (6m/sec)
50 cents/ton of CO2 for contacting

Hydrogen or Air Extraction?
Coal,Gas Fossil Fuel Oil
Hydrogen Gasoline
Consumption Consumption
Distribution Distribution
CO2 Transport Air Extraction
CO2 Disposal
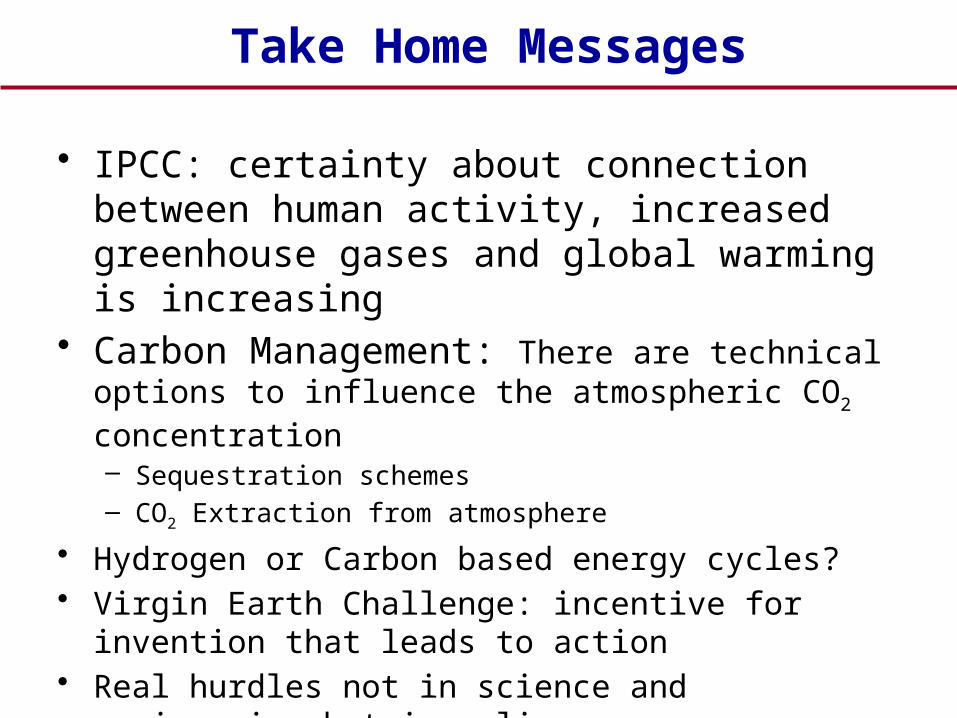
Take Home Messages
• IPCC: certainty about connection between human activity, increased greenhouse gases and global warming is increasing
• Carbon Management: There are technical options to influence the atmospheric CO2 concentration– Sequestration schemes– CO2 Extraction from atmosphere
• Hydrogen or Carbon based energy cycles?• Virgin Earth Challenge: incentive for invention that leads to
action• Real hurdles not in science and engineering but in policy