Embed Size (px)
Citation preview

IP portfolios and evolution of biomedical additivemanufacturing applications
Amy J. C. Trappey1 • Charles V. Trappey2 •
Curry L. S. Chung1
Received: 4 February 2016 / Published online: 10 February 2017� Akademiai Kiado, Budapest, Hungary 2017
Abstract Additive manufacturing (AM) or 3D printing includes techniques capable of
manufacturing regular and irregular shapes for small batches of customized products. The
ability to customize unusual shapes makes the process particularly suitable for prosthetic
products used in biomedical applications. AM adoption in the field of biomedical appli-
cations (called bio-AM in this research) has seen significant growth over the last few years.
This research develops an Intellectual Property (IP) analytical methodology to explore the
portfolios and evolution of patents, as well as their relevance to Taiwan’s Ministry of
Science and Technology (MOST) research projects in bio-AM domain. Specifically, global
and domestic IP portfolios for bio-AM innovations are studied using the proposed method.
First, the domain documents (of US patents and MOST projects) are collected from a
global patent database and MOST project database. The key term frequency counts and
technical clustering analysis of the collected documents are derived. The key terms and
appearance frequencies in documents form the basis for document clustering and similarity
analysis. The ontology of bio-AM is constructed based on the clustering results. Finally,
the patents and projects in the adjusted clusters are subject to evolution analysis using
concept lattice analysis. This research provides a computer supported IP evolution analysis
system, based on the developed algorithms, for the decision support of IP and R&D
strategic planning.
& Amy J. C. [email protected]
Charles V. [email protected]
Curry L. S. [email protected]
1 Department of Industrial Engineering and Engineering Management, National Tsing HuaUniversity, Hsinchu, Taiwan
2 Department of Management Science, National Chiao Tung University, Hsinchu, Taiwan
123
Scientometrics (2017) 111:139–157DOI 10.1007/s11192-017-2273-6

Keywords Additive manufacturing � 3D printing � Biomedical � Patent analysis �Ontology � Evolution analysis
Introduction
Additive manufacturing (AM) is a technology used to print three dimensional (3D) objects
via an ongoing process of material additions. By using 3D digital modeling data, the 3D
objects are constructed through layer-by-layer material adherences. The advantage of 3D
printing (or AM) is the ability to fabricate irregular shaped objects with a high degree of
curvature and/or void spaces within the object. AM is currently restricted to the production
of small batches of products. Small batch manufacturing, however, is not necessarily a
hindrance for prosthetic products used in medical applications since many objects are
custom made, one of the kind, for individual patients.
The worldwide market for bio-AM (i.e., 3D printing in medical applications) is
expected to reach US 1 billion dollars by 2019 (Transparency Market Research 2013). The
applications of bio-AM have created unique business opportunities with intense compe-
tition emerging across the industry. Strategically realizing sustainable opportunities in the
bio-AM market requires that companies search for effective strategies to develop and apply
technologies within time, within budget constraints, and without infringing upon the
intellectual property (IP) of others. The common approach used to accomplish these goals
begins with patent analysis. Patent documents contain important research results (the
ability to reconstruct the invention by a person knowledgeable in the art) which is of great
value to industry, legal researchers, and policy advocates in science and technology R&D
(Tseng et al. 2007). Since patents provide legal protection for the IP owners, these
intangible rights may be licensed for creating a continuous revenue stream, sold to others
for substantial profits, or used to enhance the brand values of the patent assignees and
licensees. Hence, planning an appropriate patent strategy is important for a technology
company to leverage its IP rights, to create patent portfolios for better management, to
enhance the value of the firm, and to secure inventions from possible IP infringement
litigation.
This research focuses on developing an innovative methodology to analyze a company’s
IP portfolio, compare the critical strength and position relative to its competitors (Narin
et al. 1987), identify the domain technology evolution, and trace the technology pathways
of the past, current, and future developments (Zhou et al. 2014). In our case study, a unique
patent analytical method is applied to study global and domestic portfolios and the evo-
lution of bio-AM technologies archived in the USPTO patent database and the database of
Taiwan Ministry of Science and Technology (MOST) funded research proposals. The
MOST bio-AM proposals are evaluated against the global bio-AM patent trends. For the
study, R statistical programs are used for text mining and cluster analysis. The normalized
term frequency-inverse document frequency (NTF–IDF) is the measure for evaluating the
importance of extracted key terms. The computer assisted R-program system counts the
normalized term frequencies (NTF) and inverse document frequencies (IDF) across all
documents and constructs a NTF–IDF matrix. The research calculates the correlations
between all pairs of documents, based on the common term frequencies, as the inputs for
clustering algorithms. The K means, K medoids, and Ward’s hierarchical algorithms are
used to cluster the documents. The R package cValid (Brock et al. 2008) is applied to
140 Scientometrics (2017) 111:139–157
123
evaluate the performance and select the best clustering results. The graphical clustered
concept evolution is derived using a modified formal concept analysis (MFCA or called
concept lattice) algorithm. The proposed approach provides an objective basis to recom-
mend, within the given knowledge domain, which research development strategies should
be considered as being competitive, potentially profitable, and clear of infringement lia-
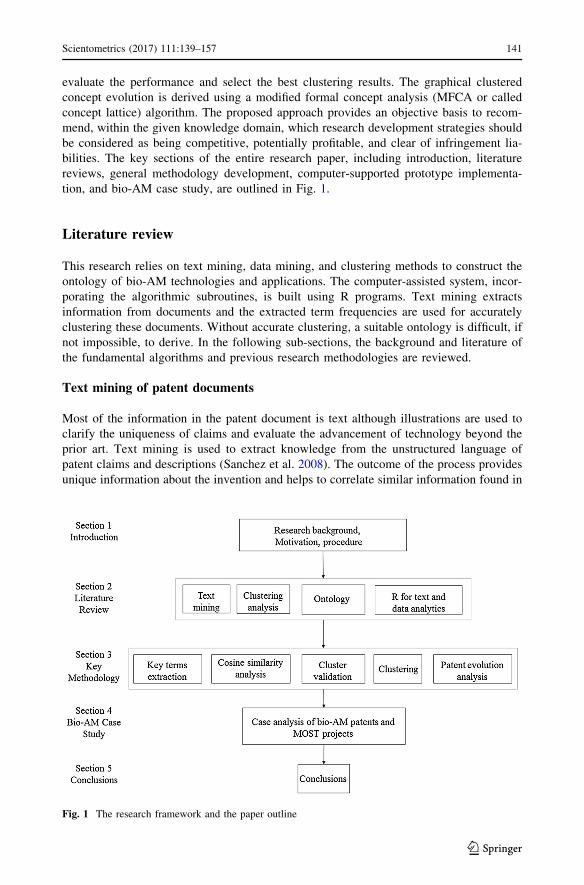
bilities. The key sections of the entire research paper, including introduction, literature
reviews, general methodology development, computer-supported prototype implementa-
tion, and bio-AM case study, are outlined in Fig. 1.
Literature review
This research relies on text mining, data mining, and clustering methods to construct the
ontology of bio-AM technologies and applications. The computer-assisted system, incor-
porating the algorithmic subroutines, is built using R programs. Text mining extracts
information from documents and the extracted term frequencies are used for accurately
clustering these documents. Without accurate clustering, a suitable ontology is difficult, if
not impossible, to derive. In the following sub-sections, the background and literature of
the fundamental algorithms and previous research methodologies are reviewed.
Text mining of patent documents
Most of the information in the patent document is text although illustrations are used to
clarify the uniqueness of claims and evaluate the advancement of technology beyond the
prior art. Text mining is used to extract knowledge from the unstructured language of
patent claims and descriptions (Sanchez et al. 2008). The outcome of the process provides
unique information about the invention and helps to correlate similar information found in
Fig. 1 The research framework and the paper outline
Scientometrics (2017) 111:139–157 141
123

other patents (Sullivan 2001). Text mining technology is often used in combination with
term frequency analysis and the approach is divided into text refining and knowledge
distillation. Text refining transforms free form text documents into an intermediate form,
and knowledge distillation derives patterns or knowledge from the intermediate form (Tan
1999). Text mining requires a substantial number of text documents to create statistically
valid relationships and provide a sufficient pool of term frequencies to analyze and match
the results of patent analysis. Common patent analysis methods include categorical anal-
ysis, cluster analysis, and relational analysis.
Most text mining methods are based on words, but the existence of synonyms and
polysemy affects the results unless controlled. Zhong et al. (2012) present an effective
pattern discovery technique to improve the effectiveness of the text mining technique. The
first step of text mining begins with data pre-processing (Mierswa et al. 2006) and the basic
text processing steps (Te Liew et al. 2014) include importing and classifying text files,
transforming upper and lower cases, creating tokens (e.g., the terms ‘greenhouse gases’ and
‘greenhouse gas’ are replaced with the token ‘GHG’), splitting text into a sequence of
tokens, filtering English stop-words, filtering user defined stop-words, and generating
n grams (n grams are a contiguous sequence of n objects used to capture phrases from the
text).
After data pre-processing, methods to count term frequencies, variance, and term fre-
quency—inverse density frequency (TF-IDF) are used to extracted keywords from patent
documents. Lee et al. (2009) conducted variance and frequency comparison analyses to
extract keywords. A high variance means that a keyword has a high frequency in specific
documents and a low frequency in other documents, and better identifies the technical
features of patent documents (Bermudez-Edo et al. 2015).
Clustering
Clustering is used as an unsupervised learning method with the goal to discover a new set
of categories (Maimon and Rokach2005). For practical clustering, the goal is to minimize
the distances (similarity maximization) among entities in the same cluster and maximize
the distance (similarity minimization) between entities in different clusters. The clustering
method is divided into two categories (Jain et al. 1999):
1. Partitioning algorithms that produce non-hierarchical clusters. This method assigns a
number of clustering centers and an iteration algorithm determines the cluster group
centers. Frequently used partitioning algorithms include Self-Organizing Maps (SOM)
and K means clustering (Trappey et al. 2013). Among these clustering algorithms,
K means clustering is most widely used and studied (Kanungo et al. 2002). K means
clustering is very efficient in terms of computational time, but it is sensitive to outliers.
For this reason, K medoids clustering is used to reduce outlier bias.
2. Hierarchical algorithms produce hierarchical clusters using divisive and agglomerative
approaches (Rokach and Maimon 2005). The divisive approach is rarely used. The
agglomerative approach views each sample as a small cluster, iteratively combined
into a larger cluster using techniques such as Ward’s method.
Ontology
Ontology is a branch of philosophy often called a synonym of metaphysics (Floridi 2008).
The underlying concept of ontology is to discuss the existence or features of real objects.
142 Scientometrics (2017) 111:139–157
123

Gruninger and Fox (1995) defined ontology as a formal description of a domain set of
entities, their properties, behaviors, and relations.
With the development of Information Technology (IT), ontologies are applied in the
area of Knowledge Sharing (KS) for innovative product or service development (Lee et al.
2015; Yan et al. 2005, 2009). An ontology defines the basic terms and relations comprising
the vocabulary of the domain knowledge as well as the rules for combining terms and
relations to define extensions to the vocabulary (Neches et al. 1991). Gruber (1995) defines
an ontology as an explicit specification of a conceptualization, which describes a knowl-
edge domain consisting of a set of relations, objects concepts, and functions.
A formal methodology to develop ontologies was proposed by Noy and McGuinness
(2001). The systematic steps include determining the domain and scope of the ontology,
considering the reuse of existing ontologies, enumerating important terms in the ontology,
defining the classes, their hierarchy, and their properties as class facets, and finally creating
instances of ontology classes.
Using R subroutines for text and data analytics
R language is a standard set of computer code and subroutines for statistical analysis and
graphical visualization originally developed in 1996 (Ihaka and Gentleman 1996). R
language has a similar architecture to the earlier statistical programming language S. After
years of development and enhancement, R has become a widely used open access statis-
tical software language.
Methodology
This section describes the approaches and algorithms used for the IP portfolio and evo-
lution analytics. The proposed methodology includes steps for extracting key terms per-
forming cosine similarity analysis, creating and validating technical clusters, and tracing
the technology evolution (Fig. 2).
Key term extraction
This research uses the normalized term frequency-inversed document frequency (NTF–
IDF) ranking method to identify key terms. Term Frequency (TF) prioritizes the words
appearing in a text document. Due to variations in length of patents or project documents,
we normalize the term frequencies for the entire set of text documents. The normalized
term frequency (NTF) is used to provide a precise representation of term frequency
occurrences in a document. The mathematical expression of NTF is shown in Eq. (1)
ntfij ¼ tfij �PN
s¼1 dns
N � dnjð1Þ
tfij: The number of times that term i appears in document j; dnj: The total number of words
in document j; N: The total number of documents.
Inverse document frequency (IDF) is a measure used to calculate a terms’ importance
and its ability to distinguish a document from others. The IDF value is calculated in two
steps. The first step represents the total number of documents (N) divided by the number of
documents where the term i appears (dfi). The second step provides the quotient of the first
Scientometrics (2017) 111:139–157 143
123

step and represents it in the form of a logarithm. The mathematical formula is shown by
Eq. (2)
idfi ¼ logN
dfi
� �
ð2Þ
dfi: The number of documents where the term i appears.
The NTF–IDF value is the product of Eqs. (1) and (2). The reason for using NTF–IDF is
to reduce bias if a term appears frequently in one document but rarely appears in other
documents. This allows NTF–IDF to be used as a method to distinguish between different
categories and is very suitable for clustering. Lower NTF–IDF values represent the lower
degrees of discrimination and higher values represent higher degrees of discrimination.
Thus, NTF–IDF values are a means to distinguish important terms. R statistical software
with text mining functions is adopted to calculate all NFT–IDF values of a given set of
documents as shown in Table 1, where NTF - IDFij is the product of ntfij and idfi. The
NTF–IDF data are used as inputs for cosine similarity analysis.
Cosine similarity analysis
The cosine similarity theorem (Salton et al. 1975) is used to determine the similarity
between documents. The angle between the inner product of two vectors determines the
cosine similarity. Since the NTF–IDF value of terms are unlikely to be negative, the cosine
similarity of the two documents range from zero to one. The mathematical formula is
shown in Eq. (3). Referring to Eq. (3), the numerator represents the inner product of the
Fig. 2 The step-by-step procedure of the IP evolution method and algorithm sequence
144 Scientometrics (2017) 111:139–157
123

two key terms vectors x and y and the denominator represents the product of the vector
lengths.
Similarity x; yð Þ ¼ cos hð Þ ¼ x � yxk k yk k ð3Þ
x�y inner product of vectors x and y; kxk: length of vector x; kyk: length of vector y.
Clustering algorithms and performance validation
Brock et al. (2008) presented three types of cluster validation approaches: internal, sta-
bility, and biological. This research uses internal and stability validation to measure the
quality of clustering and to determine which algorithm is most suitable for analyzing the
bio-AM case.
For internal validation, there are three measures including connectivity, silhouette
width, and Dunn index. Connectivity measures the connectedness of observations whereas
silhouette width and the Dunn index measure the non-linear combinations of the com-
pactness and separation of the cluster partitions.
For stability validation, there are four measures for the average proportion of non-
overlap (APN), the average distance (AD), the average distance between means (ADM),
and the figure of merit (FOM). These measures compare the clustering results based on the
full set of data.
In this research, three clustering algorithms (K means algorithm, K medoids algorithm,
and Ward’s algorithm) are applied to cluster the same set of documents. The K means
approach (MacQueen 1967) requires the specification of the number of clusters (k), then
through iteration, reduces the differences between data within a cluster and the cluster
center until cluster members are fixed. K means clustering is divided into the following five
steps (Velmurugan and Santhanam 2010):
1. Randomly select k numbers of data in the data set as the initial cluster centers and
estimate the number of clusters (K clusters).
2. Calculate the distance of each random cluster center to each data, and assign each data
to the nearest cluster center. This will form a cluster boundary resulting in an initial
cluster of members.
3. According to the cluster boundary, calculate the mean point of each cluster to the new
cluster center.
Table 1 Document versus key term NTF–IDF matrix
NTF � IDFij Terms (Ti; i ¼ 1; 2; . . .;m)
T1 T2 … Tm
DocumentsðDj; j ¼ 1; 2; . . .; n)
D1 NTFIDF1,1 NTFIDF2,1 … NTFIDFm,1
D2 NTFIDF1,2 NTFIDF2,2 … NTFIDFm,2
D3 NTFIDF1,3 NTFIDF2,3 … NTFIDFm,3
… … … … …Dn NTFIDF1,n NTFIDF2,n … NTFIDFm,n
Sumvalue
Pnj¼1 NTF � IDF1;j
Pnj¼1 NTF � IDF2;j …
Pnj¼1 NTF � IDFm;j
Scientometrics (2017) 111:139–157 145
123

4. After specifying the new cluster center, calculate the distances again and redistribute
the data to the nearest cluster centers.
5. Steps 3 and 4 are repeated until there are no more changes in the cluster members.
The number K will affect the clustering result, so the R Squared (RS) and root-mean-
square standard deviation (RMSSTD) statistics are used to estimate the number of clusters.
RS indicates the degree of difference among clusters. ANOVA analysis of variance is used
to calculate the RS values which are between zero and one. RMSSTD is a measure of
homogeneity within clusters. Large values of RS mean that there is a greater difference
between clusters. Small values of RMSSTD indicates that the clusters are homogenous.
The optimal number of clusters are selected using larger RS values and smaller RMSSTD
values.
The K medoids clustering algorithm is an algorithm derived from the K means algo-
rithm. Kaufman and Rousseeuw (1990) demonstrated that Partitioning Around Medoids
(PAM) is an improved version of the K medoids algorithm. The PAM algorithm is
described as follows (Velmurugan and Santhanam 2010):
1. Arbitrarily choose k objects in the data set as the initial clustering medoids.
2. Assign each remaining object to the cluster with the nearest medoid.
3. Randomly select a non medoid object Orandom in each cluster and compute the distance
change S. If S\0, replace the original medoid with Orandom.
4. Repeat steps 2 and 3 until there is no change.
Hierarchical clustering is a method where the data are repeatedly divided or combined
to produce the final tree structure. The most commonly used method is agglomerative
hierarchical clustering which aggregates layers from the bottom of the tree to form clusters
hierarchically. The algorithm follows four steps:
1. Each data set will be treated as a cluster Ci, i = 1 to n.
2. Find the closest two clusters among all the clusters, Ci and Cj.
3. Merge the two clusters Ci and Cj into a new cluster.
4. If the current number of clusters exceeds the expected number, then repeat steps 2–4
until the number of clusters satisfy the requirements.
In step 2, two close clusters are found. The common algorithms used are a single-
linkage agglomerative algorithm, complete-linkage agglomerative algorithm, average-
linkage agglomerative algorithm and Ward’s method (Jain et al. 1999). In this research, we
use Ward’s method to find the two closest clusters. Ward’s (1963) method is a common
algorithm for hierarchical clustering and its mathematical representation is shown in
Eq. (4):
dðCi;CjÞ ¼X
a2Ci[Cj
a� lk k ð4Þ
l The mean vector of Ci [ Cj.
Tracing technology evolution
Based on the NTF–IDF matrix and the clustering results, a dynamic concept lattice graph
for a given set of technical documents (patents and proposals) is constructed. First, the
NTF–IDF matrix of entire document set provides the basic data for clustering and each
cluster also has its own NTF–IDF matrix. Second, all NTF–IDF values are ranked in the
146 Scientometrics (2017) 111:139–157
123

NTF–IDF matrices by ascending order. The top quartiles of documents are included for
evolution analysis. Thus, if the NTF–IDF value exceeds the first quartile threshold value,
then NTF–IDF index value is 1, otherwise the index is 0. Finally, define the correlation
threshold value (e.g., 0.3). If the correlation value between two documents is greater than
the threshold, there is a strong relationship (link) between these two nodes. If the docu-
ments have common terms in branch, a solid line is used to connect the documents. If not, a
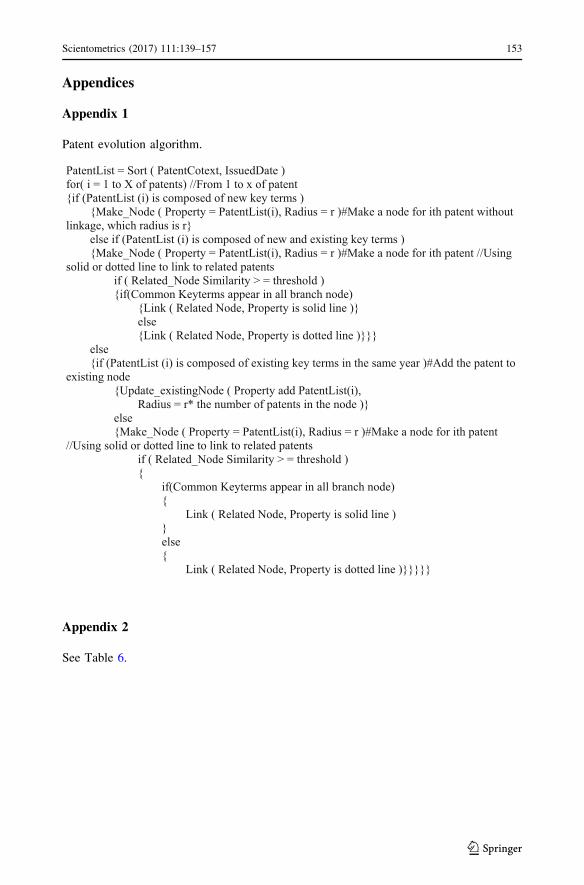
dotted line is used to link the documents. The evolution algorithm’s pseudo code and
explanatory comments are provided in Appendix 1. The portfolio and evolution analysis of
bio-AM patents and project proposals are described in ‘‘Case analysis of bio-AM patents
and projects’’ section.
Case analysis of bio-AM patents and projects
The global bio-AM patents, excluding sole dental applications, are retrieved and archived
using a strategic combination of keywords. The search keywords are divided into parts
including 3D printing (additive manufacture) and biomedical scaffolding. First, the search
keywords are defined as additive manufacture, 3d, three dimension, print, fabricate, and
manufacture. Then these keywords are extended and combined with the keywords, such as
biomedical, bionic scaffold, and implant, to improve the search accuracy within biomed-
ical applications. The research uses the word stemming function commonly available in the
patent search engine (e.g., FreePatentsOnline, FPO). Thus, we can also identify patents
which use inflected and not exact words.
Among 220 granted US patents identified from the preliminary search, 58 patents are
eventually selected by the domain expert as having a high technological impact. A set of
nine Taiwan Ministry of Science and Technology (MOST) bio-AM research proposals and
58 published patents (P10–P67) are archived for the lattice construction. A total of 67
documents are selected to demonstrate the methodology used in the case study.
Key term extraction
The stemDocument function of R statistical software filters out the English stop words.
This step reduces the number of generic English function words in the text. The text
mining subroutines (e.g., tm, NLP, textir, lsa) are used to generate the NTF–IDF matrix. A
partial example of the NTF–IDF matrix is shown in Table 2, where NTF–IDF values are
summed by column to calculate the total NTF–IDF values of key terms. The top ranked 56
terms for the case document set are listed in Appendix 2.
Table 2 A partial NTF–IDFmatrix for the case analysis
Implant Scaffold Bone Guide Model
P1 0.00 48.09 0.00 0.00 4.06
P2 0.00 0.00 0.00 0.00 4.90
P3 1.39 0.00 14.46 0.00 0.00
P4 0.00 8.49 0.00 0.00 0.00
… … … … … …Total 369.80 348.14 302.22 282.30 277.29
Scientometrics (2017) 111:139–157 147
123

In order to reduce the bias of choosing similar key phrases, key term selection rules are
defined. The first rule is that if the terms describe an identical or near identical concept, the
most generalized term is selected as the representing the token. For example, we select
‘‘scaffold’’ instead of ‘‘cellular scaffold.’’ The second rule is that if the phrase and its
divided words are all in the top 100 rankings, the words in the phrases are selected. For
example, we select both ‘‘tissue’’ and ‘‘construct’’ as key terms, instead of ‘‘tissue con-
struct.’’ The third rule is to select the terms which have higher NTF–IDF values. Before
clustering the documents, the NTF–IDF matrix is organized using the cosine similarity
algorithm. The resulting partial matrix is shown in Table 3.
Bio-AM technology clustering and the ontology schema
Before clustering, the R package (clValid) is used to evaluate the most suitable numbers of
clusters. Three popular algorithms, K means, Partitioning Around Medoids (PAM or
K medoids), and Wards hierarchical are selected for clustering. The comparative analysis
of the clustering algorithms, based on their internal and stability validation values
(Table 4), suggests PAM with six clusters and hierarchy with two clusters yield good
results.
For the case analysis, the six cluster K medoids clustering analysis is performed and the
result is listed in Appendix 3. This algorithm generates a six cluster result that is a better
representation with more distinguished cluster features than the other clustering algo-
rithms. As observed, cluster one identifies the tissue engineering applications. Cluster two
is similar to cluster one but is focused on methods for bio-printing. Cluster three identifies
the methods of manufacturing bone implants. Cluster four identifies the material compo-
sition for implants and prosthesis. Cluster five is related to surgical guides and models.
Finally, cluster six focuses on the joint implant applications. Shown in Appendix 4, this
research adjusts the K medoids six clusters into three meaningful sub-domain categories
for the technology evolution analysis (in the ‘‘Bio-AM technology evolution analysis’’
section). These three sub-domains for AM-bio applications are (1) tissue engineering and
bioprinting, (2) surgical guides and modeling, and (3) implants and prosthesis as identified
in the literature (Rengier et al. 2010; Klein et al. 2013; Gross et al. 2014).
Using the frequently appearring key terms identified through text mining of the case
documents, the biomedical-AM ontology schema is constructed as shown in Fig. 3. The
scaffold node is subdivided into mechanical aids including in vitro and in vivo implants.
Mechanical aids in vitro are linked to selective laser sintering (SLS) and selective laser
melting (SLM) techniques to produce prosthetics and use polyamide (PA) and Ti–6Al–4V
as construction materials. In vivo implants are used to construct scaffolds for growing
organs and tissues. The materials commonly used include polycaprolactone (PCL), poly-
lactic acid (PLA), sodium carboxymethyl cellulose, biosynthetic cellulose, nano-cellulose,
Table 3 Similarity matrix(partial)
P1 P2 P3 P4 P5
P1 1.000 0.035 0.001 0.157 0.003
P2 0.035 1.000 0.001 0.009 0.346
P3 0.001 0.001 1.000 0.012 0.429
P4 0.157 0.009 0.012 1.000 0.024
P5 0.003 0.346 0.429 0.024 1.000
148 Scientometrics (2017) 111:139–157
123

Connective Growth Factor (CTGF), and Transforming Growth Factor b3 (TGFb3). The
bone node in the ontology schema is in the implant sub-domain, which uses biomedical
grade metal powders (e.g., Ti–6Al–4V and Co–Cr–Mo) to build prostheses to replace the
original bone structure. Commonly used AM techniques are selective laser sintering (SLS)
and selective laser melting (SLM). The soft organ category has a key link to stem cells.
Stem cells are obtained from umbilical cord blood, bone marrow mesenchymal and adipose
tissue. The 3D printing bio ink is created from biological stem cells and sprayed onto the
Table 4 The validation result of hierarchical, k means and PAM clustering
Internal validationValidation Cluster sizesMeasures: 2 3 4 5 6
hierarchical Connectivity 3.8972 8.6143 21.5067 28.7341 32.0742Dunn 0.4880 0.5451 0.4734 0.4919 0.4919Silhouette 0.2756 0.2713 0.2461 0.2531 0.2611
k-means Connectivity 3.8972 8.6143 22.2504 28.7722 37.2702Dunn 0.4880 0.5451 0.3529 0.3666 0.3785Silhouette 0.2756 0.2713 0.2518 0.2673 0.2654
pam Connectivity 3.8972 8.6143 27.6004 34.0972 40.2456Dunn 0.4880 0.5451 0.3459 0.3648 0.4060Silhouette 0.2756 0.2713 0.2347 0.2554 0.2766
Optimal Scores:Score Method Clusters
Connectivity 3.8972 hierarchical 2Dunn 0.5451 hierarchical 3Silhouette 0.2766 pam 6Stability validationClustering Validation Cluster sizemethod measure 2 3 4 5 6hierarchical APN 0.0000 0.0170 0.0033 0.0261 0.0856
AD 1.8397 1.6874 1.5195 1.4357 1.4002ADM 0.0000 0.0274 0.0059 0.0822 0.2009FOM 0.1643 0.1603 0.1417 0.1414 0.1416
k-means APN 0.0000 0.0157 0.0004 0.0285 0.0458AD 1.8397 1.6874 1.5114 1.4150 1.3852ADM 0.0000 0.0274 0.0008 0.0781 0.2126FOM 0.1643 0.1603 0.1409 0.1390 0.1394
pam APN 0.0253 0.1682 0.1194 0.1503 0.0705AD 1.8569 1.7598 1.5824 1.4950 1.3373ADM 0.0519 0.3013 0.2162 0.3015 0.1332FOM 0.1636 0.1605 0.1468 0.1397 0.1347
Optimal Scores:Score Method Clusters
APN 0.0000 hierarchical 2AD 1.3373 pam 6ADM 0.0000 hierarchical 2FOM 0.1347 pam 6
Scientometrics (2017) 111:139–157 149
123
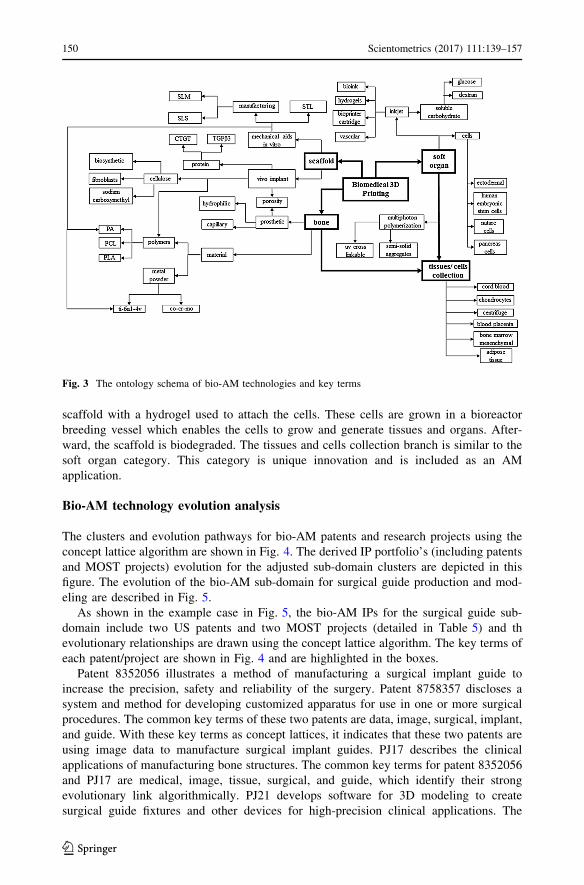
scaffold with a hydrogel used to attach the cells. These cells are grown in a bioreactor
breeding vessel which enables the cells to grow and generate tissues and organs. After-
ward, the scaffold is biodegraded. The tissues and cells collection branch is similar to the
soft organ category. This category is unique innovation and is included as an AM
application.
Bio-AM technology evolution analysis
The clusters and evolution pathways for bio-AM patents and research projects using the
concept lattice algorithm are shown in Fig. 4. The derived IP portfolio’s (including patents
and MOST projects) evolution for the adjusted sub-domain clusters are depicted in this
figure. The evolution of the bio-AM sub-domain for surgical guide production and mod-
eling are described in Fig. 5.
As shown in the example case in Fig. 5, the bio-AM IPs for the surgical guide sub-
domain include two US patents and two MOST projects (detailed in Table 5) and th
evolutionary relationships are drawn using the concept lattice algorithm. The key terms of
each patent/project are shown in Fig. 4 and are highlighted in the boxes.
Patent 8352056 illustrates a method of manufacturing a surgical implant guide to
increase the precision, safety and reliability of the surgery. Patent 8758357 discloses a
system and method for developing customized apparatus for use in one or more surgical
procedures. The common key terms of these two patents are data, image, surgical, implant,
and guide. With these key terms as concept lattices, it indicates that these two patents are
using image data to manufacture surgical implant guides. PJ17 describes the clinical
applications of manufacturing bone structures. The common key terms for patent 8352056
and PJ17 are medical, image, tissue, surgical, and guide, which identify their strong
evolutionary link algorithmically. PJ21 develops software for 3D modeling to create
surgical guide fixtures and other devices for high-precision clinical applications. The
Fig. 3 The ontology schema of bio-AM technologies and key terms
150 Scientometrics (2017) 111:139–157
123

common key terms with patent 8352056 are medical, image, surgical, and guide. These key
terms identify PJ21 as an application for surgical guides and models.
Patent 8352056 describes planning procedures for implanting screws into affected tis-
sues that can be used to construct replacement teeth. Patent 8758357 describes a patient
specific pedicle screw guide that anatomically mates with the spinous processes of a
particular vertebral body (key terms: anatomic, pedicle screw). PJ17 is the clinic appli-
cation of additive manufacturing bone (key terms: bone, screw, orthopedic). PJ21 describes
not only a surgical guide but also the clinic application of the pedicel screw. These four
Fig. 4 The evolution map of patents and projects in three sub-domain clusters
Fig. 5 The key terms indicate the evolving links between patents and projects
Scientometrics (2017) 111:139–157 151
123
patents and projects are linked by the evolutionary relationship. The content describes
applications for surgical guides and models. An important discovery for this research is
that patent 8352056 is from a Taiwan assignee (Chang-Gung University). This patent was
developed earlier than the other patents and indicates that we have developed significant
bio-AM information technology that provides a strategic advantage for manufacturing and
commercializing related surgical applications.
Conclusions
This research uses additive manufacturing (AM or called 3D printing) applied in the
biomedical field as a case example to construct the domain ontology and perform IP
portfolio evolution analysis. The algorithms have advantages and limitations. The
advantages are that the approach is a computer-supported system, which can objectively
mine knowledge text and data from patent and project documents. The system can conduct
key terms extraction and perform document similarity analysis. The documents are clus-
tered and the evolutionary trends of technologies, based on the text mining, can be
interpreted and extrapolated. The evolution analysis is to calculate the similarity between
documents over time with solid evidence that they are correlated beyond a threshold value.
The key terms of each document can be interpreted for their context and meaning. The
limits of this method are the sample of documents and the selection of key terms may not
be a complete representation of the body of knowledge under investigation. Although this
research defines the rules of selecting key terms, the results require a domain expert to
check and validate the results. For future research, additional validation and verification
methods of the analytical results will be derived and tested to ensure valid and reliable
decision support for defining IP trends and R&D strategies.
Acknowledgements This research is partially supported by the Ministry of Science and Technologyresearch Grants (MOST 104-2218-E-007-015-MY2).
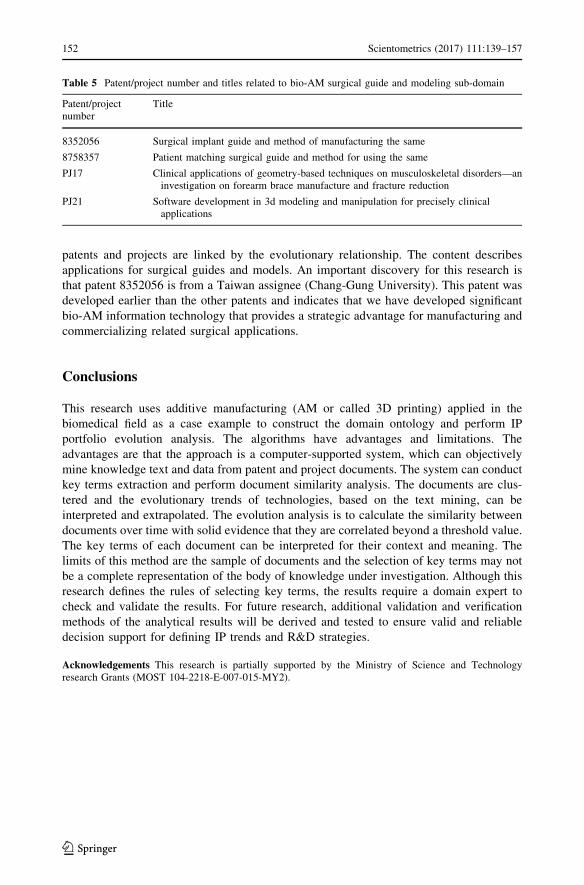
Table 5 Patent/project number and titles related to bio-AM surgical guide and modeling sub-domain
Patent/projectnumber
Title
8352056 Surgical implant guide and method of manufacturing the same
8758357 Patient matching surgical guide and method for using the same
PJ17 Clinical applications of geometry-based techniques on musculoskeletal disorders—aninvestigation on forearm brace manufacture and fracture reduction
PJ21 Software development in 3d modeling and manipulation for precisely clinicalapplications
152 Scientometrics (2017) 111:139–157
123
Appendices
Appendix 1
Patent evolution algorithm.
PatentList = Sort ( PatentCotext, IssuedDate ) for( i = 1 to X of patents) //From 1 to x of patent {if (PatentList (i) is composed of new key terms ) {Make_Node ( Property = PatentList(i), Radius = r )#Make a node for ith patent without linkage, which radius is r} else if (PatentList (i) is composed of new and existing key terms ) {Make_Node ( Property = PatentList(i), Radius = r )#Make a node for ith patent //Using solid or dotted line to link to related patents if ( Related_Node Similarity > = threshold ) {if(Common Keyterms appear in all branch node) {Link ( Related Node, Property is solid line )} else {Link ( Related Node, Property is dotted line )}}} else {if (PatentList (i) is composed of existing key terms in the same year )#Add the patent to existing node {Update_existingNode ( Property add PatentList(i), Radius = r* the number of patents in the node )} else {Make_Node ( Property = PatentList(i), Radius = r )#Make a node for ith patent //Using solid or dotted line to link to related patents if ( Related_Node Similarity > = threshold ) { if(Common Keyterms appear in all branch node) { Link ( Related Node, Property is solid line ) } else { Link ( Related Node, Property is dotted line )}}}}}
Appendix 2
See Table 6.
Scientometrics (2017) 111:139–157 153
123

Appendix 3
See Table 7.
Table 6 Top 56 key terms with assigned IDs
ID Keyterms ID Keyterms ID Keyterms ID Keyterms
K1 Implant K16 Polymer K31 Reconstruct K46 Limb
K2 Scaffold K17 Metal K32 Composite K47 Simulate
K3 Bone K18 Leg K33 Liver K48 Knee
K4 Guide K19 Tissue K34 Biocompatible K49 Ligament
K5 Model K20 Anatomic K35 Medical K50 Cartilage
K6 Joint K21 Prosthetic K36 Condylar K51 Lung
K7 Porous K22 Elastomer K37 Splint K52 Polycaprolactone
K8 Bioprint K23 Ink K38 Graft K53 Polyurethane
K9 Data K24 Virtual K39 Jaw K54 Skull
K10 Image K25 Digital K40 Tibial K55 Cellulose
K11 Surgical K26 Prosthesis K41 Pedicle K56 Cardiovascular
K12 Mold K27 Contact K42 Engineering
K13 Bio K28 Acid K43 Biodegradable
K14 Orthopedic K29 Femoral K44 Screw
K15 Articular K30 Cell K45 Osteotomy
Table 7 K medoids clustering result (6 clusters)
Cluster 1 Cluster 2 Cluster 3 Cluster 4 Cluster 5 Cluster 6
PJ02 PJ10 PJ12, PJ22 PJ14, PJ16 PJ17, PJ21 US8036729
US7968026 US8931880 US8532806 PJ23 US8350186 US8545569
US8071007 US9039998 US8551173 US8086336 US8352056 US8617242
US8090540 US9149952 US8679189 US8142886 US8425227 US8682052
US9034378 US9227339 US8843229 US8172907 US8496663 US8715291
US9168328 US8888862 US8236350 US8706285 US8735773
US9255178 US9015922 US8303746 US8758357 US9237950
US9211129 US8366789 US8790408
US9241772 US8369925 US8984731
US8454705
US8457930
US8470231
US8527244
US8582841
US8623397
US8691974
US8775133
US8852192
US8868226
154 Scientometrics (2017) 111:139–157
123

Appendix 4
See Table 8.
Table 8 The adjusted clusters with three sub-domain interpretations
Tissue engineering/bioprint Surgical guide/model Implant/prosthesis
PJ02, PJ10 PJ17, PJ21 PJ12, PJ16
PJ14, PJ23 PJ22 US8036729
US7968026 US8352056 US8086336
US8071007 US8369925 US8142886
US8090540 US8425227 US8172907
US8236350 US8496663 US8303746
US8470231 US8527244 US8350186
US8582841 US8706285 US8366789
US8623397 US8758357 US8454705
US8691974 US8790408 US8457930
US8931880 US8843229 US8532806
US9034378 US8984731 US8545569
US9039998 US9241772 US8551173
US9043191 US8617242
US9149952 US8679189
US9168328 US8682052
US9180029 US8715291
US9222932 US8735773
US9227339 US8775133
US9255178 US8852192
US8868226
US8888862
US8920512
US8974535
US8992825
US9015922
Table 7 continued
Cluster 1 Cluster 2 Cluster 3 Cluster 4 Cluster 5 Cluster 6
US8920512
US8974535
US8992825
US9043191
US9060810
US9180029
US9222932
US9226827
Scientometrics (2017) 111:139–157 155
123

References
Bermudez-Edo, M., Hurtado, M. V., Noguera, M., & Hurtado-Torres, N. (2015). Managing technologicalknowledge of patents: HCOntology, a semantic approach. Computers in Industry, 72, 1–13.
Brock, G., Pihur, V., Datta, S., & Datta, S. (2008). clValid, an R package for cluster validation. Journal ofStatistical Software, 25(4), 1–22.
Floridi, L. (Ed.). (2008). The Blackwell guide to the philosophy of computing and information. Hoboken, NJ:Wiley.
Gross, B. C., Erkal, J. L., Lockwood, S. Y., Chen, C., & Spence, D. M. (2014). Evaluation of 3D printingand its potential impact on biotechnology and the chemical sciences. Analytical Chemistry, 86(7),3240–3253.
Gruber, T. R. (1995). Toward principles for the design of ontologies used for knowledge sharing? Inter-national Journal of Human-Computer Studies, 43(5), 907–928.
Gruninger, M., & Fox, M. S. (1995). Methodology for the design and evaluation of ontologies. Workshop onbasic ontological issues in knowledge sharing, August 19–20, Montreal.
Ihaka, R., & Gentleman, R. (1996). R: A language for data analysis and graphics. Journal of computationaland graphical statistics, 5(3), 299–314.
Jain, A. K., Murty, M. N., & Flynn, P. J. (1999). Data clustering: A review. ACM Computing Surveys(CSUR), 31(3), 264–323.
Kanungo, T., Mount, D. M., Netanyahu, N. S., Piatko, C. D., Silverman, R., & Wu, A. Y. (2002). Anefficient k means clustering algorithm: Analysis and implementation. IEEE Transactions on PatternAnalysis and Machine Intelligence, 24(7), 881–892.
Kaufman, L., & Rousseeuw, P. J. (1990). Partitioning around medoids (program PAM). Finding groups indata: an introduction to cluster analysis (pp. 68–125). Hoboken: Wiley.
Klein, G. T., Lu, Y., & Wang, M. Y. (2013). 3D printing and neurosurgery—ready for prime time? WorldNeurosurgery, 80(3), 233–235.
Lee, C.-H., Wang, Y.-H., & Trappey, A. J. C. (2015). Ontology-based reasoning for the intelligent handlingof customer complaints. Computers and Industrial Engineering, 84, 144–155.
Lee, S., Yoon, B., & Park, Y. (2009). An approach to discovering new technology opportunities: Keyword-based patent map approach. Technovation, 29(6), 481–497.
MacQueen, J. (1967). Some methods for classification and analysis of multivariate observations. In Pro-ceedings of the fifth Berkeley symposium on mathematical statistics and probability (vol. 1, no. 14,pp. 281–297).
Maimon, O., & Rokach, L. (Eds.). (2005). Clustering methods. In Data mining and knowledge discoveryhandbook (pp. 321–352). Springer, Berlin.
Mierswa, I., Wurst, M., Klinkenberg, R., Scholz, M., & Euler, T. (2006). Yale: Rapid prototyping forcomplex data mining tasks. In Proceedings of the 12th ACM SIGKDD international conference onKnowledge discovery and data mining (pp. 935–940). ACM.
Narin, F., Noma, E., & Perry, R. (1987). Patents as indicators of corporate technological strength. ResearchPolicy, 16(2), 143–155.
Neches, R., Fikes, R. E., Finin, T., Gruber, T., Patil, R., Senator, T., et al. (1991). Enabling technology forknowledge sharing. AI Magazine, 12(3), 36.
Noy, N. F., & McGuinness, D. L. (2001). Ontology development 101: A guide to creating your firstontology. Technical Report KSL-01-05, Stanford Knowledge Systems Laboratory.
Rengier, F., Mehndiratta, A., von Tengg-Kobligk, H., Zechmann, C. M., Unterhinninghofen, R., Kauczor, H.U., et al. (2010). 3D printing based on imaging data: Review of medical applications. InternationalJournal of Computer Assisted Radiology and Surgery, 5(4), 335–341.
Table 8 continued
Tissue engineering/bioprint Surgical guide/model Implant/prosthesis
US9060810
US9211129
US9226827
US9237950
156 Scientometrics (2017) 111:139–157
123

Salton, G., Wong, A., & Yang, C. S. (1975). A vector space model for automatic indexing. Communicationsof the ACM, 18(11), 613–620.
Sanchez, D., Martin-Bautista, M. J., Blanco, I., & Torre, C. (2008). Text knowledge mining: An alternativeto text data mining. In Proceedings of the 8th ICDMW IEEE international conference on Data miningworkshop (pp. 664–672).
Sullivan, D. (2001). Document warehousing and text mining: techniques for improving business operations,marketing, and sales. Hoboken, NJ: Wiley.
Tan, A. H. (1999). Text mining: The state of the art and the challenges. In Proceedings of the PAKDDworkshop on knowledge discovery from advanced databases (vol. 8, pp. 65–70).
Te Liew, W., Adhitya, A., & Srinivasan, R. (2014). Sustainability trends in the process industries: A textmining-based analysis. Computers in Industry, 65(3), 393–400.
Transparency Market Research. (2013). 3D printing in medical applications market—global industryanalysis, size, share, growth, trends and forecast, 2013–2019. Retrieved from Research and MarketWebsite: http://www.researchandmarkets.com/reports/2642328/3d_printing_in_medical_applications_market#pos-0.
Trappey, A. J., Trappey, C. V., Chiang, T. A., & Huang, Y. H. (2013). Ontology-based neural network forpatent knowledge management in design collaboration. International Journal of Production Research,51(7), 1992–2005.
Tseng, Y. H., Lin, C. J., & Lin, Y. I. (2007). Text mining techniques for patent analysis. InformationProcessing and Management, 43(5), 1216–1247.
Velmurugan, T., & Santhanam, T. (2010). Computational complexity between K means and K medoidsclustering algorithms for normal and uniform distributions of data points. Journal of Computer Sci-ence, 6(3), 363.
Ward, J. H., Jr. (1963). Hierarchical grouping to optimize an objective function. Journal of the AmericanStatistical Association, 58(301), 236–244.
Yan, W., Chen, C.-H., & Chang, W. (2009). An investigation into sustainable product conceptualizationusing a design knowledge hierarchy and Hopfield network. Computers and Industrial Engineering,56(4), 1617–1626.
Yan, W., Khoo, L. P., & Chen, C.-H. (2005). A QFD-enabled product conceptualisation approach via designknowledge hierarchy and RCE neural network. Knowledge-Based Systems, 18(6), 279–293.
Zhong, N., Li, Y., & Wu, S. T. (2012). Effective pattern discovery for text mining. IEEE Transactions onKnowledge and Data Engineering, 24(1), 30–44.
Zhou, X., Zhang, Y., Porter, A. L., Guo, Y., & Zhu, D. (2014). A patent analysis method to trace technologyevolutionary pathways. Scientometrics, 100(3), 705–721.
Scientometrics (2017) 111:139–157 157
123