Embed Size (px)
Citation preview

HPA-RPD-001
© Health Protection AgencyCentre for Radiation, Chemical and Environmental HazardsRadiation Protection DivisionChilton, Didcot, Oxfordshire OX11 0RQ
Approval: May 2005Publication: May 2005£28.00ISBN 0 85951 558 3
This report from HPA Radiation Protection Division reflects understanding and evaluation of the current scientificevidence as presented and referenced in this document.
Ionising Radiation Exposure of the UK Population:2005 Review
S J Watson, A L Jones, W B Oatway and J S Hughes
ABSTRACTSince 1974, periodic reviews have been published by NRPB (now the Health ProtectionAgency - Radiation Protection Division) which have provided estimates of the exposureof the UK population from sources of ionising radiation, both natural and artificial. This isthe latest review in that series and gives estimates of individual doses basedpredominantly on data collected for the years 2001 to 2003. The average levels ofnatural radiation show little or no variation with time, and revised estimates of averageannual doses from these sources are due to better or more complete data or changes inoccupancy times or other habit data. The average annual dose from natural radiationwas found to be 2.23 mSv and about half of this is from radon exposure indoors.Artificial (anthropogenic), sources of radiation are subject to variations and trends thatreflect current technology and radiological protection practices. The average annualdose from artificial radiation was found to be a little over 0.42 mSv and mainly derivedfrom the use of X-rays in medical procedures. The overall average annual dose istherefore almost 2.7 mSv. This is a slight increase over that found in the previousreview, mainly due to an increased contribution from medical irradiation. The non-medical artificial sources include consumer products, fallout from weapons testing in thepast, and discharges of radioactive wastes from industrial and nuclear sites. Exposuresto members of the public from these sources remain at a very low level. Individualannual doses to members of the public from practices, other than medical procedures,are generally much less than the annual dose limit of 1 mSv. There has been a long-term trend towards lower occupational doses in the nuclear industry, and worker dosesin medicine, general industry and research tend to be low. However, some small groupsof workers in general industry occasionally receive annual doses up to around theannual dose limit for workers. In recent years many more homes and places of workhave been identified as having high radon levels that require remediation, and radonexposure at work continues to make the largest contribution to all occupationalexposure.

iii
EXECUTIVE SUMMARY
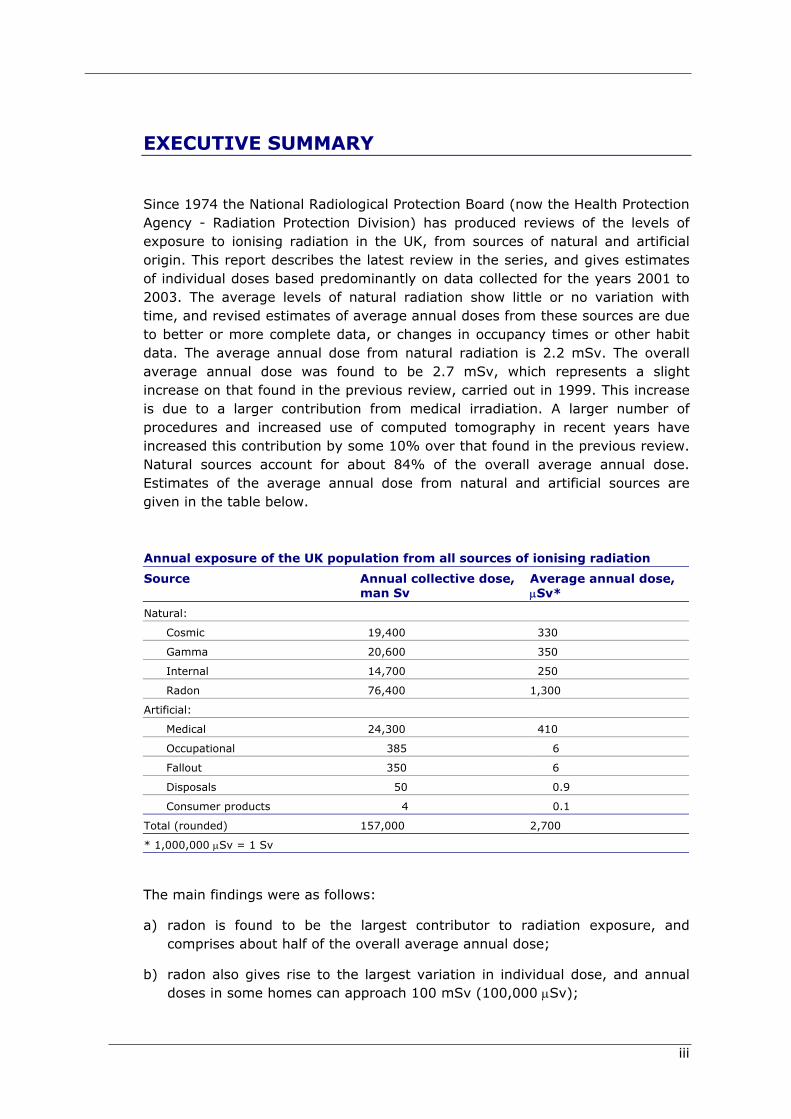
Since 1974 the National Radiological Protection Board (now the Health ProtectionAgency - Radiation Protection Division) has produced reviews of the levels ofexposure to ionising radiation in the UK, from sources of natural and artificialorigin. This report describes the latest review in the series, and gives estimatesof individual doses based predominantly on data collected for the years 2001 to2003. The average levels of natural radiation show little or no variation withtime, and revised estimates of average annual doses from these sources are dueto better or more complete data, or changes in occupancy times or other habitdata. The average annual dose from natural radiation is 2.2 mSv. The overallaverage annual dose was found to be 2.7 mSv, which represents a slightincrease on that found in the previous review, carried out in 1999. This increaseis due to a larger contribution from medical irradiation. A larger number ofprocedures and increased use of computed tomography in recent years haveincreased this contribution by some 10% over that found in the previous review.Natural sources account for about 84% of the overall average annual dose.Estimates of the average annual dose from natural and artificial sources aregiven in the table below.
Annual exposure of the UK population from all sources of ionising radiation
Source Annual collective dose,man Sv
Average annual dose,µSv*
Natural:
Cosmic 19,400 330
Gamma 20,600 350
Internal 14,700 250
Radon 76,400 1,300
Artificial:
Medical 24,300 410
Occupational 385 6
Fallout 350 6
Disposals 50 0.9
Consumer products 4 0.1
Total (rounded) 157,000 2,700
* 1,000,000 µSv = 1 Sv
The main findings were as follows:
a) radon is found to be the largest contributor to radiation exposure, andcomprises about half of the overall average annual dose;
b) radon also gives rise to the largest variation in individual dose, and annualdoses in some homes can approach 100 mSv (100,000 µSv);

iv
c) while cosmic radiation at ground level has remained constant, there has beena slight increase in the overall dose to the population from cosmic radiationexposure from air travel, due to the increased number of flights made by UKresidents;
d) the average annual dose from natural terrestrial gamma radiation hasremained the same as assessed in previous reviews;
e) a reassessment of the intakes of natural radionuclides in foodstuffs hasresulted in a slightly lower estimate of the average annual dose from internalradiation;
f) medical irradiation has been found to be the largest artificial source ofradiation exposure, and the contribution from this source has increased byabout 10% in recent years;
g) the collective dose from occupational exposure in the nuclear industry hasdecreased significantly;
h) the highest individual annual doses from routine occupational exposure arefrom radon in workplaces;
i) average annual exposures from consumer products, weapons fallout anddischarges of radioactive wastes all remain at very low levels;
j) individual annual doses to the public from non-medical artificial sources areless than the annual dose limit for members of the public.

v
CONTENTS
1 Introduction 1
2 Natural radiation 22.1 Cosmic radiation 22.2 Intakes of natural radionuclides 4
2.2.1 Cosmogenic radionuclides 42.2.2 Primordial radionuclides 52.2.3 All internal exposure from intakes 102.2.4 Examples of elevated intakes 11
2.3 Gamma radiation 132.4 Radon and Thoron 14
2.4.1 Introduction 142.4.2 Radon in homes 142.4.3 Radon surveys in the UK 152.4.4 Doses from radon and thoron 17
2.5 All natural exposure 18
3 Medical uses of radiation 193.1 Some common types of medical X-ray imaging 19
3.1.1 Conventional 193.1.2 Interventional procedures 203.1.3 Computed Tomography (CT) 203.1.4 General trends 21
3.2 Overall dose from X-ray examinations 213.3 Nuclear medicine procedures 233.4 All medical procedures 24
4 Occupational exposure 244.1 Nuclear industry 25
4.1.1 Fuel enrichment 254.1.2 Fuel fabrication 274.1.3 Nuclear power stations 274.1.4 Fuel reprocessing and other work 28
4.2 Nuclear and technology services 294.3 Defence Workers 31
4.3.1 Ministry of Defence 314.3.2 Defence Industry 32
4.4 Medicine 324.4.1 Diagnostic radiology 334.4.2 Radiotherapy 344.4.3 Nuclear Medicine 354.4.4 All medical workers 36
4.5 Dentistry 394.6 Veterinary practice 404.7 Research and tertiary education 404.8 General industry 414.9 Radon in mines and caves 434.10 Radon in above-ground workplaces 444.11 Aircraft crew 444.12 All occupational exposure 45

vi
5 Consumer products and miscellaneous items 465.1 Radioluminous items 475.2 Smoke alarms 485.3 Vaseline glass 495.4 Uranium glazed ceramics 495.5 Geological specimens 505.6 Photographic lenses 51
6 Radioactive fallout in the environment 516.1 Atomic weapons fallout 516.2 Fallout from Chernobyl 53
7 Disposals of Radioactive Wastes 537.1 Uranium enrichment and fuel manufacture 567.2 Nuclear power stations 577.3 Fuel reprocessing 587.4 Defence establishments 597.5 Nuclear and technology services 60
7.5.1 Dounreay 607.5.2 Harwell 617.5.3 Winfrith 61
7.6 Radionuclide production 627.7 Research laboratories 627.8 Drigg 637.9 Other landfill sites 637.10 The NORM industries 637.11 Small users 657.12 Collective and per-caput doses from marine discharges 657.13 Collective and per-caput doses from atmospheric discharges 66
8 Discussion 708.1 Radiation exposures from all sources 70
8.1.1 Natural radiation 718.1.2 Medical uses of radiation 728.1.3 Occupational exposure 728.1.4 Consumer products 738.1.5 Fallout 738.1.6 Disposals of radioactive wastes 73
8.2 Exposure to widespread natural background and environmentalradiation 748.3 Variation in county average annual doses from natural radiation 758.4 Individual variations in exposures from other sources 78
9 Conclusions 81
10 Acknowledgements 81
11 References 82
APPENDIX A Data used to calculate doses from naturalradionuclides in foodstuffs 89
APPENDIX B Glossary 99

INTRODUCTION
1
1 INTRODUCTION
Since 1974 the National Radiological Protection Board (now HPA-RPD*) hasproduced reviews of the levels of exposure to ionising radiation in the UK, fromsources of natural and artificial origin (Webb, 1974; Taylor and Webb, 1978;Hughes and Roberts, 1984; Hughes, Shaw and O'Riordan, 1989; Hughes andO'Riordan, 1993; Hughes, 1999). As noted in the Government response (GBParliament, 1977) to the report of the Royal Commission on EnvironmentalPollution (Royal Commission, 1976), it is the intention of the NRPB / HPA-RPD toreport periodically on the radiation exposure of the UK population. These reviewsare made available to national and international organisations and are a sourceof information on dose comparisons and trends. This is the seventh review inthis series and covers the period from 1998 to 2003, with the main datareflecting the levels of exposure in the later years of this period. The averagelevels of natural radiation show little or no variation with time and revisedestimates of average annual doses are the result of better or more completedata, or changes in occupancy times or other habit data. Artificial sources arelargely controllable and trends are apparent for some of these. These trends arefrom the introduction of new technology, or developments in radiologicalprotection policy and techniques. This report gives estimates of the average, andrange, of doses to the UK population from all sources of ionising radiation. Theresident population of the UK in 2001 was 58.8 million (Laverty, 2003).
During the period of this review the radiological protection philosophy andstandards were those established by the recommendations of the InternationalCommission on Radiological Protection (ICRP) (ICRP, 1991). Theserecommendations form the basis of the European Union Basic Safety Standards(BSS) Directive (European Commission, 1996) on the hazards of ionisingradiation, and the requirements of that Directive are applied in the UK, forexample through the Ionising Radiations Regulations (IRR99) (GB Parliament,1999a), the Radioactive Substance Act (RSA93) (GB Parliament, 1993) and TheRadiation (Emergency Preparedness and Public Information) Regulations(REPPIR) (GB Parliament, 2001a). The dose quantity used throughout thisreview is effective dose, unless otherwise specified, and is abbreviated to doseunless the full term is required for clarity. Sub-multiples of the unit of dose, theSievert, are described in the Glossary.
Exposure to radiation has been divided into six categories and these arediscussed in turn.
* On April 1st 2005, NRPB merged with the Health Protection Agency to form its RadiationProtection Division (HPA-RPD)

IONISING RADIATION EXPOSURE OF THE UK POPULATION: 2005 REVIEW
2
2 NATURAL RADIATION
Natural radiation originates from sources beyond the Earth's atmosphere (cosmicradiation) and from primordial radionuclides within soil and rocks. Sources havebeen divided into four categories.
2.1 Cosmic radiation
Primary cosmic radiation consists of very energetic charged particles movingthrough space. They originate mostly from events beyond our solar system, witha lower energy component originating from the sun. Cosmic radiation thatinteracts with the atmosphere mainly consists of very high-energy protons, witha small component of alpha particles and electrons. When these particles enterthe Earth's atmosphere they collide with, and disrupt, atoms in the upperatmosphere, producing secondary radiation. By the time the cosmic radiationreaches the ground its intensity has been considerably reduced, by absorption inthe atmosphere. The secondary particles from solar protons are only detectablein high altitude aircraft, but their intensity can increase during periods ofincreased solar activity. The nuclear reactions initiated by cosmic particles in theatmosphere give rise to a number of radionuclides, such as carbon-14 (14C). Theintensity of the cosmic radiation is also affected by the Earth's magnetic field andthere is some variation of the dose rate with latitude. The minimum dose rate isfound at the equator, and is a few percent lower than at the poles.
UNSCEAR (United Nations Scientific Committee on the Effects of AtomicRadiation) (UN, 2000) has produced an estimate of the cosmic radiation doserate. UNSCEAR divides the radiation component into two parts: directly ionisingradiation and neutron radiation. The estimates of dose rate from directly ionisingradiation is little changed between the UNSCEAR reports published in 1988 (UN,1988) and 2000 (UN, 2000), being represented by an average of around280 µSv per year at sea level in latitudes between 500 and 600 (corresponding tothe UK). This dose is mainly from muon radiation. In addition to this exposure,UNSCEAR estimates (UN, 2000) that the dose rate from cosmic neutron radiationat sea level with a latitude corresponding to that of the UK is approximately90 µSv per year. Thus the total dose to the population in the UK from cosmicradiation from exposure outdoors is around 370 µSv per year.
For exposure inside buildings, the dose rate quoted above will be reduced due tothe shielding effects of building materials. An exact value for this reduction is notpossible as it depends on the type of building (for example, shielding is moreeffective when living at the bottom of a set of flats than at the top) andmaterials (concrete, wood, etc) used. Cosmic ray muons and neutrons are veryenergetic and can easily penetrate buildings. For occupancy inside a building,UNSCEAR recommends an average reduction in the dose rate of 20% comparedto the dose rate when outside (UN, 2000). The amount of time people spendinside buildings also must be taken into account, and this is estimated to be

NATURAL RADIATION
3
about 90% in the UK (Smith and Jones, 2003). Taking these factors into accountthe estimated average dose to the UK population from cosmic radiation atground level is about 300 µSv per year, and is the same as that estimated in theprevious review (Hughes, 1999). The value received by an individual depends onaltitude, latitude, type of building and the building's construction material.
In the UK the effect on the average resident of increasing dose rate with altitudeis small, such that there is little difference in the dose rate for someone living atsea level compared to someone living in a mountainous area. However, thedifference in dose rate between sea level and the altitude at which aircraft fly ismore significant. The dose received during a particular flight varies with altitude,latitude and flight time, but some typical values can be determined usingcomputer codes developed for this purpose (FAA, 2004). For altitudes ofbetween 9-12 km and a latitude of 500 (corresponding to a flight from NorthernEurope to North America), the dose rate is generally in the range of 4-8 µSv perhour. However, the dose rate during long haul flights at lower latitudes isgenerally lower and so a dose rate of 4 µSv per hour may be used to representthe average dose rate for all long haul flights. For short haul flights, taken torepresent journeys between European countries, the flight altitude is generallyless than that considered for long haul (for example, transatlantic) flights, beingbetween 7.5-10.5 km. At this altitude the dose rate is typically around 3 µSv perhour. These dose rates correspond to those estimated by British Airways (Irvineand Flower, 2002), and take account of the climb and descent phase of theflight.
For illustrative purposes, Table 1 contains some approximate doses from areturn flight from London to various destinations, calculated using a computercode (FAA, 2004). These doses are in addition to any doses that the individualsreceive on the ground. For aircrew the time spent in the air can be considerablyhigher than that for passengers. Aircrew doses are discussed in the occupationalexposure section (see Section 4.11).

IONISING RADIATION EXPOSURE OF THE UK POPULATION: 2005 REVIEW
4
TABLE 1 Approximate doses from a return journey by air
Destination,
from London:
Approximate flight time*, h Approximate dose for areturn journey#, µSv
Paris 2 4
Glasgow 2.5 6
Malaga 5 15
Athens 7 25
Moscow 8 40
New York 15 100
Los Angeles 22 160
Johannesburg 23 75
Hong Kong 26 140
Sydney 40 160
Notes:
* Total time in the air for a direct return flight from London to the indicated destination
# The values in this table are approximate values for illustration only. Actual flight times may varyand the doses will depend on many factors including flight profile and the specific route taken
In the previous review it was estimated that the average annual dose to the UKpopulation from air travel was about 20 µSv (Hughes, 1999). This was based onthe number of flights made by UK residents in 1996, which was some 28 million.In 2002 this had risen to 44 million (Summerfield and Babb, 2004), giving anincrease in the average annual dose to about 30 µSv. The overall average annualdose in the UK from all cosmic radiation exposure is therefore about 330 µSv.The overall range in annual dose at ground level is from about 200 to 400 µSv,mainly depending on variations in the shielding provided by buildings.
2.2 Intakes of natural radionuclides
Natural radionuclides in the environment may be taken up by plants and hencemay be taken into the body. Average annual doses to adults, children andinfants were calculated from average intakes of foodstuffs and reportedradionuclide concentrations in those foodstuffs. These estimates of annual doseare described in the following sections.
2.2.1 Cosmogenic radionuclidesThe interactions of cosmic radiation with atoms in the atmosphere produce arange of radionuclides that can give rise to human exposure by inhalation, or byingestion after their uptake by plants. These radionuclides include tritium (3H),beryllium-7 (7Be), carbon-14 (14C) and sodium-22 (22Na). The most significantcosmogenic radionuclide is 14C, which is taken up by plants and becomesincorporated into human foodstuffs. The Food Standard Agency and ScottishEnvironment Protection Agency (FSA and SEPA, 2002) have an extensiveprogramme of monitoring of radionuclides in the environment from authoriseddischarges and, for the purposes of comparison, measurements are also carriedout on some natural radionuclides in seafood and terrestrial foodstuffs. Activity

NATURAL RADIATION
5
concentrations of natural 14C in foodstuffs from those measurements are used inthis study to estimate average annual doses from 14C intakes.
2.2.2 Primordial radionuclidesNatural radionuclides of terrestrial origin have very long half-lives or derive froma very long-lived parent radionuclide. These primordial radionuclides werecreated in stellar processes before the Earth was formed and are still present inthe earth's crust. The main primordial radionuclides are listed in Table 2, themost radiologically significant being those of uranium, thorium and potassium.Uranium-238 (238U), uranium-235 (235U) and thorium-232 (232Th) undergoradioactive decay through a series of decay products, shown in Table 3,eventually producing stable isotopes of lead. All these radionuclides are presentin rocks and soils and can be taken up by plants, and thus enter the food chain.During the process of radioactive decay these radionuclides can emit alpha (α),beta (β) and gamma (γ) radiation. Therefore when these radionuclides areingested or inhaled they give rise to an internal radiation dose. The presence ofthese radionuclides in rocks, soils and building materials can also give rise to aradiation dose from direct external irradiation, see Section 2.3. Radiationexposures from 40K, 87Rb and the radionuclides of the uranium and thoriumseries are assessed here. The exposures from the other radionuclides listed inTable 2 are insignificant.

IONISING RADIATION EXPOSURE OF THE UK POPULATION: 2005 REVIEW
6
TABLE 2 Primordial radionuclides
Radionuclide Relative abundance, % Half-life, y Decay40K 0.0117 1.3 109 β50V 0.25 1.4 1017 β76Ge 7.44 1.5 1021 β82Se 8.73 1.1 1020 β87Rb 27.8 4.7 1010 β90Zr 2.80 3.9 1010 β100Mo 9.63 1.2 1019 β113Cd 12.22 9.0 1015 β115In 95.7 4.4 1014 β116Cd 7.49 2.6 1019 β123Te 0.91 1.2 1013 β128Te 31.69 7.2 1024 β130Te 33.8 2.7 1021 β138La 0.09 1.3 1011 β144Nd 23.8 2.3 1015 α147Sm 15.0 1.1 1011 α148Sm 11.3 7.0 1015 α150Nd 5.64 1.7 1019 β152Gd 0.2 1.1 1014 α174Hf 0.162 2.0 1015 α176Lu 2.6 3.8 1010 β180Ta 0.012 1.0 1015 α186Os 1.58 2.0 1015 α187Re 62.6 5.0 1010 α187Re 62.6 5.0 1010 β190Pt 0.01 6.5 1011 α190Pt 0.01 6.5 1011 α232Th 100 1.4 1010 α234U 0.0055 2.5 105 α235U 0.72 7.0 108 α238U 99.3 4.5 109 α
Previous reviews in this series have shown that the largest source of exposure ofthe UK population is from radon gas (222Rn). Table 3 shows that 226Ra, which ispresent in the ground, decays to 222Rn, which gives rise to an inhalation dose.Exposures from radon are described separately in Section 2.4.
2.2.2.1 Potassium-40Potassium-40 (40K) constitutes 0.012% of natural potassium by weight andpotassium is distributed throughout the body. The concentration in the body isheld relatively constant by metabolic processes. An average annual dose toadults of 165 µSv has been estimated from measurements of average bodycontent of this radionuclide (UN, 2000). The average annual dose in younger age

NATURAL RADIATION
7
groups (10 y old) is higher, at 185 µSv, due to a higher 40K concentration (UN,2000). Infants have 40K concentrations similar to adults (ICRP, 1975), and havetherefore, as an approximation, been ascribed the same annual dose as adults.Lower 40K concentrations in elderly females (ICRP, 1975) give rise to an annualdose about half that of young male individuals (UN, 1982).
2.2.2.2 Rubidium-87Radioactive rubidium (87Rb) constitutes 27.8% of rubidium found in the earth’scrust and decays to stable strontium-87 (87Sr). It occurs naturally in igneousrocks in varying amounts depending on the rock type. Normal human adultscontain about 300 mg in all tissues (www.dcnutrition.com, 2003). It isestimated that the average annual dose to an adult is about 2 µSv. The sameaverage annual dose is assumed for other age groups.
2.2.2.3 Uranium and thoriumThe longer lived members of the uranium and thorium series are present in verylow concentrations in most foodstuffs. Some of these radionuclides can be moreconcentrated in certain foodstuffs as a result of natural processes and someexamples of these are given below. It has been established by many studies(Bradley, 1993; Ham et al, 1998; Young et al, 2002; UN, 2000; Defra, 1999;Dale, 2000, 2001 and 2002) that, of the radionuclides in the uranium andthorium series, 210Pb and 210Po provide the main contribution to the annual dose.
Other members of the uranium and thorium series have been measured infoodstuffs in a number of studies. These make a small but importantcontribution to the total dose. Typical uranium and thorium series activityconcentrations in foodstuffs are given in Appendix A, Table A1. Activityconcentration values are given for the foods that make up the total diet,including drinking water. Average annual intakes of foodstuffs for adults,children and infants (Smith and Jones, 2003) are given in Appendix A, Table A1,and are used to calculate the doses for each radionuclide. The doses are givenin Appendix A, Tables A2-A4, and summarised in Table 4.
The average annual doses from radionuclides in the uranium and thorium seriesfrom intakes of different foodstuffs, are illustrated in Figures 1 and 2. Figures 1and 2 show that in the case of infants, the largest single contribution, fromradionuclides of the uranium and thorium series is from dairy products.Contributions to adult dose from these radionuclides are distributed relativelyevenly between the main food groups. The contributions to the average annualdose due to inhalation of different radionuclides are illustrated in Figure 3 andTable 4. These were calculated from the data on air concentrations ofradionuclides, dose coefficients and breathing rates given in Table A1 ofAppendix A. Radionuclides of the uranium series give average annual doses fromingestion and inhalation of about 67 µSv and 2 µSv respectively. The averageannual doses from ingestion and inhalation of radionuclides of the thorium seriesare about 7 µSv and 0.4 µSv respectively.

ION
ISIN
G R
AD
IATIO
N E
XPO
SU
RE O
F TH
E U
K PO
PULA
TIO
N: 2
005 R
EVIE
W
8
TABLE 3 Decay series of natural radionuclides
Uranium series Actinium series Thorium series
Radionuclide Half-life Decay* Radionuclide Half-life Decay* Radionuclide Half-life Decay*238U 4.5 109 y α 235U 7.0 108 y α 232Th 1.4 1010 y α234Th 24 d β 231Th 25 h β 228Ra 5.7 y β234mPa 1.2 min β 231Pa 3.3 104 y α 228Ac 6.1 h β234U 2.5 105 y α 227Ac 22 y β 228Th 1.9 y α230Th 7.7 104 y α 227Th 19 d α 224Ra 3.7 d α226Ra 1.6 103 y α 223Ra 11 d α 220Rn 56 s α222Rn 3.8 d α 219Rn 4.0 s α 216Po 0.15 s α218Po 3.0 min α 215Po 1.8 10-3 s α 212Pb 11 h β214Pb 27 min β 211Pb 36 min β 212Bi 61 min β214Bi 20 min β 211Bi 2.1 min α 212Po (64%) 3.0 10-7 s α214Po 1.6 10-4 s α 207Th 4.8 min β210Pb 22 y β 207Pb (stable) 208Tl (36%) 3.0 min β210Bi 5 d β 208Pb (stable)210Po 138 d α206Pb (stable)
Note
* Only the main decay modes are shown. Most of these radionuclides also emit gamma radiation.

NATURAL RADIATION
9
Figure 1. Annual dose to each age group from natural radionuclides of the 238U
and 232Th series in foodstuffs.
Figure 2. Contributions to the annual dose to an adult and an infant fromradionuclides of the uranium and thorium series in a typical diet.
Adults
25%
12%
10%16%
9%
11%
11%6%
Totalvegetables
Total meat
Total dairyproducts
Fish
Crustaceans
Cereals
Water
Total otherfoods
Infants
19%
6%
28%13%
0%
11%
16%
7%
Totalvegetables
Total meat
Total dairyproducts
Fish
Crustaceans
Cereals
Water
Total otherfoods
0 5 10 15 20 25 30 35 40
Total vegetables- Adults
Children
Infants
Total meat - Adults
Children
Infants
Total dairy products - Adults
Children
Infants
Fish - Adults
Children
Infants
Crustaceans - Adults
Children
Infants
Cereals - Adults
Children
Infants
Water - Adults
Children
Infants
Total other foods - Adults
Children
Infants
Dose, µSv y-1
U series
Th series

IONISING RADIATION EXPOSURE OF THE UK POPULATION: 2005 REVIEW
10
Apart from radon, it is the longer-lived radionuclides of the uranium and thoriumseries that make the main contributions to inhalation dose from naturallyoccurring radionuclides. In particular 210Pb makes the largest contribution, asshown in Figure 3. The exposures from inhalation of radon and its short-liveddecay products are described in Section 2.4.
TABLE 4 Annual doses to three age groups from ingestion and inhalation of naturalradionuclides
Infants, µSv y-1 Children, µSv y-1 Adults, µSv y-1
Nuclide Ingestion Inhalation Total Ingestion Inhalation Total Ingestion Inhalation Total238U 9.93 10-2 1.79 10-2 1.17 10-1 1.22 10-1 2.24 10-2 1.44 10-1 1.18 10-1 2.35 10-2 1.42 10-1
234U 1.04 10-1 2.09 10-2 1.25 10-1 1.20 10-1 2.69 10-2 1.47 10-1 1.10 10-1 2.84 10-2 1.38 10-1
230Th 1.92 10-1 3.33 10-2 2.25 10-1 3.26 10-1 4.48 10-2 3.71 10-1 3.49 10-1 5.67 10-2 4.06 10-1
226Ra 2.89 100 2.09 10-2 2.91 100 5.73 100 2.74 10-2 5.76 100 2.71 100 2.84 10-2 2.74 100
210Pb 4.58 101 1.41 100 4.72 101 4.35 101 1.68 100 4.52 101 2.22 101 1.78 100 2.40 101
210Po 8.13 101 2.52 10-1 8.16 101 4.66 101 3.11 10-1 4.69 101 4.17 101 3.23 10-1 4.20 101
232Th 1.06 10-1 4.75 10-2 1.54 10-1 1.90 10-1 7.28 10-2 2.63 10-1 1.90 10-1 1.01 10-1 2.91 10-1
228Ra 1.64 101 1.90 10-2 1.64 101 2.76 101 2.58 10-2 2.76 101 6.24 100 2.11 10-2 6.26 100
228Th 1.29 10-1 2.47 10-1 3.76 10-1 1.30 10-1 3.08 10-1 4.38 10-1 1.27 10-1 3.24 10-1 4.51 10-1
235U 5.78 10-3 2.47 10-3 8.25 10-3 7.42 10-3 3.08 10-3 1.05 10-2 6.84 10-3 3.44 10-3 1.03 10-2
14C 8.87 100 - 8.87 100 1.05 101 - 1.05 101 8.84 100 - 8.84 100
40K 1.65 102 - 1.65 102 1.85 102 - 1.85 102 1.65 102 - 1.65 102
87Rb 2.00 100 - 2.00 100 2.00 100 - 2.00 100 2.00 100 - 2.00 100
Total* 3.23 102 2.07 100 3.2 102 3.22 102 2.52 100 3.2 102 2.50 102 2.69 100 2.5 102
* Overall totals rounded, radon excluded
2.2.3 All internal exposure from intakesThe average annual dose to both 1 y and 10 y olds from intakes of naturalradionuclides, excluding radon, is estimated to be around 320 µSv. For adults itis estimated to be around 250 µSv. This average annual dose is based mainly onUK estimates of radionuclide intakes and results in a slightly lower average dosethan was derived in the previous review, which relied more on international data.Almost all this dose is from ingestion, with 1% or less being from inhalation ofthe relatively long-lived radionuclides considered. The largest contribution to theaverage annual adult dose is 165 µSv (66%), from 40K. The next largestcontribution, about 76 µSv (30%) is from radionuclides of the uranium andthorium series. The average adult annual dose from cosmogenic 14C is estimatedto be about 9 µSv (3.6%), and the remainder, about 2 µSv, is mainly from 235Uand 87Rb intakes. Consumption of foods with elevated activity concentrations, orat elevated rates (Smith and Jones, 2003), can lead to annual doses a few timeshigher than the UK average; that is approaching 1000 µSv. The contributionfrom 40K is highest in children and young adults, and diminishes with age. Inelderly females, annual doses from 40K are about half that of young males (UN,1982). Those of the elderly with low intakes of radionuclides will therefore have

NATURAL RADIATION
11
annual doses slightly above 100 µSv. The rounded range of annual doses istherefore from about 100 µSv to 1000 µSv. Note that radon is not included inthis range – see Section 2.4.
2.2.4 Examples of elevated intakes2.2.4.1 Natural radioactivity in drinking waterCurrent legislation (GB Parliament, 1999b) sets out the maximum levels ofradioactivity in spring water and bottled drinking water in the UK. Theseregulations do not apply to natural mineral waters. A maximum total indicativedose (TID) is defined in the regulation as 0.1 mSv per year per person, notincluding contributions from 40K, radon decay products or tritium. A limit fortritium is set separately at 100 Bq l-1.
An analysis of natural radioactivity in bottled waters was carried out by the FoodStandards Agency (FSA) (FSA, 2004). Gross alpha activity in the samplesranged from below the limit of detection to 8.4 Bq l-1; gross beta activity rangedfrom below the limit of detection to 6.1 Bq l-1. Doses were calculated by FSA,assuming a consumption rate of 2 litres per day (730 litres per year) and rangedfrom 0.002 – 0.484 mSv y-1 (FSA, 2004). The radionuclides giving thesignificant proportion of these doses are 234U and 226Ra. However, it should benoted that it is unlikely that the general population consumes this amount ofbottled water per day, hence the estimated dose is likely to be anoverestimation.
The ingestion of radon gas dissolved in tap water can lead to a small exposure,when consumed. However, it is unlikely that all the radon will remain in thewater once released from the tap, and some will disperse into the surroundingair where it contributes to the radon in indoor air from other sources. If the tapwater is boiled, almost all the radon will be removed. The dose to an adultmember of the public ingesting 1 litre per day of tap water containing 1 Bq ofradon would receive an annual equivalent dose to the stomach of about 30 µSv(Kursheed, 2000), giving an annual effective dose of almost 4 µSv. A UK-widesurvey (Henshaw et al, 1993) found an average concentration of about 3 Bq l-1
in tap water. This could therefore result in an average annual effective dose ofabout 10 µSv, from drinking 1 l d-1 of tap water. There are some private watersupplies in the UK where concentrations approaching 1000 Bq l-1 (Smith, D M etal, 1990) have been found, giving rise to annual doses in the order of 1 mSv.Relatively few individuals would receive such annual doses, and this dose isestimated on the cautious assumption that all the radon is retained within thewater.

ION
ISIN
G R
AD
IATIO
N E
XPO
SU
RE O
F TH
E U
K PO
PULA
TIO
N: 2
005 R
EVIE
W
12
0
0.2
0.4
0.6
0.8
1
1.2
1.4
1.6
1.8
2
1 2 3 4 5 6 7 8 9 10 11 12
Radionuclide
Dos
e, µ
Sv y
-1
Adults Children Infants
7Be 238U 234U 230Th 226Ra 210Pb 210Po 232Th 228Ra 228Th 235U 14C
Figure 3 Inhalation doses to three age groups from naturally occurring radionuclides (excluding radon)

NATURAL RADIATION
13
2.2.4.2 FoodstuffsThe consumption of foodstuffs containing elevated concentrations of naturalactivity will increase an individual’s dose. Mussels contain relatively highconcentrations of 210Po and the average concentration found in a study carriedout in 2001 was 42 Bq kg-1 (EA et al, 2004). The consumption of an 80g jar ofmussels containing this concentration of 210Po would lead to a dose ofapproximately 4 µSv. If a jar of mussels that contains the same activityconcentration is consumed each week for a year the annual dose received wouldbe about 200 µSv.
Brazil nuts can contain elevated levels of radium isotopes (Turner et al, 1958),sometimes up to a few hundred Becquerels per kilogram. A study (Hiromoto etal, 1996) found average concentrations of about 30 Bq kg-1 of both 226Ra and228Ra, and lower activities of other radionuclides. The consumption of a 100gbag could give rise to a dose of about 4 µSv, or 200 µSv per annum if a bag isconsumed each week. Since a bag usually contains some 30 to 40 nuts, thisimplies a dose of about 0.1 µSv per Brazil nut.
2.3 Gamma radiation
Most radionuclides in the uranium and thorium series, and 40K, emit gammaradiation. A world-wide review (UN, 2000) of the concentrations of 40K, 238U and232Th in soil gave median values of 400, 35 and 30 Bq kg-1, respectively. In theUK, levels of 238U range from 2 to 330 Bq kg-1, depending on the type of rock inthe area, and 232Th is present at an activity concentration of between 1 and180 Bq kg-1.
These radionuclides, which are present in soils and other natural materials, giverise to exposures from gamma radiation outdoors. Building materials, which alsocontain these radionuclides, also give rise to external gamma exposure indoors.The gamma contributions from the other radionuclides listed in Table 2 areinsignificant. To determine the population dose from terrestrial gamma radiationin the UK, dose rate measurements were made throughout the country bothindoors (Wrixon et al, 1988) and outdoors (Green et al, 1989). The average doserate at a height of 1 m outdoors in the UK, weighted by the populationdistribution, was found to be 32 nGy h-1. This gives an average annual doseoutdoors of about 16 µSv (Green et al, 1989). The average indoor dose rate wasfound to be 60 nGy h-1, varying by about a factor of 3 above and below thismean (Wrixon et al, 1988). This results in an average annual dose of almost340 µSv (Wrixon et al, 1988). The average annual dose from both indoor andoutdoor exposure was therefore found to be about 350 µSv (Wrixon, et al,1988). No further surveys have been carried out that would require a revision ofthis average annual dose. The rounded range of individual annual doses isbetween 100 µSv and 1000 µSv, and derives mainly from the range in indoordose rates.

IONISING RADIATION EXPOSURE OF THE UK POPULATION: 2005 REVIEW
14
2.4 Radon and Thoron
2.4.1 IntroductionRadon (222Rn) gas emanates from the decay of 226Ra in the ground. Radon has ahalf-life of 3.8 days and decays into a number of short-lived radionuclides, whichgive rise to a dose by inhalation. The decay chain of the thorium series, shown inTable 2, gives rise to thoron (220Rn), which is another isotope of radon. Thorongas is also present in indoor air; however it has a much shorter half-life and ispresent at lower activity concentrations than 222Rn, so it contributes much less tothe total dose compared to 222Rn. The population weighted averageconcentration of radon in outdoor air has been estimated as 4 Bq m-3 (Wrixon etal, 1988). The doses resulting from inhalation of radon and thoron and theirdecay products are described in Section 2.4.4.
2.4.2 Radon in homesRadon tends to concentrate in buildings due to the fact that indoor air pressureis normally lower than that outdoors, mainly due to indoor heating, and theaction of wind passing over the building. The main source of indoor radon is fromthe ground below, but it can also be carried into homes in the water and naturalgas supplies, and released when these are used. Also, uranium in buildingmaterials can be a minor source of radon.
Since the build up of radon gas indoors is mainly due to ingress of the gas fromthe ground below a building, this can be reduced or prevented in a number ofways, such as the provision of an impermeable membrane at ground level. Oneof the most effective methods is the construction of a sump below the groundfloor from which air is pumped to the outside. This draws out radon gas before itenters inside the building. Such a system can be constructed and operated bythe householder at a modest cost.
In 1990 NRPB recommended that an Action Level of 200 Bq m-3 should beestablished (NRPB, 1990). This is the level, averaged over a year, above whichaction should be taken to reduce radon concentrations in dwellings. This waspart of a control strategy that involved identifying radon Affected Areas, which isan area with a 1% probability or more of present or future homes being abovethe Action Level. It was also advised that future homes be designed so thatradon would be as low as reasonably practicable. The government accepted thisadvice (DoE, 1990) and since then a major survey programme has beensupported by the Department for Environment, Food and Rural Affairs (Defra),the National Assembly for Wales, the Scottish Executive, the Department of theEnvironment for Northern Ireland, and many local authorities.
Information has been provided to the public through occasional publicitycampaigns and NRPB offers a service to measure indoor radon levels usingpassive dosimeters supplied through the post. The radon control strategy can besummarised as:
• radon measurements should be made in existing homes in Affected Areas,

NATURAL RADIATION
15
• radon concentrations at or above the Action Level should be reduced to aslow as reasonably practicable, and
• new homes built within radon-prone localities should be constructed withprecautions against the ingress of radon.
2.4.3 Radon surveys in the UKIn the early 1980s a national survey of the level of radon in homes was carriedout, in which measurements were made in about 2000 homes throughout the UK(Wrixon et al, 1988). The national survey was carried out in such a way that theresults would give a population weighted average for the UK as a whole andstatistically representative averages for each county. Since then there has beena major programme to measure radon in homes and other buildings in the UK, inorder to identify those premises with high indoor radon concentrations.Measurements have been made in some 500,000 homes using passivedosimeters. However, most of these measurements were targeted at premises inradon-prone areas. Therefore, despite the large number of results from thesemeasurements, the best estimate of the average UK indoor concentration, andthe distribution of concentrations, is still from the first national survey. Thissurvey found that the average indoor concentration in the UK is 20 Bq m-3.
About 0.5% of the housing stock, that is some 100,000 homes, are above200 Bq m-3, and about two thirds of these are predicted to be in Devon andCornwall (NRPB, 1990). However, it was also found that homes with highconcentrations could be found almost anywhere in the UK. Very few homes haveconcentrations that exceed 100 Bq m-3, but a small number of homes can beexpected to have very high levels. Two houses have been found in the KerrierDistrict of Cornwall, one with 17,000 Bq m-3, and the other with 12,000 Bq m-3
(NRPB, 2004).
One of the objectives of the measurement programme was to produce maps of theUK, which show the probability of finding homes above the Action Level in each5 km square. These maps assist in the provision of advice to government and allowthe efficient allocation of measurement resources to find houses above the ActionLevel. These maps are occasionally updated and published, and the latest maps forEngland, Wales (Green et al, 2002) and Northern Ireland (Green et al, 1999) areshown in Figures 4 and 5. Those publications contain more detailed maps for theradon-prone areas. A similar map for Scotland has not yet been completed. Themaps can provide information for house buyers and vendors in the Affected Areason whether a radon survey may be advisable. The maps also provide a guide forthe targeting of publicity campaigns for householders to encourage them toparticipate in the survey programme.

IONISING RADIATION EXPOSURE OF THE UK POPULATION: 2005 REVIEW
16
Figure 4 Estimated proportion of homes exceeding the Action Level in each 5 kmgrid square in Northern Ireland
The current survey data (Green, 2004) are summarised in Table 5, which givesthe numbers of homes predicted to be in excess of the Action Level in each partof the UK. The numbers found up to mid 2004 over the whole UK are almost halfof the predicted total.
TABLE 5 Radon measurements in the UK*
Survey data England Scotland Wales NorthernIreland
UK#
Total housing stock (millions) 20.7 2.2 1.28 0.61 25
Population weighted average radonconcentration (Bq m–3)
21 16 20 19 20
Number of homes measured 426,000 9,200 12,900 21,400 470,000
Number of homes found to be at orabove the Action Level
45,000 250 1,200 1,000 47,000
Total number of homes estimated tobe at or above the Action Level
100,000 2,000 10,000 4,000 100,000
Homes found above the Action Levelas a percentage of the estimatednumber above the Action Level.
45% 12.5% 12% 25% 47%
Notes:
* Data compiled to August 2004. The numbers of homes measured will increase as current radonprogrammes are completed.
# Rounded totals.

NATURAL RADIATION
17
Figure 5 Overall map of radon Affected Area in England and Wales (axis numbersare the 100 km co-ordinates of the Ordnance Survey National Grid)
2.4.4 Doses from radon and thoronRadon decays into a series of radionuclides that can become attached toparticles of dust in indoor air. Inhalation of radon gas and its decay productsgives rise mainly to a dose to the lungs, which is almost all from the decayproducts rather than radon gas itself. The dose to the lungs can be convertedinto an effective dose, using the appropriate weighting factor. This can then beexpressed as an effective dose rate per unit of radon gas concentration.However, this quantity depends on many factors, such as the degree ofequilibrium between radon gas and its decay products, the fraction of decay

IONISING RADIATION EXPOSURE OF THE UK POPULATION: 2005 REVIEW
18
products that are attached to dust particles and the size of particles to whichthose radionuclides are attached.
For dwellings a conversion convention (NRPB, 1987) was adopted that gives riseto about 1 mSv y-1 at the UK average indoor concentration of 20 Bq m-3. Thisconversion convention for dwellings was used in earlier reviews (Hughes, et al,1989; Hughes and O’Riordan, 1993), and also in the previous review (Hughes,1999) following the continued adoption of this conversion convention by NRPB(NRPB, 1998). For all indoor occupancy the average annual dose is about1.2 mSv, (Wrixon et al, 1988) assuming radon concentrations in other buildingsare similar to those in dwellings. The annual dose from exposure outdoors isnegligible in comparison, due to the low outdoor occupancy in the UK and thelower radon concentrations outdoors. The average annual dose from radon(222Rn) is therefore around 1.2 mSv, and individual annual doses vary fromabout 0.3 mSv to a few hundred millisieverts in homes with the highest radonlevels. In the dwelling with the highest radon concentration found, at17,000 Bq m-3, the annual dose is estimated to be approximately 850 mSv.
In addition to radon exposure there is a small annual dose from thoron (220Rn),which is estimated to be 0.1 mSv on average in the UK (Cliff, 1996), with ageneral range between about 0.05 to 0.5 mSv. Some recent measurements(Proctor, 2004) of thoron in homes at a number of locations in the UK supportthis general range, and suggest that in homes with the highest thoron levels,annual doses from this source can be around 1 mSv. The average annual dosefrom both radon isotopes in the UK is about 1.3 mSv (1,300 µSv), and this doseis mainly from the exposure of lung tissue by the inhalation of radon decayproducts.
2.5 All natural exposure
The average annual dose in the UK from all natural sources is therefore about2,230 µSv, and the annual collective dose is about 131,000 man Sv. Thecontributions to the total are shown in Table 6. This estimate is slightly smallerthan that in the previous review, due to a reduced estimate of the contributionfrom internal radionuclides, and despite a slight increase in the cosmic radiationcomponent from airtravel. It should be noted that this average annual doseincludes a contribution of 30 µSv from airtravel. However, not all of thepopulation receives a dose from this source. Therefore the average annual dosefrom natural sources that everyone is exposed to is about 2,200 µSv. Radonprovides the major contribution to the average dose and the cause of the largevariation in the individual dose from all natural radiation - annual doses in somehomes can reach a few hundred millisieverts.

MEDICAL USES OF RADIATION
19
TABLE 6 Summary of doses to the UK adult population from natural sources
Average annual dose (µSv)
Source Previous estimate Present estimate Range
Cosmic radiation 320 330* 200 – 400#
Terrestrial gamma radiation 350 350 100 – 1000
Internal radionuclides 270 250 100 – 1000
Radon† 1,200 1,200 300 – 100,000
Thoron† 100 100 50 – 500
Total 2,240 2,230 1,000 – 100,000Notes:
* Including an additional 30 µSv from airtravel, which is increased from 20 µSv in the previousreview. It should be noted that not all of the population is exposed to this source.# Range does not include airtravel.
† Including decay products.
3 MEDICAL USES OF RADIATION
The announcement of Roentgen's discovery of X-rays in 1895 was almostimmediately followed by medical use of X-rays. For over a century now thediagnostic use of X-rays has been routine, for example to view broken bones, toidentify foreign bodies such as bullets, or to locate kidney stones. Shortly afterthe discovery of X-rays and their application to medicine, the dangers ofexcessive exposure to X-rays became apparent. The International Commissionon Radiological Protection (ICRP) recommendations (ICRP, 1991), and theIonising Radiation (Medical Exposure) Regulations (IR(ME)R, 2000) state thatuse of ionising radiation in medicine should be justified and optimised, includingconsideration of both the benefits and detriments of the exposure. Work byNRPB to establish reference levels of dose has contributed to patient dosereduction (see Section 3.2)
The largest contribution to the overall dose from artificial radiation in the UK hasbeen shown in previous studies to come from medical procedures (Hughes,1999). Most of this exposure is due to the use of X-rays and NRPB has carriedout a number of surveys to assess the exposure from these procedures (Hartand Wall, 2002; Hart and Wall, 2004; Hart et al, 2002).
3.1 Some common types of medical X-ray imaging
3.1.1 ConventionalThis is the standard X-ray examination familiar to most people. Conventionalradiography involves recording images on film or, increasingly, digital imagesstored on computer. Static images may be recorded or moving x-ray images canbe viewed in real-time on a display screen. This production of moving images isknown as fluoroscopy. Angiography is an application of X-rays for the

IONISING RADIATION EXPOSURE OF THE UK POPULATION: 2005 REVIEW
20
examination of blood vessels and usually involves fluoroscopy. Angiography isused in a range of procedures and the patient dose depends on the part of thebody being investigated. Due to its importance, it is identified separately in theanalysis of the dose contributions from all procedures in Section 3.2. Table 7shows the typical effective dose from some common X-ray procedures conductedin the UK.
TABLE 7 Some common X-ray procedures in the UK, showing numbers anddoses
Procedure Annual number Dose, mSv
Intraoral dental 9,562,500 0.005
Chest/ribs 8,273,369 0.02
Ankle 1,003,438 0.002
Lumbar spine 824,763 1.0
Barium enema 359,436 7.2
Data from Hart and Wall, 2002
3.1.2 Interventional proceduresThese are procedures involving X-ray guidance for minimally invasivetherapeutic procedures. Interventional X-rays usually involve a combination offluoroscopy, where moving images are viewed in real-time on a display screen,and "spot" pictures that record static images. If the fluoroscopy is prolonged,these procedures give relatively high patient doses. Table 8 shows the typicaldose from some common interventional procedures conducted in the UK.
TABLE 8 Some common interventional X-ray procedures in the UK, showingnumbers and doses
Procedure Annual number Dose, mSv
Insertion of pacemaker 28,688 0.7
Lithotripsy 23,672 1.3
PTCA (a coronary procedure) 22,440 15.1
Data from Hart and Wall, 2002
3.1.3 Computed Tomography (CT)In CT, special X-ray equipment is used to take cross-sectional images of thebody. The X-ray generator and detector rotate around the body and computersconstruct two-dimensional images looking at a "slice" across the body, or eventhree-dimensional images. Soft tissues are clearly visualised in CT images but atthe expense of relatively high patient doses. Table 9 shows the typical effectivedose from some common CT procedures conducted in the UK.

MEDICAL USES OF RADIATION
21
TABLE 9 Some common CT procedures in the UK, showing numbers anddoses
Procedure Annual number Dose, mSv
CT head 618,391 2
CT abdomen 297,244 10
CT chest 192,885 8
CT spine 63,183 4
Data from Hart and Wall, 2002
3.1.4 General trendsDepartment of Health statistics on the number of imaging procedures conductedeach year in English hospitals show that computed tomography (CT) andinterventional radiology have shown a steady increase over the period1997/1998 – 2001/2002, while conventional radiology and fluoroscopy have hadlittle growth. The frequency of CT examinations has increased by 39% andinterventional radiology by 55% during this period, while conventional radiologyhas only shown a 1% increase. Over this period, the total number of CT,radiographic and fluoroscopic examinations (ie all X-ray examinations) hasincreased by around 4% (Hart and Wall, 2004).
3.2 Overall dose from X-ray examinations
The collective dose for each type of examination is calculated by multiplying thenumber of examinations by the average dose per examination. These are thensummed to give the total collective doses to the population from all types of X-ray examination. Results are presented in Table 10 and Figure 6. The annualcollective dose from diagnostic radiology in the UK in the financial year 2001/2002 was approximately 22,700 man Sv, resulting in an average annual dose of0.38 mSv (Hart and Wall, 2004). A previous survey (Hart and Wall, 2002)showed the average effective dose for the financial year 1997/98 to be0.33 mSv, while in 1991 it was found to be 0.35 mSv (Hughes and O'Riordan,1993). The current value of 0.38 mSv represents a slight increase over previousestimates but is low in comparison with other countries with similarly developedlevels of health care. The average dose from diagnostic X-ray examinations insimilarly developed countries is 0.73 mSv (UN, 2000). The lower average dose inthe UK is probably due to both lower frequencies of examination and lower dosesper examination in the UK (Hart and Wall, 2004).

IONISING RADIATION EXPOSURE OF THE UK POPULATION: 2005 REVIEW
22
Figure 6 Contributions to the UK medical exposure collective dose from X-rayexaminations for financial years 1997/1998 and 2001/2002
TABLE 10 Contributions to the UK collective dose from X-ray examinations forfinancial years 1997/1998 and 2001/2002*
1997/1998 2001/2002Examination Type
man Sv % of total dose man Sv % of total dose
CT 7662 39.7 10650 46.9
Interventional 1239 6.4 1920 8.5
Conventional 8473 43.9 7720 34.0
including:
Barium enema 2588 13.4 2379 10.5
Abdomen 852 4.4 749 3.3
Lumbar spine 825 4.3 692 3.0
Pelvis 644 3.3 559 2.5
Mammography 466 2.4 513 2.3
Dental 77 0.4 82 0.4
Other 3021 15.7 2746 12.1
Angiography 1923 10.0 2423 10.7
Total 19298 100 22713 100
Note: * Data from Hart and Wall 2004
Figure 6 and Table 10 shows that the contribution from CT to the UK collectivedose from X-ray examinations has risen over this period to 47%, while thecontribution from conventional radiology has fallen to 34% and the contributionfrom interventional radiology has risen slightly to about 8%.
1997/1998
40%
6%
44%
10%
2001/2002
47%
8%
34%
11%
CT
Interventional
Conventional
Angiography

MEDICAL USES OF RADIATION
23
CT has now overtaken conventional radiology in terms of its contribution to theUK collective dose, despite the comparatively low frequency of CT (7% of all X-ray examinations in NHS hospitals). Next to CT, interventional radiology is anarea associated with elevated patient doses. While interventional radiology hasseen a large increase (55%) in frequency between 1997/1998 and 2001/2002, itstill accounts for only 2% of the X-ray examinations in English NHS hospitals(Hart and Wall, 2004). However, the high exposures involved mean that itcontributes 8% of the UK collective dose from all procedures.
Dental X-rays are the most frequent examination, making up 30% of all medicaland dental X-ray examinations, though they contribute a very small amount(0.4%) to the collective dose (Hart and Wall, 2002; Hart and Wall, 2004).
There is a requirement to keep patient exposures as low as reasonablypracticable, by minimising both the exposures from examinations and thenumber of unnecessary exposures. To provide guidance on unusually high levelsof exposure, national reference doses have been developed and 'diagnosticreference levels' are now required to be established and used locally (IR(ME)R,2000). National reference doses have been recommended for many commondiagnostic X-ray procedures, which hospitals should demonstrate that they cankeep below by making regular measurements on representative groups ofpatients. With this increasing awareness and with improved technology there is atrend towards reduced exposures, with almost all conventional examinationsshowing a decrease in the mean exposures between the periods 1983-1985,1988-1995 and 1996-2000 (Hart et al, 2002). The development of referencelevels has played a major part in this reduction, together with factors such asthe increase in speed of the film-screen combinations used in conventionalradiography and other technological improvements. With reduced exposurelevels per examination, the average annual dose from X-ray examinations hasnot increased substantially, despite an increase in the number of examinations.
3.3 Nuclear medicine procedures
Besides X-ray examinations, a portion of the UK dose from medical procedurescomes from nuclear medicine. In a survey of nuclear medicine workloads in theearly 1990s (Elliott et al, 1996) the number of diagnostic nuclear medicineprocedures performed annually in the UK was estimated at around 490,000 in1993. The number of procedures has increased steadily since then. Table 11shows Department of Health data for England (DH, 2000; DH, 2001), with a 7%increase in diagnostic radioisotope procedures between the financial years1996/97 and 2000/01. Adjusting these data for the whole UK population impliesaround 640,000 diagnostic nuclear medicine procedures in the financial year2000/2001. This is an increase of 33% compared with the estimated workload in1993.

IONISING RADIATION EXPOSURE OF THE UK POPULATION: 2005 REVIEW
24
TABLE 11 Number of diagnostic nuclear medicine procedures performedannually in England (DH, 2000; DH, 2001)
Department Type Financial year 1996/1997 Financial year 2000/2001
Imaging 466,982 515,222
Other 32,758 20,054
Total 499,740 535,276
A recent survey of nuclear medicine procedures in the UK has been carried out(Hart and Wall, to be published). The number of diagnostic nuclear medicineprocedures in the UK in the financial year 2003/ 2004 had increased slightly to656,000, and the estimated annual collective dose was 1,600 man Sv. Thisrepresents an average annual dose to the UK population of 0.027 mSv.
3.4 All medical procedures
The sum of the average annual dose from nuclear medicine procedures, and theaverage of 0.38 mSv from X-ray examinations, results in an average annualdose to the UK population of 0.41 mSv from all medical procedures.
In addition there will be some dose from radiotherapy and therapeutic use ofnuclear medicine but no estimate is made here of the collective patient dosefrom these procedures. As noted in previous reviews, it is difficult to makemeaningful estimates of these doses, and because therapeutic proceduresintentionally deliver high cell-killing doses to specific tissues, these doses are notindicative of the risk for stochastic radiation effects. This makes them unsuitablefor comparison with the lower diagnostic doses. While there are risks with theexposure levels arising from therapeutic doses, it is not felt appropriate toconsider these exposures in this review.
4 OCCUPATIONAL EXPOSURE
During the period covered by this review the regulations controlling occupationalexposure to ionising radiation were revised to implement the 1996 EuropeanDirective on Basic Safety Standards (EC, 1996). On January 1st, 2000, theIonising Radiations Regulations 1985 (GB Parliament, 1985) were replaced bythe Ionising Radiations Regulations 1999 (GB Parliament, 1999a). With thischange in regulation the main annual dose limit came down from 50 mSv to20 mSv, still with the requirement to keep doses as low as reasonablypracticable. To ensure this, the employer is required to carry out aninvestigation in cases where a worker exceeds an annual dose of 15 mSv, orother, lower, limit set by the employer. The regulations also require that anyperson likely to receive a dose in excess of 6 mSv, or three-tenths of any doselimit, should be classified. Classified workers must have their doses assessedand recorded by an Approved Dosimetry Service (ADS).

OCCUPATIONAL EXPOSURE
25
Each ADS supplies personal monitoring information on classified workers to theCentral Index of Dose Information (CIDI), which is maintained by HPA-RPD forthe Health and Safety Executive. Annual analyses of recent data held by CIDIhave been published (CIDI, 1998; CIDI, 1999; CIDI, 2000; CIDI, 2001; CIDI,2002; CIDI, 2003). The information in these reports, together with datapublished in annual company reports and data obtained by direct enquiry are thesources of data on occupational exposure presented here.
The data are presented where possible as dose distributions, showing thenumbers of workers in ranges of individual annual dose. The collective dose isalso given, being the sum of the individual doses of the workers shown. Theaverage annual dose is obtained by dividing the annual collective dose by thenumber of workers. The average dose is used because of its simplicity, inpreference to other possible parameters such as the geometric mean or themedian dose.
4.1 Nuclear industry
During the period covered by this review, British Nuclear Fuels plc (BNFL) hascarried out a variety of operations, including nuclear power operation, fuelmanufacture, enrichment, reprocessing and radioactive waste disposal. Theadvanced gas cooled reactor power stations (AGRs) and the Sizewell Bpressurised water reactor station (PWR) have been operated by British Energy.In addition, the Magnox reactor power stations were operated by MagnoxElectric plc, part of the BNFL Magnox Generation Business Group, but during theperiod covered by this review management of the Magnox reactor sites becamethe responsibility of the British Nuclear Group.
The tables of occupational exposure data for workers in the nuclear industry(Tables 12 to 19) include both employees and contractors when monitored bythe organisation's ADS. Other groups of contractors may be monitored by otherADSs and are therefore not included in the tables, but these will be small groupsand the omission of this data would not affect the overall pattern of the datadiscussed below. Data are usually for classified workers, with some unclassifiedworkers included. Data for NNC Limited are included in nuclear power stations,Table 17. Data on occupational exposure in the nuclear industry were obtainedfrom a number of sources, but the majority were obtained directly from eachorganisation.
4.1.1 Fuel enrichmentURENCO (Capenhurst) Limited (UCL) operates uranium enrichment facilitiesusing the gas centrifuge process. UCL is located at the Capenhurst site, which isjointly shared with BNFL Capenhurst. Occupational exposure data for UCL staff(Lawrence, 2003; Lawrence, 2004) are given in Table 12. All workers receiveless than 5 mSv annually, and though the collective dose, and therefore theaverage dose, is seen to vary slightly from year to year, the average annual

IONISING RADIATION EXPOSURE OF THE UK POPULATION: 2005 REVIEW
26
dose is still low, and is comparable with doses quoted in the previous review(Hughes, 1999).
TABLE 12 Occupational exposure of workers at URENCO (Capenhurst) Limited
Number of workers in range (mSv)
Year 0-5 5-10 10-15 >15
Total numberof workers
Collective Dose(man Sv)
AverageDose (mSv)
1998 345 0 0 0 345 0.056 0.16
1999 311 0 0 0 311 0.053 0.17
2000 310 0 0 0 310 0.109 0.35
2001 309 0 0 0 309 0.068 0.22
2002 329 0 0 0 329 0.093 0.28
2003 292 0 0 0 292 0.065 0.22
TABLE 13 Occupational exposure of classified workers at BNFL Capenhurst
No of workers in range (mSv)
Year 0-5 5-10 10-15 >15
Total numberof workers
Collective Dose(man Sv)
AverageDose (mSv)
1998 99 0 0 0 99 0.030 0.30
1999 105 0 0 0 105 0.028 0.27
2000 167 0 0 0 167 0.070 0.42
2001 12 0 0 0 12 0.028 2.33
2002 17 0 0 0 17 0.022 1.30
2003 93 0 0 0 93 0.036 0.39
BNFL continues to have workers at the Capenhurst site, having operated theenrichment works until 1993, and now being engaged in decommissioning work.Occupational doses for classified BNFL workers (Thomas, 2003; Thomas 2004;Caine, 2004) at Capenhurst are shown in Table 13. The average annual dose ishigher than in the previous review (Hughes, 1999). This is largely becauseprevious data for BNFL Capenhurst included both classified and unclassifiedworkers, while the data in Table 13 is for classified workers only, who would beexpected to receive higher doses than non-classified workers. As the number ofclassified workers decreases it would also be expected that the remainingclassified workers are likely to receive higher doses than those who have becomeunclassified, therefore increasing the average annual dose. This is especiallytrue in 2001 and 2002, where the number of workers is very low. However,while there were small increases in individual doses, all individual annual dosesremained below 5 mSv and in most years the average annual dose was less than0.5 mSv.
Although the average individual dose of 0.39 mSv in 2003 is slightly higher thanthe 0.3 mSv reported for 1997 (Hughes, 1999), because of the lower number ofworkers (93 compared with 238) the collective dose has dropped from0.07 man Sv in 1997 to 0.036 man Sv in 2003.

OCCUPATIONAL EXPOSURE
27
4.1.2 Fuel fabricationThe manufacture of nuclear fuel involves the handling of uranium compounds,which can lead to external exposure from gamma rays and the intake of airborneradionuclides. Data for occupational exposure of workers at the BNFLSpringfields factory (Thomas, 2003; Thomas, 2004; Caine, 2004) is given inTable 14. The number of workers over the period 1998-2003 shows a downwardtrend, continuing the decline in the number of workers noted in the previousreview. Of these workers, less than 1% receive an annual dose higher than5 mSv, with the average annual dose being less than 1 mSv. The collective andaverage doses over the period 1998-2003 are lower than the doses seen in theprevious review, (Hughes, 1999) though they show minor fluctuations from yearto year.
TABLE 14 Occupational exposure of classified workers at BNFL Springfields
No of workers in range (mSv)
Year 0-5 5-10 10-15 >15
Total numberof workers
Collective Dose(man Sv)
Average Dose(mSv)
1998 2431 2 0 0 2433 1.80 0.74
1999 2322 0 0 0 2322 1.69 0.73
2000 2312 0 0 0 2312 1.75 0.76
2001 2285 0 0 1 2286 1.92 0.84
2002 2185 0 0 0 2185 1.63 0.75
2003 1919 0 0 0 1919 1.32 0.69
4.1.3 Nuclear power stationsOccupational exposures of workers in nuclear power stations in the UK are givenin Tables 15 and 16 (Morris, 2003; McNamara, 2004; Varcoe, 2002; Varcoe,2003). It should be noted that the data presented in Table 15 were obtainedfrom doses received at individual sites. A number of workers move betweenBritish Energy sites, and may accumulate doses at different sites. A worker'sdose from each site would combine to give an individual annual dose. As a resultof this there are likely to be more workers whose individual annual doses fall inthe higher dose ranges than shown. The following discussion is based solely onthe reported doses and so does not consider the total individual doses to workersat BE sites. However it should be noted that British Energy has a Company DoseRestriction Level (CDRL) of 10 mSv, which applies to an individual's dose acrossall sites. In 2003 no staff exceeded the CDRL.
The number of workers is lower than in the previous review, and average dosescontinue to be low. The vast majority of workers at British Energy and Magnoxsites received annual doses of less than 5 mSv between 1998 and 2003. Only 30workers out of 12394 (0.2%) had a dose of more than 5 mSv in 2003 (Tables 15and 16).
Occupational exposures for BNFL workers at the Calder Hall site are included inthe data for BNFL Sellafield in Section 4.1.4. Data for nuclear power station

IONISING RADIATION EXPOSURE OF THE UK POPULATION: 2005 REVIEW
28
workers are given in Table 17, including data for NNC Limited, a group ofcontractors who also work at other types of sites (Catterall, 2002; Hawkrigg,2004), together with data for BNFL Chapelcross workers and data for workers atBE and Magnox sites. The average annual dose received by these workers was0.18 mSv in 2003, compared with 0.3 mSv in 1997. The collective dose to thisgroup of workers has also fallen from 7.8 man Sv in 1997 to 2.4 man Sv in2003.
TABLE 15 Occupational exposure at British Energy power stations
No of workers in range (mSv)
Year 0-5 5-10 10-15 >15
Total numberof workers
Collective Dose(man Sv)
Average Dose(mSv)
1998 9521 1 0 0 9522 1.20 0.13
1999 10627 42 0 0 10669 2.30 0.22
2000 9605 23 1 0 9629 1.73 0.18
2001 7681 1 0 0 7682 0.62 0.08
2002 9836 49 0 0 9885 1.54 0.16
2003 9565 30 0 0 9595 1.28 0.13
TABLE 16 Occupational exposure at Magnox sites (not including Chapelcross)
No of workers in range (mSv)
Year 0-5 5-10 10-15 >15
Total numberof workers
Collective Dose(man Sv)
Average Dose(mSv)
1998 9526 28 0 0 9554 3.08 0.32
1999 8951 83 0 0 9034 2.71 0.30
2000 8526 10 0 0 8536 2.01 0.24
2001 8166 14 0 0 8180 1.41 0.17
2002 8229 6 0 0 8235 1.23 0.15
2003 2799 0 0 0 2799 0.47 0.17
TABLE 17 Occupational exposure at UK power stations, 2003
No of workers in range (mSv)
Sites 0-5 5-10 10-15 >15
Total numberof workers
Collective Dose(man Sv)
Average Dose(mSv)
BE Sites 9565 30 0 0 9595 1.28 0.13
MagnoxSites
2799 0 0 0 2799 0.47 0.17
BNFLChapel-cross
418 4 0 0 422 0.58 1.37
NNC 322 0 0 0 322 0.0396 0.12
Total 13104 34 0 0 13138 2.37 0.18
4.1.4 Fuel reprocessing and other workNuclear fuel reprocessing is carried out at the BNFL Sellafield site along withdecommissioning and waste disposal work. Data on the occupational exposure

OCCUPATIONAL EXPOSURE
29
of workers at Sellafield (Thomas, 2003; Thomas, 2004; Caine, 2004), includingworkers at the Calder Hall nuclear power station, are given in Table 18. Thedata show continuation of a downward trend, though there is some variation inaverage annual dose from year to year. Although the number of workers hasincreased, the annual collective dose has remained at a comparable level overthe period 1998 to 2003, resulting in a reduction in average annual dose from1.26 to 0.78 mSv. No workers received an annual dose more than 15 mSvduring this period, and there is a significant decrease in individual doses, with noworker receiving more than 10 mSv in 2003, compared with 64 workers (0.7%)in 1997 (Hughes, 1999).
Workers at BNFL headquarters, Risley, can receive occupational exposures whilevisiting other sites. Dose data for these workers (Thomas, 2003; Thomas, 2004;Caine, 2004) are shown in Table 19. Their doses are generally very low, withonly one dose in excess of 5 mSv during the period 1998-2003. The number ofworkers and the collective and average annual doses are comparable withnumbers reported previously, showing no trend, just minor fluctuations fromyear to year.
TABLE 18 Occupational exposure of classified workers at BNFL Sellafield
No of workers in range (mSv)
Year 0-5 5-10 10-15 >15
Total numberof workers
Collective Dose(man Sv)
Average Dose(mSv)
1998 8744 665 53 0 9462 11.900 1.26
1999 8175 559 17 0 8751 10.820 1.24
2000 10721 312 1 0 11034 8.620 0.78
2001 11638 341 2 0 11981 11.110 0.93
2002 12288 250 3 0 12541 10.064 0.80
2003 12339 208 0 0 12547 9.752 0.78
TABLE 19 Occupational exposure of classified workers at BNFL Risley
No of workers in range (mSv)
Year 0-5 5-10 10-15 >15
Total numberof workers
Collective Dose(man Sv)
Average Dose(mSv)
1998 422 0 0 0 422 <0.200 <0.47
1999 618 0 0 0 618 0.120 0.19
2000 749 0 0 0 749 0.190 0.25
2001 810 0 0 0 810 0.332 0.41
2002 785 1 0 0 786 0.247 0.31
2003 541 0 0 0 541 0.176 0.33
4.2 Nuclear and technology services
Workers in the United Kingdom Atomic Energy Authority (UKAEA) receiveexposures from a range of activities, including a significant fraction from

IONISING RADIATION EXPOSURE OF THE UK POPULATION: 2005 REVIEW
30
decommissioning operations. Occupational exposure data (Crofts, 2002;NuSAC 2004; NuSAC 2005) are given in Table 20. Doses continue thedownward trend reported in the previous review, with the average dose being0.17 mSv in 2003, compared with 0.2 mSv in 1997. Individual doses haveremained comparable with the low levels attained at the end of the periodcovered in the last review, with no workers receiving a dose in excess of 15 mSvduring the period 1998-2003.
Occupational exposures for workers in AEA Technology (AEAT) (Ward, 2004) areshown in Table 21. Between 1998 and 2000, average doses are seen to fall.However in 2001 the company began to divest its nuclear activities, leading tothe significant fall in the number of monitored workers. Groups who onlyoccasionally undertook radioactive work and therefore only received lowradiation doses were divested first, leading to an increase in the average dosefor the remaining staff in 2002. Less significantly, the change from routineoperations to decommissioning during this period resulted in changes to workand exposure patterns. These changes were managed to achieve a steadyreduction in maximum dose (8.6 mSv in 1999, 4.95 mSv in 2002 and 1.22 mSvin 2003).
TABLE 20 Occupational exposure at UKAEA sites
No of workers in range (mSv)Year
0-5 5-15 >15
Total numberof workers
Collective Dose(man Sv)
Average Dose(mSv)
1998 4787 10 0 4797 0.877 0.18
1999 4805 7 0 4812 0.766 0.16
2000 4846 8 0 4854 0.658 0.14
2001 5237 0 0 5237 0.669 0.13
2002 5313 5 0 5318 0.85 0.16
2003 4978 13 0 4991 0.83 0.17
TABLE 21 Occupational exposure at AEAT sites
No of workers in range (mSv)Year
0-5 5-10 10-15 >15
Total numberof workers
Collective Dose(man Sv)
Average Dose(mSv)
1998 1139 15 0 0 1154 0.43 0.5
1999 1001 6 0 0 1007 0.41 0.4
2000 958 2 0 0 960 0.31 0.3
2001 385 0 0 0 385 0.25 0.6
2002 336 0 0 0 336 0.28 0.8
2003 172 0 0 0 172 0.06 0.3

OCCUPATIONAL EXPOSURE
31
4.3 Defence Workers
4.3.1 Ministry of DefenceWorkers receive exposures from radiation sources and radioactive materials usedby the Ministry of Defence (MoD) and its contractors, including submarinerefitting and maintenance. Most of these workers are monitored by DERARadiation Protection Services and occupational exposures (Phillips, 2002;Phillips, 2004) to these workers for the years 1998 to 2003 are given inTable 22. After a significant reduction in the annual collective dose in the periodcovered by the previous review, it has remained fairly steady for the periodcovered here. The numbers of staff monitored each year also remained fairlylevel, with the result that the average annual dose also shows little change overthis period. The majority of staff received an annual dose less than 5 mSv, withonly one worker in 1998 receiving more than 10 mSv.
TABLE 22 Occupational exposure in MoD (DERA monitored sites)
Number of workers in dose range (mSv)Year
0-5 5-10 10-15 15-20 >20
Total Collective dose(man Sv)
Averagedose (mSv)
1998 9835 15 1 0 0 9,851 2.45 0.25
1999 9986 16 0 0 0 10,002 3.26 0.33
2000 9829 24 0 0 0 9,853 2.97 0.30
2001 9979 17 0 0 0 9,996 2.60 0.26
2002 9942 3 0 0 0 9,945 2.99 0.30
2003 9248 0 0 0 0 9,248 1.92 0.21
A separate dosimetry service monitors workers at Atomic WeaponsEstablishment (AWE) sites and occupational exposures (Phillips, 2002;Phillips, 2004) for the years 1998 to 2003 are given in Table 23. The number ofworkers (both MoD and non-MoD personnel) and the annual collective dose areboth slightly lower than in the previous review, with the average annual doseindicating a slight reduction in doses, though they were already at a low level.Only one worker at AWE sites received an annual dose of more than 5 mSv overthis period.
TABLE 23 Occupational exposure in MoD (AWE sites)
Number of workers in dose range (mSv)Year
0-5 5-10 10-15 15-20 >20
Total Collective dose(man Sv)
Averagedose (mSv)
1998 3824 1 0 0 0 3,825 0.7 0.18
1999 3646 0 0 0 0 3,646 0.6 0.16
2000 3629 0 0 0 0 3,629 0.5 0.13
2001 3479 0 0 0 0 3,479 0.5 0.14
2002 3162 0 0 0 0 3,162 0.3 0.09
2003 2839 0 0 0 0 2,839 0.2 0.07

IONISING RADIATION EXPOSURE OF THE UK POPULATION: 2005 REVIEW
32
For all MoD and AWE workers in 2003 the annual collective dose was 2.1 man Svand the average annual dose was 0.2 mSv, compared respectively with4.1 man Sv and 0.3 mSv in 1997 (Hughes, 1999).
4.3.2 Defence IndustryRolls-Royce (RR) has been involved in the UK naval nuclear programme since itsinception in the 1950s. The company designs, supplies and supports thepressurised water reactor systems and equipment that power the Royal Navy'ssubmarines. Data supplied from Rolls Royce Marine Power Operations Ltd (Hales,2003; Cresswell, 2004), giving occupational exposures to employees involved inmanufacturing for 1998-2003, are shown in Table 24. During this period boththe annual collective dose and the average annual dose fell by a factor of 3 andno worker received an annual dose in excess of 5 mSv.
TABLE 24 Occupational exposure at RR
Number of workers in dose range (mSv)Year
0-5 5-10 10-20 >20
Total Collective dose(man Sv)
Averagedose (mSv)
1998 437 0 0 0 437 0.13 0.3
1999 427 0 0 0 427 0.12 0.3
2000 440 0 0 0 440 0.06 0.1
2001 442 0 0 0 442 0.07 0.2
2002 429 0 0 0 429 0.06 0.1
2003 412 0 0 0 412 0.04 0.1
4.4 Medicine
Individual doses in medicine tend to be low and therefore there are very fewclassified workers in this field. There were less than 200 classified workers inthe medical sector, with the number decreasing over the period covered by thisreview (CIDI 1998; CIDI 1999; CIDI 2000; CIDI 2001; CIDI 2002; CIDI, 2003).However, there is a tendency for a large number of workers to be issued withpersonal dosimeters to provide reassurance that doses continue to remain low,and to provide a means to monitor work procedures. As in the previous tworeviews, a survey was carried out with the co-operation of some of the largerdosimetry services, which were contacted through the UK Personal RadiationMonitoring Group. Requests for data from the dosimetry services were made atan early stage in the collection of data for this review. Data were requested andsupplied for 2001 (Pryor, 2002; Biggart, 2002; Green, 2002; Boreham, 2002;Thomas, 2002; Marland, 2002; Moore, 2002; Rajendram, 2002; Dhanse, 2002;Marsden, 2002; Gilvin 2003) and are shown in Tables 25-29. Some dosimetryservices were able to supply dose information grouped by area of work: datafrom these are shown in Tables 25-27, and summarised in Table 28 under theheading "main sample". Other services were unable to distinguish between

OCCUPATIONAL EXPOSURE
33
different occupational groups, and these data are under the heading "Furthersample" in Table 28. Some dosimetry services were unable to supply data. Thedata presented in Tables 25-29 may include data for classified workers, if thedosimetry services providing the data monitored any of the small number ofclassified workers in the medical sector.
For this review, as well as collecting data on whole body doses, data was alsocollected for extremity doses. Extremity dosimeters are worn in a variety ofbody locations, the location being determined by the occupation or procedure.The most commonly monitored locations are the hands, forehead (or eye) andthe tibia (lower leg). The extremity data (equivalent doses, rather than effectivedoses) for these most commonly monitored positions are summarised inTable 29.
4.4.1 Diagnostic radiologyAnnual doses in diagnostic radiology departments for 2001 are shown inTable 25. In this survey, unlike previous reviews, there is differentiationbetween diagnostic and interventional radiologists (see Glossary). This is inrecognition of the fact that interventional radiology is now more widely used, isbecoming more advanced, and now often involves lengthy procedures. Thesedata show that interventional radiologists have a noticeably higher averageannual dose than the diagnostic radiologists. In fact, interventional radiologistshave the highest average annual dose (0.35 mSv) of all the occupational groupsin this field, closely followed by cardiologists (0.20 mSv). For both of thesegroups almost 95% of staff receive annual doses less than 1 mSv. Otheroccupational groups receive very low average annual doses, with 99% of allworkers in this field receiving less than 1 mSv annually. Overall the averageannual dose in diagnostic radiology is 0.08 mSv, the same as in the previousreview (Hughes, 1999).

IONISING RADIATION EXPOSURE OF THE UK POPULATION: 2005 REVIEW
34
TABLE 25 Occupational exposures in diagnostic radiology departments in 2001*
Number of workers in dose range (mSv)OccupationalGroup 0-1 >1-5 >5-
10>10-20
>20-30
>30
Total Collectivedose (milliman Sv)
Averagedose(mSv)
Diagnosticradiologists
456 11 0 0 0 0 467 68.3 0.15
Interventionalradiologists
63 4 0 0 0 0 67 23.1 0.35
Cardiologists 544 29 0 0 0 0 573 114.0 0.20
Other Clinicians 1178 19 0 0 0 0 1197 91.8 0.08
Radiographers 4581 30 1 0 0 0 4612 297.4 0.06
Nurses 2120 21 0 0 0 0 2141 159.0 0.07
Scientists andTechnicians
590 2 0 0 0 0 592 20.6 0.03
Other Staff 804 5 0 0 0 0 809 65.5 0.08
Total 10336 121 1 0 0 0 10458 839.6 0.08
Notes: * Survey data supplied by a number of UK dosimetry services.
Extremity equivalent doses in diagnostic radiology are shown in Table 29. Themost commonly monitored position was the eye/forehead, and the highestannual doses were recorded on the hand, fingers and leg. For most monitoringpositions the majority of annual equivalent doses recorded were less than1 mSv, with almost all (>95%) of the doses being less than 20 mSv. Howeverfor the left hand/finger measurements, there were a number of annualequivalent doses to the finger greater than 50 mSv, leaving only 89% of annualequivalent doses below 20 mSv. It must be noted that while these valuesappear high compared to the effective doses, the annual dose limits (IRR, 1999)are higher for the extremities (150 mSv for the eye, 500 mSv for the skin or forhands, forearms, feet and ankles).
4.4.2 RadiotherapyAnnual doses to workers in radiotherapy departments for 2001 are given inTable 26. Modern equipment for radiotherapy treatment tends to be very wellshielded, and most treatments with implanted sources are now managedremotely, so reducing the need to work closely with sources or with patientsimplanted with sources. However this area of work can lead to elevated doses.The group of source technicians is very small and although they all receive anannual dose of less than 1 mSv, they have the highest average annual dose(0.34 mSv) of all the occupational groups in radiotherapy. Doses among otheroccupational groups are very low, with 99% of staff receiving less than 1 mSvannually and nobody received more than 5 mSv. Overall the average annual doseis 0.07 mSv, marginally, but not significantly, less than that found in the previousreview.

OCCUPATIONAL EXPOSURE
35
TABLE 26 Occupational exposures in radiotherapy departments in 2001*
Number of workers in dose range (mSv)OccupationalGroup 0-1 >1-5 >5-
10>10-20
>20-30
>30
Total Collectivedose (milliman Sv)
Averagedose(mSv)
Beam Radiographers 763 1 0 0 0 0 764 60.5 0.08
Radiotherapists 340 2 0 0 0 0 342 23.0 0.07
Theatre Nurses 276 2 0 0 0 0 278 6.9 0.02
Other Nurses 490 2 0 0 0 0 492 37.5 0.08
Source Technicians 8 0 0 0 0 0 8 2.7 0.34
Scientists andTechnicians
253 6 0 0 0 0 259 25.7 0.10
Other Staff 267 0 0 0 0 0 267 16.3 0.06
Total 2397 13 0 0 0 0 2410 172.6 0.07
Notes: * Survey data supplied by a number of UK dosimetry services.
Very little extremity monitoring occurs in radiotherapy departments. Extremityequivalent doses are shown in Table 29. Most monitors were worn on the righthand or finger, and were worn by scientists or technicians. The average annualequivalent dose for this position was 6 mSv, with 87% of doses being less than10 mSv.
4.4.3 Nuclear MedicineAs in the previous review (Hughes, 1999) whole body doses in nuclear medicinedepartments are noticeably higher than in diagnostic radiology and radiotherapydepartments. In 2001, the groups of nurses and radiographers/technicians showthe highest average annual dose of 0.7 mSv, followed by pharmacists with anaverage dose of 0.4 mSv. The higher doses in nuclear medicine are largely dueto the close contact with patients and radiopharmaceuticals (largely 99mTc). Thedoses recorded are also noticeably higher than in the previous review. In thissurvey the overall annual average dose of nuclear medicine workers was0.40 mSv, compared with 0.33 mSv in the previous review. Only 85% ofworkers received less than 1 mSv, compared with 92% in the previous review.Some of this increase in doses could be due to the increasing workload innuclear medicine, with some departments showing a 15% increase in thenumber of imaging procedures carried out between 1998 and 2001 (Keir, 2002).

IONISING RADIATION EXPOSURE OF THE UK POPULATION: 2005 REVIEW
36
TABLE 27 Occupational exposures in nuclear medicine departments in 2001*
Number of workers in dose range (mSv)OccupationalGroup 0-1 >1-5 >5-
10>10-20
>20-30
>30
Total Collectivedose (milliman Sv)
Averagedose(mSv)
Pharmacists 82 13 1 0 0 0 96 40.3 0.42
Radiographers &Nuclear MedicineTechnicians
181 81 0 0 0 0 262 186.0 0.71
Scientists 83 5 0 0 0 0 88 22.4 0.25
Clinicians 62 6 0 0 0 0 68 19.2 0.28
Nurses 49 15 0 0 0 0 64 44.9 0.70
Other Staff 220 3 0 0 0 0 223 5.8 0.03
Total 677 123 1 0 0 0 801 318.6 0.40
Notes: * Survey data supplied by a number of UK dosimetry services.
Extremity equivalent doses in nuclear medicine are shown in Table 29. Techniciansand radiographers are the most monitored group, followed by pharmacists, withpharmacists receiving the highest average annual extremity doses. Extremitymonitoring in nuclear medicine is almost exclusively on the left and righthand/fingers. The average annual equivalent dose recorded in these positions was10 mSv, with 73% of doses being less than this average value. Again these dosesare noticeably higher than for diagnostic radiology or radiotherapy groups.
4.4.4 All medical workersThe dose data for the three main work areas, shown in Tables 25-27, aresummarised as the main sample in Table 28. In addition to this, data weresupplied for a further sample, which have been added to the main sample inTable 28, to give an overall sample of almost 26,000 workers in the medicalsector. The average annual dose for these workers was 0.14 mSv, which is alittle higher than the value found in the previous review.

OCCUPATIONAL EXPOSURE
37
TABLE 28 Occupational exposures in medicine in the UK in 2001*
Number of workers in dose range (mSv)Workcategory 0-1 >1-5 >5-
10>10-20
>20-30
>30 NS#
Total Collectivedose(milliman Sv)
Averagedose(mSv)
Main Sample:
DiagnosticRadiology
10336 121 1 0 0 0 - 10458 839.6 0.08
Radiotherapy 2397 13 0 0 0 0 - 2410 172.6 0.07
NuclearMedicine
677 123 1 0 0 0 - 801 318.6 0.40
Main SampleTotal
13410 257 2 0 0 0 - 13669 1330.8 0.10
Further Sample 5671 120 2 0 0 0 6437 12230 2337.4 0.19
Survey Total 19081 377 4 0 0 0 6437 25899 3668.2 0.14
Survey Totalas Percentage†
98.0 1.9 <0.1 0 0 0 - 100 - -
Dental Practice
(see section4.5)
3427 4 0 0 0 0 8270 11701 982.2 0.08
Notes: * Survey data supplied by a number of UK dosimetry services.
# NS = Sample for which dose range distribution not specified† For data supplied with dose distribution
Table 29 shows the distribution of extremity doses in the three main work areasfor the commonly monitored body positions, together with the total and averageextremity doses. The breakdown of doses in each dose range is given inFigure 7, which also shows the total numbers of dosimeters at each bodylocation. The right hand/finger is the most commonly monitored location. Whilethere were a number of cases where individual doses for the left and righthand/finger were not specified, of those dosimeters where the dose range wasreported it can be seen that the hand/fingers receive the highest annualequivalent doses.

IONISING RADIATION EXPOSURE OF THE UK POPULATION: 2005 REVIEW
38
TABLE 29 Occupational extremity exposures (equivalent doses) in medicine inthe UK in 2001*
Number of workers in dose range† (mSv)Work areaandmonitorposition
0-1 >1-5
>5-10
>10-20
>20-30
>30-40
>40-50
>50 NS#
Total Collectiveequiva-lent dose(mSv)
Averageequiva-lent dose(mSv)
Diagnostic radiology
Left Hand/Finger 60 45 29 18 5 4 0 15 - 176 1082.1 6.15
RightHand/Finger
130 71 26 12 11 7 3 1 - 261 1225.6 4.70
Hand 62 32 2 1 2 0 0 1 - 100 250.2 2.50
Eye/Forehead 449 283 69 21 6 3 0 0 - 831 1794.5 2.16
Lower Leg 20 49 22 12 1 1 0 0 - 105 536.3 5.11
Radiotherapy
Left Hand/Finger 5 2 0 1 1 0 0 0 - 9 38.9 4.32
RightHand/Finger
30 13 10 1 4 2 0 1 - 61 364.5 5.98
Hand 0 0 0 0 0 0 0 0 - 0 0.0 0
Eye/Forehead 1 0 0 0 0 0 0 0 - 1 0.8 0.77
Nuclear Medicine
Left Hand/finger 74 71 32 41 9 3 2 12 - 244 2460.3 10.08
RightHand/Finger
108 82 36 40 15 8 2 15 - 306 3059.1 10.00
Hand 1 0 0 0 0 0 0 0 - 1 0.0 0
Eye/Forehead 3 1 1 0 0 0 0 0 - 5 10.2 2.04
Unspecified
Left Hand/Finger 32 24 21 11 5 2 1 0 81 177 640.1 3.62
RightHand/Finger
80 46 20 11 10 5 2 6 499 679 4839.5 7.13
Hand 65 28 6 9 5 5 3 11 - 132 1611.3 12.21
Eye/Forehead 160 82 19 13 5 0 0 0 - 279 691.3 2.48
Total dosimeters
Left Hand/Finger 171 142 82 71 20 9 3 27 81 606 4221.4 6.97
RightHand/Finger
348 212 92 64 40 22 7 23 499 1307 9488.7 7.26
Hand 128 60 8 10 7 5 3 12 0 233 1861.5 7.99
Eye/Forehead 613 366 89 34 11 3 0 0 0 1116 2496.8 2.24
Lower Leg 20 49 22 12 1 1 0 0 0 105 536.3 5.11
Notes: * Survey data supplied by a number of UK dosimetry services.# NS = Sample for which dose range distribution not specified† These equivalent doses should be compared against the annual dose limits of
Eye: 150 mSv
Other location: 500 mSv

OCCUPATIONAL EXPOSURE
39
Figure 7 Annual occupational extremity doses in the UK medical sector
Data for almost 26,000 workers in the medical field were provided for thisreview. However, some dosimetry services were not able to provide data for thissurvey. It is therefore not possible to accurately estimate the total number ofmonitored workers in the medical sector in the UK, but it is unlikely to besignificantly higher than the 40,000 estimated in the previous review. If theaverage annual dose of 0.14 mSv is applied to 40,000 workers, the annualcollective dose received by workers in medicine is 5.6 man Sv. Dose distributiondata was supplied for 19462 workers. The vast majority of these workers (98%)receive less than 1 mSv annually. The 150 or so classified medical workersregistered with CIDI received an annual collective dose of 236 milli man Sv in2001, giving an average annual dose of 1.6 mSv (CIDI, 2001).
4.5 Dentistry
Doses from dental examinations, if carried out correctly, should give only verylow doses to dental staff. A few dentists with high workloads and usingspecialist equipment may receive a few millisieverts in a year. Only sevendentists were registered as classified workers in 2001 (CIDI, 2001) and theyreceived an average annual dose of 2.3 mSv.
Occupational exposure data for dental workers were collected with the survey ofmedical workers described in Section 4.4. Data were supplied for nearly 12,000workers, as shown in Table 28. Of these workers, 99% received an annual doseof less than 1 mSv. The average annual dose to dental workers in this surveywas 0.08 mSv, which while low, is higher than the value of 0.01 mSv obtained in
0
100
200
300
400
500
600
700
800
900
1000
1100
1200
1300
1400
Left Hand/Finger Right Hand/Finger Hand Eye/Forehead Lower Leg
Position of Dosimeter
No
of D
osim
eter
s
Not Specified
>50 mSv
>40-50 mSv
>30-40 mSv
>20-30 mSv
>10-20 mSv
>5-10 mSv
>1-5 mSv
0-1 mSv

IONISING RADIATION EXPOSURE OF THE UK POPULATION: 2005 REVIEW
40
the previous review (Hughes, 1999). It is not known whether this represents atrend.
The General Dental Council (GDC, 2003) indicates that there were 32,500dentists registered in the UK in 2003. Applying the average annual dose of0.08 mSv found in this survey to this number of workers, gives a collective dosein dentistry of 2.6 man Sv. This value is noticeably higher than in the previousreview (Hughes, 1999), partly due to the higher average annual dose and partlydue to the greater number of workers.
4.6 Veterinary practice
A survey carried out by the Institute for Employment Studies for the RoyalCollege of Veterinary Surgeons in 2000 (Robinson and Hooker, 2001) found thatthere were around 10,000 veterinary surgeons in the UK. Some of these will useX-ray equipment and other sources of radiation. Some will use radiation sourcesmore than others and doses are expected to be low, but many wear dosimetersboth as a precaution and to provide reassurance that doses do continue to below.
A small number of veterinary staff are classified workers, with 122 classifiedworkers receiving an average annual dose of 0.6 mSv in 2003 (CIDI, 2003).Analysis of doses received by around 1800 unclassified workers monitored bythe NRPB and Cardiff monitoring services in 2001 (Gilvin, 2003; Thomas, 2002)indicates an average annual dose of 0.2 mSv. Assuming all 10,000 workers useradiology or radiation sources at some time, this implies an annual collectivedose of around 2 man Sv. This is higher than that recorded in the previoussurvey. This is partly due to an increased number of workers, and partly due tothe higher average annual dose. It is possible that the higher average annualdose is due to an increasing number of procedures involving X-rays or othersources of radiation being carried out on animals.
4.7 Research and tertiary education
University laboratories and research establishments use various sources ofradioactive materials and sources of ionising radiation for experimental work.Many workers wear dosimeters for short periods while carrying out particularexperiments but few are monitored continuously. Annual doses tend to be lowand only a minority of workers are classified. In 2001 there were 545 classifiedworkers in academic research and teaching and their average dose was 0.1 mSv(CIDI, 2001).
Information for this review was provided from data collected by the Associationof University Radiation Protection Officers (AURPO), in 26 universities andresearch establishments (Moseley, 2002). Data were collected for recent years,giving the number of workers and average dose for each year. The results aregiven in Table 30. In 2001, a total of 4194 workers were included in this survey.

OCCUPATIONAL EXPOSURE
41
This number is lower than in recent years; in fact, numbers have been steadilydeclining since 1997. This is partly due to a decline in the use of radionuclidesand partly due to restrictions on the numbers of people provided withdosimeters, with dosimeters tending to be provided only to those workers morelikely to record a dose. This would account for the slight increase in averagedose since 1997. Despite this slight increase over recent years, the averageannual dose remains very low at below 0.1 mSv.
TABLE 30 Occupational exposure in academic research and teaching
Year 1997 1998 1999 2000 2001
No of workers 4900 4737 4553 4375 4194
Average Annual Dose (mSv) 0.043 0.046 0.046 0.048 0.065
Not all universities were able to supply data, so an accurate estimate of the totalnumber of workers monitored in this field is not possible. However it wasestimated that very approximately 40% of monitored university workers wereincluded in this survey, and therefore it is estimated that there are around10,000 monitored workers in this field. The annual collective dose in this field istherefore estimated as 0.6 man Sv.
4.8 General industry
There are many uses of ionising radiations in industry, including engineering,construction, production of oil and gas and maintenance of aircraft. Forexample, radioactive materials are used in research; X-rays and sealed gammasources are used for industrial radiography, for the detection and evaluation offlaws in materials; sealed sources are used to measure the thickness of somematerials during production. Many workers using ionising radiation will weardosimeters, but may not be classified workers. Most workers use sources thatare well shielded so receive very low doses, but some workers, such as industrialradiographers, use sources that are not, or are only partially, shielded, andtherefore tend to receive higher doses.
Occupational data for classified workers are collated and published annually byCIDI, the Central Index of Dose Information (CIDI, 1998; CIDI, 1999;CIDI, 2000; CIDI, 2001; CIDI, 2002; CIDI, 2003). Data for classified workers inindustry in 2003 are given in Table 31. Workers transporting radioactivematerials continue to have the highest average annual dose (0.9 mSv), with thelowest doses occurring in the fields of onshore and offshore drilling, andindustrial research.
The number of classified workers in general industry has fallen by 37% from11376 in 1997 (Hughes, 1999) to 7181 in 2003. The collective dose has alsofallen, so the average annual dose is unchanged at 0.4 mSv. Overall doses are

IONISING RADIATION EXPOSURE OF THE UK POPULATION: 2005 REVIEW
42
low, and around 90% of these classified workers received a dose of no morethan 1 mSv in 2003.
TABLE 31 Occupational exposures of classified workers in general industry in2003
Number of workers in dose range (mSv)Type of work
0 0 - 1 1 - 6 6 - 10 10 -15
15 -20
20 -30
>30
Total Collectivedose(milliman Sv)
Averagedose(mSv)
Industrialradiography
1240 1100 197 10 6 1 0 0 2554 917 0.4
Use andservicing ofionising radiationmachinery
616 306 25 7 0 0 0 1 955 568 0.6
Application &manipulation ofradioactivesubstances
457 572 189 4 0 0 0 0 1222 632 0.5
Transport work 21 28 20 1 0 0 0 0 70 65 0.9
Offshore work 404 358 13 0 0 0 0 0 775 120 0.2
Onshore drilling 13 11 1 0 0 0 0 0 25 7 0.3
Industrialresearch
354 511 56 0 0 0 0 0 921 234 0.3
Other industrialapplications
425 204 22 8 0 0 0 0 659 159 0.2
Total 3530 3090 523 30 6 1 0 1 7181 2702 0.4
Some data for about 500 non-classified workers in general industry in 2001(Thomas, 2002; Gilvin, 2003) were supplied. This represents a fraction of thenon-classified workers but these data indicate that doses are very low. Theaverage annual dose for that group was calculated to be less than 0.01 mSv,and 99% of these workers received less than 1 mSv.
Amersham plc (now GE Healthcare) manufactures and supplies radioactivematerials from its main sites at Amersham and Cardiff. Occupational data(McHardy, 2002; NuSAC 2004; NuSAC 2005) for Amersham employees at allthese sites are shown in Table 32. The number of workers has remained fairlystable, but the collective dose has fallen by more than a third between 1998 and2003, leading to a fall in the average annual dose. This continues thedownwards trend reported in the previous review (Hughes, 1999). While themajority (98%) of employees received a dose of less than 5 mSv in 2003, andthe average dose was 0.7 mSv, a few employees do receive higher doses,though no employee received a dose greater than 10 mSv in 2003. Amershamplc also has large numbers of contract workers who tend to receive lower doses.The average annual dose for contractors at Amersham sites is around 0.2 mSv.

OCCUPATIONAL EXPOSURE
43
TABLE 32 Occupational exposure in radionuclide production
Number of workers in dose range (mSv)Year
0-5 5-10 10-15 15-20
Total Collective dose(milli man Sv)
Averagedose(mSv)
1998 1077 72 0 0 1149 1259 1.1
1999 1116 46 0 0 1162 1078 0.9
1998 1127 32 0 0 1159 935 0.8
2001 1116 25 0 0 1141 795 0.7
2002 1067 25 0 0 1092 790 0.7
2003 1064 23 0 0 1087 720 0.7
Based on the data available it is estimated that around 10,000 workers ingeneral industry receive an annual collective dose of around 3 man Sv. Thisimplies an average annual dose of 0.3 mSv.
4.9 Radon in mines and caves
Radon concentrations in the air in underground workplaces tend to be elevatedabove those outdoors, due to the restricted ventilation. In large minesventilation rates are generally good and this prevents radon concentrationsbecoming excessive. The average annual individual dose from radon in large coalmines has previously been assessed to be 0.6 mSv (Hindmarsh, 1992), and thisis taken as the current estimate, as no more recent assessment is available. Thecurrent number of coal miners is estimated to be about 5,000 (HSE, 2004), andthese workers therefore receive an annual collective dose of about 3 man Sv.
Industrial mineral mines, and small private coal mines, tend to have higherradon levels than large coal mines. The average annual dose for these mines,estimated from data in the previous review, was 2.6 mSv (Hughes, 1999). At thetime of the previous review it was estimated that there were some 1,500 minersworking in these mines. Since then some mines have closed and currently thereare about 800 such miners (Fenton, 2004). One mine has about 500underground workers, and in this mine the average annual dose isapproximately 0.3 mSv (Gooding, 2004). In the absence of other new data, theaverage annual dose for the other 300 miners is assumed to be 2.6 mSv, asestimated above from data in the previous review. From these data, the annualcollective dose for all 5,800 miners is estimated to be 3.9 man Sv, and theaverage annual dose is therefore 0.7 mSv. In 2003, 55 miners were classifiedworkers, with an average dose of 5.2 mSv, and 28 of these received annualdoses in the range 6 to 10 mSv (CIDI, 2003).

IONISING RADIATION EXPOSURE OF THE UK POPULATION: 2005 REVIEW
44
4.10 Radon in above-ground workplaces
In areas of the country where there are homes with generally elevated levels ofindoor radon, such as the south west of England, workplaces are similarlyaffected. If the radon concentration, averaged over a 24 hour period, exceeds400 Bq m-3, the Ionising Radiations Regulations, 1999, (IRR) applies(GB Parliament, 1999a). Employers are required to identify all sources of risk toemployees (GB Parliament, 1999c). In radon Affected Areas this must includeassessments of occupational exposures to radon, which involves carrying outmeasurements of the radon air concentrations at the premises. Through thesemeasurements, and other surveys being carried out by NRPB, such premisescontinue to be identified, but currently the number identified is small in relationto the predicted number. The results of the national survey (Wrixon et al, 1988)that was carried out in the early 1980s enable such a prediction to be made bystatistical methods.
For the previous review it was estimated that there were some 5,000 premisesthat would be subject to statutory controls under the IRR, in which some 50,000workers would be employed. There has been no change in the estimates ofnumbers of workers (Dixon, 2004), or their doses, since the previous review.The average annual dose received by these workers is estimated to be 5.3 mSv.From the distribution of radon concentrations it is further estimated that about2,500 of these workers will receive annual doses in excess of 15 mSv. Theannual collective dose to these 50,000 workers in premises that would besubject to statutory controls is approximately 270 man Sv.
4.11 Aircraft crew
Cosmic radiation is discussed in Section 2.1, with some doses quoted for a rangeof typical flights. While passengers may typically make just a few flights peryear, aircrew will have a far greater number of hours in the air and maytherefore receive significantly higher doses from cosmic radiation.
Since 1990 the exposure of aircrew to cosmic radiation has been recognised byICRP as occupational exposure (ICRP, 1991). In 2000 legislation concerningexposure of aircrew came into force in the UK (GB Parliament, 2000a; GBParliament, 2000b). Occupational exposure of aircrew consists of cosmicradiation and exposure from packages of radioactive material being transportedby air, with the major portion coming from cosmic radiation.
Exposure from cosmic radiation will be dependent on the number of hours thataircrew spend airborne. A survey carried out by the NRPB (Warner Jones et al,2003) showed that crew on long-haul flights might be airborne for up to about900 hours per year, while crew on short haul flights might be airborne for up to400 hours per year. With an average dose rate from cosmic radiation of4 µSv h-1 (see Section 2.1) this implies annual doses up to 1.6 and 3.6 mSv forshort and long haul staff respectively. Taking an average flight time of around600 hours per year would imply an annual dose of 2.4 mSv.

OCCUPATIONAL EXPOSURE
45
The study quoted above was based on data received from many air operators. Astudy carried out for British Airways (Irvine and Flower, 2002) indicated averagedoses for the various fleets of between 0.99 and 2.61 mSv in 2001, with theaverage of all fleets being about 1.6 mSv. This was lower than normal, due tothe grounding of Concorde from August 2000 until November 2001. Consideringthe two estimates of average dose given here, an overall average annual dosefor all aircrew is estimated as 2 mSv. With approximately 40,000 flight deck andcabin crew (CAA, 2001) in the UK, this average annual dose implies an annualcollective dose of 80 man Sv, which is higher than the value given in theprevious review, due to the use of a more representative number of aircrew.
The NRPB survey (Warner Jones et al, 2003) indicated that doses to aircrewfrom the transport of radioactive material could vary from 0.27 to 64 µSv peryear depending on the type of flight and whether the crew are cabin crew orflight deck crew. With an average annual dose of 19 µSv, to 40,000 workers,this gives an annual collective dose from transport of radioactive packages ofaround 0.8 man Sv.
4.12 All occupational exposure
Summaries of the occupational exposure data from the sections above arecompiled in Table 33. The total number of workers for whom doses have beencomplied is about 245,000 compared with 236,000 workers in 1987 (Hughes,1999), the increase being partly due to the increased number of aircrew. Theoverall collective dose, 385 man Sv, remains at about the same level and theoverall average annual dose, 1.6 mSv, is the same as that reported in theprevious review.
The ranking of average annual doses from the different types of work is verysimilar to that seen in the previous review (Hughes, 1999). The highest averageoccupational doses still arise from radon in workplaces and from radiationexposure of aircrew. Within the nuclear industry the average annual dose hasfallen in all areas, but the areas of fuel reprocessing and fabrication still give thehighest average doses. Doses from medicine, dentistry and research still givethe lowest average annual doses over all work areas, though the average annualdose in medicine has risen slightly.

IONISING RADIATION EXPOSURE OF THE UK POPULATION: 2005 REVIEW
46
TABLE 33 Overall doses from occupational exposure
Number of workers in dose range(mSv)
Type of work
0-5 5-10 10-20 >20
Total Annualcollective dose(man Sv)
Averageannualdose(mSv)
Nuclear industry:
Fuelenrichment
385 0 0 0 385 0.1 0.3
Fuelfabrication
1,919 0 0 0 1,919 1.3 0.7
Power stations 13,104 34 0 0 13,138 2.4 0.2
Fuelreprocessing
12,880 208 0 0 13,088 9.9 0.8
Technologyservices
5,150 13 0 0 5,163 0.9 0.2
Defence 12,499 0 0 0 12,499 2.2 0.2
Medicine etc
Medical* 40,000 <10 0 0 40,000 5.6 0.1
Dental* 32,500 0 0 0 32,500 2.6 0.1
Veterinary* 10,000 0 0 0 10,000 2.0 0.2
Research andteaching*
10,000 0 0 0 10,000 0.6 0.1
Generalindustry*#
9,950 50 <10 <10 10,000 3.0 0.3
Natural radiation:
Radon inmines &caves*
5,800 <100 0 0 5,800 3.9 0.7
Radon in otherplaces*†
32,000 13,000 4,000 ~1,000 50,000 270 5.3
Air crew* 39,900 <100 0 0 40,000 80 2.0
Totals(rounded)
226,100 13,400 4,000 ~1,000 245,000 385 1.6
Notes:
* Dose distribution derived from sample data.# Derived from sample data in which some data was for the range 0-6 mSv.† Exposures from increased radon concentrations in workplaces subject to regulatory control.
5 CONSUMER PRODUCTS AND MISCELLANEOUSITEMS
A number of products, bought for everyday use, contain low levels ofradioactivity. Some of these items contain low levels of naturally occurringradioactive materials but the majority of consumer products containingradioactive substances have the radioactive material deliberately added, to makeuse of their chemical and radioactive properties. For example in the case ofradioluminous articles, beta-emitting isotopes are combined with a phosphor to

CONSUMER PRODUCTS AND MISCELLANEOUS ITEMS
47
produce luminescence. The recommended annual dose constraints from the useof a particular product should not exceed 30 µSv for safety items and 3 µSv forall other items, except those that are unacceptable in principle such as toys andjewellery (NRPB, 1992).
Table 34 summarises the doses from the various items discussed below.
TABLE 34 Doses from some consumer products and miscellaneous items
Product Estimatedindividual annualdose* (µSv y-1)
Estimated averageannual dose to UKpopulation (µSv y-1)
Radioluminous items – wrist watch containing 147Pm 0.3 N/A
Radioluminous items – wrist watch containing tritium 10 N/A
Radioluminous items - Gaseous tritium light source ina timepiece
0.9 N/A
Smoke alarms 0.07 0.06
Vaseline glass, collection displayed on shelves 50 N/A
Uranium glazed wall tiles <1 N/A
Geological specimens 100 N/A
Photographic lenses 200-300 N/A
Note:
* Very conservative estimates of effective dose.
N/A Not applicable. Only small numbers of people receive doses from these items, so it is notappropriate to give an average dose to the UK population in these cases.
5.1 Radioluminous items
Historically the most significant radionuclide for use in radioluminous consumerproducts is radium-226 (226Ra). However, production of items luminised withradium ceased a few decades ago with radium being replaced by tritium (3H) andpromethium-147 (147Pm), as these radionuclides are less radiotoxic. Premiseswhere luminous clocks and watches are serviced may be exempt from someprovisions of the Radioactive Substances Act, 1993 (GB Parliament, 1993),under recent regulations in England and Wales (GB Parliament, 2001b), NorthernIreland (NI DoE, 2003) and Scotland (Scottish Executive, 2000).
Advice given by NRPB on the maximum activities and dose rates forradioluminous time-pieces states that the dose rate must not exceed 2 µSv h-1 atthe front face of an item and 0.2 µSv h-1 on the back plate (NRPB, 1992). Theequivalent dose to the skin of the wrist that would be received from a watchcontaining a radioluminous source is therefore 1.8 mSv per year assuming thatthe watch is worn at all times and the dose rate is the maximum permissible.This represents an effective dose of around 0.3 µSv y-1. This dose would be themaximum that would be received if the radioactive source is retained within thetimepiece (such as for 147Pm). However, for timepieces containing a tritiumcompound, some leakage of the radioactive source may occur as tritium is very

IONISING RADIATION EXPOSURE OF THE UK POPULATION: 2005 REVIEW
48
mobile. Once the tritium has left the timepiece intake into the body may takeplace by mechanisms such as inhalation and absorption through the skin. Tritiumemits only very weak beta radiation that is unable to penetrate the skin so thatit only contributes to the effective dose once the tritium has entered the body.Assessments of the dose a wearer of a timepiece containing tritium mightreceive over a year suggest doses in the order of a few microsieverts (NRPB,1992). Therefore a nominal annual dose of about 10 µSv is assumed.
The number of such timepieces in circulation in the UK is uncertain. The numberused in the previous review was 100,000 timepieces and it is again assumedhere that this number is currently applicable. It is assumed that these are beingused on a regular basis.
Gaseous tritium light sources (GTLs) consist of small sealed vessels ofborosilicate glass internally coated with a phosphor and filled with tritium gas.They can be made small enough to be used as markers on watches and compassdials. NRPB has published (NRPB, 1992) standards for GTLs used in consumerproducts, including specifying a maximum activity of 7.4 GBq per timepiece and10 GBq per compass. Also, the tritium leakage rate should not exceed 2 kBq perday. The dose equivalent rate at the surface of the timepiece from low energybremsstrahlung should also not exceed 0.1 µSv h-1. Assuming that a personwears such a device for an entire year the maximum equivalent dose to the skinis about 0.9 mSv. The annual effective dose if such a device leaks tritium at themaximum allowed rate has been calculated to be about 0.9 µSv (NRPB, 1992).
The number of GTLs timepieces in circulation in the UK is uncertain. The numberused in the previous review, 50,000 timepieces, is again assumed to be theapproximate number currently being used on a regular basis.
5.2 Smoke alarms
Ionisation chamber smoke detectors are used to give an early warning of fire.Modern smoke detectors contain a small foil of americium-241 (241Am) with anactivity not greater than 40 kBq. A report by the NRPB (NRPB, 1992) hasreviewed the doses from ionisation chamber detectors. The dose rate at adistance of 2 m from a detector is about 2.4 10-5 µSv h-1, assuming it containsthe maximum amount of activity. In assessing the doses from a detector themost conservative assumption is that a smoke detector has been placed in thebedroom so that a person will spend 8 hours per day at a distance ofapproximately 2 m from a detector. This results in an estimated annual dose of0.07 µSv y-1. In reality most people place smoke detectors at the top of stairs orin hallways. In these cases little time is spent near to the smoke detectors aspeople only pass them when moving around the house. Thus the actual dosefrom smoke detectors in the house is much lower than that presented above.
Several recent surveys in the UK have found that about 80% of homes have asmoke detector fitted. Although not all of these may be ionisation chamberdetectors it is assumed here that they are. If the smoke detectors are located in

CONSUMER PRODUCTS AND MISCELLANEOUS ITEMS
49
the bedroom and the above dose rates are used, an average effective dose tothe UK population is about 0.06 µSv y-1. This is expected to be an overestimate.
5.3 Vaseline glass
Uranium oxides have been commonly used as colourants in glassware andceramics since the 19th century. The addition of uranium to glass produces ayellow or green colour. It was also found that the uranium exhibited fluorescenceunder ultraviolet light, causing the glass to glow with a bright green colour. Thistype of glass is often referred to as Vaseline glass. Depending on the exact mixof uranium salts and other elements used a range of colours can be produced,covering various shades of green, yellow, amber, pink, turquoise, blue and ivory.
Use of uranium in glass became increasingly popular in the late 1800s, andremained popular until the Second World War. After this time increasingconcerns over its safety led to a fall in the use of uranium in glass. There is noproduction of Vaseline glass in the UK at present, though it is still produced inthe USA and Czech Republic. There are many collectors of Vaseline glass in theUK, with collectors obtaining pieces from the UK antiques market and byimporting pieces from abroad.
Measurements of the dose rates of several items were made by NRPB from itemslent by collectors. The gamma dose rate close to the surface of the glass items isvery low, and was measured as ≤0.1 µSv h-1 from all the items studied.Measurements of beta dose rate at the surface of the glass pieces studiedranged from 1.4 µSv h-1 to 107 µSv h-1. The variation is mainly due to thedifferent uranium content of the glass samples, and to a much lesser extent tothe density of the glass. A typical surface dose rate from beta radiation was15 µSv h-1. The beta dose rate measured a few centimetres from the surfacewas negligible. For a typical beta dose rate at the surface, of 15 µSv h-1, if acollector was to spend the equivalent of 7 h y-1 handling this glass, the annualequivalent dose to the hands would be about 100 µSv. This corresponds to aneffective dose of much less than 1 µSv.
These measurements indicate that for a typical situation where a collector keepsglassware on shelves or in a display cabinet the external dose rate will benegligible. However, some pieces are known to give rise to higher dose ratesthan noted above. It is estimated that the individual dose from some collectionsof uranium glass could be up to 0.5 mSv y-1 (Skelcher, 2002). However, for alarge collection with a range of uranium concentrations, a maximum annual dosean order of magnitude lower, 0.05 mSv y-1, may be more representative.
5.4 Uranium glazed ceramics
Uranium salts have also been used in the glaze on ceramic products such astableware and tiles. Measurements (Taylor, 2002) on a sample of ceramic tilesfound that there was 0.6 g natural uranium per six inch square tile, giving a

IONISING RADIATION EXPOSURE OF THE UK POPULATION: 2005 REVIEW
50
surface dose rate of between 0.2 and 1 µSv h-1 – though the majority ofmeasurements were at the lower end of this range. If a person is in contact withsuch tiles for a few tens of hours a year, a maximum annual equivalent dose toskin of approximately 50 µSv would be received, representing an annualeffective dose of much less than 1 µSv. The use of this type of tile tends to behistorical but they may still be found in areas such as hospital corridors, wherelarge numbers of the public may visit. However in areas such as this, individualoccupancy is low, and dose rates away from the tile surface are very low. AnItalian study (Cucchi and Amadesi, 1980) of a sample of uranium glazed tilesfound that beta dose rates at 20 cm from the tile surface was in the range of 5to 70 µSv h-1, and gamma dose rates were negligible. Uranium salts have alsobeen used as colourants in ceramic tableware produced in the 1930s and 1940sin the USA, which may now be found in collectors' markets. It has been found(Streets and Thompson, 1995) that handling such items may give rise to verylow levels of contamination on the skin, and the use of this tableware for eatingcould lead to very low ingestion doses. It is unknown how many such items arein circulation in the UK, and therefore it is not possible to estimate an overalldose to the UK population from these items.
5.5 Geological specimens
Some members of the public have collections of fossils, rocks or minerals. Insome parts of the UK, in particular Devon and Cornwall, the native rocks cancontain significant concentrations of uranium and its decay products. Studieshave been performed on rocks collected from Devon and Cornwall to determinethe radionuclide content (Dixon, 1993). It was found that the uraniumconcentration generally ranged from 0.1 Bq g-1 to 1000 Bq g-1, with a fewspecimens at around 3000 Bq g-1. The mean concentration of these minerals wasapproximately 300 Bq g-1. Measurements of beta/ gamma surface dose rategave a typical value of about 100 µSv h-1, of which some 20% was from gammaradiation. High quality specimens of uraninite, not necessarily from the UK, canhave uranium concentrations in the range 5 to 10 kBq g-1.
The estimated equivalent dose to the hands from someone who has a substantialcollection of such rocks is about 300 µSv per year for a handling time of 1 hourper year, corresponding to an effective dose of less than 0.1 µSv. An annualeffective dose of about 100 µSv may also be received assuming that the collectorviews the rocks at a distance of 0.5 m for a time of 100 hours. Exposure toradon emanating from the specimens would be a small fraction of the averageUK exposure from radon gas (Dixon, 1993). The overall levels of exposure fromsuch specimens under normal conditions of handling and display are thereforeonly a small fraction of the overall dose from natural radiation.

RADIOACTIVE FALLOUT IN THE ENVIRONMENT
51
5.6 Photographic lenses
Thorium-232 (232Th) used to be added to photographic lenses in order toincrease the refractive index. The use of thoriated lenses dates approximatelyfrom the late 1930s to the late 1980s. One study (Taylor et al, 1983) estimatedthat a professional or keen amateur photographer, carrying a camera with sucha lens around the neck for several hours a day on many days of the year, couldreceive an annual effective dose of a few hundred µSv. Another study(Waligorski et al, 1985) estimated that in the extreme situation of holding such acamera 1 cm from the eye for 10 hours per week could give an annual doseequivalent of 12.5 mSv to the lens of the eye.
6 RADIOACTIVE FALLOUT IN THE ENVIRONMENT
6.1 Atomic weapons fallout
In the decade before the implementation, by the major powers, of the PartialNuclear Test Ban Treaty in 1964 there was large-scale testing of nuclearweapons in the atmosphere and these tests released radionuclides into theenvironment. In the period since then, tests have been carried out mostlyunderground which released either no radionuclides or low levels of radionuclideslocally. Most recently, India and Pakistan reported carrying out undergroundtests in 1998. However, some countries that were non-signatories to the Treatycarried out a small number of tests in the atmosphere, the last being conductedby China in 1980.
Some of the radionuclides released from the testing of nuclear weapons in theatmosphere were deposited in areas around the test site and some were carriedinto the upper atmosphere, to be dispersed globally. Over many years thisactivity transferred downwards into the troposphere and was deposited on theground, mainly in rainfall. In the period since the implementation of the Treatythe main radionuclides of radiological interest have been the longer-livedspecies: strontium-90 (90Sr) and caesium-137 (137Cs). These radionuclides aretaken up from the soil by plants and can subsequently be incorporated intofoodstuffs, resulting in radiation exposure from ingestion. Gamma radiationfrom deposited 137Cs also contributes an external radiation exposure. Theactivation product carbon-14 (14C) was dispersed globally mainly in the form ofcarbon dioxide and its principal radiological impact is made via its uptake byplants and subsequent entering into the human foodchain.
Since the 1950s national and international surveillance programmes have beenestablished to monitor the environmental levels of radionuclides from weaponsfallout in air, foodstuffs and other materials. Throughout most of this period, inthe UK, the United Kingdom Atomic Energy Authority (UKAEA) conducted ameasurement programme, including the determination of activity concentrationsin air and rainwater. This programme was continued by AEA Technology plc

IONISING RADIATION EXPOSURE OF THE UK POPULATION: 2005 REVIEW
52
(AEAT) until 1998 when NNC Limited were awarded the contract to carry out thiswork on behalf of the Environment Agency and Department of the Environment,Transport and Regions (DETR). They have published their results of radioactivityin air and rainwater in the UK in a number of publications (Dale, 2000; Dale,2001; Dale, 2002).
Measurements of fallout activity in foodstuffs have mainly been made on milk,due to its convenience for sampling. Intakes of radionuclides from milk alsoprovide a good indication of intakes from total diet. A milk sampling programmewas initially conducted by the former Agricultural Research Laboratory atLetcombe, and this was continued by NRPB up to 1997. The Food StandardsAgency (FSA) and the Scottish Environment Protection Agency (SEPA) nowarrange surveillance measurements on milk sampled from a number of locationsthroughout the UK. NRPB continue to carry out an independent milk and airsampling programme principally designed to provide data typical of the UK(Hammond, 2003).
The milk monitoring programme carried out at NRPB showed that for both 137Csand 90Sr the activity concentrations were either close to or below detection limits(Hammond, 2003).
Recent environmental measurements in air and rainwater confirm the slowdecline of levels of anthropogenic radioactivity in the environment (Dale, 2002).The 10 year running mean of 137Cs in air and rainwater is given in Table 35a(Dale, 2002), for sites monitored in the UK. Values for 90Sr are shown inTable 35b (Dale, 2002). The values currently being measured are at very lowlevels, and in some cases below the detection level.
TABLE 35a Measurements of caesium-137 in air and rainwater
Radionuclide Environmental media 10 year (1991-2000) runningmean range,
Caesium-137 Air 4.1 10-7 – 7.0 10-7 Bq kg-1
Rainwater 8.9 10-3 – 3.15 10-2 Bq kg-1
TABLE 35b Measurements of strontium-90 in rainwater and from deposition
Radionuclide Environmental media Annual concentration (1999)
Strontium-90 Rain (Chilton, Oxfordshire) <3.50 10-3 Bq l-1
Deposition <2.4 Bq m-2
The very low measured levels preclude an accurate assessment of the averageannual dose from weapons fallout in the UK. An assessment based oninternational data has been carried out by UNSCEAR (UN, 2000). The averageannual total dose from fallout in the Northern Hemisphere for 1999 was assessedas 5.9 µSv (UN, 2000). The contribution from external radiation was 3.2 µSv,which was mainly from 137Cs, while 90Sr and 14C were the main contributors to

DISPOSALS OF RADIOACTIVE WASTES
53
the ingestion dose of 2.7 µSv. The average annual dose in the UK is thereforetaken to be approximately 6 µSv. This is slightly higher than the estimate givenin the previous review, for which the contribution from external radiation wasuncertain.
6.2 Fallout from Chernobyl
Cumbria, north Wales and southern Scotland were the parts of the UK mostaffected by the 137Cs deposition from the Chernobyl reactor accident. Thisactivity was taken up by grass and entered the human foodchain mainly viasheepmeat. In 1986 a restriction was placed on the movement and marketing ofsheep from parts of these areas, and an EC action level on sheep of 103 Bq kg-1
was implemented (EA et al, 2004). In 2003, 377 farms were still restricted inEngland, Scotland and Wales, whereas in 1986, 8,900 farms were underrestriction. Thus 96% of farms have been derestricted over the interveningperiod. In Northern Ireland, since 2000, there have been no farms underrestriction since monitoring showed that all sheep are well below the action level(EA et al, 2004). As noted in previous reviews, a person consuming sheepmeatcontinuously contaminated with a 137Cs concentration of 103 Bq kg-1, at anaverage rate for consumers of 8 kg y-1 (Smith and Jones, 2003), would receivean additional annual dose of about 100 µSv.
7 DISPOSALS OF RADIOACTIVE WASTES
Discharges of radioactive wastes to air and sea, and disposals of solid wastes,are made under the provisions of the Radioactive Substances Act 1993 (GBParliament, 1993), subject to authorisation and agreement by the EnvironmentAgency (EA) in England and Wales, the Scottish Environmental ProtectionAgency (SEPA) in Scotland and the Northern Ireland Office in Northern Ireland.In 2001 there were approximately 850 non-nuclear premises authorised todischarge radioactive wastes in England and Wales with a further 34 siteslicensed under the 1965 Nuclear Installations Act (EA, 2003). The non-nuclearsites include hospitals, universities, industries and research centres.
Following publication of the recommendations of ICRP (ICRP, 1991), NRPBrecommended a maximum dose constraint of 0.3 mSv y-1 for a single controlledsource (NRPB, 1993b). This was further reinforced by a government White Paper(CM 2919, 1995) on waste management policy that proposed a 'site constraint'of 0.5 mSv y-1. The ICRP recommendations were also adopted by the ECdirective on Basic Safety Standards (EC, 1996). The main requirement for publicdose limitation is that the annual dose to the most exposed members of thepublic, excluding natural background radiation and medical procedures, must notexceed 1 mSv. This requirement was transposed into UK legislation by means ofa Direction (DETR, 2000) extending to England and Wales, issued by the then

IONISING RADIATION EXPOSURE OF THE UK POPULATION: 2005 REVIEW
54
Secretary of State for Environment Transport and Regions in 2000. ThisDirection requires the EA to ensure, wherever possible, that:
a all public radiation exposures from radioactive waste disposal are keptas low as reasonably achievable (ALARA);
b the sum of such exposures does not exceed the dose limit of 1 mSv y-1;c the dose received from any new source does not exceed 0.3 mSv y-1;d the dose received from any single site does not exceed 0.5 mSv y-1.
The Scottish Environment Protection Agency (SEPA) is subject to a similarDirection in Scotland.
The UK strategy for Radioactive Discharges 2001-2020 (Defra, 2002) sets outthe UK plans for implementing the Oslo and Paris Commission (OSPAR)convention for radioactive substances. The OSPAR strategy with regard toRadioactive Substances states that the Commission will ensure that by 2020,discharges, emissions and losses of radioactive substances are reduced to levelswhere the additional concentrations in the marine environment above historiclevels, resulting from such discharges, emissions and losses, are close to zero(OSPAR, 1998). The discharge reductions set out in the UK strategy areexpected to result in an estimated average annual dose of no more than0.02 mSv to a representative member of a local critical group of the generalpublic, as a result of authorised radioactive liquid discharges made from 2020onwards.
The UK regulatory bodies operate monitoring programmes to measure the levelsof radionuclides in the environment as a result of authorised discharges. Theresults for the major sites are published annually. Radioactivity In Food and theEnvironment (RIFE) reports (FSA, 2001) (FSA, 2000) (FSA, 1999) are publishedby the Foods Standards Agency (FSA) and SEPA, and in 2003, and 2004, by theEnvironment Agency (EA), Environment & Heritage Service for Northern Ireland(E&HS), FSA and SEPA (EA et al, 2003; EA et al, 2004). They contain theresults of foodstuff and external dose rate monitoring throughout the UK, theChannel Islands and the Isle of Man. The FSA was formed in April 2000 takingover the responsibilities previously held by the Ministry of Agriculture, Fisheriesand Food (MAFF), Department of Health (DH) and the National Assembly forWales in relation to food safety. The information in those reports is collected bythe Centre for Environment, Fisheries and Aquaculture Science (CEFAS), onbehalf of the interested parties. The EA has also produced annual reports onRadioactivity in the Environment (EA, 2003) summarising the results of the EA’smonitoring programmes. This monitoring is carried out to assess the impact ofauthorised waste discharges on the environment. The monitoring results areused by EA to assess doses to critical groups, which are identified on the basis oflocation and habits. A critical group may be defined by above averageconsumption rates of certain foodstuffs, carrying out certain working practices orpastimes, or living in close proximity to a site. Other members of the public wholive in the vicinity of a site but have more average habits receive doses at alower level than the critical group. The rest of the population may also receivedoses from that site’s operations but usually at extremely low levels.

DISPOSALS OF RADIOACTIVE WASTES
55
The doses to the critical groups assessed (EA et al, 2004) for the main routes ofexposure for discharges made in 2003 are given in Table 36. More detailedinformation of these assessments is provided in the annual RIFE reports whichare available to download from the FSA (www.fsa.gov.uk) and SEPA(www.sepa.org.uk) websites. A discussion of the main industries follows, whichincludes data from Table 36 and other referenced sources.
TABLE 36 Radiation doses to critical groups due to discharges of liquid and atmosphericradioactive waste in the UK, 2003 (EA et al, 2004)
Establishment Exposure routes Exposed group Dose
µSv y-1
BNFL Sellafield Seafood consumption and external Local consumers 210Terrestrial food, external andinhalation (near Sellafield)
Local consumer (1 year old) 34
Terrestrial food (Ravenglass) Local consumer (1 year old) 19External (Ravenglass) Local occupant 41External (Ribble estuary) Houseboat occupants 79External (dose to skin) Anglers 210*External (dose to skin) Fisherman handling fishing gear 110*
Springfields Seafood consumption Local consumers 19External gamma exposure Houseboat occupants 79External (dose to skin) Local fishing community 670*Terrestrial foods Local consumers <5#
Capenhurst Inadvertent ingestion of freshwaterand sediments
Children (10 years old) playingnear river
9
Terrestrial foods Local consumers (1 year old) <5Chapelcross Seafood consumption and external Local consumers 37
Terrestrial foods Local consumers (1 year old) 20Drigg Terrestrial foods Local consumers (1 year old) 46
UKAEA/AEAT Dounreay Seafood consumption Local consumers <5External gamma exposure Beach occupants 11Terrestrial foods Local consumers 6
Culham River water and sediment ingestion Local consumers <5Harwell Freshwater fish and external Anglers 11
Terrestrial foods Local consumers (1 year old) <5Winfrith Seafood consumption and external Local consumers 6
Terrestrial foods Local consumers (1 year old) <5Berkeley andOldbury
Seafood consumption and external Local consumers 7
Terrestrial foods Local consumers (1 year old) <5
Nuclear powerstations
Bradwell Seafood consumption and external Local consumers 13Terrestrial foods Local consumers (1 year old) <5
Dungeness Seafood consumption and external Local consumers 7Terrestrial foods, external andinhalation near site
Local consumers 110
Hartlepool Seafood consumption and external Local consumers <5Terrestrial foods Local consumers (1 year old) <5
Heysham Seafood consumption and external Local consumers 75Terrestrial foods Local consumers (1 year old) 6
Hinkley Point Seafood consumption and external Local fishing community 13Terrestrial foods Local consumers (1 year old) <5
Hunterston Seafood consumption Local consumers <5External Beach occupants 7Terrestrial foods Local consumers (1 year old) 14
Sizewell Seafood consumption and external Local consumers <5Terrestrial foods, external andinhalation near site
Local consumers 57

IONISING RADIATION EXPOSURE OF THE UK POPULATION: 2005 REVIEW
56
TABLE 36 (Continued) Radiation doses to critical groups due to discharges of liquid andatmospheric radioactive waste in the UK, 2003 (EA et al, 2004)
Establishment Exposure routes Exposed group Dose
µSv y-1
Torness Seafood consumption and external Local consumers 5Terrestrial foods, external andinhalation near site
Local consumers (1 year old) 19
Trawsfynydd Freshwater fish and external Anglers 32Terrestrial foods Local consumers (1 year old) 6
Wylfa Seafood consumption and external Local consumers 12
Nuclear powerstations
Terrestrial foods Local consumers (1 year old) <5Defenceestablishments
Aldermaston Freshwater fish and external Anglers <5
Terrestrial foods Local consumers (1 year old) <5#
Derby River water Local consumers <5Devonport Seafood consumption and external Local consumers <5
Terrestrial foods Local consumers <5Faslane Seafood consumption and external Local consumers <5Holy Loch External Anglers 9Rosyth External Boat users <5
Amersham Amersham Freshwater fish and external Anglers 5Terrestrial foods Local consumers (1 year old) <5
Cardiff Seafood consumption and external Local consumers 24Inadvertent ingestion of sediment Anglers <5Consumption of wildfowl Local consumers <5Terrestrial foods, external andinhalation near site
Local consumers (1 year old) 16
Rhodia Whitehaven Seafood consumption† Local consumers 410
Seafood consumption¶ Local consumers 620* Skin doses are subject to an annual limit of 50 mSv.# Includes contribution from natural sources of radionuclides.† Excluding radionuclides from Sellafield.¶ Including radionuclides from Sellafield.
7.1 Uranium enrichment and fuel manufacture
Uranium for the production of nuclear fuel is enriched at the URENCOCapenhurst site, where very low quantities of radionuclides are discharged to theatmosphere from stacks, and via liquid effluent into a local brook. BNFL alsooperates from this site; it is mainly concerned with the decommissioning of plantthat is no longer in operation. The radionuclides discharged by URENCOoperations are predominantly uranium and its decay products, tritium (3H),technetium-99 (99Tc) and neptunium-237 (237Np) (from recycled fuel). At thissite a hypothetical critical group is specified, who are assumed to be childrenplaying in and around the local brook. In 2003, members of this group wouldhave received a dose of around 9 µSv y-1 (EA et al, 2004). Typical individuals inthe vicinity of the site would receive lower doses.
Nuclear fuel is manufactured at the BNFL Springfields site, which results in lowquantities of aerial and liquid radioactive discharges. The radionuclidesdischarged from this site mainly consist of uranium and thorium and their decayproducts. The liquid effluents are discharged into the River Ribble, which flowsinto the Ribble Estuary. Here fishermen and houseboat dwellers are the maincritical groups. The sediments of the estuary have also adsorbed radionuclides

DISPOSALS OF RADIOACTIVE WASTES
57
discharged from Sellafield for many years, and this source still represents themajor contribution to the radiation exposure from the aquatic environment. In2003, it was assessed that houseboat dwellers would receive a dose of 79 µSv(EA et al, 2004) (mainly due to historic Sellafield discharges), which is similar toprevious years.
7.2 Nuclear power stations
Discharges from nuclear power stations contain low levels of activation andfission products such as tritium (3H), carbon-14 (14C), sulphur-35 (35S), cobalt-60 (60Co) and caesium-137 (137Cs). Each of the operators carries outenvironmental monitoring around the site, as do CEFAS and EA. The results ofthe monitoring programmes are produced in the operators' annual environmentalreports as well as the RIFE and EA reports. The principal critical group dosesassessed by CEFAS are listed for each station in Table 36 (EA et al, 2004). Forstations around the Irish Sea, the critical group dose is mainly due to externalexposure to americium-241 (241Am) and 137Cs in intertidal areas, and ingestionof seafood containing 137Cs, mainly from Sellafield discharges. The highestcritical group dose in 2003, 110 µSv, was received in the vicinity of Dungenessnuclear power station (EA et al, 2004). All other critical group doses fromnuclear power station discharges in 2003 were assessed to be below 100 µSv.This was also the case in both 2001 and 2002 (FSA and SEPA, 2002; EA et al,2003).
Members of the public who frequent or live in areas close to nuclear powerstations, in particular some of the older Magnox stations, can receive externalexposures from direct radiation from parts of the plant. In general, the criticalgroup for this route of exposure is not the same as for other exposure pathways.The annual exposures of these small groups in 2002, which are typical of recentyears and given in Table 37, were less than 100 µSv apart from Chapelcross,Bradwell and Dungeness A stations. The doses in 2002 to the critical groups atthese stations were assessed as 110 µSv, 220 µSv and 560 µSv, respectively(BNFL, 2002). Direct radiation from British Energy stations tends to be muchlower. Annual doses at the site fence are typically less than 10 µSv (BritishEnergy, 2004).

IONISING RADIATION EXPOSURE OF THE UK POPULATION: 2005 REVIEW
58
TABLE 37. Doses from direct radiation from Magnox power stations and othersites in 2002
Sites Annual dose from direct radiation*, µSv
Magnox sites
Berkeley 23
Bradwell 220
Chapelcross 110
Dungeness A 560
Hinkley Point A Bg#
Hunterston A 43
Oldbury Bg#
Sizewell A 16-28†
Trawsfynydd 10
Wylfa 5.1
Other sites
Sellafield 19
Drigg 84
Springfields Bg#
Capenhurst 70
Notes:
* Measurements taken from TLDs on perimeter fence. Doses to members of the public at thecritical location are calculated using these data, corrected for background radiation.
# Bg = background
† Four critical groups were identified: habitation near site, 28 µSv; fishermen, 28 µSv; anglers,17 µSv; and dog walkers, 16 µSv.
7.3 Fuel reprocessing
Although there have been decreases in discharges made by Sellafield in recentyears, the environmental levels have not reduced substantially. This is mainlydue to historical discharges of 137Cs. Liquid wastes from Sellafield are dischargeddirectly to the Irish Sea via a pipeline. The main routes of exposure are theconsumption of seafood and external exposures to radionuclides adsorbed ontoestuarine and harbour sediments, as well as through handling contaminatedfishing gear. The local critical group of seafood consumers was assessed byCEFAS (EA et al, 2004) to have received 210 µSv in 2003, from Sellafielddischarges (including a contribution from external exposure). This is slightlyhigher than the value of 190 µSv noted in the previous year's report, and wasmainly due to an increase in the consumption of crustaceans by the criticalgroup.
The doses received by the main critical groups around the Sellafield site in theyears 1998 to 2003 (EA et al, 2004), (EA et al, 2003), (FSA and SEPA, 2002),(FSA and SEPA, 2001), (FSA and SEPA, 2000) and (MAFF and SEPA, 1999) aresummarised in Table 38.

DISPOSALS OF RADIOACTIVE WASTES
59
TABLE 38 Radiation doses to critical groups due to discharges of radioactivewaste from Sellafield
Annual Dose, mSvPathway Critical Group
1998 1999 2000 2001 2002 2003
Fish and Shellfishconsumption
Local consumers 0.20 0.21 0.15 0.16 0.19* 0.21*
Terrestrial foods Local consumers 0.04c 0.04 0.03 0.04 0.04#,† 0.03#,†
External (Skin) Anglers 0.30 0.18 0.16 0.20 0.22 0.21
Handing Fishing Gear Local fishingcommunity
0.07 0.11 0.12 0.13 0.15 0.11
Seaweed fertilised crops Local consumers 0.03 0.03 0.02 0.02 0.01 0.03
* Includes external dose from intertidal areas.# Includes external and inhalation doses.† Dose to 1 year old.
The main exposure pathways are the consumption of foodstuffs, externalexposure from skin contamination and exposure through handling fishing gear.These exposures were received by three main critical groups: the localcommercial fishing community, anglers and local consumers. In general theseannual doses are low. In addition to the exposures received from radionuclidesdischarged from Sellafield in seafoods, the local critical group also receives anexposure from natural radionuclides discharged from an industrial plant inWhitehaven. In 2003, this additional dose was 410 µSv, which increases theoverall dose to the critical group of seafood consumers to 620 µSv.
The critical group doses calculated for immersion in 41Ar released from theSellafield site in 2002, are significantly lower than in from previous years, due tothe final shut-down of the Calder reactors. The total critical group dosesassessed by BNFL for terrestrial pathways from all airborne discharges, were24 µSv, 20 µSv and 25 µSv for adults, children and infants respectively (BNFL,2003). For comparison, in 2001, the total doses to the terrestrial critical groupwere assessed by BNFL to be 58, 44 and 48 µSv (BNFL, 2002).
It has recently been calculated (Roberts, 2004) that the annual individual doseattributable to Sellafield, averaged over the population of Cumbria, is 10.7 µSv.This is dominated by the dose due to marine discharges (10.3 µSv) with theremainder (0.4 µSv) due to atmospheric discharges.
7.4 Defence establishments
Ministry of Defence (MoD) establishments are not subject to the same formallegal control as other nuclear sites; however, discharges are made with theformal agreement of the authorising bodies. Sites managed by contractors onbehalf of the MoD must be regulated in the same way as civilian sites. CEFAS,EA, FSA, SEPA and MoD carry out monitoring surveys around each of the ninemain defence-related sites to assess the radiological significance of thedischarges. In 2003 doses were estimated as insignificant, or extremely low.

IONISING RADIATION EXPOSURE OF THE UK POPULATION: 2005 REVIEW
60
Exposures of less than 5 µSv (EA et al, 2004) were estimated to have beenreceived by the critical groups around all defence sites except Holy Loch. At thatlocation, a critical group member might have received 9 µSv from externalexposure in intertidal areas (EA et al, 2004), arising from the presence of 60Co insediments as a result of past discharges from the US submarine support facilitythat closed in 1992.
A report produced by the Defence Science and Technology Laboratory,Radiological Protection Services (Corns and Aylward, 2004), reports the resultsof marine environmental radioactivity surveys carried out at nuclear submarineberths in 2002. The nuclide of major importance in naval discharges is 60Co.Tritium (3H) and 14C are also discharged. These radionuclides were below thelimit of detection at Plymouth, Loch Striven, Isle of Bute, Loch Goil, Loch Longand Gareloch.
At Rosyth Royal Dockyard, 60Co was detected in 2 out of 36 samples (Corns andAylward, 2004) and the annual effective dose received by the Rosyth criticalgroup (occupancy of intertidal sediments) was calculated to be <1 µSv. Tracelevels of 14C were found in marine biota. The dose to a critical group of seafoodconsumers was calculated to be <1 µSv. At Barrow-in-Furness only very lowlevels of 60Co were detected. Although other radionuclides, such as 137Cs and241Am were detected in higher concentrations: it is understood that these areattributable to authorised discharges from Sellafield, weapons testing fallout andthe Chernobyl accident. From the low levels of 60Co detected, a critical groupdose was calculated to be approximately 2 µSv. At Portsmouth and the Isle ofWight very low levels of 60Co were detected. The annual dose to a critical groupspending time on intertidal sediments in these areas was calculated to be 1 µSv.It was concluded that the naval contribution to either external or internal publicdoses was at negligible levels.
7.5 Nuclear and technology services
This subsection covers sites that were formerly operated wholly by UKAEA,namely Dounreay, Harwell and Winfrith. However, there have beenadministrative changes at each of these sites, and now many of the activities onthese sites are carried out by other organisations as tenants. All three siteshouse research reactors that have been, or are in the process of beingdecommissioned.
7.5.1 DounreayThe Dounreay site was opened in 1955, and since that time three researchreactors have been built, operated and shut down. They are now undergoingdecommissioning, as is the rest of the site. All discharges from Dounreay arenow as a result of decommissioning works and are made to the sea via apipeline.

DISPOSALS OF RADIOACTIVE WASTES
61
There are four potential exposure pathways considered in the marinesurveillance programme (EA et al, 2004). The first relates to external exposureto radioactivity adsorbed onto fine particulate matter that becomes entrained onfishing gear that is regularly handled. The critical group in this case is a group offishermen who operate a fishery close to Dounreay. Measurements made in2003 showed that this pathway was of no radiological significance. The secondpotential pathway relates to the ingestion of locally collected seafoods. Theestimated dose from this pathway for the critical group was less than 5 µSv in2003 (EA et al, 2004). The third potential pathway is a result of externalexposure over local beaches. The estimated dose from this pathway for thecritical group was 11 µSv in 2003 (EA et al, 2004). The fourth potentialpathway relates to external exposure from the uptake of radioactivity byparticulate material that has accumulated in rocky areas of the foreshore.Measurements have shown that the estimated dose from this pathway for thecritical group was less than 5 µSv in 2003 (EA et al, 2004).
Fragments of irradiated nuclear fuel have been discovered on the Dounreayforeshore and nearby public beaches. The dose implications are currently beingassessed by HPA Radiation Protection Division on behalf of SEPA. On the basis ofcurrent monitoring data the probability of a member of the public encountering afragment is extremely low. Current knowledge on the behaviour of thefragments is described in the Dounreay Particles Advisory Group’s second interimreport, available on the SEPA website.
For the terrestrial environment, the critical group of food consumers wereestimated to have received 6 µSv in 2003, which includes a contribution due toweapons test fallout (EA et al, 2004).
7.5.2 HarwellLiquid wastes are discharged to the River Thames at Sutton Courtney and to theLydebank Brook north of the site. Monitoring showed that there were someenhanced concentrations of radionuclides near to the River Thames outfall, butthese were of small radiological significance. Anglers have been identified as thecritical group for liquid discharges in the Harwell area. Although consumption offish from the river was not found to occur, an assumed consumption rate of1 kg y-1 was used in the dose assessment. This, excluding external exposure,was found to result in a dose of less than 11 µSv in 2003 (EA et al, 2004). Thedose to the critical group of local consumers from gaseous discharges wasestimated to be less than 5 µSv in 2003 (EA et al, 2004).
7.5.3 WinfrithLiquid wastes are discharged into deep water in Weymouth Bay underauthorisation. Technetium-99 (99Tc) found in seaweed in the area could occur asa result of discharges from Sellafield, the Cap de la Hague reprocessing plant inFrance or from weapons testing. The critical group doses in 2003 were assessed

IONISING RADIATION EXPOSURE OF THE UK POPULATION: 2005 REVIEW
62
to be 6 µSv from liquid discharges and less than 5 µSv from gaseous discharges(EA et al, 2004). These estimates are similar to those made in recent years.
7.6 Radionuclide production
Amersham Plc (now part of GE Healthcare) manufactures radioactive materials,including radioactively labelled materials for use in medicine, research andindustry. The company operates from two main sites in the UK, located inAmersham, Buckinghamshire and Cardiff, South Glamorgan. Liquid dischargesfrom the Amersham site are made into the local sewer system, which releasesinto the Grand Union Canal and the River Colne, which in turn flows into theRiver Thames. It was determined that anglers are the most exposed groupaffected by the liquid discharges. As in the Harwell area, there is no evidence ofthe anglers consuming their catches, but it has been assumed that a smallquantity would be eaten annually. An angler’s total annual dose from thisdischarge route was assessed to be less than 5 µSv in 2003 (EA et al, 2004).The dose to the critical group of terrestrial food consumers was assessed to beless than 5 µSv in 2003 (EA et al, 2004), which is similar to previous years.
The laboratory at Cardiff produces radiolabelled compounds containing 3H and14C used in research and medical diagnostic kits. Liquid discharges are madeinto the Severn Estuary via the sewer system after passing through a new wastewater treatment works. Aerial discharges of tritium and carbon-14 are alsomade from the site. The dose to the most exposed group of seafood consumerswas 24 µSv in 2003 (EA et al, 2004) including a contribution due to externalradiation. The dose to anglers on the River Taff was estimated to be much lessthan 5 µSv. In 2003 a habit survey identified the consumption of wildfowl as apathway. Based on a high rate of consumption (5.6 kg y-1) the dose wasestimated to be less than 5 µSv. The critical group for terrestrial foodstuffs wasinfants, from ingestion of food produced on land conditioned by pelleted sludgeproduced at the new waste water treatment works. It was assessed that in2003 the highest dose would have been less than 16 µSv, with doses from non-foodstuffs pathways being less than 1 µSv (EA et al, 2004).
7.7 Research laboratories
Three research laboratories are mentioned in the EA, E&HS, FSA and SEPA, 2004report: Imperial College Reactor Centre, Ascot, Berkshire; Imperial ChemicalIndustrial plc, Billingham, Cleveland; Scottish Universities’ Research ReactorCentre, South Lanarkshire. Monitoring carried out at all three sites in 2003shows that, as in recent years, there was no detected impact on theenvironment from the operation of these sites.

DISPOSALS OF RADIOACTIVE WASTES
63
7.8 Drigg
The authorisation for the Drigg landfill site allows aerial discharges from the site.These discharges are at very low levels, and consist of escaping gases. Also,migration of leachate from the site into groundwater can occur, with subsequentuptake into local foodstuffs. In 2001, there were enhanced levels of 3H infoodstuffs found near to the Drigg site. All other radionuclides detected were at asimilar level to or lower than those for the Sellafield site. The dose to the criticalgroup who live close to the Drigg disposal facility, including a component due toChernobyl and weapons testing fallout, was 46 µSv in 2003 (EA et al, 2004).
Another critical group identified at this site is campers or picnickers drinkingfrom the Drigg stream. The dose to this critical group from the inhalation andingestion of radionuclides was assessed to be less than 5 µSv in 2003 (EA et al,2004).
7.9 Other landfill sites
Low levels of radioactive materials may be disposed of at some landfill sites. Forexample, iodine-125 (125I) is detected in borehole water at some landfill sites,typically at very low levels of <0.1 Bq l-1 (EA et al, 2004). However, 125I is notdetected in seawater or seaweed in areas around nuclear power plants, as itsmain use is for medical diagnostic procedures.
It is estimated that a dose arising from inadvertent ingestion of watercontaminated by leachate arising from a landfill accepting 125I contaminatedwaste is 5 µSv y-1 (EA et al, 2004). Tritium is also detected near some landfillsites. At a site in the Thames region, a person drinking water from a nearbyborehole, assuming the maximum tritium concentration observed in 2001(958 Bq l-1), would have received an annual dose of less than 12 µSv (EA, 2003;EA et al, 2003).
7.10 The NORM industries
There are several industries in the UK which use or process materials thatcontain Naturally Occurring Radioactive Materials (NORM). These industriesinclude the steel industry, the oil and gas industries, and mineral sandsindustries. Coal fired power stations produce ash containing NORM, and bothcoal and gas fired power stations release NORM. Historically, other NORM relatedindustries in the UK were a phosphates industry and a tin mining industry.
As a result of their processes, these industries produce NORM contaminatedwastes that require disposal to, for example, landfill. In recent years the NRPBhas carried out studies into the radiological impact on the UK population of theremaining NORM industries on behalf of the Environment Agency (Smith et al,2001; Crockett et al, 2003; Warner Jones et al, to be published; Oatway et al, tobe published). Table 39 summarises the results of these studies for the main

IONISING RADIATION EXPOSURE OF THE UK POPULATION: 2005 REVIEW
64
discharge routes and pathways, showing the critical group dose, as well as thedose to the average member of the local population where appropriate. The datarefer to typical discharge practices over the past decade. The reports describingthe coal-fired power production and the steel industry also considered exposurefrom using waste that has low levels of natural radioactivity as building products,since ash can be used in cement in place of some of the normal constituents.However, in this case it was noted that the materials that these industry wastesreplace often have a higher activity concentration of natural radionuclides thanthe waste materials. So although a dose is being received from these materials,this may represent a dose saving over using standard materials (Smith et al,2001; Crockett et al, 2003).
TABLE 39 Radiation doses to critical groups and average individuals due toreleases of Naturally Occurring Radioactive Materials (NORM) in industry,typical of recent years
Industry Discharge Route Pathway Annualcritical groupdose,µSv
Averageannualdose,µSv
Coal Fired PowerStations
Atmospheric releases via stack* All 1.5 0.1
Building materials made frompower station ash
Inhalation ofRadon
600†
Building materials made frompower station ash
External 900†
Oil and gasextraction
Authorised discharges to sea andNORM contaminated scales
Ingestion ofseafood andexternalexposure tofishing gear
<30
Discharges to sea of NORMcontaminated produced waters
10
Gas Fired PowerStations
Atmospheric releases via stack* All 0.75 0.032
Use of Natural Gas Cooking with natural gas Inhalation andExternal
<20 to 500# <10#
Steel Production Atmospheric Releases All <100 <2
Building materials made fromslag
Inhalation ofRadon
550†
Building materials made fromslag
External 800†
Zircon Sands Atmospheric releases Inhalation <1 <1
Liquid disposal of floor washings External <1 <1
Notes:* The critical group are individuals living in close proximity to the power station. Average individualdoses are to members of the public living in the locality of a power station.# Critical group dose to workers in a commercial kitchen, average dose is the average dose to thepopulation from cooking with natural gas.† As this dose is not necessarily higher than from other building materials it is not strictly a criticalgroup dose.
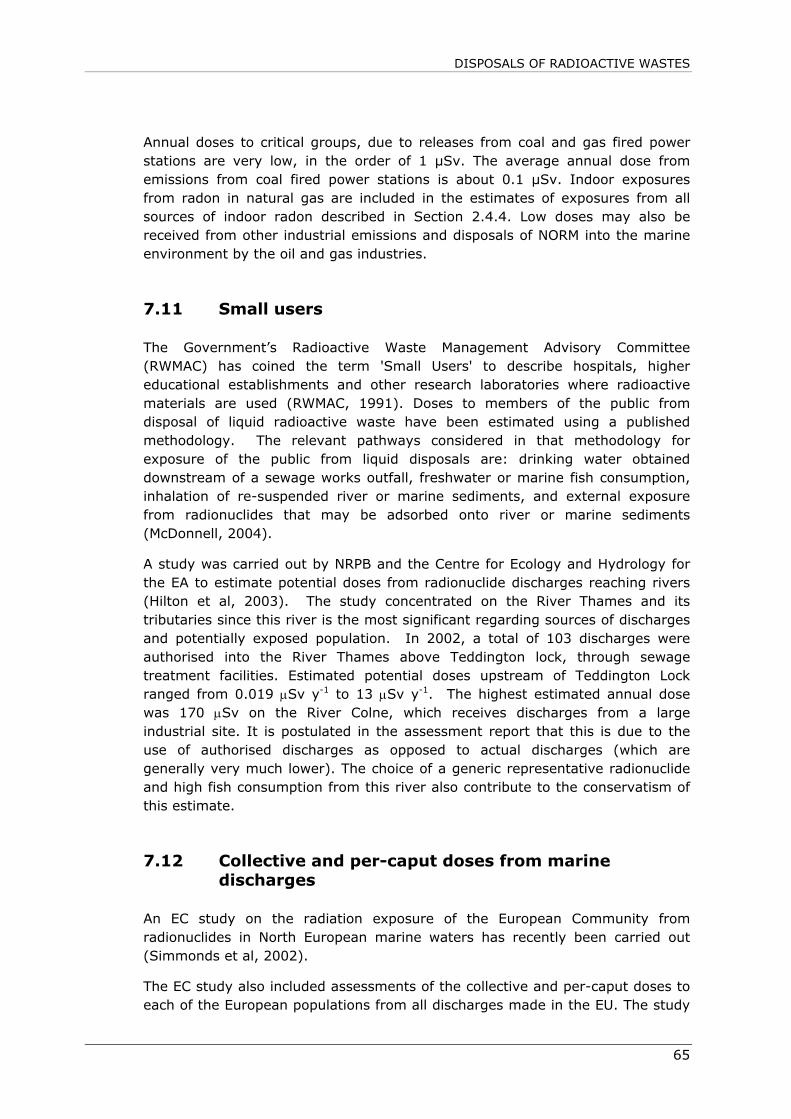
DISPOSALS OF RADIOACTIVE WASTES
65
Annual doses to critical groups, due to releases from coal and gas fired powerstations are very low, in the order of 1 µSv. The average annual dose fromemissions from coal fired power stations is about 0.1 µSv. Indoor exposuresfrom radon in natural gas are included in the estimates of exposures from allsources of indoor radon described in Section 2.4.4. Low doses may also bereceived from other industrial emissions and disposals of NORM into the marineenvironment by the oil and gas industries.
7.11 Small users
The Government’s Radioactive Waste Management Advisory Committee(RWMAC) has coined the term 'Small Users' to describe hospitals, highereducational establishments and other research laboratories where radioactivematerials are used (RWMAC, 1991). Doses to members of the public fromdisposal of liquid radioactive waste have been estimated using a publishedmethodology. The relevant pathways considered in that methodology forexposure of the public from liquid disposals are: drinking water obtaineddownstream of a sewage works outfall, freshwater or marine fish consumption,inhalation of re-suspended river or marine sediments, and external exposurefrom radionuclides that may be adsorbed onto river or marine sediments(McDonnell, 2004).
A study was carried out by NRPB and the Centre for Ecology and Hydrology forthe EA to estimate potential doses from radionuclide discharges reaching rivers(Hilton et al, 2003). The study concentrated on the River Thames and itstributaries since this river is the most significant regarding sources of dischargesand potentially exposed population. In 2002, a total of 103 discharges wereauthorised into the River Thames above Teddington lock, through sewagetreatment facilities. Estimated potential doses upstream of Teddington Lockranged from 0.019 µSv y-1 to 13 µSv y-1. The highest estimated annual dosewas 170 µSv on the River Colne, which receives discharges from a largeindustrial site. It is postulated in the assessment report that this is due to theuse of authorised discharges as opposed to actual discharges (which aregenerally very much lower). The choice of a generic representative radionuclideand high fish consumption from this river also contribute to the conservatism ofthis estimate.
7.12 Collective and per-caput doses from marinedischarges
An EC study on the radiation exposure of the European Community fromradionuclides in North European marine waters has recently been carried out(Simmonds et al, 2002).
The EC study also included assessments of the collective and per-caput doses toeach of the European populations from all discharges made in the EU. The study
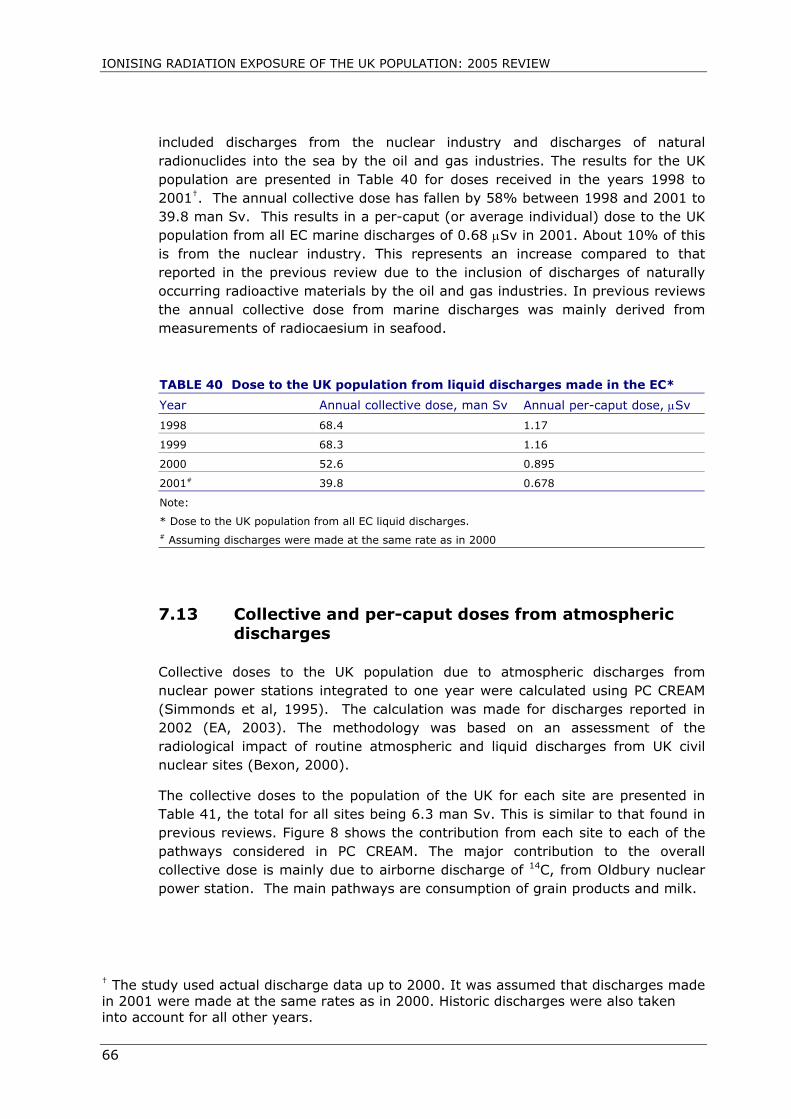
IONISING RADIATION EXPOSURE OF THE UK POPULATION: 2005 REVIEW
66
included discharges from the nuclear industry and discharges of naturalradionuclides into the sea by the oil and gas industries. The results for the UKpopulation are presented in Table 40 for doses received in the years 1998 to2001†. The annual collective dose has fallen by 58% between 1998 and 2001 to39.8 man Sv. This results in a per-caput (or average individual) dose to the UKpopulation from all EC marine discharges of 0.68 µSv in 2001. About 10% of thisis from the nuclear industry. This represents an increase compared to thatreported in the previous review due to the inclusion of discharges of naturallyoccurring radioactive materials by the oil and gas industries. In previous reviewsthe annual collective dose from marine discharges was mainly derived frommeasurements of radiocaesium in seafood.
TABLE 40 Dose to the UK population from liquid discharges made in the EC*
Year Annual collective dose, man Sv Annual per-caput dose, µSv
1998 68.4 1.17
1999 68.3 1.16
2000 52.6 0.895
2001# 39.8 0.678
Note:
* Dose to the UK population from all EC liquid discharges.# Assuming discharges were made at the same rate as in 2000
7.13 Collective and per-caput doses from atmosphericdischarges
Collective doses to the UK population due to atmospheric discharges fromnuclear power stations integrated to one year were calculated using PC CREAM(Simmonds et al, 1995). The calculation was made for discharges reported in2002 (EA, 2003). The methodology was based on an assessment of theradiological impact of routine atmospheric and liquid discharges from UK civilnuclear sites (Bexon, 2000).
The collective doses to the population of the UK for each site are presented inTable 41, the total for all sites being 6.3 man Sv. This is similar to that found inprevious reviews. Figure 8 shows the contribution from each site to each of thepathways considered in PC CREAM. The major contribution to the overallcollective dose is mainly due to airborne discharge of 14C, from Oldbury nuclearpower station. The main pathways are consumption of grain products and milk.
† The study used actual discharge data up to 2000. It was assumed that discharges madein 2001 were made at the same rates as in 2000. Historic discharges were also takeninto account for all other years.

DISPOSALS OF RADIOACTIVE WASTES
67
Table 41 also gives the UK collective doses due to global circulation ofatmospheric discharges of four radionuclides from each site, and Figure 9 depictsthe contribution made by the four radionuclides. The major contributors to theglobal circulation collective dose are from the atmospheric discharge of 85Kr and129I from Sellafield. These contributions are at least two orders of magnitudelower than those from the direct emissions.
In 2000 the population of the UK was reported to be 58.8 million (Laverty,2003). The annual collective dose from UK civil nuclear sites in 2002 was6.3 man Sv, giving an annual per caput dose of 0.11 µSv.
TABLE 41 Total and global circulation collective doses to the UK populationfollowing discharges from UK civil nuclear sites in 2002
Nuclear Power Station Total, man Sv Global circulation, man Sv
Bradwell 7.30 10-2 4.51 10-5
Chapelcross 7.40 10-1 5.08 10-4
Dounreay 3.80 10-4 2.67 10-5
Dungeness A 6.00 10-2 1.84 10-4
Dungeness B 3.70 10-1 9.90 10-4
Hartlepool 2.30 10-1 5.04 10-4
Heysham 1 1.80 10-1 3.75 10-4
Heysham 2 1.80 10-1 3.63 10-4
Hinkley Point A 6.00 10-4 7.47 10-7
Hinkley Point B 3.20 10-1 3.06 10-4
Hunterston B 3.50 10-1 6.35 10-4
Oldbury 1.90 10 0 1.27 10-3
Sellafield 1.30 10 0 1.62 10-2
Sizewell A 3.50 10-1 3.33 10-4
Sizewell B 3.30 10-2 5.54 10-5
Torness 3.70 10-2 1.47 10-4
Wylfa 2.10 10-1 4.38 10-4
Total 6.33 10 0 2.24 10-2

ION
ISIN
G R
AD
IATIO
N E
XPO
SU
RE O
F TH
E U
K PO
PULA
TIO
N: 2
005 R
EVIE
W
68
Figure 8 Collective dose integrated to 1 year, to the UK population, from atmospheric discharges in 2002
0.00E+00
5.00E-01
1.00E+00
1.50E+00
2.00E+00
2.50E+00
Cloud g
amma
Cloud b
etaInh
alatio
n
Depos
ited g
amma
Depos
ited b
etaRes
uspe
nsion
Green v
egeta
bles
Grain
Root v
egeta
bles
Cow m
eat
Cow liv
erShe
ep m
eat
Sheep
liver Milk
Milk pr
oduc
ts
Pathways considered
man
Sv
WylfaTornessSizewell BSizewell ASellafieldOldburyHunterston BHinkley Point BHinkley Point AHeysham 2Heysham 1HartlepoolDungeness ADungeness BDounreayChapelcrossBradwell
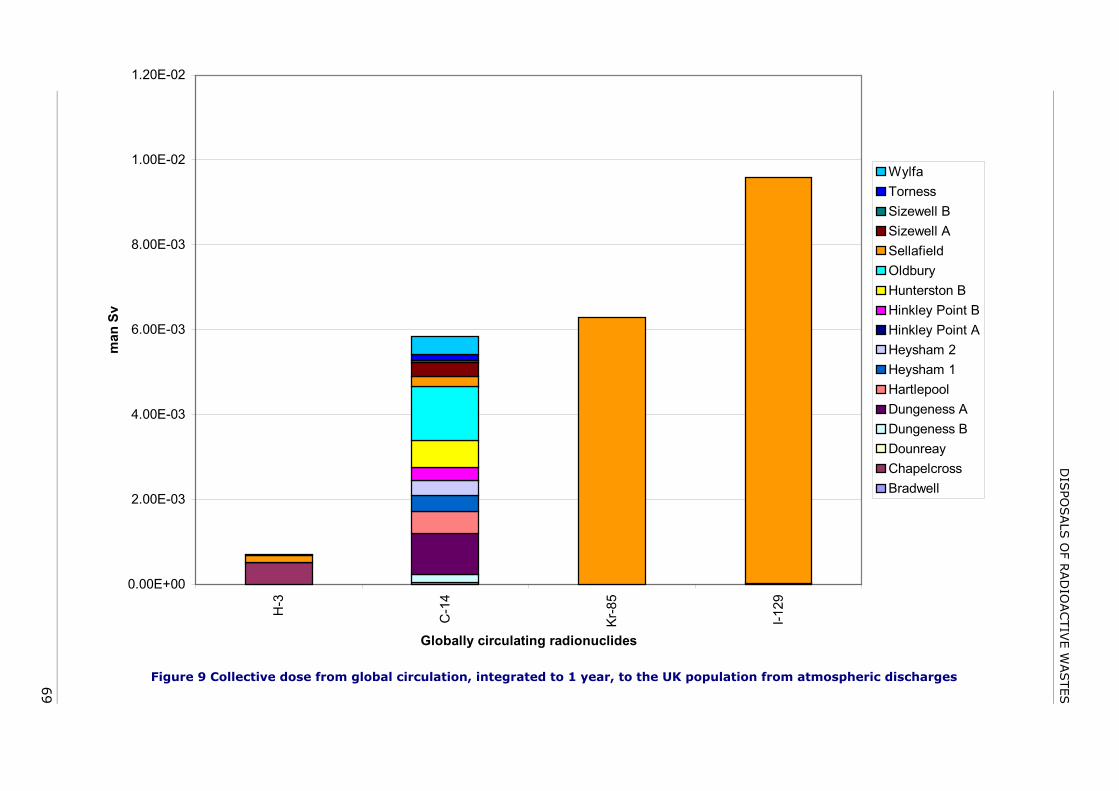
DIS
POSALS
OF R
AD
IOACTIV
E W
ASTES
69
Figure 9 Collective dose from global circulation, integrated to 1 year, to the UK population from atmospheric discharges
0.00E+00
2.00E-03
4.00E-03
6.00E-03
8.00E-03
1.00E-02
1.20E-02
H-3
C-1
4
Kr-8
5
I-129
Globally circulating radionuclides
man
Sv
WylfaTornessSizewell BSizewell ASellafieldOldburyHunterston BHinkley Point BHinkley Point AHeysham 2Heysham 1HartlepoolDungeness ADungeness BDounreayChapelcrossBradwell

IONISING RADIATION EXPOSURE OF THE UK POPULATION: 2005 REVIEW
70
8 DISCUSSION
8.1 Radiation exposures from all sources
The annual collective doses and average annual doses from all the sourcesconsidered in this review are summarised in Table 42. The overall averageannual dose is 2.7 mSv. This represents a slight increase on that found in theprevious review, due to an increased contribution from medical irradiation. Abouthalf of the average annual dose is from radon isotopes (222Rn and 220Rn). Therelative contributions to the overall exposure are shown in Figure 10, and themain findings for each of the sources are described in the following sections. Itshould be noted that the average annual doses listed in Table 42 are averagesover the whole UK population. For some sources however, such as air travel,medical or occupational exposures, only a part of the population receives thoseexposures.
TABLE 42 Annual exposure of the UK population from all sources of ionisingradiation
Source Annual collective dose,man Sv
Average annual dose,µSv
Natural:
Cosmic 19,400 330*
Gamma 20,600 350
Internal 14,700 250
Radon 76,400 1,300
Artificial:
Medical 24,300 410
Occupational 385 6
Fallout 350 6
Disposals 50 0.9
Consumer products 4 0.1
Total (rounded) 157,000 2,700
* Includes 30 µSv from air travel

DISCUSSION
71
Figure 10 Average annual dose to the UK population from all sources, 2.7 mSv
8.1.1 Natural radiationThe average annual dose from cosmic radiation at ground level is the same asthat estimated previously, at 300 µSv. Individual annual exposures vary from200 to 400 µSv. The average annual dose from airtravel has however increasedslightly to 30 µSv, so increasing the overall average annual dose from cosmicradiation to 330 µSv.
The average annual dose from terrestrial gamma radiation, from the ground andbuildings, is 350 µSv and is unchanged from the previous review. Individualdoses range from about 100 µSv to about 1,000 µSv.
The radiation exposure from internal radionuclides was assessed from intakes ofradionuclides in foodstuffs, and measured values of 40K content of the body. Theaverage annual dose was calculated for three age groups. For 1 y and 10 y oldsthe average annual dose was estimated as 320 µSv, and for adults 250 µSv. Thevalue for adults is slightly less than assessed in the previous review. Individualannual doses range from about 100 µSv to 1,000 µSv, depending mainly on theradionuclide concentration of foods, and consumption rates.
The estimate of average indoor concentration of radon gas in the UK isunchanged from the previous review. The average annual dose from radon,currently estimated to be 1300 µSv, is almost half the overall average annualdose. Radon also gives rise to the largest exposures from natural radiation, andsome individual annual doses are in the order of 100,000 µSv.
Cosmic, 12%
Gamma, 13%
Internal, 9.5% Radon, 50%
Products, <0.1%
Occupational, 0.2%
Fallout, 0.2%Disposals,
<0.1%
Medical, 15%
Natural, 84%
Artificial, 16%

IONISING RADIATION EXPOSURE OF THE UK POPULATION: 2005 REVIEW
72
Natural radiation comprises some 84% of the average annual dose in the UKfrom all sources.
8.1.2 Medical uses of radiationMedical irradiation, comprising radiology and nuclear medicine, has continued toincrease during the period since the previous review. The average annual doseto the UK population has increased by about 10% to 410 µSv, and now accountsfor some 15% of the overall average annual dose in the UK. This is largely dueto the increased use of computed tomography, which gives superior diagnosticinformation, but which also leads to higher patient doses. There has also beenan increase in the number of nuclear medicine procedures performed, and theestimate of the average annual dose from these procedures, 27 µSv, hasincreased by about a third since the previous review. Individual annual dosesfrom diagnostic procedures can range from zero, if none are undertaken, toseveral tens of millisieverts.
8.1.3 Occupational exposureThe number of workers monitored in the nuclear industry has reduced since theprevious review, and the average annual dose has decreased to 0.4 mSv. Lessthan 1% of these workers receive an annual dose more than 5 mSv, and in 2003there were no annual doses over 10 mSv.
Annual doses continue to be very low in medicine and research, the averagebeing 0.1 mSv for both areas. However, in nuclear medicine departments theaverage annual dose, 0.40 mSv was higher than that found in the previousreview, 0.33 mSv. This appears to be the result of an increased workload inthese departments. Occupational exposures in general industry tend to be verylow, the annual average being 0.3 mSv. However, as has been found in previousreviews, some individual industrial radiographers can receive annual doses up toaround the annual dose limit. Among groups of classified workers in generalindustry, the highest average annual dose, 0.9 mSv, was received by transportworkers. These exposures are mainly from handling packages containing 99mTcfor nuclear medicine procedures.
That radon can give rise to appreciable occupational exposures in mines hasbeen recognised for many decades. However, the numbers of workers exposedunderground has decreased in the UK. The main area for assessing andcontrolling doses from radon is now in above ground workplaces in radon-proneareas. There are some 50,000 workers in workplaces with radon concentrationshigh enough to require statutory controls. Their average annual dose is about5.3 mSv, which is unchanged since the previous review. The other main sourceof occupational exposure from natural radiation is cosmic radiation. Aircrewreceive an average annual dose of 2 mSv. The overall average annual dose tooccupationally exposed workers is 1.6 mSv, the same as that found in theprevious review. The annual collective dose from all occupational exposure is

DISCUSSION
73
385 man Sv, which can be expressed as an average annual dose to the UKpopulation of about 0.006 mSv.
8.1.4 Consumer productsIn this review, individual radiation exposures were assessed to members of thepublic from a number of items containing radioactive materials, and these werefound to be low. Maximum annual doses are likely to be much less than 1 mSv.The most common item in this category used by members of the public is thesmoke alarm. These contain a very low activity source, and the average annualdose to the population from these was assessed to be less than 0.1 µSv.
8.1.5 FalloutNuclear weapons testing in the atmosphere has resulted in low levels ofenvironmental contamination of fission and activation products. However, theenvironmental levels of these radionuclides are slowly declining, and the mainradionuclides are now below the limits of detection. The current estimate of theaverage annual dose from intakes of these radionuclides, 6 µSv, is from aninternational assessment. This value is slightly higher than reported previously,but is considered to be a better estimate, being from a comprehensive world-wide assessment.
8.1.6 Disposals of radioactive wastesDischarges of liquid radioactive wastes into the sea from the nuclear industryhave greatly decreased over the past three decades. However, other industries,such as the phosphate, oil and gas industries also make discharges of naturallyoccurring radioactive materials (NORM) into the marine environment. Since theprevious review a major assessment has been carried out of the exposure of theUK (and EU) population resulting from marine discharges from all sources in theEU, taking into account all radionuclides discharged. This results in an increase inthe assessed exposure of the UK population from these discharges. This resultsin an average annual dose from liquid discharges, of about 0.7 µSv, which ishigher than reported in the previous review. About 10% of this is from thenuclear industry. This increase is due to the inclusion of exposures fromdisposals of NORM in the marine environment. The exposure of the populationfrom airborne discharges from nuclear sites is similar to that assessedpreviously, and results in an average annual dose of about 0.1 µSv. A similaraverage annual dose arises from emissions from coal fired power stations.Therefore the average annual dose is about 0.9 µSv for all discharges. Thehighest doses are received by the critical group of seafood consumers nearSellafield, for which the dose in 2003 was 0.62 mSv, and 66% of this was frompast discharges of natural radionuclides from an industrial plant.

IONISING RADIATION EXPOSURE OF THE UK POPULATION: 2005 REVIEW
74
8.2 Exposure to widespread natural background andenvironmental radiation
The average annual doses presented in Table 42 and Figure 10 are averagesover the UK population. However, in any one year not all of the population isexposed to some of the sources, for example occupational or medical exposure.Everyone is exposed to natural radiation at ground level to some degree, andalso to sources that are widespread in the environment at low levels. The latterconsists mainly of radionuclides in the environment from weapons fallout anddischarges. The average annual doses from these widespread and persistentsources are presented in Table 43. The doses represent those that an averagemember of the UK population may receive in a year. The overall average annualdose from widespread and persistent sources is 2.20 mSv. Examples of thevariation in natural sources are given in Section 8.3, and examples of additionaldoses from various sources are given in Section 8.4.
TABLE 43 UK average annual doses from widespread natural andenvironmental sources
Source Annual dose, µSv % of total
Cosmic at ground level 300 14
Terrestrial gamma 350 16
Internal 250 11
Radon 1,300 59
Fallout 6 0.3
Discharges 0.9 0.04
Total (rounded) 2,200 100
Considering only these widespread and persistent sources that everyone isexposed to, some 59% of the dose is from indoor radon. This contribution canvary considerably depending on the location, and this is discussed in Section 8.3.The contributions given in Table 43 are shown in Figure 11 for illustration.

DISCUSSION
75
Figure 11 Contributions from widespread natural and environmental radiation:UK average
8.3 Variation in county average annual doses fromnatural radiation
Figure 12 shows the average annual doses from natural background radiation to thepopulation across the UK by county. All the graphs are on the same scale allowingan easy comparison between them to be made. From these graphs it is evident thatthe dose from sources other than radon is fairly constant across the UK, with anannual dose of just under 1 mSv. However, a large variation is found with the dosefrom radon. Cornwall has the highest average annual dose from radon, at around6 mSv, and most other counties have average annual doses of between 1 and2 mSv.
14%
16%11%
59%
<1%
Cosmic at ground levelTerrestrial gammaInternalRadonFalloutDischarges

IONISING RADIATION EXPOSURE OF THE UK POPULATION: 2005 REVIEW
76
Figure 12 Variation of exposure to natural background radiation by region
0.0 1.0 2.0 3.0 4.0 5.0 6.0 7.0 8.0
Dose, mSv
London
Greater Manchester
Merseyside
South Yorkshire
Tyne and Wear
West Midlands
West Yorkshire
Avon
Bedfordshire
Berkshire
Buckinghamshire
Cambridgeshire
Cheshire
Cleveland
Cornwall
Internal
Cosmic
Gamma
Radon+thoron
0.0 1.0 2.0 3.0 4.0 5.0 6.0 7.0 8.0
Dose, mSv
Cumbria
Derbyshire
Devon
Dorset
Durham
East Sussex
Essex
Gloucestershire
Hampshire
Hereford & Worcs
Hertfordshire
Humberside
Isle of Wight
Kent
Lancashire
InternalCosmicGammaRadon+thoron

DISCUSSION
77
Figure 12 (continued) Variation of exposure to natural background radiation byregion
Clwyd
Dyfed
Gwent
Gwynedd
Mid-Glamorgan
Powys
South Glamorgan
West Glamorgan
0.0 1.0 2.0 3.0 4.0 5.0 6.0 7.0 8.0
Dose, mSv
InternalCosmicGammaRadon+thoron
0.0 1.0 2.0 3.0 4.0 5.0 6.0 7.0 8.0
Dose, mSv
Leicestershire
LincolnshireNorfolk
Northamptonshire
Northumbria
North Yorkshire
Nottinghamshire
Oxfordshire
Shropshire
Somerset
Staffordshire
Suffolk
Surrey
Warwickshire
West Sussex
Wiltshire
InternalCosmicGammaRadon+thoron

IONISING RADIATION EXPOSURE OF THE UK POPULATION: 2005 REVIEW
78
Figure 12 (continued) Variation of exposure to natural background radiation byregion
8.4 Individual variations in exposures from othersources
Figures 13 to 16 illustrate typical doses from other common sources: medicalprocedures, flights, occupational exposure and consumption of certain foodproducts. Not everyone will be exposed to these sources in every year, and evenwhen someone is exposed the dose received can be vary depending on thecircumstances of the exposure. For example, the length of a journey by aircraftor the part of the body being X-rayed, influence the dose received. These graphsenable a comparison to be made with the average annual dose from widespreadnatural background and persistent sources, as described in Section 8.2. FromFigures 13 to 16 it can be seen that most of these additional exposures are smallwhen compared to the average annual dose. However, some exposures frommedical diagnostic radiology (Figure 13) can result in a considerable dose thatmay more than double the individual's overall exposure over a year.
The cosmic radiation dose from a single return flight ranges up to over 0.2 mSv(Figure 14), while aircrew receive an average annual dose of about 2 mSv(Figure 15). Regular consumption of some foods, such as mussels or brazil nutscould lead to an annual dose of around 0.2 mSv (Figure 16).
0.0 1.0 2.0 3.0 4.0 5.0 6.0 7.0 8.0
Dose, mSv
Borders
Central
Dumfries & Galloway
Fife
Grampian
Highlands
Lothian
Strathclyde
Tayside
Northern Ireland
InternalCosmicGammaRadon+thoron

DISCUSSION
79
Figure 13 Summary of the potential doses from some common medicalprocedures
Figure 14 Average doses from return flights from London to various destinations
0 1 2 3 4 5 6 7 8
Dose, mSv
Intraoral dental
Chest/ribs
Ankle
Lumbar spine
Barium enema
Pacemaker insertion
Lithotripsy
Biopsy
CT head
CT chest
CT spine
0 1 2 3 4 5 6 7 8
Dose, mSv
Paris
Glasgow
Malaga
Athens
Moscow
New York
Los Angeles
Johannesburg
Hong Kong
Sydney

IONISING RADIATION EXPOSURE OF THE UK POPULATION: 2005 REVIEW
80
Figure 15 Average doses from various occupations
Figure 16 Average doses from consumption of various products
0 1 2 3 4 5 6 7 8
Dose, mSv
Fuel enrichment
Fuel fabrication
Power stations
Fuel reprocessing
Defence
Medical
Dental
Veterinary
Research and teaching
General industry
Air crew
0 1 2 3 4 5 6 7 8
Dose, mSv
Jar of mussels per week
Bag of brazil nuts perweek
2 litres of tap water perday
2 litres of bottle waterper day

ACKNOWLEDGEMENTS
81
9 CONCLUSIONS
The main conclusions of this review of the radiation exposure of the UKpopulation are summarised in Table 42 and Figure 10, which show thecontributions from each source. It was found that the average annual dose is2.7 mSv, which is a slight increase on that assessed in the previous review, duemainly to the increased contribution from medical exposure. The main findingswere as follows:
a) while the estimate of average annual dose from cosmic radiation at groundlevel has remained the same as that in the previous review, there has been aslight increase in the dose to the population from cosmic radiation exposureduring air travel, due to the increased number of flights made by UKresidents;
b) the estimate of average annual dose from natural terrestrial gamma radiationhas remained the same as assessed in previous reviews;
c) a reassessment of the intakes of natural radionuclides in foodstuffs hasresulted in a slightly lower estimate of the average annual dose from internalradiation;
d) the estimate of average annual dose from radon is unchanged from theprevious review;
e) medical irradiation has been found to be the largest artificial source ofradiation exposure, and recent surveys of the frequency and type of medicaldiagnostic procedures have resulted in an estimate of the average annualdose which is some 10% greater than that found in the previous review;
f) occupational exposures in the nuclear industry have decreased significantly,while radon exposure at work continues to account for the largestcontribution to all occupational exposure and the highest individual annualdoses;
g) the annual exposure from consumer products remains at a very low level;
h) residual environmental contamination from past nuclear weapons tests isdeclining and annual exposures remain very low; and
i) the average annual dose from discharges and disposals of radioactivewastes remains very low.
10 ACKNOWLEDGEMENTS
Some of the information in this review is from published sources but much of theoriginal data was provided by a number of individuals from many organisations.

IONISING RADIATION EXPOSURE OF THE UK POPULATION: 2005 REVIEW
82
Also, a number of colleagues from NRPB provided comments on drafts of thereport. The authors are grateful for these contributions which have added to thecomprehensiveness of the review.
11 REFERENCES
Bexon A (2002). Radiological impact of routine discharges from UK civil nuclear sites inthe mid-1990s. Chilton, NRPB-R312.
Biggart J (2002). Personal communication, John Biggart, Forster Green Hospital, Belfast.
BNFL (2002). Discharges and Monitoring of the Environment in the UK, Annual Report2002. British Nuclear Fuels Plc.
BNFL (2003). Discharges and Monitoring of the Environment in the UK, Annual Report2003. British Nuclear Fuels Plc.
Boreham L (2002). Personal communication, Louise Boreham, Addenbrooke’s Hospital,Cambridge.
Bradley EJ (1993). Natural radionuclides in environmental media. Chilton, NRPB-M439.
British Energy (2004). Safety, Health and Environment Report 2002-2003.
CAA (2001). Civil Aviation Authority website. Accessed July 2004.www.Caa.Co.Uk/Docs/80/Airline_Data/2001annual/1_14_Airline_Personnel_Cost_Uk_And_Overseas_2001.Pdf
Caine A (2004). Personal communication, Andy Caine, BNFL.
Catterall K (2002). Personal communication, Kath Catterall, NNC.
CIDI (1998). Central Index of Dose Information, Summary of Statistics for 1998.www.hse.gov.uk/radiation/ionising/doses/dose1998.htm, Accessed July 2004.
CIDI (1999). Central Index of Dose Information, Summary of Statistics for 1999.www.hse.gov.uk/radiation/ionising/doses/dose1999.htm, Accessed July 2004.
CIDI (2000). Central Index of Dose Information, Summary of Statistics for 2000.www.hse.gov.uk/radiation/ionising/doses/dose2000.htm, Accessed July 2004.
CIDI (2001). Central Index of Dose Information, Summary of Statistics for 2001.www.hse.gov.uk/radiation/ionising/doses/dose2001.htm, Accessed July 2004.
CIDI (2002). Central Index of Dose Information, Summary of Statistics for 2002.www.hse.gov.uk/radiation/ionising/doses/dose2002.htm, Accessed July 2004.
CIDI (2003). Central Index of Dose Information, Summary of Statistics for 2003.www.hse.gov.uk/radiation/ionising/doses/dose2003.htm, Accessed December 2004.
Cliff K (1996). Thoron in indoor air. Radiol Prot Bull, 181, 29–31.
Cm 2919 (1995). Review of Radiation Waste Management Policy. Final Conclusions,HMSO.
Corns A and Aylward R (2004). Marine environmental radioactivity surveys at nuclearsubmarine berths 2002. DSTL, RPS.
Cresswell J (2003). Personal communication, Joyce Cresswell, Rolls-Royce.
Crockett GM et al (2003). The radiological impact on the UK population of industries whichuse or produce materials containing enhanced levels of naturally occurringradionuclides. Part 2: The Steel Production Industry. Chilton, NRPB-W48.
Crofts J (2002). Personal communication, John Crofts, UKAEA.

REFERENCES
83
Cucchi and Amadesi (1980). Uranium Compounds in Ceramic Enamels-RadioactivityAnalysis and Use Hazards, International Radiation Protection Association,Washington, DC (USA). Radiation protection. A systematic approach to safety.
Dale AA (2000). Monitoring of radioactivity in air and rainwater in the UK. Annual resultsreport 1999. DETR Report No DETR/RAS/00.008.
Dale AA (2001). Monitoring of radioactivity in air and rainwater in the UK. Annual resultsreport 2000. DETR Report No DETR/RAS/00.008.
Dale AA (2002). Monitoring of radioactivity in air and rainwater in the UK. Annual resultsreport 2001. DETR Report No DETR/RAS/00.008.
Defra (2002). UK Strategy for Radioactive Discharges 2001-2020, Department forEnvironment, Food and Rural Affairs, Defra Publications.
DETR (2000). Department of the Environment, Transport and the Regions. RadioactiveSubstances (Basic Safety Standards) Direction, 2000. DETR, London.
Dhanse S (2002). Personal communication, Shaeen Dhanse, Royal Marsden Hospital,London.
Dixon DW (1993). Radiation hazards to collectors of geological specimens containingnatural radioactivity. Chilton, NRPB-R131.
Dixon DW (2004). Personal communication. Dixon, D W, NRPB.
Department of Health (2000). Imaging and Radiodiagnostics, England, 1996-1997.www.performance.doh.gov.uk/hospitalactivity/statistics/1996-97/imaging_and_radiodiagnostics/y00.htm, Accessed December 2004
Department of Health (2001). Imaging and Radiodiagnostics, England, 2000-2001.www.performance.doh.gov.uk/hospitalactivity/statistics/2000-01/imaging_and_radiodiagnostics/y00.htm, Accessed December 2004
EC (1996). Council Directive 96/ 29/ Euratom of 13 May 1996 of the European Unionlaying down basic safety standards for the protection of the health of workers andthe general public against the dangers arising from ionizing radiation. Luxembourg,EC. Off J Eur Commun, 39, L159.
Elliott AT, Elliott FM and Shields RA (1996). UK nuclear medicine survey 1992-1993,Nuclear Medicine Communications, 17 (1), 3-7.
EA (2003). Environment Agency. Radioactivity in the environment. Report for 2001. Asummary and radiological assessment of the Environment Agency’s monitoringprogrammes.
EA et al (2003). Environment Agency, Environment and Heritage Service (E&HS), FoodStandards Agency (FSA) and Scottish Environment Protection Agency (SEPA) (2003).Radioactivity in Food and the Environment, 2002. RIFE-8.
EA et al (2004). Environment Agency, Environment and Heritage Service (E&HS), FoodStandards Agency (FSA) and Scottish Environment Protection Agency (SEPA) (2004).Radioactivity in Food and the Environment, 2003. RIFE-9.
Fenton (2004). Fenton, R Mining Assoc of the UK. Personal communication.
Food Standards Agency and Scottish Environment Protection Agency (2002). Radioactivityin Food and the Environment, 2001. RIFE-7, FSA and SEPA, London and Stirling.
Food Standards Agency and Scottish Environment Protection Agency (2201). Radioactivityin Food and the Environment, 2000. RIFE-6, FSA and SEPA, London and Stirling.
Food Standards Agency and Scottish Environment Protection Agency (2000). Radioactivityin Food and the Environment, 1999. RIFE-5, FSA and SEPA, London and Stirling.
FSA (2004). Analysis of the natural radioactivity content of bottled waters. FoodStandards Agency, Food Survey Information Sheet 67/04, September 2004.
GB Parliament (1985). Ionising Radiations Regulations, 1985. London, HMSO, SI 1985:1333. Stationery Office.

IONISING RADIATION EXPOSURE OF THE UK POPULATION: 2005 REVIEW
84
GB Parliament (1993). The Radioactive Substances Act 1993. HMSO. ISBN 0 10 541293 7.
GB Parliament (1999a). Ionising Radiations Regulations, 1999, SI 1999: 3232 StationeryOffice.
GB Parliament (1999b). The natural mineral water, spring water and bottled drinkingwater (amendment) (England) regulations 1999. SI No 1999: 1540. StationeryOffice.
GB Parliament (1999c). The Management of Health and safety at Work Regulations, 1999.SI 1999: 3242, Stationery Office.
GB Parliament (2000a). The Air Navigation (Cosmic Radiation) Order 2000. SI 2000:1104, Stationery Office.
GB Parliament (2000b). The Air Navigation (Cosmic Radiation) (Keeping of Records)Regulations 2000. SI 2000: 1380. Stationery Office.
GB Parliament (2001a). The Radiation (Emergency Preparedness and Public Information)Regulations, 2001, SI 2001: 2975, ISBN 0 11 029908 6, Stationery Office.
GB Parliament (2001b). The Radioactive Substances (Clocks and Watches) (England andWales) Regulations, 2001, SI 2001: 4005, ISBN 0 11 039183 7, Stationery Office.
GDC (2003). General Dental Council website, www.gdc-uk.org, Accessed July 2004.
Gilvin P (2003). Personal communication, Phil Gilvin, NRPB.
Gooding T (2004). Gooding, T, NRPB. Personal communication.
Green A (2002). Personal communication, Allan Green, RRPPS, Birmingham.
Green BMR, Lomas PR, Bradley EJ and Wrixon AD (1989). Gamma-radiation levelsoutdoors in Great Britain. Chilton, NRPB-R191.
Green BMR et al (1999). Green BMR, Lomas PR, Miles JCH et al (1999). Radon indwellings in Northern Ireland: atlas and 1999 review. Belfast, Environment andHeritage Service, NRPB-R308.
Green BMR et al (2002). Green BMR, Miles JCH, Bradley EJ and Rees DM (2002). RadonAtlas of England and Wales. Chilton, NRPB-W26.
Green BMR (2004). NRPB, Chilton. Personal communication.
Hales L (2003). Personal communication, Lesley Hales, Rolls-Royce.
Ham GJ, Ewers LW and Wilkins BT (1998). Variations in concentrations of naturallyoccurring radionuclides in foodstuffs. Chilton, NRPB-M892.
Hammond DJ (2003). Environmental Radioactivity Surveillance Programme: Results for2002. Chilton, NRPB-W47.
Hart D and Wall BF (2002). Radiation Exposure of the UK Population from Medical andDental X-ray Examinations. Chilton, NRPB-W4.
Hart D and Wall BF (2004). UK population dose from medical X-ray examinations, E JRadiol, 50, 285-291.
Hart D, Hillier MC and Wall BF (2002). Doses to Patients from Medical X-ray Examinationsin the UK: 2000 Review. Chilton, NRPB-W14.
Hart D (2004). Personal communication, 12 August 2004.
Hart, D and Wall, B F (to be published). A survey of nuclear medicine in the UK. Chilton,(to be published).
Hawkrigg K (2004). Personal communication, Kathryn Hawkrigg, NNC.
Henshaw DL, Perryman J, Keitch PA et al (1993). Radon in domestic water supplies in theUK. Radiat Prot Dosim, 46 (4), 285-9.
Hilton J, Small S, Hornby D and Scarlett P (CEH), Harvey M, Simmonds J, Bexon A andJones A (NRPB) (2003). Modelling the combined impact of radionuclide dischargesreaching rivers. R&D Technical Report P3-068/TR. Environment Agency.
Hindmarsh (1992). Hindmarsh, WE. British Coal Corporation, Personal communication.
REFERENCES
85
Hiromoto G, Oliveira J, Carvalho JS et al (1996). Collective dose and risk assessmentfrom Brazil nut consumption. Radiat Prot Dosim, 67 (3), 229-230.
HMSO (1962). The Radioactive Substances (Phosphatic Substances, Rare Earths etc.)Exemption Order. HMSO, London.
HSE (2004). Health and Safety Executive website.http://www.hse.gov.uk/mining/index.htm (viewed June 2004).
Hughes JS and O’Riordan MC (1993). Radiation exposure of the UK population – 1993review. Chilton, NRPB-R263.
Hughes JS (1999). Ionising Radiation Exposure of the UK Population: 1999 Review.Chilton, NRPB R311.
Hughes JS and Roberts GC (1984). The radiation exposure of the UK population - 1984review. Chilton, NRPB-R173.
Hughes JS, Shaw KB and O'Riordan MC (1989). The radiation exposure of the UKpopulation - 1988 review. Chilton, NRPB-R227.
Hughes JS (1999). Ionising radiation exposure of the UK population: 1999 review.Chilton, NRPB-R311.
ICRP (1975). Report of the Task Group on Reference Man. ICRP Publication 23. Annals ofthe ICRP.
ICRP (1991). Recommendations of the International Commission on RadiologicalProtection. ICRP Publication 60. Ann ICRP, 21 (1-3).
IR(ME)R (2000). The Ionising Radiation (Medical Exposure) Regulations 2000, HMSOSI(2000) 1059.
Irvine D and Flower DJC (to be published). Practical considerations for implementation ofthe EU Directive in the field of cosmic radiation exposure. 7th Int Symp on theNatural Radiation Environment, May 2002, Rhodes, Greece. National TechnicalUniversity of Athens (proceedings to be published).
Keir M (2002). Personal Communication, Mike Keir, Royal Victoria Infirmary, Newcastleupon Tyne.
Khursheed A (2000). Doses to systemic tissues from radon gas. Radiat Prot Dosim, 88,171.
Laverty K (Ed) (2003). Annual Abstract of Statistics, No 139, 2003 Edition. London, TSO(2003).
Lawrence C (2003). Personal communication, Cathy Lawrence, Urenco.
Lawrence C (2004). Personal communication, Cathy Lawrence, Urenco.
Ministry of Agriculture Fisheries and Food and Scottish Environment Protection Agency(1999). Radioactivity in Food and the Environment, 1998. RIFE-4, MAFF, Londonand SEPA, Stirling.
Marland L (2002). Personal communication, Louise Marland, Christie Hospital,Manchester.
Marsden P (2002). Personal communication, Peter Marsden, University College LondonHospital.
McDonnell CE (2004). Radiological assessments for small users. Chilton, NRPB-W63.
McHardy J (2002). Personal communication, Jim McHardy, Amersham plc.
McNamara P (2004). Personal communication, Phil McNamara, British Energy.
Moore M (2002). Personal Communication, Michaela Moore, Newcastle General Hospital.
Morris S (2003). Personal communication, Simon Morris, British Energy.
Moseley T (2002). Personal communication, Trevor Moseley, Sheffield University.

IONISING RADIATION EXPOSURE OF THE UK POPULATION: 2005 REVIEW
86
NI DoE (2003). The Radioactive Substances (Basic Safety Standards) Regulations(Northern Ireland) 2003. SR 2003/208, ISBN 0 33795063 6, Department of theEnvironment, Northern Ireland.
NRPB (1987). Exposure to Radon Daughters in Dwellings, Chilton, NRPB-GS6.
NRPB (1990). Statement by NRPB: limitation of human exposure to radon in homes. DocNRPB, 1 (1), 15-16.
NRPB (1992). Statement by NRPB: approval of consumer products containing radioactivesubstances. Doc NRPB, 3 (2), 1-2.
NRPB (1993a). Occupational, Public and Medical Exposure. Doc NRPB, 4 (2).
NRPB (1993b). Public exposure: guidance on the 1990 recommendations of ICRP. DocNRPB, 4 (2), 27-41.
NRPB (1998). Standards for Intakes of Radionuclides, Appendix - Radon. Doc NRPB,9 (4), 19-20.
NRPB (2000). Health risks from radon. NRPB, 2000.
NRPB (2004). High radon houses found in Cornwall. NRPB Press Release, May 2004.
Nuclear power and the environment (1977). The Government response to the sixth reportof the Royal Commission on Environmental Pollution. London, HMSO, Cmnd 6820.
Nuclear Safety Advisory Committee (2004). Safety Performance Overview of the Major UKNuclear Licensees Annual update – January 2004 - covering the period 2002/2003.NUSAC (2004) P1.
Nuclear Safety Advisory Committee (2005). Safety Performance Overview of the Major UKNuclear Licensees Annual update – January 2004 - covering the period 2003/2004.NUSAC (2005) P1.
Oatway et al. (to be published). The radiological impact on the UK population ofindustries which use or produce materials containing enhanced levels of naturallyoccurring radionuclides. Part 3: The Zircon Sands Industries.
OSPAR (1998). SINTRA Statement. Summary Record OSPAR 98/14/1, Annex 45. OSPAR,London.
Phillips M (2002). Personal communication, Maurice Phillips, MoD.
Phillips M (2004). Personal communication, Maurice Phillips, MoD.
Proctor (2004). Proctor, L. Thoron in houses. Environmental Radon Newsletter,Environmental Health, Winter 2004 Issue No 41.
Pryor M (2002). Personal communication, Matthew Pryor, St Bartholomew’s Hospital,London.
Radioactive Waste Management Advisory Committee (1991). Twelfth Annual Report.London, HMSO.
Rajendram A (2002). Personal communication, Anita Rajendram, Royal Free Hospital,London.
Roberts D (2004). Personal communication, National Radiological Protection Board,Chilton.
Robinson and Hooker (2001). Workforce Modelling for the Royal College of VeterinarySurgeons.
Royal Commission on Environmental Pollution (1976). Sixth report: Nuclear power andthe environment. London, HMSO, Cmnd 6618.
Scottish Executive (2000). The Radioactive Substances (Basic Safety Standards)(Scotland) Regulations 2000. SSI 2000/100, ISBN 0 11 059307 3, ScottishExecutive.

REFERENCES
87
Simmonds JR, Lawson G and Mayall A (1995). Methodology for assessing the radiologicalconsequences of routine releases of radionuclides to the environment. Luxembourg,EC, EUR15760.
Simmonds JR et al (2002). MARINA II, Update of the MARINA Project on the radiologicalexposure of the European Community from radioactivity in North European marinewaters, Annex D: Radiological Impact on EU Member States of Radioactivity in NorthEuropean Waters. Radiation Protection 132, European Commission,
Skelcher B (2002). The Big Book of Vaseline Glass. Schiffer publishing.
Smith DM, Welham D and Gow C (1990). Radiological assessment or private watersupplies in Cornwall. London, Department of the Environment, DoE Repot NoDOE/RW/90.083.
Smith KR et al (2001). The radiological impact on the UK population of industries whichuse or produce materials containing enhanced levels of naturally occurringradionuclides, part 1 coal-fired electricity generation. Chilton, NRPB-R327.
Smith KR and Jones AL (2003). Generalised habit data for radiological assessments.Chilton, NRPB-W41.
Streets R and Thompson C (1995). Accidental contamination from uranium compoundsthrough contact with ceramic dinnerware. Sci Tot Environ, 175 (1).
Summerfield C and Babb P (2004). Social Trends, No 34, 2004 Edition. London, TSO(2004).
Taylor C (2002). Radioactive wall tiles in hospital buildings. Presented at IPEM meeting,Radiation Protection Issues for Radioactive Materials not under Regulatory Control,November 2002.
Taylor FE and Webb GAM (1978). Radiation exposure of the UK population. Chilton,NRPB-R77.
Taylor HW, Gibbons WA and Svoboda J (1983). Gamma radiation from camera lenses.Rad Prot Dosim, 5 (3).
Thomas P (2003). Personal communication, Paul Thomas, BNFL.
Thomas P (2004). Personal communication, Paul Thomas, BNFL.
Thomas W (2002). Personal Communication, Wyn Thomas, Velindre Hospital, Cardiff.
Turner RC, Radley JM and Mayneord WV (1958). The naturally occurring alpha activity offoods. Health Phys, 1, 268-275.
United Kingdom Atomic Energy Authority (2003). Report to local liaison committee onradioactive discharges and environmental monitoring, 2002. UKAEA.
UN (1982). United Nations Scientific Committee on the Effects of Atomic Radiation.Ionising radiation: sources and biological effects. New York, UN, Report to theGeneral Assembly, with annexes. (1982).
UN (1993). United Nations Scientific Committee on the Effects of Atomic Radiation.Sources and Effects of Ionising Radiation. New York, UN, Report to the GeneralAssembly, with annexes. (1993).
UN (2000). United Nations Scientific Committee on the Effects of Atomic Radiation.Sources and effects of ionizing radiation. Report to the General Assembly, withScientific Annexes. Volume 1: Sources. United Nations, New York. (2000).
Varcoe I (2002). Personal communication, Ian Varcoe, Magnox Electric plc.
Varcoe I (2003). Personal communication, Ian Varcoe, Magnox Electric plc.
Waligorski, Jasinska and Schwabenthan (1985). Enhanced Nuclear Radiation from CameraLenses. Health Phys, 49 (3).
Ward J (2004). Personal communication John Ward AEAT.
Warner Jones SM, Shaw KB and Hughes JS (2003). Survey Into The Radiological ImpactOf The Normal Transport Of Radioactive Material By Air. Chilton, NRPB-W39.

IONISING RADIATION EXPOSURE OF THE UK POPULATION: 2005 REVIEW
88
Warner Jones SM et al (to be published). The radiological impact on the UK population ofindustries which use or produce materials containing enhanced levels of naturallyoccurring radionuclides. Part 4: The Oil and Gas Industries.
Webb GAM (1974). Radiation exposure of the public - current levels in the UnitedKingdom. Chilton, NRPB-R24.
Wrixon AD, Green BMR, Lomas PR et al (1988). Natural radiation exposure in UKdwellings. Chilton, NRPB-R190.
www.dcnutrition.com/minerals/Detail.CFM?RecordNumber=49 (2003).
Young AK, McCubbin D and Camplin WC (2002). Natural radionuclides in seafood.Environment Report RL17/02, CEFAS and FSA.

REFERENCES
89
APPENDIX A DATA USED TO CALCULATE DOSESFROM NATURAL RADIONUCLIDES IN FOODSTUFFS
Consumption rates of the main food categories (Smith and Jones, 2003) arelisted in the second, third and fourth columns of Table A1. Per caputconsumption rates were used, as the average annual dose to the UK populationwas required, from intakes of the natural radionuclides shown. Concentrationsof natural radionuclides in the foods shown were obtained from the followingreferences: Bradley, E J, 1993; Dale A A, 2000; Dale A A, 2001; Dale A A, 2002;FSA and SEPA, 2002; Ham G J, et al, 1998; Hughes J S, 1999; UNSCEAR, 2000;Young et al, 2002. Annual average inhalation rates (Smith and Jones, 2003)were used and dose coefficients for inhalation and ingestion were taken from apublication of ICRP (ICRP, 1996).

ION
ISIN
G R
AD
IATIO
N E
XPO
SU
RE O
F TH
E U
K PO
PULA
TIO
N: 2
005 R
EVIE
W
90 TABLE A1 Data used to calculate doses to infants, children and adults from intakes of foodstuffs containing natural radioactivity
Food intakerates, kg y-1
Average activity concentrations of naturally occurring radionuclides in foodstuffs, Bq kg-1Foodstuffs
Infant(1y)
Child(10y)
Adult 7Be 238U 234U 230Th 226Ra 210Pb 210Po 232Th 228Ra 228Th 235U 14C
Fruit (domesticand imported)
17 25 40 9.80 10-3 7.00 10-3 5.00 10-4 9.00 10-3 1.80 10-2 4.00 10-2 5.00 10-4 2.00 10-2 5.00 10-4 1.00 10-4 1.00 101
Nuts 0 0.4 0.8 6.20 10-3 7.00 10-3 1.00 10-2 9.40 10-2 1.10 10-1 2.90 10-2 3.00 10-3 9.40 10-2 3.00 10-3 1.00 10-3 1.48 102
Potatoes 10 45 50 4.80 10-3 5.00 10-3 6.00 10-3 2.30 10-2 1.60 10-2 9.00 10-3 3.00 10-3 2.00 10-2 5.00 10-4 1.00 10-4 2.30 101
Root vegetables 4.5 5.5 10 1.20 10-2 7.00 10-3 9.70 10-3 6.00 10-2 3.00 10-2 2.10 10-2 7.00 10-3 2.00 10-2 5.00 10-4 1.00 10-4 8.00 100
Greenvegetables
2 4.5 15 9.80 10-3 4.90 10-3 6.00 10-3 9.60 10-3 3.10 10-2 9.00 10-2 4.00 10-3 4.00 10-2 1.50 10-2 1.00 10-3 8.00 100
Other domesticand importedvegetables
4.5 13 25 4.70 10-3 4.90 10-3 6.00 10-3 6.10 10-2 2.80 10-1 9.00 10-2 4.00 10-3 4.00 10-2 1.50 10-2 1.00 10-3 2.00 101
Mushrooms 0 0.3 1 9.80 10-3 4.90 10-3 6.00 10-3 9.60 10-3 3.10 10-2 9.00 10-2 4.00 10-3 4.00 10-2 1.50 10-2 1.00 10-3 5.00 100
Sugar 3 20 15 2.50 10-3 7.00 10-3 9.70 10-3 2.40 10-2 4.10 10-2 1.8010-2 7.00 10-3 2.00 10-2 5.00 10-4 1.00 10-4 7.90 101
Honey 0.2 0.1 0.2 2.50 10-3 7.00 10-3 9.70 10-3 2.40 10-2 4.10 10-2 1.80 10-2 7.00 10-3 2.00 10-2 5.00 10-4 1.00 10-4 7.90 101
Pig meat 1 8 15 4.90 10-3 2.00 10-3 2.00 10-3 1.20 10-2 7.20 10-2 7.20 10-2 1.00 10-3 1.00 10-2 1.00 10-3 5.00 10-5 5.40 101
Cattle meat 3 10 15 4.90 10-3 2.00 10-3 2.00 10-3 1.20 10-2 7.20 10-2 1.10 10-1 1.00 10-3 1.00 10-2 1.00 10-3 5.00 10-5 4.40 101
Sheep meat 0.6 1.5 3 4.90 10-3 2.00 10-3 2.00 10-3 1.20 10-2 7.20 10-2 1.10 10-1 1.00 10-3 1.00 10-2 1.00 10-3 5.00 10-5 5.40 101
Offal 0.4 1 2 1.70 10-2 1.30 10-2 2.00 10-3 2.20 10-2 5.20 10-1 4.90 10-1 1.00 10-3 1.00 10-2 9.30 10-2 5.00 10-5 3.10 101
Poultry 1 3.5 7.5 2.00 10-3 2.00 10-3 2.00 10-3 1.00 10-2 4.30 10-2 7.20 10-2 1.00 10-3 1.00 10-2 1.00 10-3 5.00 10-5 7.20 101
Oil (non-dairy) 2 10 10 2.50 10-2 7.00 10-3 1.00 10-2 8.50 10-3 1.10 10-1 2.90 10-2 3.00 10-3 6.00 10-2 3.00 10-3 1.00 10-3 1.05 102

APPE
ND
IX A
91
Food intakerates, kg y-1
Average activity concentrations of naturally occurring radionuclides in foodstuffs, Bq kg-1Foodstuffs
Infant(1y)
Child(10y)
Adult 7Be 238U 234U 230Th 226Ra 210Pb 210Po 232Th 228Ra 228Th 235U 14C
Milk 120 110 95 1.20 10-4 1.00 10-3 5.00 10-4 3.00 10-3 3.50 10-2 1.50 10-2 3.00 10-4 5.00 10-3 3.00 10-4 5.00 10-5 1.80 101
Cheese andbutter
1.3 4.5 10 4.90 10-3 2.00 10-3 2.00 10-3 5.60 10-2 7.20 10-2 1.10 10-1 1.00 10-3 1.00 10-2 5.60 10-2 5.00 10-5 4.40 101
Other milkproducts
10 10 9.5 1.00 10-3 1.00 10-3 5.00 10-4 3.00 10-3 3.50 10-2 1.50 10-2 3.00 10-4 5.00 10-3 3.00 10-4 5.00 10-5 1.80 101
Eggs 4.5 6.5 8 4.90 10-3 2.00 10-3 2.00 10-3 5.20 10-2 8.80 10-2 1.10 10-1 1.00 10-3 1.00 10-2 1.00 10-3 5.00 10-5 3.80 101
Fish 2 4 9.5 3.90 10-3 4.50 10-3 8.10 10-4 4.00 10-2 5.00 10-2 1.00 100 9.70 10-4 − 5.40 10-3 − 2.60 101
Crustaceans 0 0.1 0.6 3.50 10-2 4.00 10-2 2.60 10-3 3.00 10-2 2.00 10-1 8.80 100 1.40 10-3 − 9.60 10-3 − 2.70 101
Cereals 15 45 50 6.20 10-3 7.00 10-3 1.00 10-2 5.20 10-2 9.30 10-2 2.90 10-2 3.00 10-3 6.00 10-2 3.00 10-3 1.00 10-3 1.05 102
Water 260 350 600 1.00 10-3 1.00 10-3 1.00 10-4 5.00 10-4 1.00 10-2 5.00 10-3 5.00 10-5 5.00 10-4 5.00 10-5 4.00 10-5 −
Air 2.00 10-3 1.00 10-6 1.00 10-6 5.00 10-7 1.00 10-6 1.55 10-4 9.33 10-6 5.00 10-7 1.00 10-6 1.00 10-6 5.00 10-8 −
Inhalation rates,m3 y-1
1.9103
5.6 103 8.1 103
Ingestion dosecoefficients –Adult
− 4.50 10-8 4.90 10-8 2.10 10-7 2.80 10-7 6.90 10-7 1.20 10-6 2.30 10-7 6.90 10-7 7.20 10-8 4.70 10-8 5.80 10-10
Inhalation dosecoefficients –Adult
5.00 10-11 2.90 10-6 3.50 10-6 1.40 10-5 3.50 10-6 1.10 10-6 3.30 10-6 2.50 10-5 2.60 10-6 4.00 10-5 8.50 10-6 2.00 10-9
Ingestion dosecoefficients –Children
− 6.80 10-8 7.40 10-8 2.40 10-7 28.00 10-7 1.90 10-6 2.60 10-6 2.90 10-7 3.90 10-6 1.40 10-7 7.10 10-8 8.00 10-10
Inhalation dosecoefficients –Children
8.30 10-11 4.00 10-6 4.80 10-6 1.60 10-5 4.90 10-6 1.50 10-6 4.60 10-6 2.60 10-5 4.60 10-6 5.50 10-5 1.10 10-5 2.80 10-9

ION
ISIN
G R
AD
IATIO
N E
XPO
SU
RE O
F TH
E U
K PO
PULA
TIO
N: 2
005 R
EVIE
W
92 Food intake
rates, kg y-1Average activity concentrations of naturally occurring radionuclides in foodstuffs, Bq kg-1Foodstuffs
Infant(1y)
Child(10y)
Adult 7Be 238U 234U 230Th 226Ra 210Pb 210Po 232Th 228Ra 228Th 235U 14C
Ingestion dosecoefficients –Infants
− 1.20 10-7 1.30 10-7 4.10 10-7 9.60 10-7 3.60 10-6 8.80 10-6 4.50 10-7 5.70 10-6 3.70 10-7 1.30 10-7 1.60 10-9
Inhalation dosecoefficients -Infants
2.10 10-10 9.40 10-6 1.10 10-5 3.50 10-5 1.10 10-5 3.70 10-6 1.10 10-5 5.00 10-5 1.00 10-5 1.30 10-4 2.60 10-5 6.60 10-9

APPE
ND
IX A
93
TABLE A2 Annual average doses to adults in the UK from consumption of foodstuffs containing natural radionuclides
Annual doses, µSv
Foodstuffs 238U 234U 230Th 226Ra 210Pb 210Po 232Th 228Ra 228Th 235U 14C
Fruit (domestic andimported)
1.76 10-2 1.37 10-2 4.20 10-3 1.01 10-1 4.97 10-1 1.92 100 4.60 10-3 5.52 10-1 1.44 10-3 1.88 10-4 2.32 10-1
Nuts 2.23 10-4 2.74 10-4 1.68 10-3 2.11 10-2 6.07 10-2 2.78 10-2 5.52 10-4 5.19 10-2 1.73 10-4 3.76 10-5 6.87 10-2
Potatoes 1.08 10-2 1.23 10-2 6.30 10-2 3.22 10-1 5.52 10-1 5.40 10-1 3.45 10-2 6.90 10-1 1.80 10-3 2.35 10-4 6.67 10-1
Root vegetables 5.40 10-3 3.43 10-3 2.04 10-2 1.68 10-1 2.07 10-1 2.52 10-1 1.61 10-2 1.38 10-1 3.60 10-4 4.70 10-5 4.64 10-2
Green vegetables 6.62 10-3 3.60 10-3 1.89 10-2 4.03 10-2 3.21 10-1 1.62 10 0 1.38 10-2 4.14 10-1 1.62 10-2 7.05 10-4 6.96 10-2
Other domestic andimported vegetables
5.29 10-3 6.00 10-3 3.15 10-2 4.27 10-1 4.83 100 2.70 100 2.30 10-2 6.90 10-1 2.70 10-2 1.18 10-3 2.90 10-1
Mushrooms 4.41 10-4 2.40 10-4 1.26 10-3 2.69 10-3 2.14 10-2 1.08 10-1 9.20 10-4 2.76 10-2 1.08 10-3 4.70 10-5 2.90 10-3
Sugar 1.69 10-3 5.15 10-3 3.06 10-2 1.01 10-1 4.24 10-1 3.24 10-1 2.42 10-2 2.07 10-1 5.40 10-4 7.05 10-5 6.87 10-1
Honey 2.25 10-5 6.86 10-5 4.07 10-4 1.34 10-3 5.66 10-3 4.32 10-3 3.22 10-4 2.76 10-3 7.20 10-6 9.40 10-7 9.16 10-3
Pig meat 3.31 10-3 1.47 10-3 6.30 10-3 5.04 10-2 7.45 10-1 1.30 10 0 3.45 10-3 1.04 10-1 1.08 10-3 3.53 10-5 4.70 10-1
Cattle meat 3.31 10-3 1.47 10-3 6.30 10-3 5.04 10-2 7.45 10-1 1.98 10 0 3.45 10-3 1.04 10-1 1.08 10-3 3.53 10-5 3.83 10-1
Sheep meat 6.62 10-4 2.94 10-4 1.26 10-3 1.01 10-2 1.49 10-1 3.96 10-1 6.90 10-4 2.07 10-2 2.16 10-4 7.05 10-6 9.40 10-2
Offal 1.53 10-3 1.27 10-3 8.40 10-4 1.23 10-2 7.18 10-1 1.18 10 0 4.60 10-4 1.38 10-2 1.34 10-2 4.70 10-6 3.60 10-2
Poultry 6.75 10-4 7.35 10-4 3.15 10-3 2.10 10-2 2.23 10-1 6.48 10-1 1.73 10-3 5.18 10-2 5.40 10-4 1.76 10-5 3.13 10-1
Oil (non-dairy) 1.13 10-2 3.43 10-3 2.10 10-2 2.38 10-2 7.59 10-1 3.48 10-1 6.90 10-3 4.14 10-1 2.16 10-3 4.70 10-4 6.09 10-1
Milk 5.13 10-4 4.66 10-3 9.98 10-3 7.98 10-2 2.29 10 0 1.71 10 0 6.56 10-3 3.28 10-1 2.05 10-3 2.23 10-4 9.92 10-1
Cheese and butter 2.21 10-3 9.80 10-4 4.20 10-3 1.57 10-1 4.97 10-1 1.32 100 2.30 10-3 6.90 10-2 4.03 10-2 2.35 10-5 2.55 10-1
Other milk products 4.28 10-4 4.66 10-4 9.98 10-4 7.98 10-3 2.29 10-1 1.71 10-1 6.56 10-4 3.28 10-2 2.05 10-4 2.23 10-5 9.92 10-2
Eggs 1.76 10-3 7.84 10-4 3.36 10-3 1.16 10-1 4.86 10-1 1.06 10 0 1.84 10-3 5.52 10-2 5.76 10-4 1.88 10-5 1.76 10-1
Fish 1.67 10-3 2.09 10-3 1.62 10-3 1.06 10-1 3.28 10-1 1.14 10 1 2.12 10-3 0.00 10 0 3.69 10-3 0.00 10 0 1.43 10-1
Crustaceans 9.45 10-4 1.18 10-3 3.28 10-4 5.04 10-3 8.28 10-2 6.34 10 0 1.93 10-4 0.00 10 0 4.15 10-4 0.00 10 0 9.40 10-3
Cereals 1.40 10-2 1.72 10-2 1.05 10-1 7.28 10-1 3.21 10 0 1.74 10 0 3.45 10-2 2.07 10 0 1.08 10-2 2.35 10-3 3.05 10 0
Water 2.70 10-2 2.94 10-2 1.26 10-2 8.40 10-2 4.14 10 0 3.60 10 0 6.90 10-3 2.07 10-1 2.16 10-3 1.13 10-3 0.00 10 0
Total 1.1810-1 1.10 10-1 3.49 10-1 2.71 100 2.22 101 4.17 101 1.90 10-1 6.24 100 1.27 10-1 6.84 10-3 8.84 100

ION
ISIN
G R
AD
IATIO
N E
XPO
SU
RE O
F TH
E U
K PO
PULA
TIO
N: 2
005 R
EVIE
W
94 TABLE A3 Annual average doses to children in the UK from consumption of foodstuffs containing natural radionuclides
Annual doses, µSv
Foodstuffs 238U 234U 230Th 226Ra 210Pb 210Po 232Th 228Ra 228Th 235U 14C
Fruit (domestic and imported) 1.6710-2 1.30 10-2 3.00 10-3 1.80 10-1 8.55 10-1 2.60 100 3.63 10-3 1.95 100 1.75 10-3 1.78 10-4 2.00 10-1
Nuts 1.69 10-4 2.07 10-4 9.60 10-4 3.01 10-2 8.36 10-2 3.02 10-2 3.48 10-4 1.47 10-1 1.68 10-4 2.84 10-5 4.74 10-2
Potatoes 1.47 10-2 1.67 10-2 6.48 10-2 8.28 10-1 1.37 10 0 1.05 10 0 3.92 10-2 3.51 10 0 3.15 10-3 3.20 10-4 8.28 10-1
Root vegetables 4.49 10-3 2.85 10-3 1.28 10-2 2.64 10-1 3.14 10-1 3.00 10-1 1.12 10-2 4.29 10-1 3.85 10-4 3.91 10-5 3.52 10-2
Green vegetables 3.00 10-3 1.63 10-3 6.48 10-3 3.46 10-2 2.65 10-1 1.05 10 0 5.22 10-3 7.02 10-1 9.45 10-3 3.20 10-4 2.88 10-2
Other domestic and importedvegetables
4.15 10-3 4.71 10-3 1.87 10-2 6.34 10-1 6.92 100 3.04 100 1.51 10-2 2.03 100 2.73 10-2 9.23 10-4 2.08 10-1
Mushrooms 2.00 10-4 1.09 10-4 4.32 10-4 2.30 10-3 1.77 10-2 7.02 10-2 3.48 10-4 4.68 10-2 6.30 10-4 2.13 10-5 1.20 10-3
Sugar 3.40 10-3 1.04 10-2 4.66 10-2 3.84 10-1 1.56 10 0 9.36 10-1 4.06 10-2 1.56 10 0 1.40 10-3 1.42 10-4 1.26 10 0
Honey 1.70 10-5 5.18 10-5 2.33 10-4 1.92 10-3 7.79 10-3 4.68 10-3 2.03 10-4 7.80 10-3 7.00 10-6 7.10 10-7 6.32 10-3
Pig meat 2.67 10-3 1.18 10-3 3.84 10-3 7.68 10-2 1.09 10 0 1.50 10 0 2.32 10-3 3.12 10-1 1.12 10-3 2.84 10-5 3.46 10-1
Cattle meat 3.33 10-3 1.48 10-3 4.80 10-3 9.60 10-2 1.37 10 0 2.86 10 0 2.90 10-3 3.90 10-1 1.40 10-3 3.55 10-5 3.52 10-1
Sheep meat 5.00 10-4 2.22 10-4 7.20 10-4 1.44 10-2 2.05 10-1 4.29 10-1 4.35 10-4 5.85 10-2 2.10 10-4 5.33 10-6 6.48 10-2
Offal 1.16 10-3 9.62 10-4 4.80 10-4 1.76 10-2 9.88 10-1 1.27 10 0 2.90 10-4 3.90 10-2 1.30 10-2 3.55 10-6 2.48 10-2
Poultry 4.76 10-4 5.18 10-4 1.68 10-3 2.80 10-2 2.86 10-1 6.55 10-1 1.02 10-3 1.37 10-1 4.90 10-4 1.24 10-5 2.02 10-1
Oil (non-dairy) 1.70 10-2 5.18 10-3 2.40 10-2 6.80 10-2 2.09 10 0 7.54 10-1 8.70 10-3 2.34 10 0 4.20 10-3 7.10 10-4 8.40 10-1
Milk 8.98 10-4 8.14 10-3 1.32 10-2 2.64 10-1 7.32 10 0 4.29 10 0 9.57 10-3 2.15 10 0 4.62 10-3 3.91 10-4 1.58 10 0
Cheese and butter 1.5010-3 6.66 10-4 2.16 10-3 2.02 10-1 6.16 10-1 1.29 100 1.31 10-3 1.76 10-1 3.53 10-2 1.60 10-5 1.58 10-1
Other milk products 6.80 10-4 7.40 10-4 1.20 10-3 2.40 10-2 6.65 10-1 3.90 10-1 8.70 10-4 1.95 10-1 4.20 10-4 3.55 10-5 1.44 10-1
Eggs 2.17 10-3 9.62 10-4 3.12 10-3 2.70 10-1 1.09 10 0 1.86 10 0 1.89 10-3 2.54 10-1 9.10 10-4 2.31 10-5 1.98 10-1
Fish 1.06 10-3 1.33 10-3 7.78 10-4 1.28 10-1 3.80 10-1 1.04 10 1 1.13 10-3 0.00 10 0 3.02 10-3 0.00 10 0 8.32 10-2
Crustaceans 2.38 10-4 2.96 10-4 6.24 10-5 2.40 10-3 3.80 10-2 2.29 10 0 4.06 10-5 0.00 10 0 1.34 10-4 0.00 10 0 2.16 10-3
Cereals 1.90 10-2 2.33 10-2 1.08 10-1 1.87 10 0 7.95 10 0 3.39 10 0 3.92 10-2 1.05 10 1 1.89 10-2 3.20 10-3 3.78 10 0
Water 2.38 10-2 2.59 10-2 8.40 10-3 1.40 10-1 6.65 10 0 4.55 10 0 5.08 10-3 6.83 10-1 2.45 10-3 9.94 10-4 0.00 10 0
Total 1.22 10-1 1.20 10-1 3.26 10-1 5.73 100 4.35 101 4.66 101 1.90 10-1 2.76 101 1.30 10-1 7.42 10-3 1.05 101

APPE
ND
IX A
95
TABLE A4 Annual average doses to infants in the UK from consumption of foodstuffs containing natural radionuclides
Annual doses, µSv
Foodstuffs 238U 234U 230Th 226Ra 210Pb 210Po 232Th 228Ra 228Th 235U 14C
Fruit (domestic and imported) 2.00 10-2 1.55 10-2 3.49 10-3 1.47 10-1 1.10 100 5.98 100 3.83 10-3 1.94 100 3.15 10-3 2.21 10-4 2.72 10-1
Potatoes 5.76 10-3 6.50 10-3 2.46 10-2 2.21 10-1 5.76 10-1 7.92 10-1 1.35 10-2 1.14 10 0 1.85 10-3 1.30 10-4 3.68 10-1
Root vegetables 6.48 10-3 4.10 10-3 1.79 10-2 2.59 10-1 4.86 10-1 8.32 10-1 1.42 10-2 5.13 10-1 8.33 10-4 5.85 10-5 5.76 10-2
Green vegetables 2.35 10-3 1.27 10-3 4.92 10-3 1.84 10-2 2.23 10-1 1.58 10 0 3.60 10-3 4.56 10-1 1.11 10-2 2.60 10-4 2.56 10-2
Other domestic and importedvegetables
2.54 10-3 2.87 10-3 1.11 10-2 2.64 10-1 4.54 100 3.56 100 8.10 10-3 1.03 100 2.50 10-2 5.85 10-4 1.44 10-1
Sugar 9.00 10-4 2.73 10-3 1.19 10-2 6.91 10-2 4.43 10-1 4.75 10-1 9.45 10-3 3.42 10-1 5.55 10-4 3.90 10-5 3.79 10-1
Honey 6.00 10-5 1.82 10-4 7.95 10-4 4.61 10-3 2.95 10-2 3.17 10-2 6.30 10-4 2.28 10-2 3.70 10-5 2.60 10-6 2.53 10-2
Pig meat 5.88 10-4 2.60 10-4 8.20 10-4 1.15 10-2 2.59 10-1 6.34 10-1 4.50 10-4 5.70 10-2 3.70 10-4 6.50 10-6 8.64 10-2
Cattle meat 1.76 10-3 7.80 10-4 2.46 10-3 3.46 10-2 7.78 10-1 2.90 10 0 1.35 10-3 1.71 10-1 1.11 10-3 1.95 10-5 2.11 10-1
Sheep meat 3.53 10-4 1.56 10-4 4.92 10-4 6.91 10-3 1.56 10-1 5.81 10-1 2.70 10-4 3.42 10-2 2.22 10-4 3.90 10-6 5.18 10-2
Offal 8.16 10-4 6.76 10-4 3.28 10-4 8.45 10-3 7.49 10-1 1.72 10 0 1.80 10-4 2.28 10-2 1.38 10-2 2.60 10-6 1.98 10-2
Poultry 2.40 10-4 2.60 10-4 8.20 10-4 9.60 10-3 1.55 10-1 6.34 10-1 4.50 10-4 5.70 10-2 3.70 10-4 6.50 10-6 1.15 10-1
Oil (non-dairy) 6.00 10-3 1.82 10-3 8.20 10-3 1.63 10-2 7.92 10-1 5.10 10-1 2.70 10-3 6.84 10-1 2.22 10-3 2.60 10-4 3.36 10-1
Milk 1.73 10-3 1.56 10-2 2.46 10-2 3.46 10-1 1.51 10 1 1.58 10 1 1.62 10-2 3.42 10 0 1.33 10-2 7.80 10-4 3.46 10 0
Cheese and butter 7.64 10-4 3.38 10-4 1.07 10-3 6.99 10-2 3.37 10-1 1.26 100 5.85 10-4 7.41 10-2 2.69 10-2 8.45 10-6 9.15 10-2
Other milk products 1.20 10-3 1.30 10-3 2.05 10-3 2.88 10-2 1.26 10 0 1.32 10 0 1.35 10-3 2.85 10-1 1.11 10-3 6.50 10-5 2.88 10-1
Eggs 2.65 10-3 1.17 10-3 3.69 10-3 2.25 10-1 1.43 10 0 4.36 10 0 2.03 10-3 2.57 10-1 1.67 10-3 2.93 10-5 2.74 10-1
Fish 9.36 10-4 1.17 10-3 6.64 10-4 7.68 10-2 3.60 10-1 1.76 10 1 8.73 10-4 0.00 10 0 4.00 10-3 0.00 10 0 8.32 10-2
Cereals 1.12 10-2 1.37 10-2 6.15 10-2 7.49 10-1 5.02 10 0 3.83 10 0 2.03 10-2 5.13 10 0 1.67 10-2 1.95 10-3 2.52 10 0
Water 3.12 10-2 3.38 10-2 1.07 10-2 1.25 10-1 9.36 10 0 1.14 10 1 5.85 10-3 7.41 10-1 4.81 10-3 1.35 10-3 0.00 10 0
Total 9.93 10-2 1.04 10-1 1.92 10-1 2.89 100 4.58 101 8.13 101 1.06 10-1 1.64 101 1.29 10-1 5.78 10-3 8.87 100

ION
ISIN
G R
AD
IATIO
N E
XPO
SU
RE O
F TH
E U
K PO
PULA
TIO
N: 2
005 R
EVIE
W
96
Figure A1 Dose to each age group from natural radionuclides in foodstuffs in the 232Th series
0.0
2.0
4.0
6.0
8.0
10.0
12.0
Totalvegetables
Total meat Total dairyproducts
Fish Crustaceans Cereals Water Nuts Total otherfoods
Food categories
µSv
y-1Adults Children Infants

APPE
ND
IX A
97
Figure A2 Dose to each age group from natural radionuclides in foodstuffs in the 238U series
0
5
10
15
20
25
30
35
40
Totalvegetables
Total meat Total dairyproducts
Fish Crustaceans Cereals Water Nuts Total otherfoods
Foodstuffs
µSv
y-1Adults Children Infants

ION
ISIN
G R
AD
IATIO
N E
XPO
SU
RE O
F TH
E U
K PO
PULA
TIO
N: 2
005 R
EVIE
W
98
Figure A3 Dose to each age group from 14C in foodstuffs
0
1
1
2
2
3
3
4
4
5
Totalvegetables
Total meat Total dairyproducts
Fish Crustaceans Cereals Water Nuts Total otherfoods
Foodstuffs
µSv
y-1Adults Children Infants

APPENDIX B
99
APPENDIX B GLOSSARY
absorbed dose
The quantity of energy imparted by ionising radiation to a unit mass of mattersuch as tissue. Absorbed dose has the unit joules per kilogram (J kg-1) which hasthe special name Gray (Gy).
activation products
Activation products are created when a stable radionuclide is converted into anunstable radionuclide by interaction with radiation.
alpha activity
The alpha activity is the number of alpha particles emitted per unit time. Analpha particle is identical to the nucleus of a helium atom, consisting of twoprotons plus two neutrons. An alpha particle has low penetrating power but highlinear energy transfer (LET). The unit of activity is the Becquerel (Bq).
atoms
The simplest unit into which a substance can be broken down whilst retaining itsunique identity and properties. They consist of a central nucleus with a netpositive electrical charge, orbiting around which are small lightweight negativelycharged particles called electrons.
authorised discharges
Discharges of radioactive wastes are made from various establishments. Thedisposals are authorised by the environment agencies in the UK under theRadioactive Substances Act 1993.
background radiation
The radiation level to which the general population is exposed. It consists ofradiation from outer space, and radiation from radionuclides in rocks, soil, air,food and from within the human body.
Becquerel (Bq)
The international (SI) unit for the number of nuclear disintegrations occurringper unit time, in a quantity of radioactive material. 1 Bq = 1 radioactivedisintegration per second. This is an extremely small unit and levels are of oftenprefixed with mega (106 Bq – MBq), giga (109 Bq – GBq) and tera (1012 Bq –TBq) particularly in the context of discharges of activity into the environment.Conversely, under normal circumstances, activity concentrations inenvironmental materials are generally low and so prefixes such as milli (10-3 Bq– mBq) and micro (10-6 Bq - µBq) are used.

IONISING RADIATION EXPOSURE OF THE UK POPULATION: 2005 REVIEW
100
beta radiation/beta particle
Beta radiation is a form of radioactivity in which beta particles are emitted froman atom. It has greater penetrative power than an alpha particle, but has a lowlinear energy transfer (LET). A beta particle has a mass and charge identicalto that of an electron. Beta particles can be either positively (called a positron)or negatively charged (called an electron).
collective effective dose
The quantity obtained by multiplying the average effective dose by the numberof people exposed to a given source of ionising radiation. Unit man sievert(man Sv). Frequently abbreviated to collective dose.
computed tomography – see X-ray procedures.
conventional X-rays – see X-ray procedures.
cosmogenic radionuclides
Cosmogenic refers to radioactive isotopes created when cosmic radiationinteracts with an atomic nucleus. These isotopes are produced on Earth, inEarth's atmosphere, and in extraterrestrial items such as meteorites.
critical group
Members of the population who because of their habits or sources of foodstuffare likely to have the highest exposure to radiation from a particular source.
decay
The process of spontaneous transformation of a radionuclide. The decrease inthe activity of a radioactive substance.
decay product
A nuclide or radionuclide produced by decay.
discharges - see radioactive discharges.
dose
General term for quantity of ionising radiation. See absorbed dose,effective dose, equivalent dose and collective effective dose. Frequentlyused for effective dose.
dose coefficient
Dose coefficients are values recommended by the International Committee onRadiological Protection that allow the activity taken into the body, either byinhalation or ingestion, to be converted into an effective dose. These valueshave been calculated by modelling the movement of a radionuclide within thebody and determining the resulting tissue doses.

APPENDIX B
101
effective dose
The effective dose is the sum of the weighted equivalent doses in all thetissues and organs of the body. It takes account of the susceptibility of organsand tissues to radiation damage. Unit Sievert (Sv).
electron
An elementary particle with a low mass, of 5 10-4 that of a proton, and unitnegative electric charge. Positive charged electrons, called positrons, also exist(see beta particle).
equivalent dose
The quantity obtained by multiplying the absorbed dose by a factor to allow forthe different effectiveness of the various ionising radiations in causing harm totissue. Unit sievert, symbol Sv. Usually the factor for gamma rays, X-rays andbeta particles is 1 but for alpha particles it is 20.
fission (products)
The spontaneous or induced disintegration of a heavy atomic nucleus into two ormore lighter fragments (nuclei). The energy released in the process is referredto as nuclear energy.
fluoroscopy – see X-ray procedures
gamma rays
High energy photons, without mass or charge, emitted from the nucleus of aradionuclide following radioactive decay, as an electromagnetic wave. Theyare very penetrating but have a low linear energy transfer (LET).
Gray (Gy)
The international (SI) unit of absorbed dose. 1 Gy is equivalent to 1 joule ofenergy absorbed per kilogram of matter such as body tissue. Can also be usedwith prefixes such as nano to make units such as nanogray (nGy - 10-9 Gy).
half-life
The time taken for the activity of a radionuclide to lose half its value by decay.During each subsequent half-life its activity is halved again so its activity decaysexponentially.
igneous rocks
Igneous rocks are formed when molten rock (magma) cools and solidifies eitherbelow the surface or on the surface of the Earth. This magma can be derivedfrom either the Earth's mantle or pre-existing rocks made molten by extremetemperature and pressure changes. Over 700 types of igneous rocks have beendescribed, most of them formed beneath the surface of the Earth's crust.
interventional X-rays or interventional radiology – see X-ray procedures

IONISING RADIATION EXPOSURE OF THE UK POPULATION: 2005 REVIEW
102
ionising radiation
Radiation which is sufficiently energetic to remove electrons from atoms in itspath. In human or animal exposures, ionising radiation can result in theformation of highly reactive particles in the body which can cause damage toindividual components of living cells and tissues. The term includes radiation atleast as energetic as X-ray; gamma rays and charged particles such as alphaand beta particles are also forms of ionising radiation.
isotope
Nuclides containing the same number of protons (ie, same atomic number) buta different number of neutrons.
linear energy transfer (LET)
This property of radiation relates to how much energy is lost by the radiationwhen travelling a given distance. High LET radiation loses a lot of energy quicklyand in a short distance. For example an alpha particle may not travel far but itmay cause a lot of damage to a cell it is travelling through compared to aradiation that loses energy over a larger distance (for example, a betaparticle).
luminescence
Luminescence is the emission of light by a material.
man sievert – see collective effective dose.
microsievert – see Sievert.
millisievert – see Sievert.
nanogray – see Gray.
muon
An elementary particle with a mass about one-tenth of a proton or about 200times heavier than an electron.
neutron
The uncharged particle in an atomic nucleus; its mass is similar to the mass of ahydrogen atom.
nuclear medicine
Diagnostic nuclear medicine is used to obtain information on internal organs ofthe body. It involves administering a radioisotope to a patient, usually byinjection. The radioisotope is taken up into specific body tissues. Someprocedures take pictures of the body with a special camera to see where theradioisotope has gone within the body. Other procedures (known as non-imagingprocedures) measure the level of radioactivity remaining in body fluids, such asblood, after a known length of time. Some nuclear medicine procedures are for

APPENDIX B
103
therapy purposes, giving a high dose of activity in order to kill cells within aspecific organ.
photon
The basic unit of light or other electromagnetic energy.
proton
The positively charged particle in an atomic nucleus; its mass is similar to themass of a hydrogen atom.
radioactive discharges
Some establishments produce radioactive waste as by-products and this isdisposed of, usually to the environment, as a radioactive discharge underauthorisation.
radioluminosity
The emission of light from the interaction of radiation with some materials.
radionuclide
A type of atomic nucleus which is unstable and which may undergo spontaneousdecay to another atom by emission of ionising radiation (usually alpha, betaor gamma radiation).
radiotherapy
High-energy X-rays can be used to treat tumours by directing the X-rays at thetumour and so destroying the tumour cells.
Sievert (Sv)
The international (SI) unit of effective and equivalent dose. Because the Sievertis a large unit, effective dose is commonly expressed in milliSieverts (10-3 Sv, ormSv) and microSieverts (10-6 Sv, or µSv).
stable isotopes
Non-radioactive isotopes.
troposphere
The troposphere is the lowermost portion of Earth's atmosphere and the one inwhich clouds and most other weather phenomena occur. This layer extends to analtitude range of 8 – 15 km. Generally, jets fly near the top of this layer.
uraninite
Uraninite is a uranium-rich mineral with a composition that is largely UO2
(uranium oxide), but which also contains UO3 and oxides of lead, thorium, andrare earths. All uraninites and pitchblende contain a small amount of radium aradioactive decay product of uranium. Uraninite is a major ore of uranium.

IONISING RADIATION EXPOSURE OF THE UK POPULATION: 2005 REVIEW
104
uranium oxide – see uraninite
X-radiation
X-radiation is also a form of electromagnetic radiation and differs from gamma-rays only in its mechanism of production. X-rays are generally producedartificially by an X-ray set. They are produced when high-speed electrons strikea solid target. The energy is dependent on the voltage applied across theelectrodes of the X-ray tube.
X-ray procedures X-rays are frequently used in medicine. They are used to diagnose problemsand to help with treatment.
Conventional X-rays make static images on film or increasingly, store digitalimages on computer.
Interventional X-rays guide treatments, such as opening blood vessels. Theyinvolve a combination of fluoroscopy, where moving or static images may beviewed in real-time on a display screen.
Fluoroscopy can be described as a "moving X-ray". Like an X-ray machine itprovides images of the interior of the body, but the image may be projectedcontinuously onto a fluorescent screen, thus producing a moving image.
Computed Tomography (CT) uses X-ray equipment that rotates around the bodyso that detectors receive X-rays that have passed through the body. The outputof the detectors is analysed to provide cross-sectional images of the body, andthree-dimensional images of tissues.