Embed Size (px)
Citation preview
CODEN ECJHAO E-Journal of Chemistry
Vol. 2, No. 3, pp 199-202, June 2005 http://www.e-journals.net
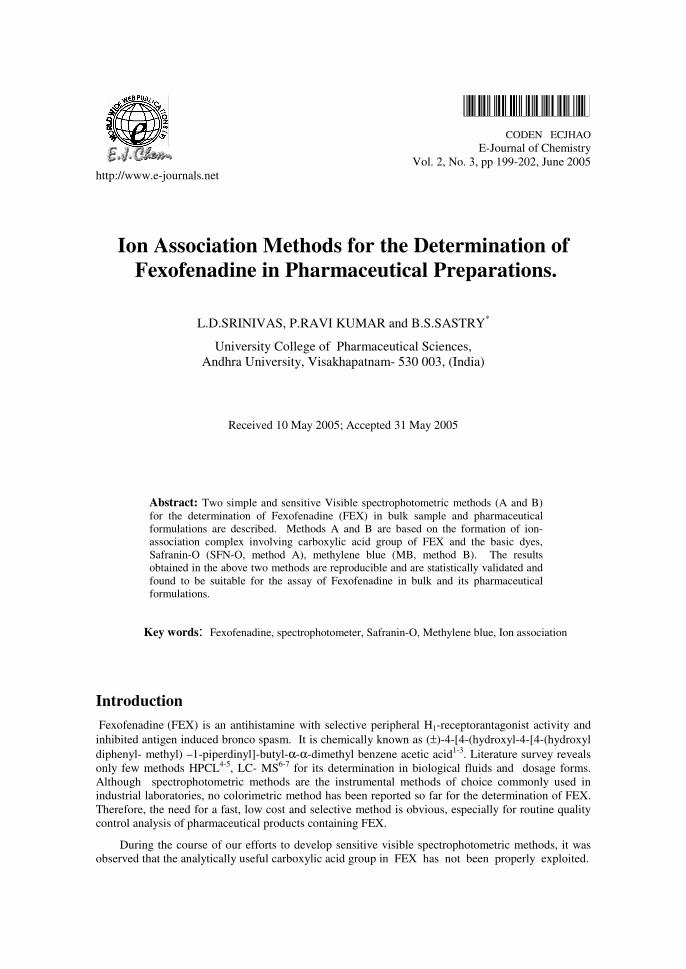
Ion Association Methods for the Determination of
Fexofenadine in Pharmaceutical Preparations.
L.D.SRINIVAS, P.RAVI KUMAR and B.S.SASTRY*
University College of Pharmaceutical Sciences, Andhra University, Visakhapatnam- 530 003, (India)
Received 10 May 2005; Accepted 31 May 2005
Abstract: Two simple and sensitive Visible spectrophotometric methods (A and B) for the determination of Fexofenadine (FEX) in bulk sample and pharmaceutical formulations are described. Methods A and B are based on the formation of ion-association complex involving carboxylic acid group of FEX and the basic dyes, Safranin-O (SFN-O, method A), methylene blue (MB, method B). The results obtained in the above two methods are reproducible and are statistically validated and found to be suitable for the assay of Fexofenadine in bulk and its pharmaceutical formulations.
Key words: Fexofenadine, spectrophotometer, Safranin-O, Methylene blue, Ion association
Introduction Fexofenadine (FEX) is an antihistamine with selective peripheral H1-receptorantagonist activity and inhibited antigen induced bronco spasm. It is chemically known as (±)-4-[4-(hydroxyl-4-[4-(hydroxyl diphenyl- methyl) –1-piperdinyl]-butyl-α-α-dimethyl benzene acetic acid1-3. Literature survey reveals only few methods HPCL4-5, LC- MS6-7 for its determination in biological fluids and dosage forms. Although spectrophotometric methods are the instrumental methods of choice commonly used in industrial laboratories, no colorimetric method has been reported so far for the determination of FEX. Therefore, the need for a fast, low cost and selective method is obvious, especially for routine quality control analysis of pharmaceutical products containing FEX.
During the course of our efforts to develop sensitive visible spectrophotometric methods, it was observed that the analytically useful carboxylic acid group in FEX has not been properly exploited.
200 B.S.SASTRY et.al.,
FEX being acidic in nature due to the presence of carboxylic acid group forms an ion-association complex with the basic dyes (SFN-O, method A or MB, method B), which is extractable into chloroform. The results are statistically validated.
Experimental A Systronics UV-Vis spectrophotometer 117 with 1 cm matched quartz cells were used for all spectral and absorbance measurements. A Systronics digital pH meter 361 was used for pH measurements.
All the chemicals and reagents were of AR grade and the solutions were prepared in triply distilled water. Aqueous solutions of SFN-O (Fluka, 2.857x10⁻⁴M) and MB (Fluka, 3.12x10⁻⁴M) were prepared for methods A and B.
The standard stock solution of FEX (1 mg/ml) was prepared by dissolving 100 mg of drug in 100 ml of chloroform. The working standard solutions were prepared by further dilution of the stock solution with chloroform (200 µg/ml for method A and method B).
Procedures Method A and B
1 ml of pH 9.8 buffer and 5.0 ml of dye solution SFN-O (method A) or MB (method B) were added into a series of 125 ml separating funnels containing aliquots of standard FEX solution [1.0 – 3.0 ml, 200 µg/ml (method A) and 0.5-2.5 ml, 200 µg/ml (method B)], The total volume of aqueous phase in each separating funnel was adjusted to 10 ml with distilled water and 10 ml of CHCl3 was added. The contents were shaken for 5 min. The two phases were allowed to separate and the absorbance of the separated organic layer was made up to the mark with CHCl3 and measured at 520 nm (method A) or 650 nm (method B) against a similar reagent blank. The amount of FEX in methods A and B were computed from their respective calibration curves
For pharmaceutical Formulations
A weighed amount of tablet powder equivalent to 100 mg of FEX was transferred into a separator with 10 ml distilled water. The separator was shaken to disperse the material and the contents were extracted with 3×25 ml portions of chloroform. The total chloroform extracts were collected in to 100 ml volumetric flask and then diluted to the mark with same solvent to obtain stock solution (1 mg ml-1) in chloroform. This stock solution was further processed as required for analysis of proposed or recommended procedure as in the case of bulk samples for methods A and B.
Results and Discussion In order to establish the optimum pH range for methods A and B, the FEX was allowed to react with the respective dye in aqueous solution maintained pH 8.0-11.0 using NH4Cl- NH4OH buffer. The complex formed was extracted into chloroform for absorbance measurement. The results show that a quantitative extraction was produced with a pH 9.0-10.0. All subsequent studies were carried out with pH 9.8 for both the methods. A 1.0 ml portion of pH 9.8 buffer solutions was found to be optimal. The maximum shaking time was determined by varying the shaking time from 3-8 min, although 4 min was sufficient, prolonged shaking has no adverse effect on the extraction and 5 min was selected for this study. Ratios of 1:1 (methods A and B) of organic to aqueous phases were required for efficient extraction of the colored species and lowest reagent blank reading. It was found that better reproducibility and a lowest reagent blank was achieved if the dye was purified by extraction with chloroform initially. Analytical data:
The optimum conditions for the color development of method were established by varying the parameters one at a time, keeping the others fixed and observing the effect produced on the absorbance of the colored species.
Ion Association Methods for the Determination of Fexofenadine 201
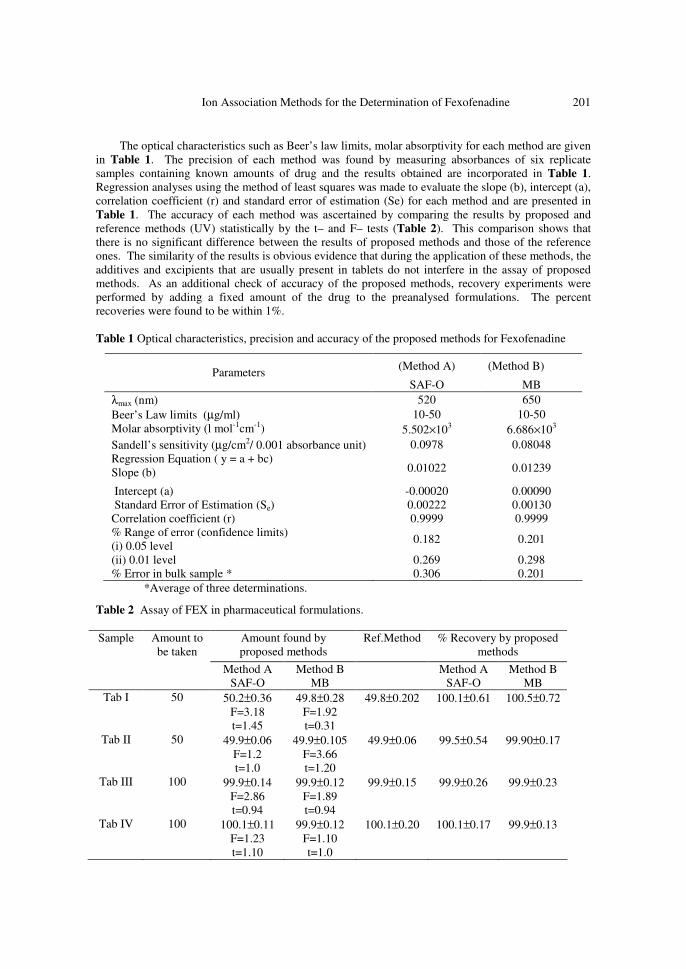
The optical characteristics such as Beer’s law limits, molar absorptivity for each method are given in Table 1. The precision of each method was found by measuring absorbances of six replicate samples containing known amounts of drug and the results obtained are incorporated in Table 1. Regression analyses using the method of least squares was made to evaluate the slope (b), intercept (a), correlation coefficient (r) and standard error of estimation (Se) for each method and are presented in Table 1. The accuracy of each method was ascertained by comparing the results by proposed and reference methods (UV) statistically by the t– and F– tests (Table 2). This comparison shows that there is no significant difference between the results of proposed methods and those of the reference ones. The similarity of the results is obvious evidence that during the application of these methods, the additives and excipients that are usually present in tablets do not interfere in the assay of proposed methods. As an additional check of accuracy of the proposed methods, recovery experiments were performed by adding a fixed amount of the drug to the preanalysed formulations. The percent recoveries were found to be within 1%. Table 1 Optical characteristics, precision and accuracy of the proposed methods for Fexofenadine
(Method A) (Method B) Parameters SAF-O MB
λmax (nm) 520 650 Beer’s Law limits (µg/ml) 10-50 10-50 Molar absorptivity (l mol-1cm-1) 5.502×10³ 6.686×10³ Sandell’s sensitivity (µg/cm2/ 0.001 absorbance unit) 0.0978 0.08048 Regression Equation ( y = a + bc) Slope (b) 0.01022 0.01239
Intercept (a) -0.00020 0.00090 Standard Error of Estimation (Se) 0.00222 0.00130 Correlation coefficient (r) 0.9999 0.9999 % Range of error (confidence limits) (i) 0.05 level 0.182 0.201
(ii) 0.01 level 0.269 0.298 % Error in bulk sample * 0.306 0.201
*Average of three determinations.
Table 2 Assay of FEX in pharmaceutical formulations.
Sample Amount to be taken
(mg)
Amount found by proposed methods
Ref.Method
% Recovery by proposed methods
Method A SAF-O
Method B MB
Method A SAF-O
Method B MB
Tab I 50 50.2±0.36 F=3.18 t=1.45
49.8±0.28 F=1.92 t=0.31
49.8±0.202 100.1±0.61 100.5±0.72
Tab II 50 49.9±0.06 F=1.2 t=1.0
49.9±0.105 F=3.66 t=1.20
49.9±0.06 99.5±0.54 99.90±0.17
Tab III 100 99.9±0.14 F=2.86 t=0.94
99.9±0.12 F=1.89 t=0.94
99.9±0.15 99.9±0.26 99.9±0.23
Tab IV 100 100.1±0.11 F=1.23 t=1.10
99.9±0.12 F=1.10 t=1.0
100.1±0.20 100.1±0.17 99.9±0.13
202 B.S.SASTRY et.al.,
Nature of colored species
Methods A and B
FEX possesses carboxylic acid and it involves in ion association complex formation with a basic dye (MB, Method A; SFN-O, Method B), which is extractable into chloroform from the aqueous phase. The anion form of carboxylic acid (negative charge) of FEX molecule in alkaline pH medium is expected to attract the oppositely charged part (positive charge) of the dye and behave as a single unit being held together by electrostatic attraction. The slope ratio method of study revealed that the drug to dye mole ratio as 1:1.
Interference studies:
The interference studies in the determination of FEX in pharmaceutical formulation revealed that the normally existing excipients and additives like starch, lactose, gelatin, talc, magnesium stearate, aluminium hydroxide, sorbitol, calcium silicate and glycerin do not interfere even when present in excess than the anticipated amount. However, a preliminary clean up procedure with chloroform is necessary to avoid interference due to the presence of reducing sugars like lactose if present, prior to the estimation of FEX in formulations for methods A and B
Conclusion The proposed methods are applicable for the assay of FEX and have the advantage of wider range under Beer’s law limits. The proposed methods are simple, selective and can be used in the routine determination of FEX in bulk samples and formulations with reasonable precision and accuracy.
References 1. PDR: Physicians’s Desk Reference, 54 th
Edition, 2000. 2. British Pharmacopoeia, Vol. I & II and Vet 1993, HMSO, London,1999. 3. The Merck Index, 12 th Edition, Merck & Co Inc, New York, 1996. 4. Zarapkar S S, Bhandari N P and Halkar U P Indian Drugs, 2000, 37 (9), 421. 5. Van Wensveen P, Chemistry in Australia, 2000, 67 (4), 17. 6. Abdel-Hamid M E, Journal of Liquid Chromatography & Related Technologies, 2000, 23
(20), 3095. 7. Atay O and Dincol F Analytical Letters, 1997, 30(9), 1675-1684

Submit your manuscripts athttp://www.hindawi.com
Hindawi Publishing Corporationhttp://www.hindawi.com Volume 2014
Inorganic ChemistryInternational Journal of
Hindawi Publishing Corporation http://www.hindawi.com Volume 2014
International Journal ofPhotoenergy
Hindawi Publishing Corporationhttp://www.hindawi.com Volume 2014
Carbohydrate Chemistry
International Journal of
Hindawi Publishing Corporationhttp://www.hindawi.com Volume 2014
Journal of
Chemistry
Hindawi Publishing Corporationhttp://www.hindawi.com Volume 2014
Advances in
Physical Chemistry
Hindawi Publishing Corporationhttp://www.hindawi.com
Analytical Methods in Chemistry
Journal of
Volume 2014
Bioinorganic Chemistry and ApplicationsHindawi Publishing Corporationhttp://www.hindawi.com Volume 2014
SpectroscopyInternational Journal of
Hindawi Publishing Corporationhttp://www.hindawi.com Volume 2014
The Scientific World JournalHindawi Publishing Corporation http://www.hindawi.com Volume 2014
Medicinal ChemistryInternational Journal of
Hindawi Publishing Corporationhttp://www.hindawi.com Volume 2014
Chromatography Research International
Hindawi Publishing Corporationhttp://www.hindawi.com Volume 2014
Applied ChemistryJournal of
Hindawi Publishing Corporationhttp://www.hindawi.com Volume 2014
Hindawi Publishing Corporationhttp://www.hindawi.com Volume 2014
Theoretical ChemistryJournal of
Hindawi Publishing Corporationhttp://www.hindawi.com Volume 2014
Journal of
Spectroscopy
Analytical ChemistryInternational Journal of
Hindawi Publishing Corporationhttp://www.hindawi.com Volume 2014
Journal of
Hindawi Publishing Corporationhttp://www.hindawi.com Volume 2014
Quantum Chemistry
Hindawi Publishing Corporationhttp://www.hindawi.com Volume 2014
Organic Chemistry International
Hindawi Publishing Corporationhttp://www.hindawi.com Volume 2014
CatalystsJournal of
ElectrochemistryInternational Journal of
Hindawi Publishing Corporation http://www.hindawi.com Volume 2014