Embed Size (px)
Citation preview
Quantitative determination of mass-resolved ion densities in H2-Ar inductively
coupled radio frequency plasmas
M. Sode,1, a) T. Schwarz-Selinger,1 and W. Jacob1
Max-Planck-Institut fur Plasmaphysik, EURATOM Association, Boltzmannstraße 2,
D-85748 Garching, Germany.
(Dated: 22 April 2013)
Inductively coupled H2-Ar plasmas are characterized by an energy-dispersive mass
spectrometer (plasma monitor), a retarding field analyzer, optical emission spec-
troscopy and a Langmuir probe. A procedure is presented that allows determining
quantitatively the absolute ion densities of Ar+, H+, H+2 , H
+3 and ArH+ from the
plasma monitor raw signals. The calibration procedure considers the energy and
mass-dependent transmission of the plasma monitor. It is shown that an additional
diagnostic like a Langmuir probe or a retarding field analyzer is necessary to derive
absolute fluxes with the plasma monitor. The conversion from fluxes into densities
is based on a sheath and density profile model.
Measurements were conducted for a total gas pressure of 1.0 Pa. For pure H2 plasmas
the dominant ion is H+3 . For mixed H2-Ar plasmas the ArH+ molecular ion is the
most dominant ion species in a wide parameter range. The electron density ne is
around 3× 10¹⁶ m−3 and the electron temperature Te decreases from 5 to 3 eV with
increasing Ar content. The dissociation degree was measured by actinometry. It is
around 1.7 % nearly independent on Ar content. The gas temperature, estimated by
the rotational distribution of the Q-branch lines of the H2 Fulcher-α diagonal band
(v‘ = v“ = 2) is estimated to (540±50) K.
PACS numbers: 52.20.-j, 52.25.-b, 52.70.-Nc, 52.80.Pj
Keywords: argon, hydrogen, ICP, ion densities, energy-resolved mass spectrometry,
OES, Langmuir probe
a)Electronic mail: [email protected]
1
I. INTRODUCTION
H2-containing plasmas have a wide range of technical applications in etching1, film
deposition2–7 and surface passivation, hydrogenation and oxide reduction8–11. H2-Ar mix-
tures were successfully applied for hydrogenation of thin film transistors12 and to control
the surface properties of polymers13. Hopf et al. observed chemical sputtering of hydro-
carbon films with very high rates when energetic Ar and atomic hydrogen were interacting
simultaneously14. Voitsenya et al. therefore proposed H2-Ar discharges for the removal of
hydrocarbon deposits in magnetic fusion devices15. However, to judge the effectiveness of
such a method the absolute particle fluxes need to be known.
Qualitative mass-resolved measurements of different ion species in inductively coupled
plasmas (ICP) of Ar and H2 using an energy-dispersive mass spectrometer were carried out
by Gudmundsson16,17 and by Jang and Lee18. Gudmundsson showed ion energy distribu-
tions and uncorrected flux ratios of the H+, H+2 , H
+3 and Ar+ signals. Surprisingly the ArH+
ion was not measured by Gudmundsson which was found to be the dominant ion for Ar
containing H2 discharges in our measurements. Jang and Lee measured ion species for the
same system, but neglected H+3 which is the dominant ion species in a pure H2 discharge. In
general, with energy-dispersive mass spectrometers—often also named plasma monitors—
signal intensities depending on the incoming ion fluxes are measured. In this work we are
mainly aiming for ion densities because these can finally be compared with results of rate
equation models. The relation between ion fluxes and the corresponding densities is estab-
lished by plasma sheath models19. Kimura and Kasugai measured the electron temperature
and electron density as well as the density of atomic hydrogen in H2-Ar ICP plasmas and
compared the results with a global model of the discharge20. They also presented modeling
results for the mass-resolved ion densities but unfortunately they did not measure them.
Despite the numerous studies on hydrogen as well as H2-Ar inductively coupled plasmas16–18,20,21
no quantitative data on experimentally determined mass-resolved ion densities are available.
Because this is also true for plasma characterization studies in general we want to outline in
this article a procedure to derive absolute, mass-resolved ion densities from measurements
with an energy-dispersive mass spectrometer. We present a comprehensive experimental
study of H2-Ar ICP plasmas. Quantitative results for the ion species present in the plasma
are determined as a function of the Ar fraction. In addition, we measured electron tempera-
2
8
7
6
5 43
9
1 2C
CT
L
C Sym
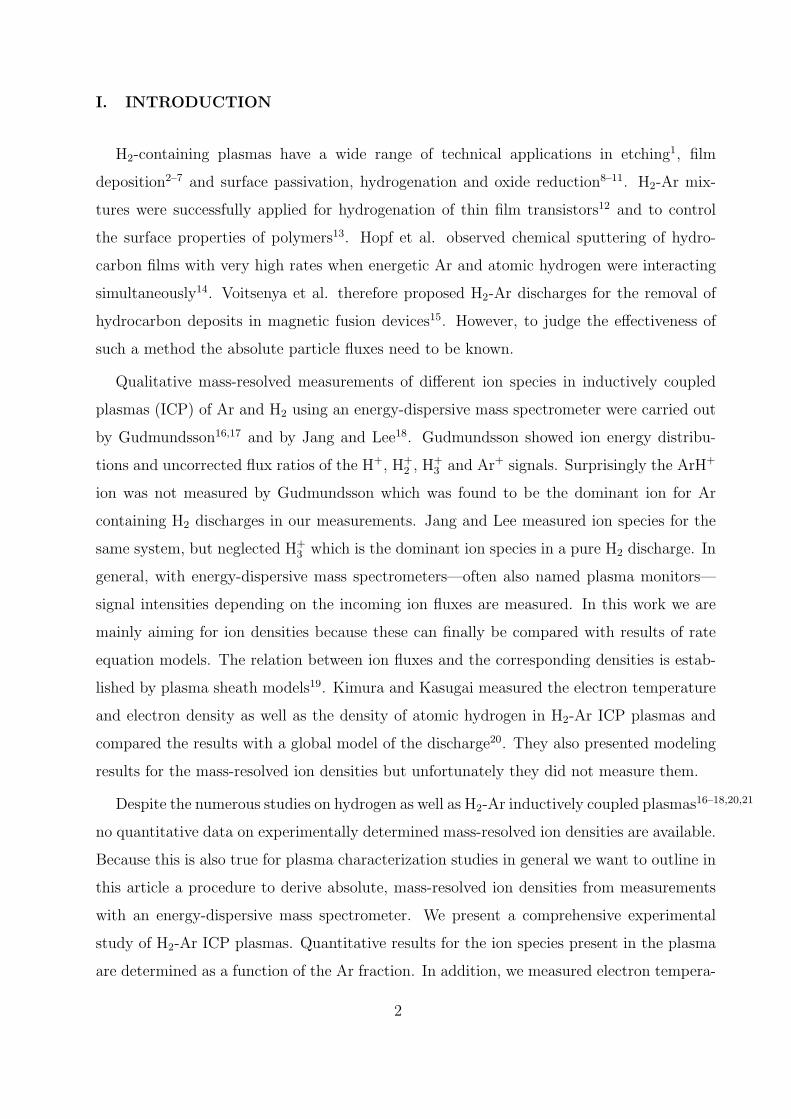
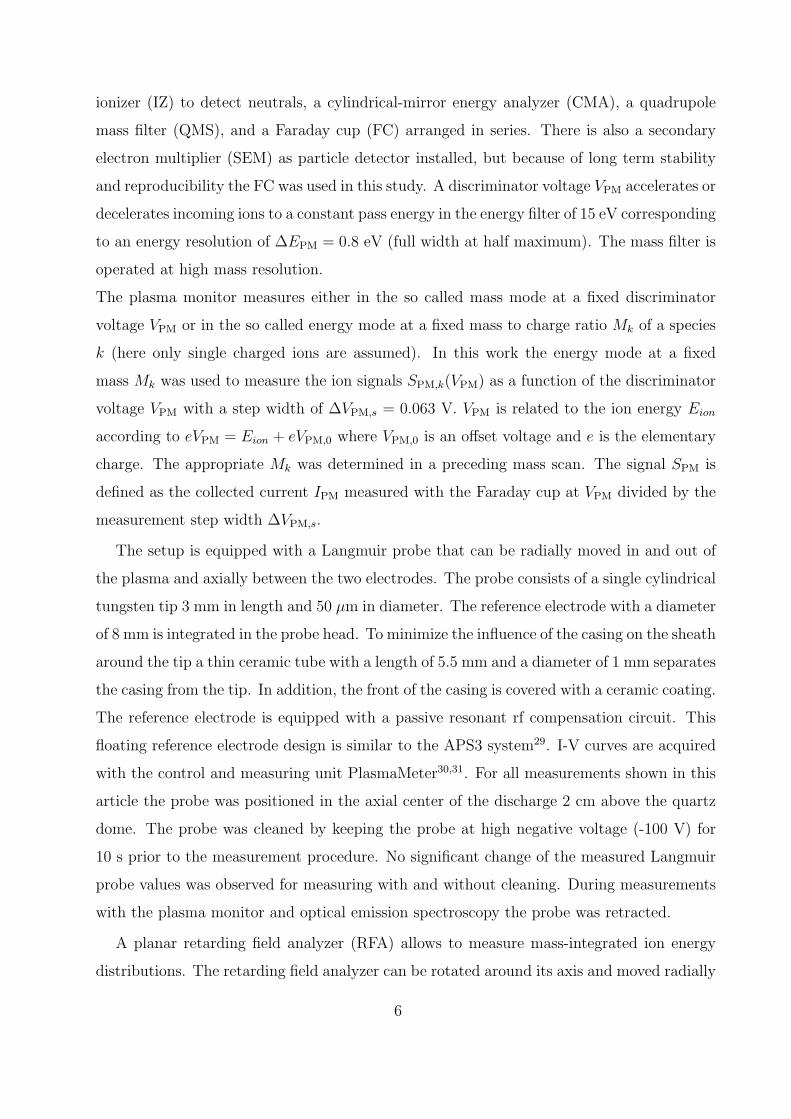
FIG. 1. Sketch of the experimental setup: 1 - RF generator, 2 - Π-type matching network, 3 -
planar inductive coil, 4 - quartz dome, 5 - grounded vacuum chamber, 6 - Langmuir probe, 7 -
retarding field analyzer, 8 - plasma monitor, 9 - light collecting system for the optical spectrometer.
ture and density, atomic hydrogen density, and gas temperature. This comprehensive set of
experimentally determined plasma parameters provides a solid basis of input data for rate
equation modeling20,21. Our final aim is to compare these data to results from such a rate
equation model, but that will be topic of a forthcoming publication.
The article is organized as follows: A short description of the experimental setup is
followed by a description of the evaluation process of the raw data measured with an energy-
dispersive mass spectrometer, a retarding field analyzer, a Langmuir probe and by optical
emission spectroscopy (OES). In Sect. IV the measured and evaluated results are discussed.
The conclusions are presented in Sect. V.
II. EXPERIMENT
The experiments were conducted in an inductively coupled plasma reactor sketched in
Fig. 1. The dimensions of the cylindrical stainless steel plasma chamber are similar to
the geometry of the Gaseous Electronics Conference (GEC) reference cell22 with a chamber
3
diameter of 250 mm and a total height of 360 mm. Compared to the initial design the
distance between the two electrodes is larger, namely l = 60 mm. The discharge is generated
by a planar coil with 5 turns and 100 mm in diameter that immerses 180 mm deep into the
chamber. The coil is driven by a radio frequency (rf) generator with a maximum power
of 600 Watt operating at 13.56 MHz (Dressler Cesar 136). In contrast to the initial GEC
design, the coil is separated from the vacuum by a quartz dome23. Compared to a metallic
shield this reduces power losses caused by eddy currents. The top part of the dome is
10 mm thick and acts as the dielectric window for the coil. The diameter of the quartz
dome and the upper electrode is 131 mm. For matching of the rf generator output and
the discharge impedance a Π-type network (modified Dressler VarioMatch 1000) was used to
reduce capacitive coupling24. rf voltage, rf current and the phase between them is measured
with high accuracy at the input side of the matching box (MKS Instruments VI-probe 4100).
The plasma chamber is pumped with a turbo molecular pump with Hohlweck stage
to achieve a good compression also for H2. The background pressure measured with an
ionization gauge is of the order of 10−6 Pa. A butterfly valve in front of the turbo molecular
pump allows to throttle the pumping speed. All experiments were conducted with a fixed
butterfly position so that the residence time of the species was constant. The working
pressure was always 1.0 Pa and was measured with a capacitance manometer before plasma
ignition. The incoming gas flows are adjusted with mass-flow controllers. For the chosen
butterfly position the required gas flows to achieve the working pressure of 1.0 Pa are ΦH2 =
90 sccm in case of pure H2 and ΦAr = 50 sccm for pure Ar (1sccm = 4.48×10¹⁷ particles per
second). For different gas compositions the gas flow is varied in steps of ∆Φ/Φmax = 20 %,
i.e., ∆ΦAr = 10 sccm and ∆ΦH2 = 18 sccm. For the investigated H2-Ar mixtures Ar gas
flows of x∆ΦAr and H2 gas flows of (5−x)∆ΦH2 with x = 1, 2, 3, 4 were used. However, mass
spectrometer investigations have shown that the flux ratios of Ar and H2 are not identical
to the partial pressure ratios for our experimental conditions. A differentially pumped mass
spectrometer with cross-beam ion source was used to measure the actual partial pressures
in the gas mixtures. The setup is described elsewhere25,26. It samples particles through
an orifice at the outer diameter of the vessel in the central plane. In this work a carbon
tube with a diameter of 600 µm and a length of 12 mm was used as orifice. The background
pressure in the mass spectrometer chamber is of the order of 10−7 Pa. For a working pressure
of 1.0 Pa in the plasma chamber the pressure in the mass spectrometer chamber raises for H2
4
to 1.2×10⁻⁵ Pa and for Ar to 7.2×10⁻⁶ Pa. In addition, the mass spectrometer chamber is
equipped with a shutter behind the orifice to allow distinguishing the isotropic background
from the molecular beam that is formed. The particle density in this beam is proportional to
the particle density in the vessel27. The beam component was obtained by subtracting the
signal with closed shutter from the signal with opened shutter. The beam-to-background
ratio R was measured and yields for Ar RAr = 5.0± 0.3 and for H2 RH2 = 1.5± 0.1.
In the following the procedure for determining the Ar fraction is described. A certain flow
of a pure gas corresponds for the fixed butterfly position to a certain pressure in the main
chamber. This main chamber pressure corresponds to a beam component measured with
the mass spectrometer. The beam components of the mass spectrometer signals for the pure
gases were calibrated against the pressure in the main chamber measured with the capacitive
manometer. This calibration was made for the full partial pressure range applied in the
experiments. The such calibrated mass spectrometer was in the following used to measure
the partial pressures of the gas species in the gas mixtures. These measurements show that
the partial pressure ratios for the gas mixtures are not identical to the gas flow ratios. This
is most probably due to the pumping behavior of a gas mixture in the Knudsen flow regime if
the gas species possess considerably different masses. A similar demixing has been observed
earlier by Poschenrieder28. The Ar fraction is defined as fAr = pAr/(pAr + pH2) where pAr
and pH2 are the partial pressures measured with the mass spectrometer in the plasma-off
state. This procedure yields the following Ar fractions for the above-mentioned flow ratios:
12.6, 28.0, 48.0, and 72.3 %. The total pressure ptot of 1.0 Pa before plasma ignition stays
constant during the discharge within the measurement accuracy of ±2 %.
A combined energy and mass analyzer (Pfeiffer plasma process monitor PPM 422, Inficon
AG Balzers) - in the following designated as plasma monitor (PM) - is incorporated into
the upper, grounded electrode (see Fig. 1). The plasma monitor is twofold differentially
pumped. Particles are sampled through two aligned orifices 100 and 500 µm in diameter,
respectively. The two differential pumping stages assure a sufficiently low pressure in the
plasma monitor system. For a working pressure of 1.0 Pa in the plasma chamber for H2 a
pressure of 7.7× 10⁻⁶ Pa results in the plasma monitor and for Ar 1.1× 10⁻⁶ Pa. The first
orifice, which faces the plasma, is kept at ground potential. The second orifice separating the
first and second pumping stage has a potential of -80 eV with respect to ground to attract
positive ions. The plasma monitor consists of an Einzel lens (EL), an electron impact-
5
ionizer (IZ) to detect neutrals, a cylindrical-mirror energy analyzer (CMA), a quadrupole
mass filter (QMS), and a Faraday cup (FC) arranged in series. There is also a secondary
electron multiplier (SEM) as particle detector installed, but because of long term stability
and reproducibility the FC was used in this study. A discriminator voltage VPM accelerates or
decelerates incoming ions to a constant pass energy in the energy filter of 15 eV corresponding
to an energy resolution of ∆EPM = 0.8 eV (full width at half maximum). The mass filter is
operated at high mass resolution.
The plasma monitor measures either in the so called mass mode at a fixed discriminator
voltage VPM or in the so called energy mode at a fixed mass to charge ratio Mk of a species
k (here only single charged ions are assumed). In this work the energy mode at a fixed
mass Mk was used to measure the ion signals SPM,k(VPM) as a function of the discriminator
voltage VPM with a step width of ∆VPM,s = 0.063 V. VPM is related to the ion energy Eion
according to eVPM = Eion + eVPM,0 where VPM,0 is an offset voltage and e is the elementary
charge. The appropriate Mk was determined in a preceding mass scan. The signal SPM is
defined as the collected current IPM measured with the Faraday cup at VPM divided by the
measurement step width ∆VPM,s.
The setup is equipped with a Langmuir probe that can be radially moved in and out of
the plasma and axially between the two electrodes. The probe consists of a single cylindrical
tungsten tip 3 mm in length and 50 µm in diameter. The reference electrode with a diameter
of 8 mm is integrated in the probe head. To minimize the influence of the casing on the sheath
around the tip a thin ceramic tube with a length of 5.5 mm and a diameter of 1 mm separates
the casing from the tip. In addition, the front of the casing is covered with a ceramic coating.
The reference electrode is equipped with a passive resonant rf compensation circuit. This
floating reference electrode design is similar to the APS3 system29. I-V curves are acquired
with the control and measuring unit PlasmaMeter30,31. For all measurements shown in this
article the probe was positioned in the axial center of the discharge 2 cm above the quartz
dome. The probe was cleaned by keeping the probe at high negative voltage (-100 V) for
10 s prior to the measurement procedure. No significant change of the measured Langmuir
probe values was observed for measuring with and without cleaning. During measurements
with the plasma monitor and optical emission spectroscopy the probe was retracted.
A planar retarding field analyzer (RFA) allows to measure mass-integrated ion energy
distributions. The retarding field analyzer can be rotated around its axis and moved radially
6
in and out of the plasma as well as axially between the two electrodes. It samples ions
through an orifice with a diameter of dRFA = 1.5 mm. Its four grid design follows the
recommendations by Conway et al.32. To prevent the plasma from penetrating into the RFA
a grounded gold mesh with 1000 lines/inch is placed directly behind the orifice. A second
grid with 100 lines/inch and a potential of Φ = −54 V is used to repel the electrons. On
the third grid (100 lines/inch) the retardation voltage VRFA is applied. The fourth grid with
100 lines/inch and Φ = −82 V is used to prevent the escape of secondary electrons created
on the collector plate (Φ = −73 V) where the ions impinge to measure the current. The
RFA measures ion fluxes as a function of VRFA. The ion energy distribution can be obtained
by differentiating the measured ion flux with respect to VRFA. The geometrical transmission
probability for the ions was determined to be TRFA = 0.19. The total ion flux is related to
the measured current IRFA at VRFA = 0 V by
jRFA =IRFA
0.25πd2RFA × e× TRFA
. (1)
The miniature RFA is designed for working conditions that do not require differential pump-
ing. Therefore, the distance between the entrance orifice and the collector plate is 2.4 mm
only. For the actual pressure of 1 Pa the mean free path of Ar+ ions with 20 eV is 18 mm
(with a total cross section considering elastic and charge exchange collisions of 4.7×10⁻¹⁹ m2
and a gas temperature of 600 K) and therefore the influence of collisions should be small33.
For hydrogen and helium the mean free paths are similar33,34. Measurements showed that
below 1 Pa for all three gases the RFA delivers ion fluxes at VRFA = 0 V equal to those
measured with the Langmuir probe. For increasing Ar pressure the total ion flux in the
RFA decreases in spite of a constant or even increasing ion flux measured with the Lang-
muir probe. The same effect was also observed in Ref.35 and an empirical correction was
derived. Here we do not intend to correct for this effect but restrict ourselves to a maximum
pressure of 1.0 Pa where the RFA ion flux measurement is still undisturbed. For hydrogen
and helium the effect of a decreasing RFA flux for increasing pressure starts at even higher
pressures as will be discussed in more detail later.
Optical emission spectroscopy (OES) was applied to measure the gas temperature and
the dissociation degree of hydrogen. The light emitted from the plasma is collected by a lens
after passing through a BK7 glass window separating vacuum from ambient-atmosphere and
an aperture with a diameter of 1 mm. The emitted light is sampled along a line of sight
7
approximately 10 mm in diameter radially through the plasma 20 mm above the quartz
dome. The light is collimated by an aperture with a diameter of 1 mm. A plano-convex lens
focusses the light into a quartz fibre cable guiding it to a Czerny-Turner spectrograph (Acton
SpectraPro 275) with a focal length of 275 mm. The entrance slit of the spectrometer has a
width of 40 µm. The spectrometer is equipped with three exchangeable gratings with 150,
600 and 1800 lines per mm. All experiments were conducted with the 1800 l/mm grating,
which has a measured resolution of 0.15 nm at λ = 600 nm. The light is detected by a CCD
array (EEV 256x1024 OE CCD30, PIXIS, Princeton Instruments). A relative sensitivity
calibration of the spectrograph was performed with a calibrated halogen lamp and D2 arc
discharge light source.
III. QUANTITATIVE DETERMINATION OF PLASMA PARAMETERS
A. Calibration process of the plasma monitor signals
In this section the procedure to transform measured signal intensities SPM,k for an ion
species k into ion densities nPM,k is described. First, it is shown how the measured signals
SPM are related to the ion fluxes onto the orifice. To this end the detection efficiency is
analyzed. Second, the relative fluxes are converted into ion densities. This conversion is
carried out applying a simple sheath model and assuming an ion density profile inside the
plasma. For the conversion we use the electron density ne determined with the Langmuir
probe together with the gas temperature Tg determined by spectroscopy (see Sect. III A 3).
1. Total detection efficiency of the plasma monitor
To measure absolute ion fluxes with the PM a total detection efficiency ηPM would be
required. In this section we attempt to determine this experimentally. In general, ηPM is in-
fluenced by the properties of the incoming ion beam such as ion energy, ion density, angular
distribution and ion mass which depend on the plasma conditions, e.g. plasma pressure, rf
power and gas species composition. The complex set-up of the PM consisting of ion optics,
cylindrical-mirror analyzer and quadrupole mass spectrometer does not allow to predict the
dependencies a priori. Nevertheless, in the following we try to outline general trends. To
determine the detection efficiency ηPM of the plasma monitor one would need a source of
8
10 20 30 40 500.01
0.1
1
j*PM/jLprobe
jRFA/jLprobe
j di
agno
stic/j L
prob
e
Most probable energy (eV)
PM RFAH
2 plasma
He plasma Power variation for H
2 plasma:
230 W400 W600 W
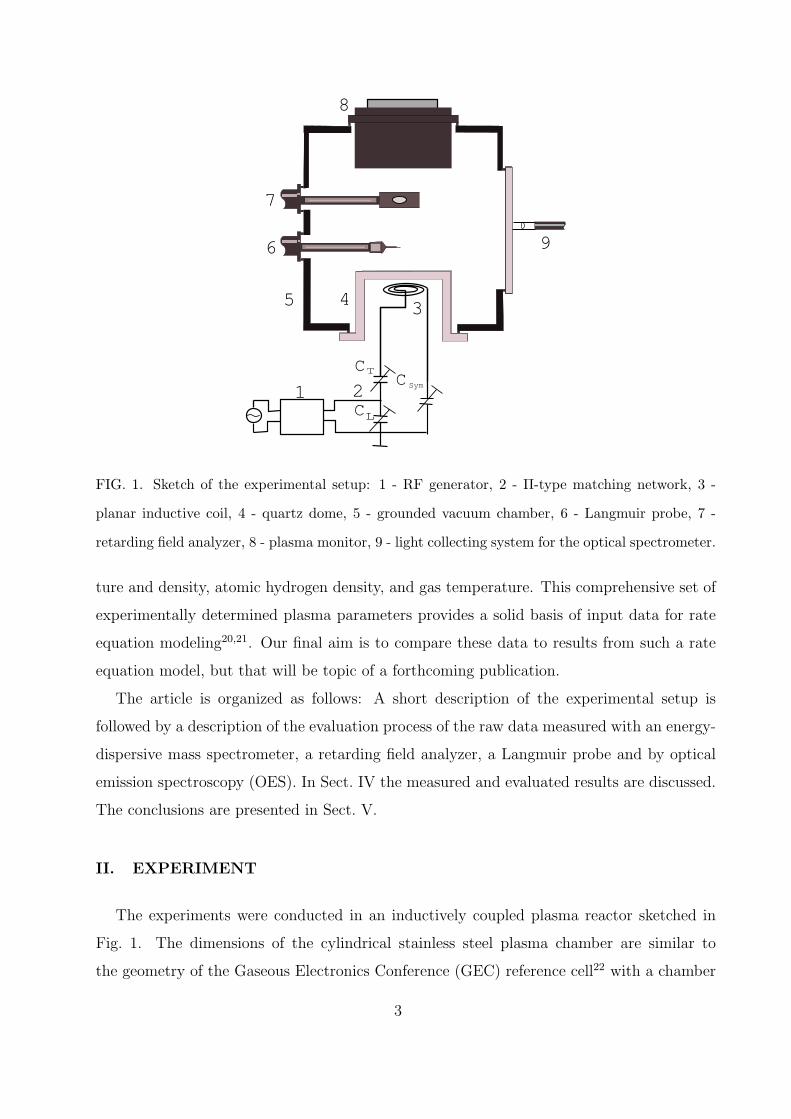
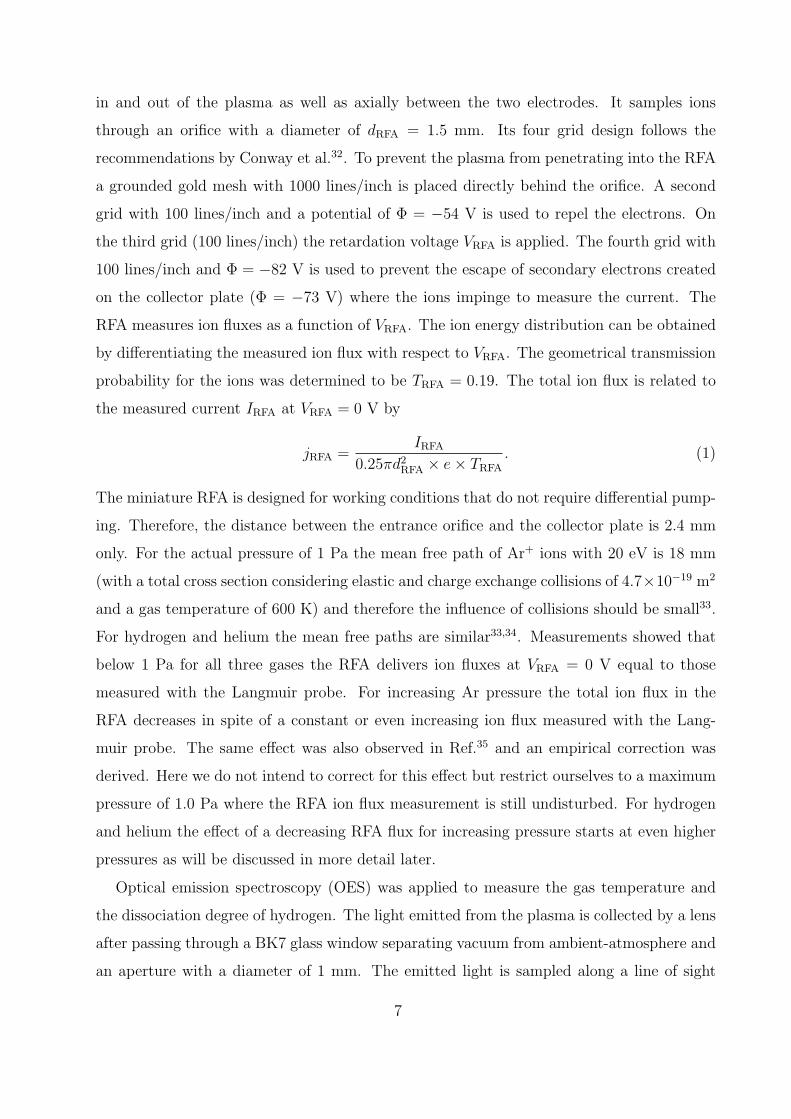
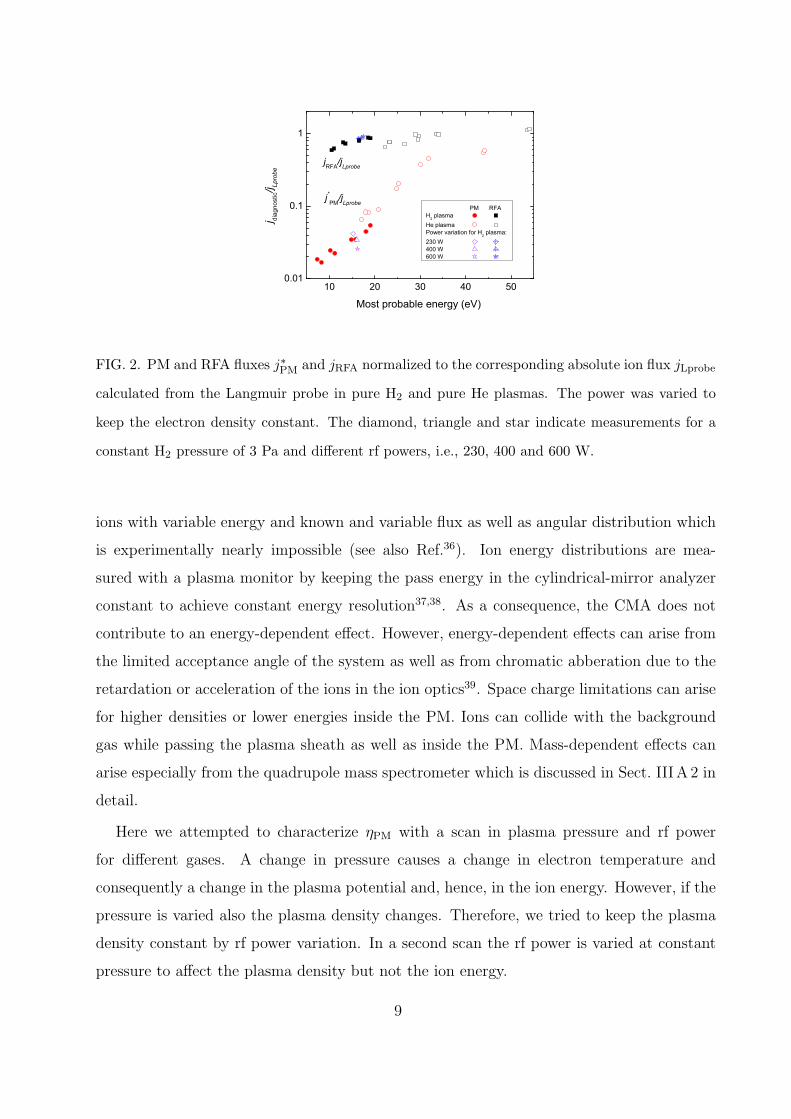
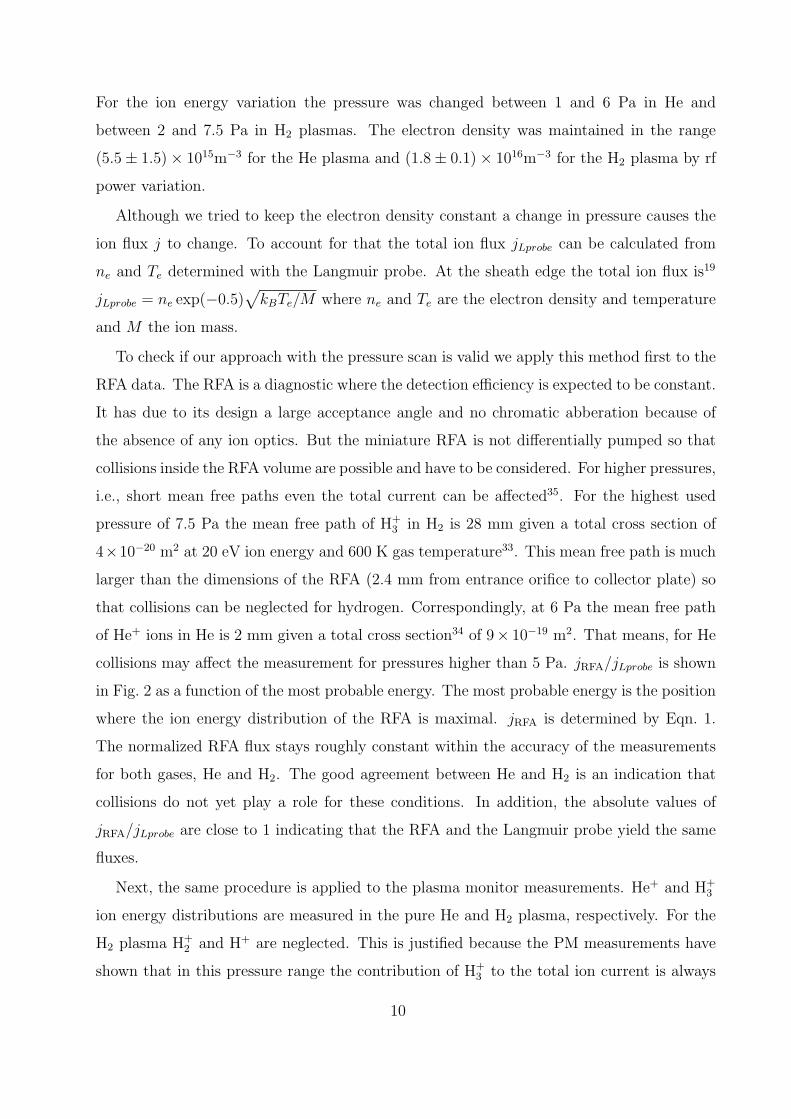
FIG. 2. PM and RFA fluxes j∗PM and jRFA normalized to the corresponding absolute ion flux jLprobe
calculated from the Langmuir probe in pure H2 and pure He plasmas. The power was varied to
keep the electron density constant. The diamond, triangle and star indicate measurements for a
constant H2 pressure of 3 Pa and different rf powers, i.e., 230, 400 and 600 W.
ions with variable energy and known and variable flux as well as angular distribution which
is experimentally nearly impossible (see also Ref.36). Ion energy distributions are mea-
sured with a plasma monitor by keeping the pass energy in the cylindrical-mirror analyzer
constant to achieve constant energy resolution37,38. As a consequence, the CMA does not
contribute to an energy-dependent effect. However, energy-dependent effects can arise from
the limited acceptance angle of the system as well as from chromatic abberation due to the
retardation or acceleration of the ions in the ion optics39. Space charge limitations can arise
for higher densities or lower energies inside the PM. Ions can collide with the background
gas while passing the plasma sheath as well as inside the PM. Mass-dependent effects can
arise especially from the quadrupole mass spectrometer which is discussed in Sect. III A 2 in
detail.
Here we attempted to characterize ηPM with a scan in plasma pressure and rf power
for different gases. A change in pressure causes a change in electron temperature and
consequently a change in the plasma potential and, hence, in the ion energy. However, if the
pressure is varied also the plasma density changes. Therefore, we tried to keep the plasma
density constant by rf power variation. In a second scan the rf power is varied at constant
pressure to affect the plasma density but not the ion energy.
9
For the ion energy variation the pressure was changed between 1 and 6 Pa in He and
between 2 and 7.5 Pa in H2 plasmas. The electron density was maintained in the range
(5.5± 1.5)× 1015m−3 for the He plasma and (1.8± 0.1)× 1016m−3 for the H2 plasma by rf
power variation.
Although we tried to keep the electron density constant a change in pressure causes the
ion flux j to change. To account for that the total ion flux jLprobe can be calculated from
ne and Te determined with the Langmuir probe. At the sheath edge the total ion flux is19
jLprobe = ne exp(−0.5)√
kBTe/M where ne and Te are the electron density and temperature
and M the ion mass.
To check if our approach with the pressure scan is valid we apply this method first to the
RFA data. The RFA is a diagnostic where the detection efficiency is expected to be constant.
It has due to its design a large acceptance angle and no chromatic abberation because of
the absence of any ion optics. But the miniature RFA is not differentially pumped so that
collisions inside the RFA volume are possible and have to be considered. For higher pressures,
i.e., short mean free paths even the total current can be affected35. For the highest used
pressure of 7.5 Pa the mean free path of H+3 in H2 is 28 mm given a total cross section of
4×10⁻²⁰ m2 at 20 eV ion energy and 600 K gas temperature33. This mean free path is much
larger than the dimensions of the RFA (2.4 mm from entrance orifice to collector plate) so
that collisions can be neglected for hydrogen. Correspondingly, at 6 Pa the mean free path
of He+ ions in He is 2 mm given a total cross section34 of 9× 10⁻¹⁹ m2. That means, for He
collisions may affect the measurement for pressures higher than 5 Pa. jRFA/jLprobe is shown
in Fig. 2 as a function of the most probable energy. The most probable energy is the position
where the ion energy distribution of the RFA is maximal. jRFA is determined by Eqn. 1.
The normalized RFA flux stays roughly constant within the accuracy of the measurements
for both gases, He and H2. The good agreement between He and H2 is an indication that
collisions do not yet play a role for these conditions. In addition, the absolute values of
jRFA/jLprobe are close to 1 indicating that the RFA and the Langmuir probe yield the same
fluxes.
Next, the same procedure is applied to the plasma monitor measurements. He+ and H+3
ion energy distributions are measured in the pure He and H2 plasma, respectively. For the
H2 plasma H+2 and H+ are neglected. This is justified because the PM measurements have
shown that in this pressure range the contribution of H+3 to the total ion current is always
10
higher than 86 %. For the PM, the signal SPM,k is integrated over the discriminator voltage
VPM. The resulting value j∗PM =∫SPM,kdVPM/APM is normalized by jLprobe. The area of
the entrance orifice of the PM, APM, is taken into account to estimate the total ion flux
into the PM, j∗PM. ηPM = j∗PM/jLprobe represents the total detection efficiency of the plasma
monitor. The results are also shown in Fig. 2 as function of the most probable energy.
In contrast to the RFA measurements ηPM increases with increasing energy by more than
one order of magnitude between 5 and 35 eV. For VPM higher than 35 eV the slope of ηPM
becomes smaller indicating saturation. The highest value of ηPM = 59 % is surprisingly close
to 100 % efficiency for these high energies. The reduction at low discriminator voltage we
attribute to space charge limitations causing a change in the acceptance angle. However,
the functional dependence of ηPM is in contrast to measurements by Pecher40 who found a
decrease proportional to E−1.2. But it has to be mentioned that Pecher investigated electron
cyclotron resonance plasmas at significantly lower pressures and used a plasma monitor of
different type.
With a pressure scan not only the ion energy but also the mean free path length of ions
and the sheath thickness change. If ηPM would be reduced by collisional effects then we
would anticipate that values for H2 are larger than values for He because the mean free
path length for H+3 in H2 is much larger than for He+ in He as discussed above. This is not
observed. Furthermore, collisions in the sheath would lead to a broader angular distribution
of the ions entering the plasma monitor. If collisions in the sheath would be important we
would anticipate that the ion energy distributions show a tail towards lower energy. For our
conditions no such tail is observed (see Sect. IVF). So we conclude that also for the PM
measurements collisions can be neglected.
To check the influence of plasma density on ηPM we varied the rf power for a H2 plasma
at 3 Pa. These data points are shown by the diamond, triangle and star symbols in Fig. 2.
Three different rf powers were applied: 230, 400 and 600 W. The electron temperature
and hence, the ion energy varies only slightly as expected for inductive discharges. The
main effect is an increase in ne from 1.1 × 10¹⁶m−3 to 2.7 × 10¹⁶m−3 as measured by the
Langmuir probe. With increasing ne also SPM should increase and, therefore ηPM should
stay constant. But as can be seen clearly in Fig. 2 this is not the case. With increasing rf
power ηPM decreases. We attribute this deviation to space charge limitations inside the PM.
This shows that even in this rather narrow parameter range the PM detection efficiency
11
is influenced not only by the ion energy but amongst other things also by the ion density.
This clearly shows that a global detection efficiency ηPM for arbitrary plasma conditions
cannot be determined. Therefore, it is in general not possible to compare quantitatively two
plasma monitor signals SPM,k with each other, neither for different plasma conditions nor
for different species k.
In the following we want to outline cases where it is at least possible to determine relative
fluxes. These relative fluxes can then be either compared with each other or absolutely
quantified by other plasma diagnostics. In other words, our approach is to decompose ηPM
into independent functions of known parameters like the ion mass M or the energy E:
ηPM = Tmd × Ted × .., (2)
where Tmd is the so-called mass-dependent transmission and Ted is energy-dependent trans-
missions. To compare different species k for a fixed plasma condition the mass-dependent
transmission Tmd(M) is required. To be able to compare for the same species different
plasma conditions Ted is needed.
The relative flux jPM,k,rel can then be expressed by:
jPM,k ∝ jPM,k,rel = 1/Tmd(M)
∫ ∞
0
1/Ted(V )× SPM,k(VPM)dVPM. (3)
Commonly the PM raw signal is integrated over the energy (see, e.g., Refs.16,18). This
implicitly assumes that Ted is constant. If this assumption is not valid the integrated signal
is not proportional to the individual ion flux jPM,k of an ion species k onto the orifice. Due
to the fact that the correct IED for an investigated plasma is not known a priori, there exists
no objective criterion that could be applied to optimize the ion optics settings using PM
measurements only. In favorable cases, e.g., noble gas plasmas at relatively low pressures,
it should be possible to determine Ted from a comparison of RFA- and PM-measured IEDs.
There are at least two articles36,38 that discuss the fact that the transmission through a
plasma monitor depends on the particle energy and that the energy-dependent transmission
can change depending on the settings in the ion optics. For their studies they used a different
plasma monitor system, namely a Hiden EQP 300 energy-resolved mass spectrometer. Both
studies developed elaborate optimization procedures to measure the ’real’ IED by finding
parameter sets for the ion optics that produce a flat Ted.
In our case the ion energy distributions for one plasma condition are similar in position and
12
0 5 10 15 20 25 30 35 400.0
0.1
0.2
0.3
0.4
0.5
0.6
0.7
0
1
2
3
4
T M, n
orm
aliz
ed (a
.u.)
m/q (amu/e)
T md (
108 A
m-2 P
a-1)
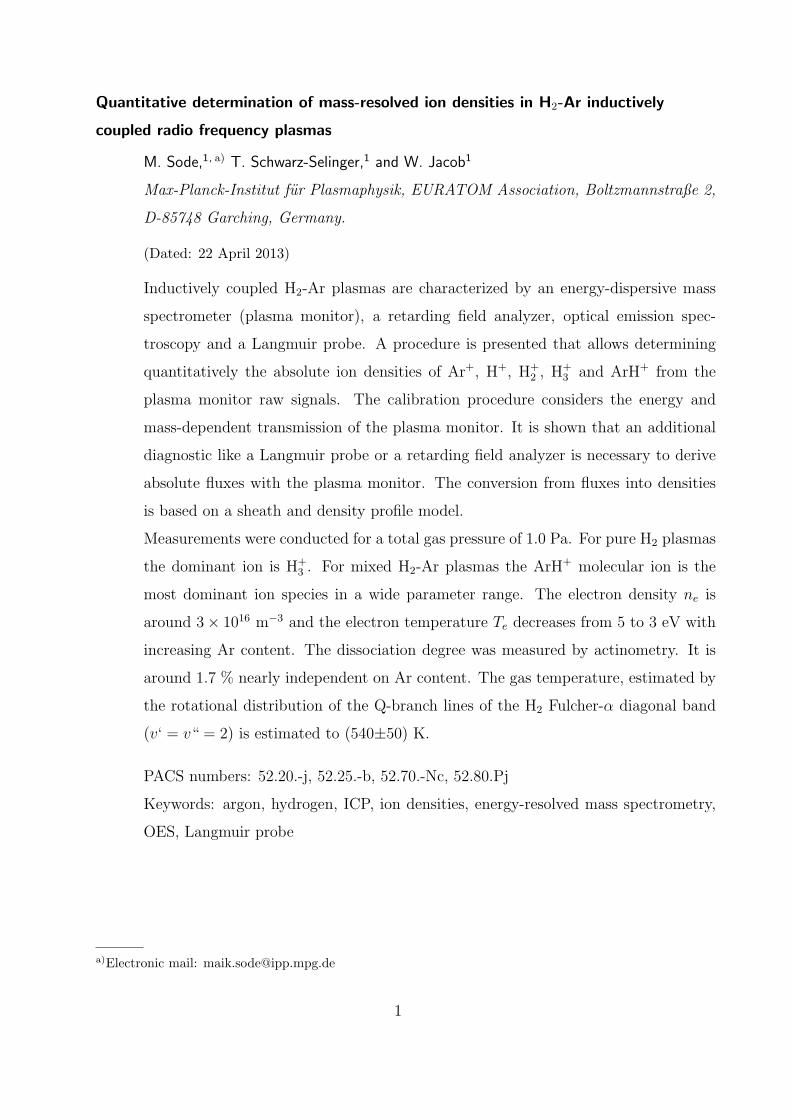
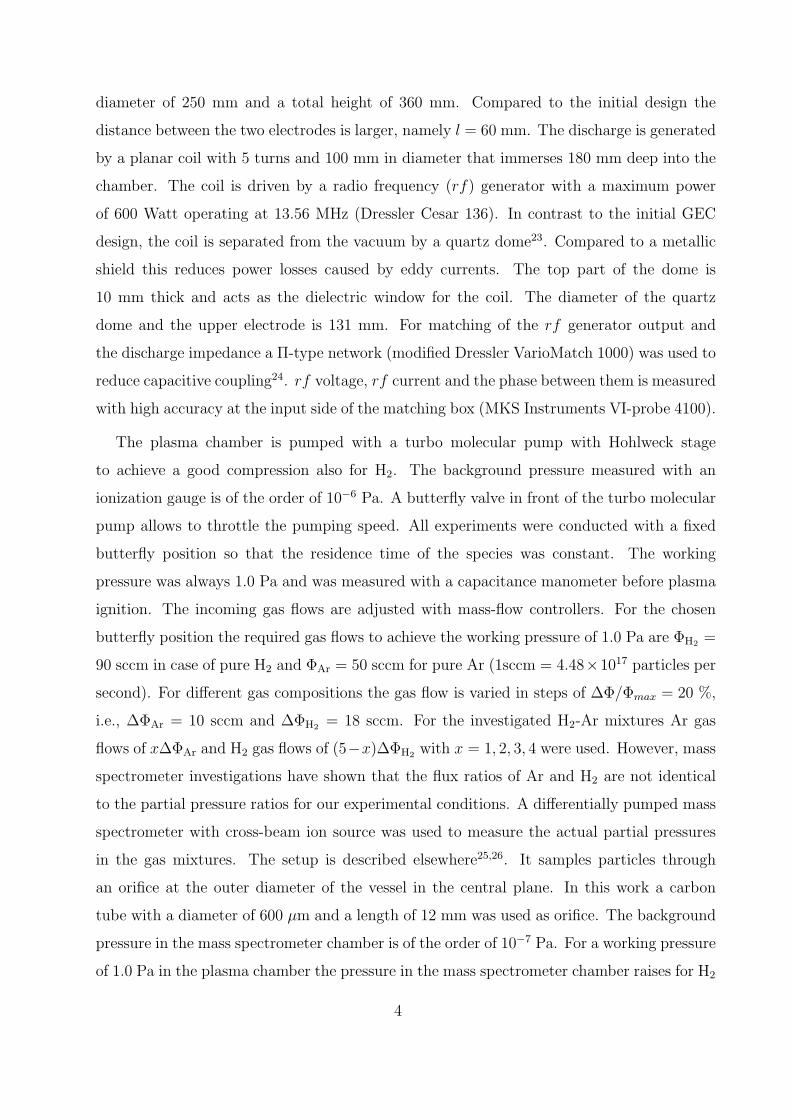
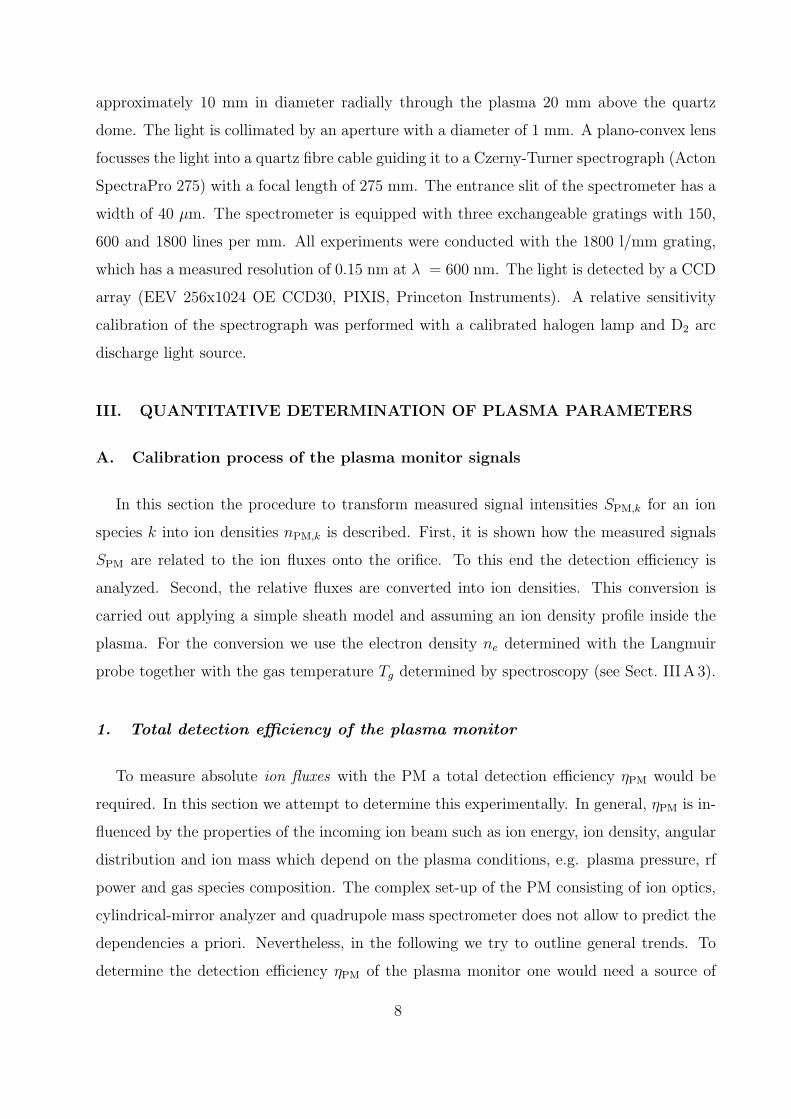
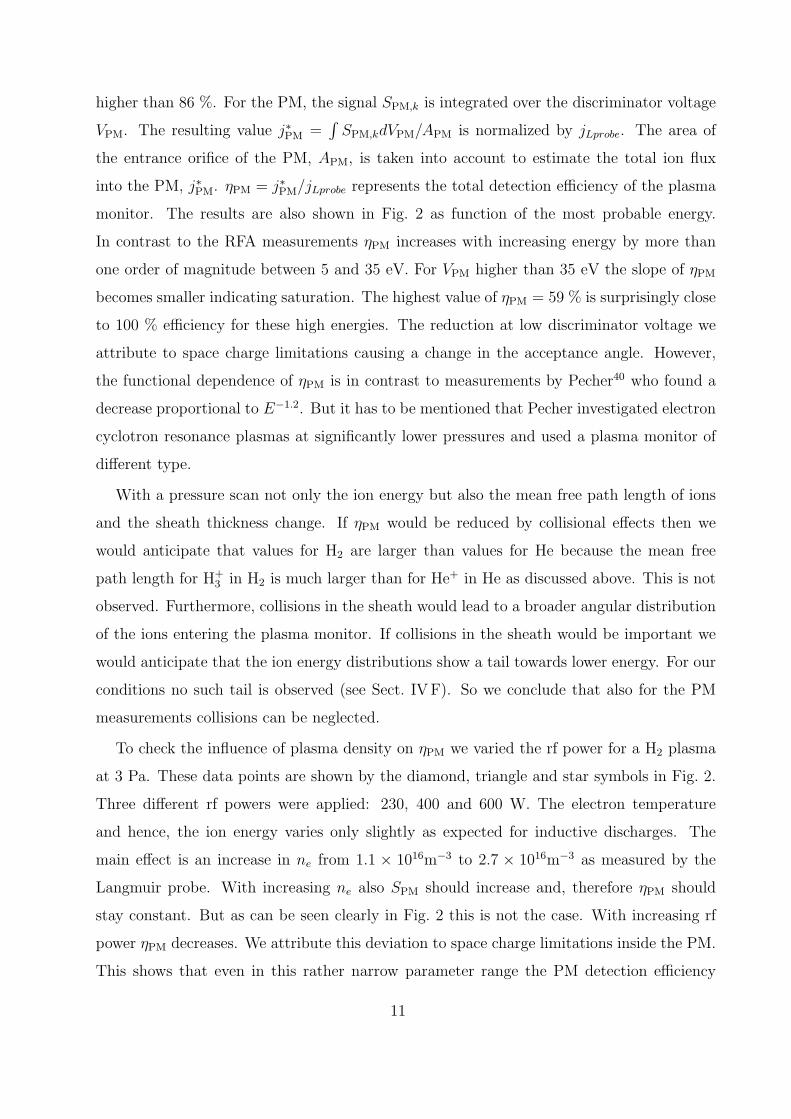
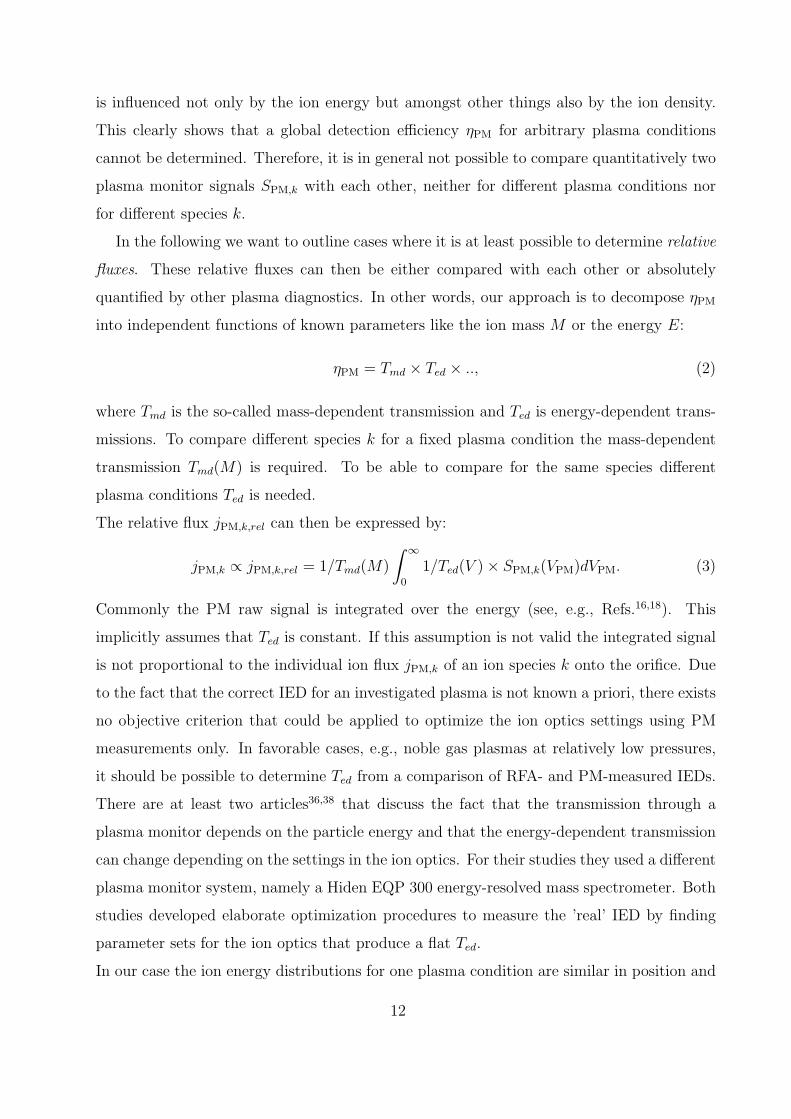
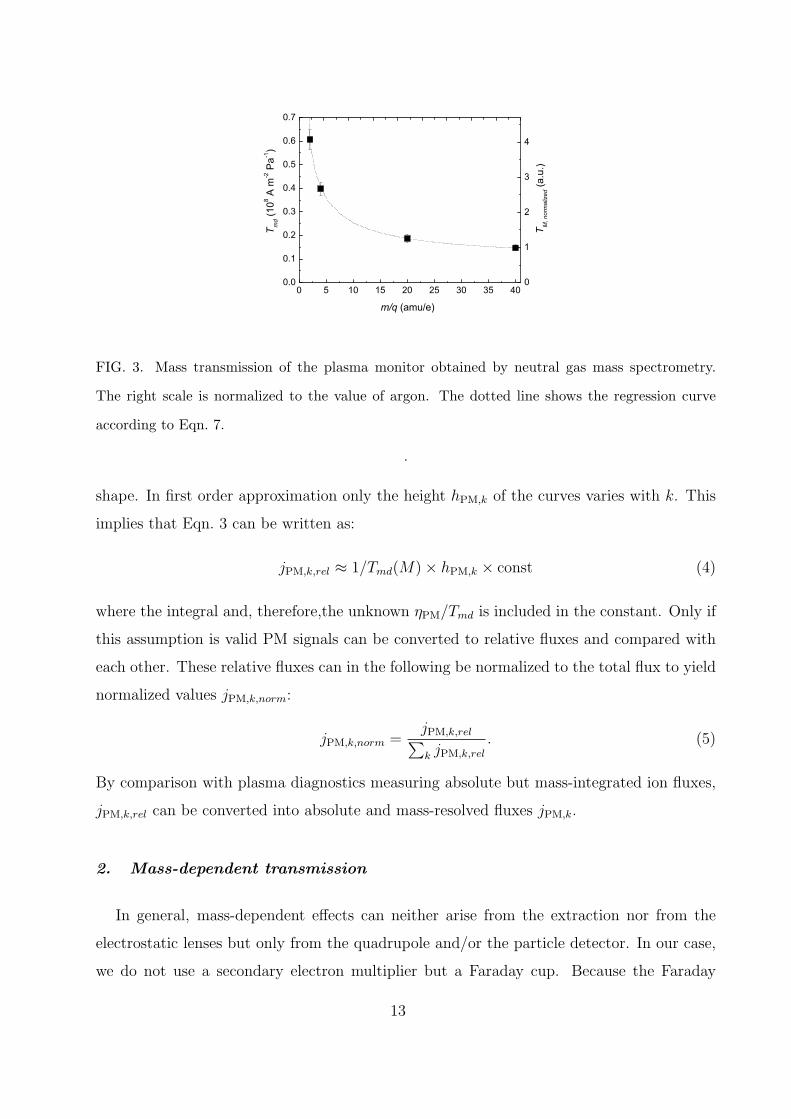
FIG. 3. Mass transmission of the plasma monitor obtained by neutral gas mass spectrometry.
The right scale is normalized to the value of argon. The dotted line shows the regression curve
according to Eqn. 7.
.
shape. In first order approximation only the height hPM,k of the curves varies with k. This
implies that Eqn. 3 can be written as:
jPM,k,rel ≈ 1/Tmd(M)× hPM,k × const (4)
where the integral and, therefore,the unknown ηPM/Tmd is included in the constant. Only if
this assumption is valid PM signals can be converted to relative fluxes and compared with
each other. These relative fluxes can in the following be normalized to the total flux to yield
normalized values jPM,k,norm:
jPM,k,norm =jPM,k,rel∑k jPM,k,rel
. (5)
By comparison with plasma diagnostics measuring absolute but mass-integrated ion fluxes,
jPM,k,rel can be converted into absolute and mass-resolved fluxes jPM,k.
2. Mass-dependent transmission
In general, mass-dependent effects can neither arise from the extraction nor from the
electrostatic lenses but only from the quadrupole and/or the particle detector. In our case,
we do not use a secondary electron multiplier but a Faraday cup. Because the Faraday
13
detector delivers mass-independent data the quadrupole remains here the only element that
can show mass-dependent detection efficiency. The mass-dependent transmission was de-
termined by neutral-gas mass spectrometry. This is valid as long as the kinetic energy of
ions in the quadrupole is the same for the ions originating from the plasma or from the
electron-impact ionizer in front of the PM’s energy analyzer used for neutral gas analysis.
Under this restriction the transmission measured with neutral-gas mass spectrometry can
be transferred to plasma ions40. For measuring the mass-dependent transmission the plasma
chamber is filled with a pure gas of species k with mass Mk at a pressure pk without igniting
a discharge. pk is measured with an absolute pressure gauge. Because a beam is formed
behind the extraction orifice the density in the ionizer of the PM is defined by molecular
flow conditions and is therefore proportional to the pressure in the plasma vessel27. Dividing
the signal SPM(Mk) measured for this species by its neutral pressure pk in the vessel and
the partial cross section for electron-impact ionization σgas(eVe) at the used electron energy
eVe = 70 eV (σgas is taken from Ref.41,42) one obtains a signal that depends on the ion
mass only43. For species were several isotopes are present the natural abundance αk of the
detected ion needs to be additionally taken into account. Tmd(Mk) then reads:
Tmd(Mk) =SPM(Mk)
αk × pk × σk
(6)
Figure 3 shows the experimental results for the mass-dependent transmission as a function
ofMk for hydrogen, helium, neon and argon. For hydrogen only the H+2 ion which is produced
by direct ionization is considered. H+ is not taken into account because it is produced by
dissociative ionization and will have excess kinetic energy that leads in general to a different
transmission44. In addition, the right-hand scale shows the mass-dependent transmission
TM,normalized normalized to argon. One can see that TM,normalized for H+2 is four times larger
than for Ar+ ions. In other words, neglecting this effect one would underestimate Ar by a
factor of 4 when comparing directly signal intensities. The measured results are fitted to a
regression curve T fitmd(Mk):
T fitmd(Mk) =
1√−0.60242 + 1.74803×Mk − 0.01451×M2
k
(7)
with a relative uncertainty ∆T/T of 10 % obtained from the regression curve. The regression
curve is also shown in Fig. 3.
14
ion H2 (10−19 m2) Ar (10−19 m2)
H+ 9.0 7.9
H+2 6.6 7.9
H+3 7.8 8.8
Ar+ 4.3 9.7
ArH+ 7.2 10.6
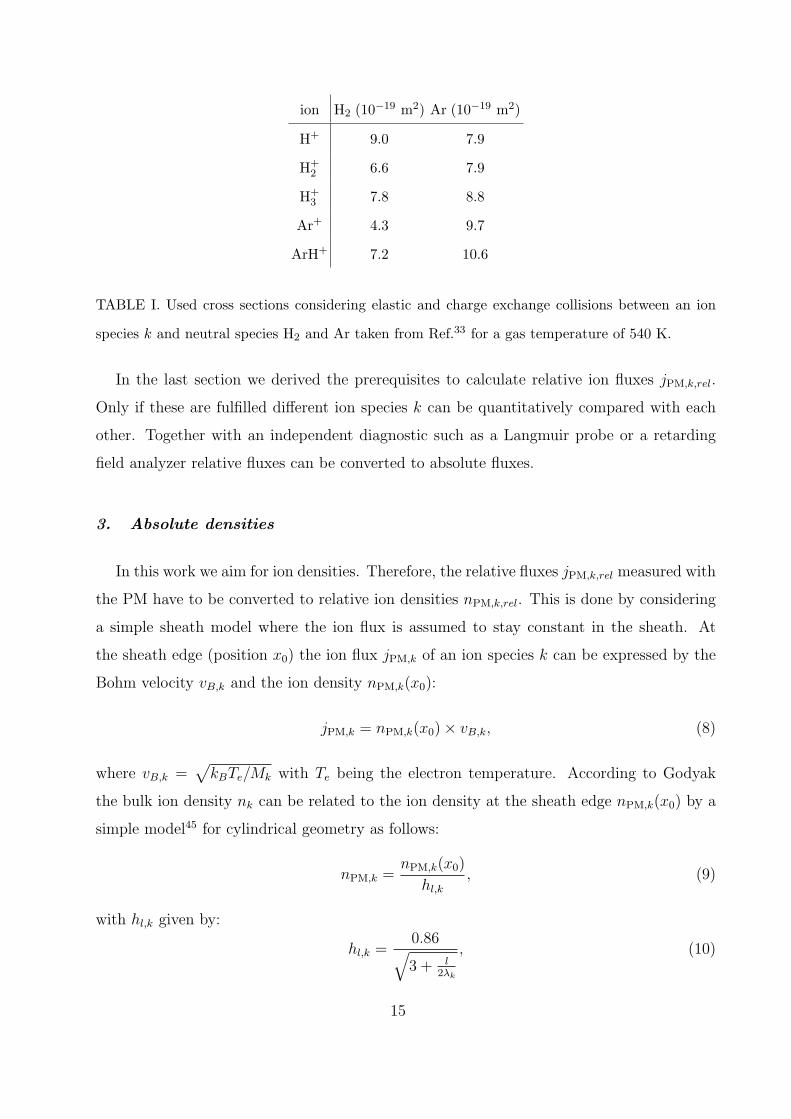
TABLE I. Used cross sections considering elastic and charge exchange collisions between an ion
species k and neutral species H2 and Ar taken from Ref.33 for a gas temperature of 540 K.
In the last section we derived the prerequisites to calculate relative ion fluxes jPM,k,rel.
Only if these are fulfilled different ion species k can be quantitatively compared with each
other. Together with an independent diagnostic such as a Langmuir probe or a retarding
field analyzer relative fluxes can be converted to absolute fluxes.
3. Absolute densities
In this work we aim for ion densities. Therefore, the relative fluxes jPM,k,rel measured with
the PM have to be converted to relative ion densities nPM,k,rel. This is done by considering
a simple sheath model where the ion flux is assumed to stay constant in the sheath. At
the sheath edge (position x0) the ion flux jPM,k of an ion species k can be expressed by the
Bohm velocity vB,k and the ion density nPM,k(x0):
jPM,k = nPM,k(x0)× vB,k, (8)
where vB,k =√
kBTe/Mk with Te being the electron temperature. According to Godyak
the bulk ion density nk can be related to the ion density at the sheath edge nPM,k(x0) by a
simple model45 for cylindrical geometry as follows:
nPM,k =nPM,k(x0)
hl,k
, (9)
with hl,k given by:
hl,k =0.86√3 + l
2λk
, (10)
15
where l is the distance between the two electrodes and λk the mean free path defined by:
1
λk
=∑j
njσk,j. (11)
σk,j denotes the total cross section considering elastic and charge exchange collisions between
an ion species k and neutral species j. σk,j is taken from Ref.33 for a gas temperature of
540 K (see OES results). Values for σk,j are listed in Tab. I.
Inserting Eqns. 8 and 10 into Eqn. 9, yields for the individual ion density nPM,k in the
bulk which is proportional to relative densities nPM,k,rel:
nPM,k ∝ nPM,k,rel =√
Mk/hl,k × jPM,k,rel. (12)
Next, nPM,k,rel of all individual species k have to be summed up to yield the mass-integrated
relative ion density nPM,rel:
nPM,rel =∑k
nPM,k,rel. (13)
The final step to determine absolutely quantified ion densities nPM,abs is to normalize the
result of Eqn. 13 with the Langmuir probe measurements. Quasi neutrality yields ne =∑k nk and therefore the bulk electron density ne can be used to determine the calibration
constant Ccalib:
nPM,abs = Ccalib × nPM,rel ≡ ne. (14)
It has to be kept in mind that this evaluation of PM intensities is valid only if Ted and Tmd
are known (see Eqn. 3) and all other dependencies are constant for the investigated parameter
range. If, e.g., Ted is not known and the different ion species have different ion energy
distributions no quantitative ion densities can be derived from the PM intensities. However,
in cases where the ion energy distributions for the different ion species are comparable in
position and shape in first order approximation normalized densities can be derived from
the relative densities because the detection efficiency cancels out in the normalization step.
The normalized densities are given by:
nPM,k,norm =nPM,k,rel
nPM,rel
. (15)
4. Linearity and reproducibility of the plasma monitor
Due to the before-mentioned saturation effects of the PM signal at higher plasma den-
sities, the linearity of the plasma monitor was tested in a separate set of experiments. A
16
Neon discharge was used because it has two isotopes with masses 20 and 22 amu with a
ratio of the natural abundance 22Ne/20Ne of 0.102. This allows to test the linearity within
one order of magnitude for one experiment. To extend this range pressure and rf power were
adjusted to vary the signal intensity of Ne ions, SPM,Ne, by two orders of magnitude which
is the considered intensity range for the final H2-Ar measurements. The ratio SPM,22/SPM,20
for 22Ne+ and 20Ne+ was determined for these plasma conditions where SPM denotes the
signal integrated over the discriminator voltage. The measured mean value - averaged over
the whole investigated parameter range - of the ratio is < SPM,22Ne/SPM,20Ne >= 0.096
with a standard deviation of 0.004. Taking Tmd into account yields a value for this ratio of
0.101. We, therefore, conclude that the uncertainty of the intensity is better than 4 % in
the considered range.
The reproducibility of the plasma monitor was checked by repeating the whole set for
the H2-Ar measurements with the same experimental settings on two consecutive days. The
standard deviation of the relative changes of the individual plasma monitor signal heights
determined from this comparison was 8 %.
B. Langmuir probe
The electron energy distribution function (EEDF), the electron temperature Te and the
electron density ne were determined with a Langmuir probe system. Several methods are
used to derive Te and ne from a measured current voltage characteristic (I/V -characteristic).
The methods are taken from Lieberman and Lichtenberg19. Here the electron density is used
as plasma density which is identical to the density of the positive charge carriers in the bulk
plasma due to quasi neutrality. Typically I/V -characteristics were measured between -30 V
and +40 V with an increment of 0.5 V.
The second derivative of the measured current I is proportional to the electron energy
probability function (EEPF) gp(E):
gp(E) =
√8mee
Ape2× ∂2I/∂E2, (16)
with me being the electron mass and Ap the probe surface. The electron energy E is
determined by E = eVpl−eV . The plasma potential Vpl is defined by: ∂2I/∂E2|Vpl= 0. The
differentiation of the curve is combined with a smoothing technique as described in Ref.31.
17
The curves are smoothed within a smoothing interval chosen to be 2 V in this work. The
electron energy distribution function (EEDF) ge is obtained by multiplying the EEPF with
the square root of the electron energy.
The first method for the determination of the electron temperature, Te,slope, is to use the
reciprocal slope of the EEPF in the electron retardation regime. For this evaluation the low
energy region is considered here (see also Fig. 6). The high energy region beyond the first
kink could not be used due to increasing noise with increasing energy.
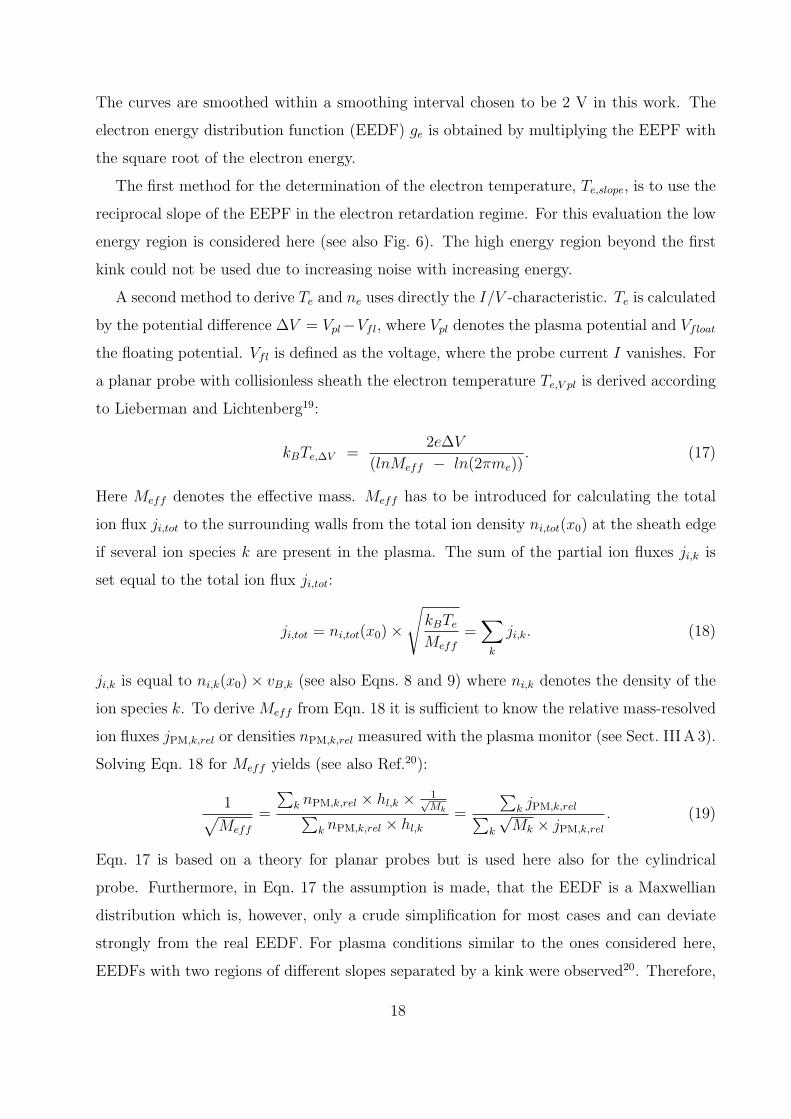
A second method to derive Te and ne uses directly the I/V -characteristic. Te is calculated
by the potential difference ∆V = Vpl−Vfl, where Vpl denotes the plasma potential and Vfloat
the floating potential. Vfl is defined as the voltage, where the probe current I vanishes. For
a planar probe with collisionless sheath the electron temperature Te,V pl is derived according
to Lieberman and Lichtenberg19:
kBTe,∆V =2e∆V
(lnMeff − ln(2πme)). (17)
Here Meff denotes the effective mass. Meff has to be introduced for calculating the total
ion flux ji,tot to the surrounding walls from the total ion density ni,tot(x0) at the sheath edge
if several ion species k are present in the plasma. The sum of the partial ion fluxes ji,k is
set equal to the total ion flux ji,tot:
ji,tot = ni,tot(x0)×
√kBTe
Meff
=∑k
ji,k. (18)
ji,k is equal to ni,k(x0)× vB,k (see also Eqns. 8 and 9) where ni,k denotes the density of the
ion species k. To derive Meff from Eqn. 18 it is sufficient to know the relative mass-resolved
ion fluxes jPM,k,rel or densities nPM,k,rel measured with the plasma monitor (see Sect. III A 3).
Solving Eqn. 18 for Meff yields (see also Ref.20):
1√Meff
=
∑k nPM,k,rel × hl,k × 1√
Mk∑k nPM,k,rel × hl,k
=
∑k jPM,k,rel∑
k
√Mk × jPM,k,rel
. (19)
Eqn. 17 is based on a theory for planar probes but is used here also for the cylindrical
probe. Furthermore, in Eqn. 17 the assumption is made, that the EEDF is a Maxwellian
distribution which is, however, only a crude simplification for most cases and can deviate
strongly from the real EEDF. For plasma conditions similar to the ones considered here,
EEDFs with two regions of different slopes separated by a kink were observed20. Therefore,
18
this value for Te,∆V has to be used with care as will be discussed later.
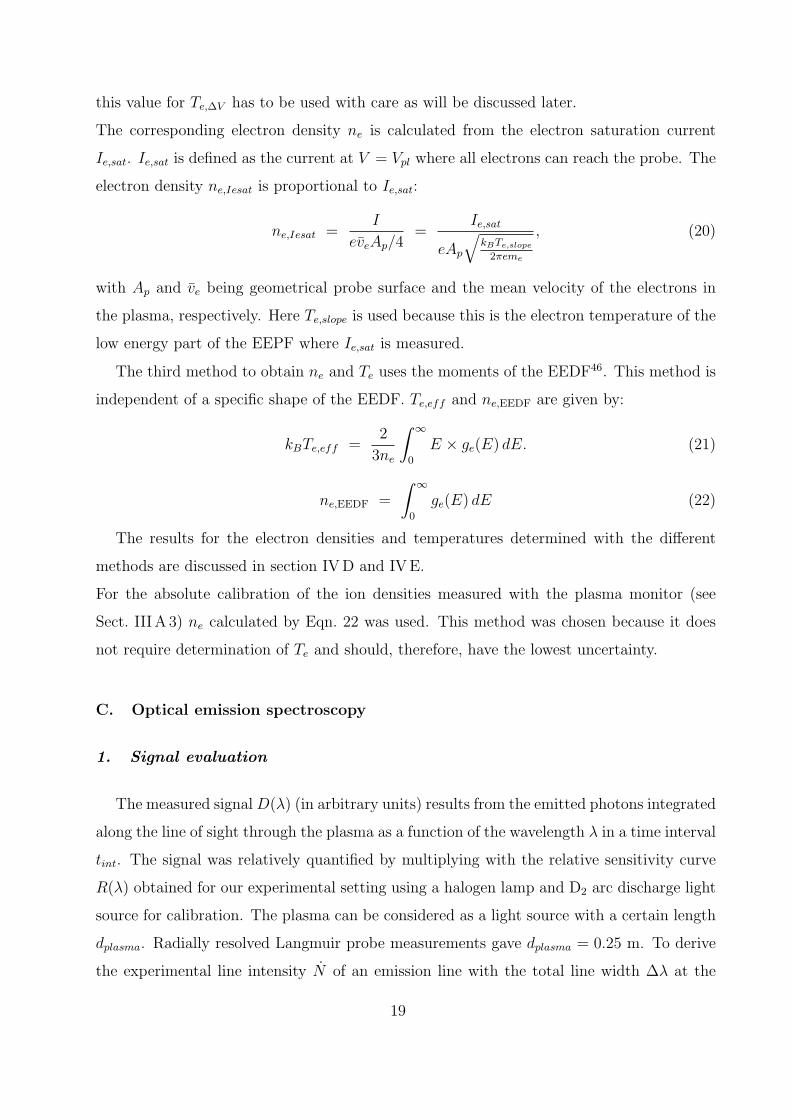
The corresponding electron density ne is calculated from the electron saturation current
Ie,sat. Ie,sat is defined as the current at V = Vpl where all electrons can reach the probe. The
electron density ne,Iesat is proportional to Ie,sat:
ne,Iesat =I
eveAp/4=
Ie,sat
eAp
√kBTe,slope
2πeme
, (20)
with Ap and ve being geometrical probe surface and the mean velocity of the electrons in
the plasma, respectively. Here Te,slope is used because this is the electron temperature of the
low energy part of the EEPF where Ie,sat is measured.
The third method to obtain ne and Te uses the moments of the EEDF46. This method is
independent of a specific shape of the EEDF. Te,eff and ne,EEDF are given by:
kBTe,eff =2
3ne
∫ ∞
0
E × ge(E) dE. (21)
ne,EEDF =
∫ ∞
0
ge(E) dE (22)
The results for the electron densities and temperatures determined with the different
methods are discussed in section IVD and IVE.
For the absolute calibration of the ion densities measured with the plasma monitor (see
Sect. III A 3) ne calculated by Eqn. 22 was used. This method was chosen because it does
not require determination of Te and should, therefore, have the lowest uncertainty.
C. Optical emission spectroscopy
1. Signal evaluation
The measured signalD(λ) (in arbitrary units) results from the emitted photons integrated
along the line of sight through the plasma as a function of the wavelength λ in a time interval
tint. The signal was relatively quantified by multiplying with the relative sensitivity curve
R(λ) obtained for our experimental setting using a halogen lamp and D2 arc discharge light
source for calibration. The plasma can be considered as a light source with a certain length
dplasma. Radially resolved Langmuir probe measurements gave dplasma = 0.25 m. To derive
the experimental line intensity N of an emission line with the total line width ∆λ at the
19
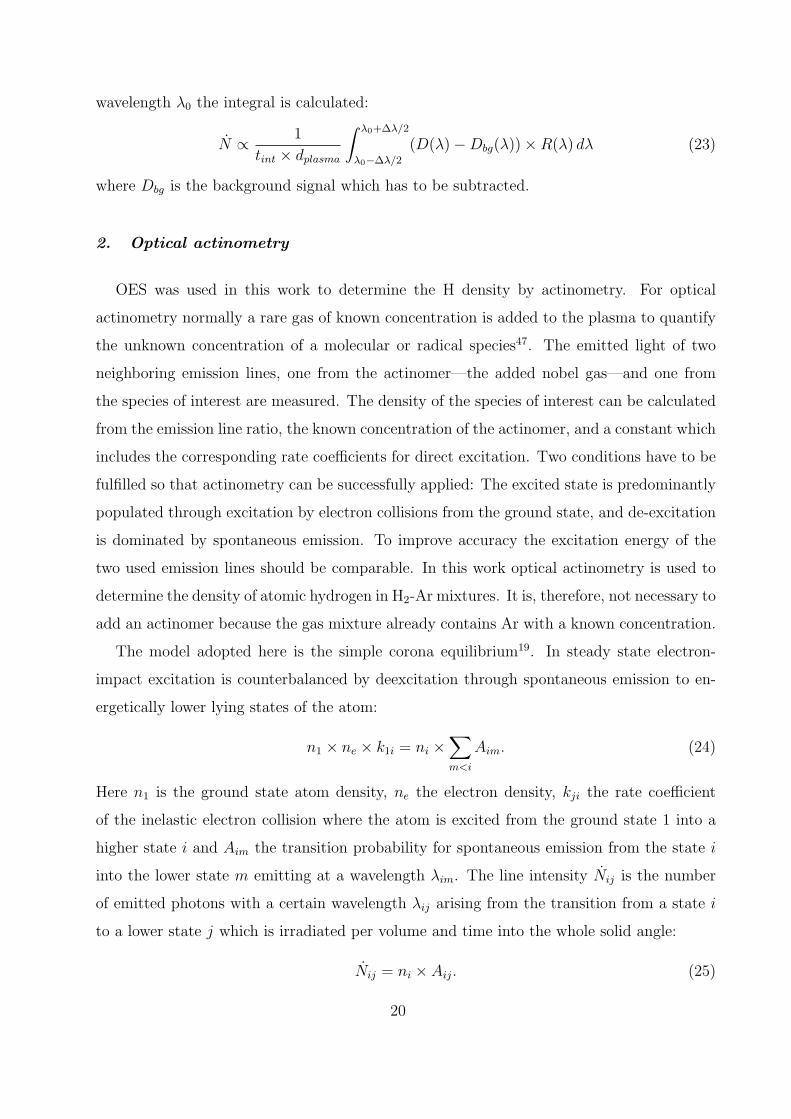
wavelength λ0 the integral is calculated:
N ∝ 1
tint × dplasma
∫ λ0+∆λ/2
λ0−∆λ/2
(D(λ)−Dbg(λ))×R(λ) dλ (23)
where Dbg is the background signal which has to be subtracted.
2. Optical actinometry
OES was used in this work to determine the H density by actinometry. For optical
actinometry normally a rare gas of known concentration is added to the plasma to quantify
the unknown concentration of a molecular or radical species47. The emitted light of two
neighboring emission lines, one from the actinomer—the added nobel gas—and one from
the species of interest are measured. The density of the species of interest can be calculated
from the emission line ratio, the known concentration of the actinomer, and a constant which
includes the corresponding rate coefficients for direct excitation. Two conditions have to be
fulfilled so that actinometry can be successfully applied: The excited state is predominantly
populated through excitation by electron collisions from the ground state, and de-excitation
is dominated by spontaneous emission. To improve accuracy the excitation energy of the
two used emission lines should be comparable. In this work optical actinometry is used to
determine the density of atomic hydrogen in H2-Ar mixtures. It is, therefore, not necessary to
add an actinomer because the gas mixture already contains Ar with a known concentration.
The model adopted here is the simple corona equilibrium19. In steady state electron-
impact excitation is counterbalanced by deexcitation through spontaneous emission to en-
ergetically lower lying states of the atom:
n1 × ne × k1i = ni ×∑m<i
Aim. (24)
Here n1 is the ground state atom density, ne the electron density, kji the rate coefficient
of the inelastic electron collision where the atom is excited from the ground state 1 into a
higher state i and Aim the transition probability for spontaneous emission from the state i
into the lower state m emitting at a wavelength λim. The line intensity Nij is the number
of emitted photons with a certain wavelength λij arising from the transition from a state i
to a lower state j which is irradiated per volume and time into the whole solid angle:
Nij = ni × Aij. (25)
20
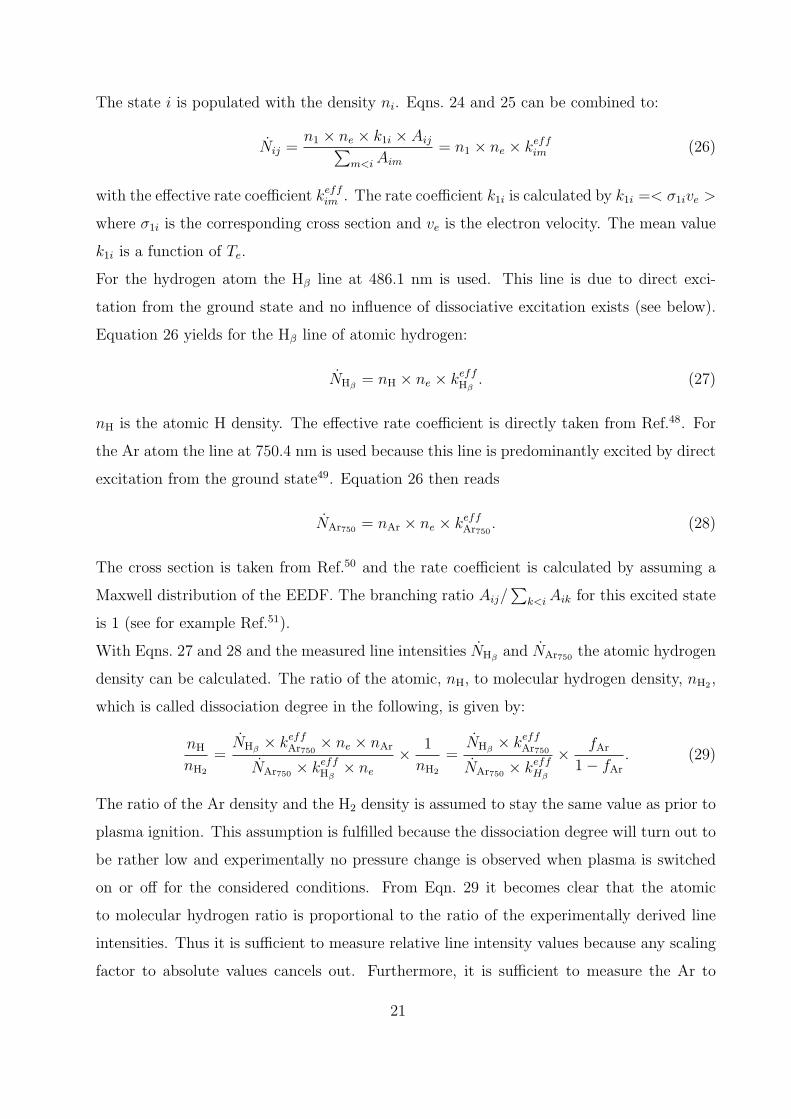
The state i is populated with the density ni. Eqns. 24 and 25 can be combined to:
Nij =n1 × ne × k1i × Aij∑
m<i Aim
= n1 × ne × keffim (26)
with the effective rate coefficient keffim . The rate coefficient k1i is calculated by k1i =< σ1ive >
where σ1i is the corresponding cross section and ve is the electron velocity. The mean value
k1i is a function of Te.
For the hydrogen atom the Hβ line at 486.1 nm is used. This line is due to direct exci-
tation from the ground state and no influence of dissociative excitation exists (see below).
Equation 26 yields for the Hβ line of atomic hydrogen:
NHβ= nH × ne × keff
Hβ. (27)
nH is the atomic H density. The effective rate coefficient is directly taken from Ref.48. For
the Ar atom the line at 750.4 nm is used because this line is predominantly excited by direct
excitation from the ground state49. Equation 26 then reads
NAr750 = nAr × ne × keffAr750
. (28)
The cross section is taken from Ref.50 and the rate coefficient is calculated by assuming a
Maxwell distribution of the EEDF. The branching ratio Aij/∑
k<i Aik for this excited state
is 1 (see for example Ref.51).
With Eqns. 27 and 28 and the measured line intensities NHβand NAr750 the atomic hydrogen
density can be calculated. The ratio of the atomic, nH, to molecular hydrogen density, nH2 ,
which is called dissociation degree in the following, is given by:
nH
nH2
=NHβ
× keffAr750
× ne × nAr
NAr750 × keffHβ
× ne
× 1
nH2
=NHβ
× keffAr750
NAr750 × keffHβ
× fAr
1− fAr
. (29)
The ratio of the Ar density and the H2 density is assumed to stay the same value as prior to
plasma ignition. This assumption is fulfilled because the dissociation degree will turn out to
be rather low and experimentally no pressure change is observed when plasma is switched
on or off for the considered conditions. From Eqn. 29 it becomes clear that the atomic
to molecular hydrogen ratio is proportional to the ratio of the experimentally derived line
intensities. Thus it is sufficient to measure relative line intensity values because any scaling
factor to absolute values cancels out. Furthermore, it is sufficient to measure the Ar to
21
H2 pressure ratio, but not the absolute densities which would require determining the gas
temperature. This, in turn, would add an additional uncertainty. In summary the nH/nH2
ratio can be determined from relative values which results in a much lower uncertainty than
measuring absolute values.
The rate coefficients show a strong dependence on the electron temperature, but the ratio
of keffAr750
and keffHβ
varies only slightly with Te because the shape of the two corresponding
cross sections and the threshold energies are similar. Here the measured Te,∆V is used as
input for the rate coefficients. Another assumption which is implicitly made in Eqn. 29
is that the density profiles of atomic hydrogen and Ar are similar. However, this is not
necessarily fulfilled for reactive species such as atomic hydrogen. For the production and
loss of atomic hydrogen the dissociation of H2 by electron collisions within the plasma volume
and the loss at the chamber walls are important. In the region above the coil ne and Te
have shown flat radial profiles. So the production rate of H in the plasma volume can also
be assumed to be constant over that region. Outside the plasma volume the H density will
decrease due to wall losses and deviate from the Ar density. But because in this region
the plasma density also decreases it does not significantly contribute to the emission of the
Hβ and Ar750 lines. Therefore, we assume that this effect does not markedly influence the
measured H atom density.
To justify the application of the corona equilibrium (see Eqn. 24) a simple collisional
radiative model for the excited hydrogen atom with the principal quantum number n = 4 is
considered. Two competing processes to populate this excited state are assumed20. First,
direct excitation of the hydrogen atom from the ground state by inelastic electron collision
with the rate coefficient k1 and, second, dissociative excitation of the hydrogen molecule
by inelastic electron collision producing an excited H atom, a H atom in the ground state
and an electron with the rate coefficient k2. The corresponding rates are R1 = nenHk1
and R2 = nenH2k2. This leads to the condition that nH/nH2 ≫ k2/k1. To justify the
assumption on which equation 24 is based k1 should be much larger than k2. As it will
be shown in the results section, nH/nH2 is of the order of 2 % and Te for Ar containing
plasmas varies between 3 and 5 eV. The ratio between k2/k1 for electron temperatures of 3
and 5 eV is 0.0013 and 0.0026, respectively52. So the condition nH/nH2 ≫ k2/k1 is fulfilled
for the considered plasma. For our experimental conditions other effects such as quenching
or reabsorption can be neglected due to the low pressure.
22
The error for the dissociation degree (Eqn. 29) consists of three contributions. The first
is the signal error ∆D(λ) ≤10 % which was estimated by repeating the measurement series
once. The second is the uncertainty and the radial variation of the electron temperature
which affects the uncertainty of the ratio of the rate coefficients ∆(keffAr750
/keffHβ
)(∆Te) ≤13 %.
The last uncertainty comes from the error of the calibration curveR(λ) where ∆R(λHβ)/R(λAr750) ≤ 15 %.
A total uncertainty of 22 % was obtained by Gaussian error propagation.
3. Gas temperature
The H2 gas temperature Tg is estimated by the rotational temperature Trot of the H2
molecule. This is derived from the relative line intensity distribution of the first 5 rotational
lines Q1 − Q5 in the vibronic band v‘ = v“ = 2 (in the following denoted as V2) of the
Fulcher-α transition (d3Πu − a3Σ+g ). Some assumptions have to be made to relate the gas
temperature to the population of the d3Πu state. The upper level is assumed to be popu-
lated only by direct electron excitation from the electronic ground state X1Σ+g with v = 0
which does not change the rotational distribution. This condition is satisfied in low-pressure
discharges53,54. The rotational distribution of the ground state is assumed to be thermally
populated due to collisions with other gas particles.
Fantz55 compared the experimentally obtained rotational temperature from the here con-
sidered Fulcher-α transition with the rotational temperature from the molecular nitrogen
transition C3Πu(v‘ = 0) → B3Πg(v“ = 2) in a hydrogen-helium microwave plasma with an
addition of a small amount of nitrogen in the pressure range between 10 and 100 Pa. It has
been shown elsewhere that the rotational temperature of the N2 C3Πu state is equal to the
gas temperature56,57. The result of Fantz55 is that the temperature in the vibronic band V2
of the Fulcher-α transition matches best with the nitrogen rotational temperature. Investi-
gations of additional vibrational systems V0, V1 and V3 revealed that the V3 system yields a
comparable but slightly lower rotational temperature while the other two yield significantly
higher temperatures. The observed differences decrease with decreasing gas pressure. We,
therefore, take the rotational temperature from the Fulcher-α V2 transition as an estimate
for the gas temperature.
A short description for the determination of Trot based on Ref.53,54 is given in the following.
In general, the line intensity Np‘v‘J ‘p“v“J“ of a transition is the product of the population density
23
np‘v‘J ‘ of the upper state times the transition probability Ap‘v‘J ‘p“v“J“. Within one vibrational
transition v‘ → v“ of an electron transition from the upper state p‘ (here d 3Πu) to the lower
state p“ (here a3Σ+g ) the only variables that depend on the upper quantum number J ‘ are
the statistical weight γJ ‘ and the Honl-London factor SJ ‘, the wavelength λp‘v‘J ‘p“v“J“ and the
rotational energy EJ ‘. The line intensity is then proportional to:
Np‘v‘J ‘p“v“J“ ∝ (λp‘v‘J ‘
p“v“J“)−3 × γJ ‘SJ ‘ × exp(− EJ ‘
kBT v‘=2rot (d3 Πu)
). (30)
Here EJ ‘ is the energy referenced to the J ‘ = 1 state and taken from Ref.58. Values for EJ ‘,
SJ ‘ and γJ ‘ are summarized in Tab. II. After taking the logarithm of Eqn. 30 this yields
ln(Np‘v‘J ‘
p“v“J“(λp‘v‘J ‘p“v“J“)
3
γJ ‘SJ ‘) = − ∆EJ ‘
kBT v‘=2rot (d3 Πu)
+ const. (31)
Plotting the value of the left hand side of Eqn. 31 as a function of the rotational energy
difference ∆EJ ‘ = EJ ‘ − EJ ‘=1 in the upper excited electrical state d3Πu for the vibronic
state v‘ = 2 yields a straight line. The reciprocal of the slope of this line is the rotational
temperature of the excited state T v‘=2rot (d3 Πu). The rotational population distribution of the
ground state is related to the rotational population distribution of the excited state as:
T v=0rot (X1Σ+
g ) =Bv=0(X
1Σ+g )
Bv‘=2(d3 Πu)T v‘=2rot (d3 Πu). (32)
Here Bv=0(X1Σ+
g ) and Bv‘=2(d3Πu) denote the rotational constants of the lowest vibrational
level of the ground state and from the vibrational level v‘ = 2 of the excited state d3Πu,
respectively. In this work a Bv=0(X1Σ+
g )/Bv‘=2(d3 Πu) of 2.24 is used59.
Unfortunately, we observed additional emission lines around Q4 when Ar was added to
the H2 plasma that overlap with Q4. As in Ref.54 Q5 tends to deviate from the straight line
even for pure H2. Therefore, for the H2-Ar mixture only the first three lines Q1 to Q3 were
used for determining Trot.
IV. RESULTS AND DISCUSSION
In the following we present the results for the gas temperature, the electron temperature
and density, the effective mass, the ion densities and the dissociation degree.
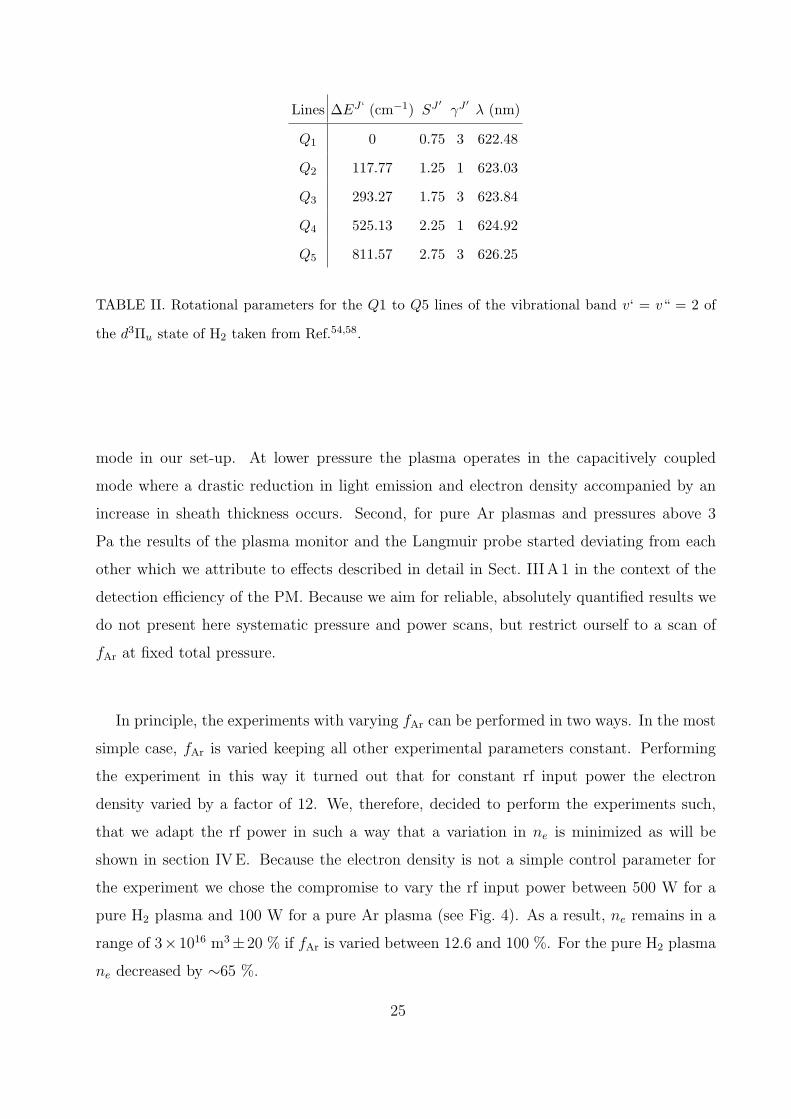
A total pressure of 1.0 Pa was chosen as working pressure because of two reasons: First it
is the minimum pressure where a pure H2 plasma operates stably in the inductively coupled
24
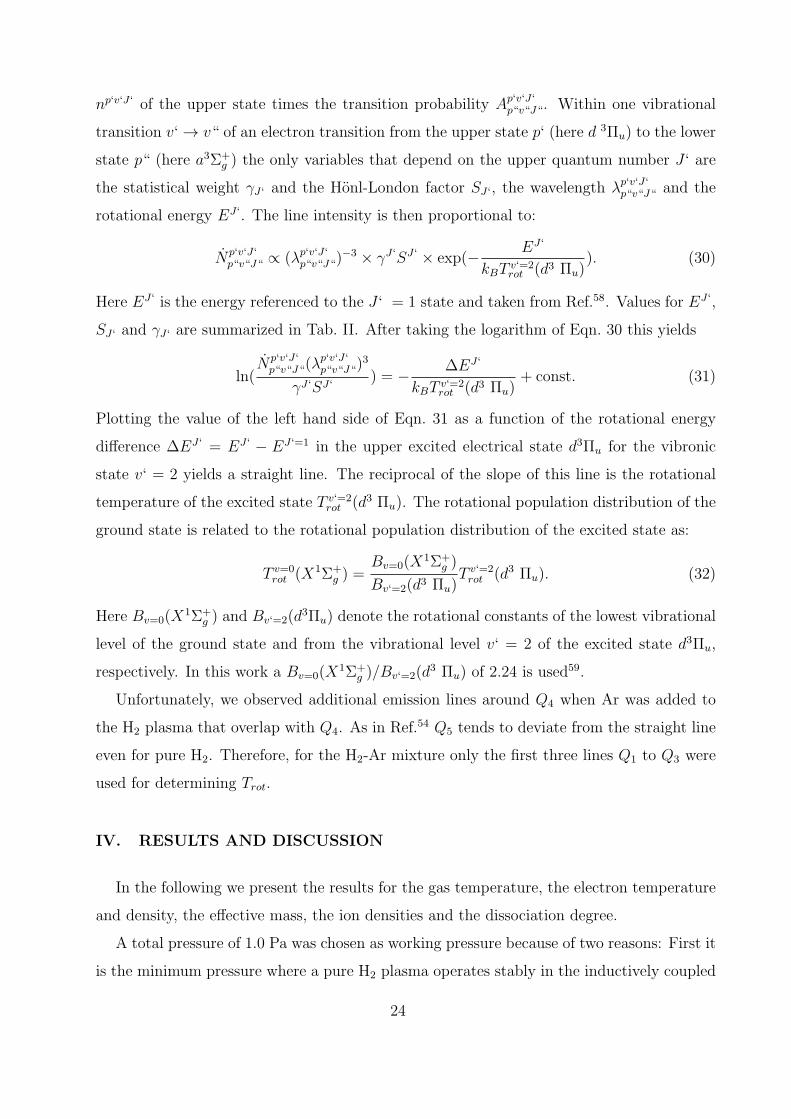
Lines ∆EJ ‘ (cm−1) SJ ′γJ
′λ (nm)
Q1 0 0.75 3 622.48
Q2 117.77 1.25 1 623.03
Q3 293.27 1.75 3 623.84
Q4 525.13 2.25 1 624.92
Q5 811.57 2.75 3 626.25
TABLE II. Rotational parameters for the Q1 to Q5 lines of the vibrational band v‘ = v“ = 2 of
the d3Πu state of H2 taken from Ref.54,58.
mode in our set-up. At lower pressure the plasma operates in the capacitively coupled
mode where a drastic reduction in light emission and electron density accompanied by an
increase in sheath thickness occurs. Second, for pure Ar plasmas and pressures above 3
Pa the results of the plasma monitor and the Langmuir probe started deviating from each
other which we attribute to effects described in detail in Sect. III A 1 in the context of the
detection efficiency of the PM. Because we aim for reliable, absolutely quantified results we
do not present here systematic pressure and power scans, but restrict ourself to a scan of
fAr at fixed total pressure.
In principle, the experiments with varying fAr can be performed in two ways. In the most
simple case, fAr is varied keeping all other experimental parameters constant. Performing
the experiment in this way it turned out that for constant rf input power the electron
density varied by a factor of 12. We, therefore, decided to perform the experiments such,
that we adapt the rf power in such a way that a variation in ne is minimized as will be
shown in section IVE. Because the electron density is not a simple control parameter for
the experiment we chose the compromise to vary the rf input power between 500 W for a
pure H2 plasma and 100 W for a pure Ar plasma (see Fig. 4). As a result, ne remains in a
range of 3×10¹⁶ m3±20 % if fAr is varied between 12.6 and 100 %. For the pure H2 plasma
ne decreased by ∼65 %.
25
0 20 40 60 80 100
400
500
600
700
0
100
200
300
400
500
600
Prf (
W)
fAr = pAr / (pAr + pH2
) (%)
T rot (K
)
Prf
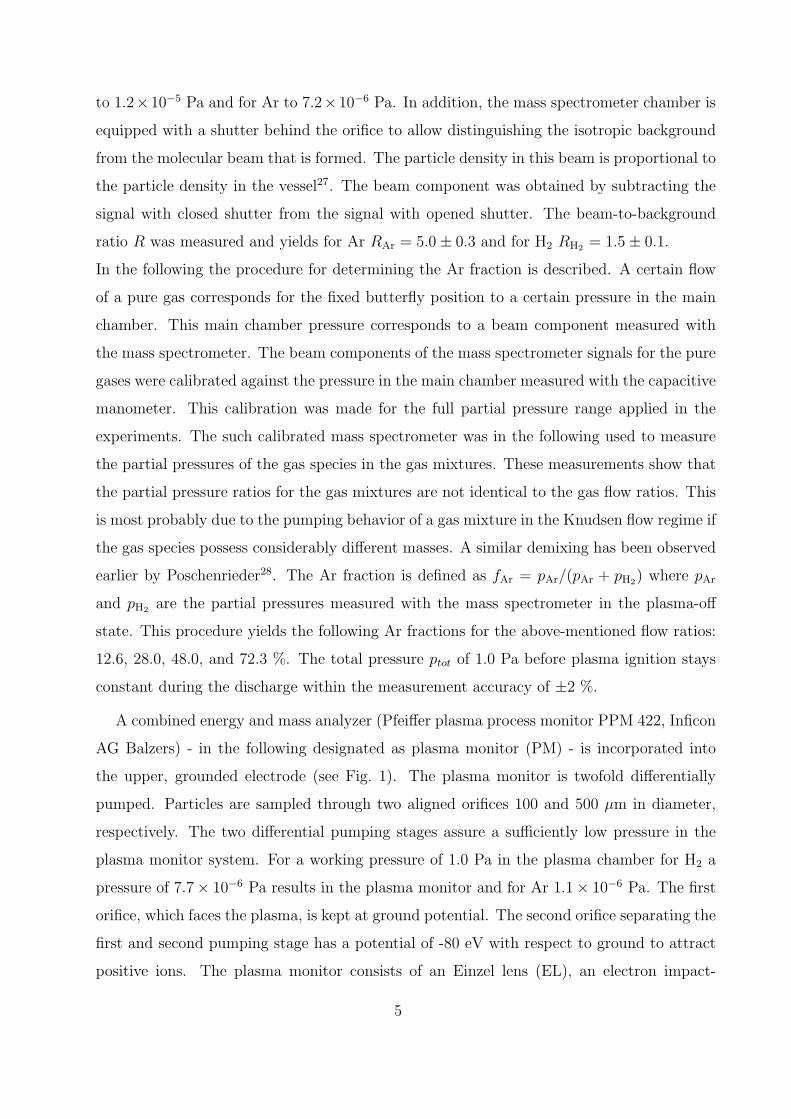
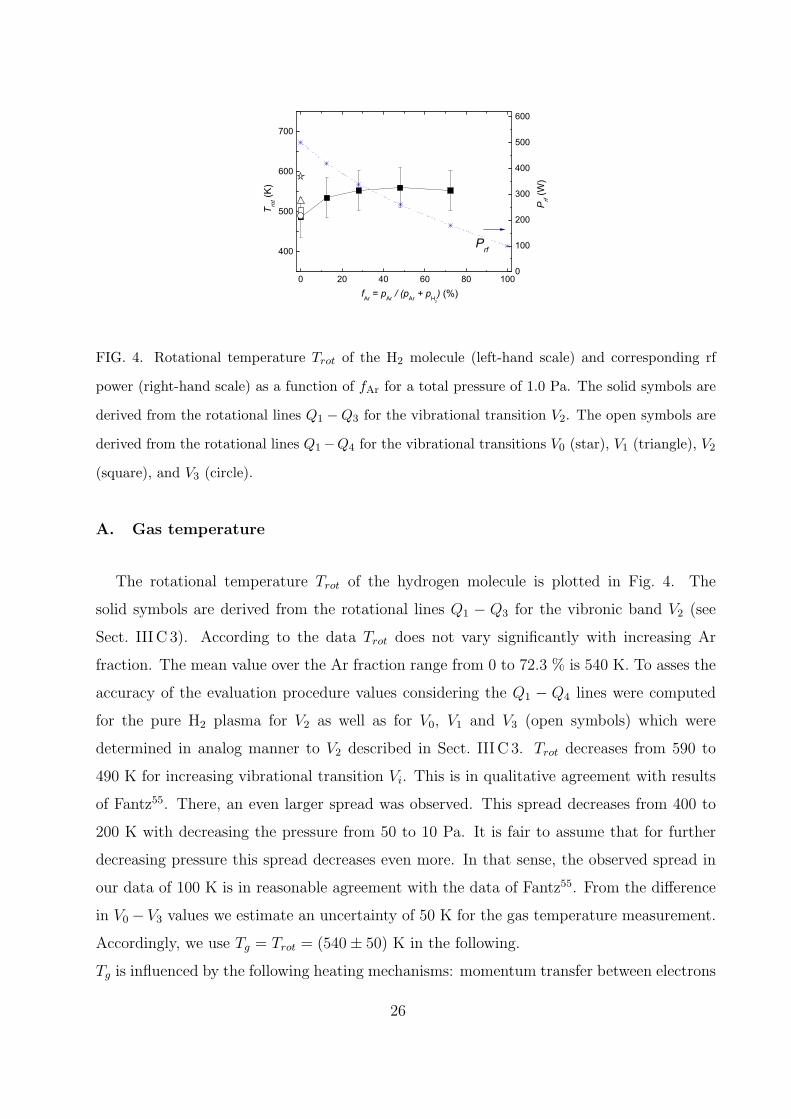
FIG. 4. Rotational temperature Trot of the H2 molecule (left-hand scale) and corresponding rf
power (right-hand scale) as a function of fAr for a total pressure of 1.0 Pa. The solid symbols are
derived from the rotational lines Q1 −Q3 for the vibrational transition V2. The open symbols are
derived from the rotational lines Q1−Q4 for the vibrational transitions V0 (star), V1 (triangle), V2
(square), and V3 (circle).
A. Gas temperature
The rotational temperature Trot of the hydrogen molecule is plotted in Fig. 4. The
solid symbols are derived from the rotational lines Q1 − Q3 for the vibronic band V2 (see
Sect. III C 3). According to the data Trot does not vary significantly with increasing Ar
fraction. The mean value over the Ar fraction range from 0 to 72.3 % is 540 K. To asses the
accuracy of the evaluation procedure values considering the Q1 − Q4 lines were computed
for the pure H2 plasma for V2 as well as for V0, V1 and V3 (open symbols) which were
determined in analog manner to V2 described in Sect. III C 3. Trot decreases from 590 to
490 K for increasing vibrational transition Vi. This is in qualitative agreement with results
of Fantz55. There, an even larger spread was observed. This spread decreases from 400 to
200 K with decreasing the pressure from 50 to 10 Pa. It is fair to assume that for further
decreasing pressure this spread decreases even more. In that sense, the observed spread in
our data of 100 K is in reasonable agreement with the data of Fantz55. From the difference
in V0 − V3 values we estimate an uncertainty of 50 K for the gas temperature measurement.
Accordingly, we use Tg = Trot = (540± 50) K in the following.
Tg is influenced by the following heating mechanisms: momentum transfer between electrons
26
and neutrals, ion-molecule collisions and in the case of molecular gases also by dissociation
and rotational excitation56. We estimate the dominant heating mechanism based on a simple
model56. The cross sections for the individual processes are taken from Yoon et al.60. The
evaluation shows that for our conditions and for a hydrogen plasma dissociation is the most
important heating mechanism. As will be shown in Sect. IVB the dissociation degree turned
out to be constant with varying fAr up to 72.3 %. So one would expect that Trot also stays
constant. In that sense, the observed constant Trot seems reasonable.
In inductively coupled H2-Ar mixtures no experimental results about Tg can be found in
the literature to the knowledge of the authors. Kimura and Kasugai20 and Hjartarson et
al.21 assumed for their rate equation modeling a Tg of 400 K and 500 K, respectively. In an
inductively coupled pure Ar plasma Kiehlbauch et al.61 simulated the gas temperature Tg
resulting in Tg ≈ 600 K at a pressure of 1.3 Pa and a power of 160 W. This was confirmed
by measurements of Tonnis et al.62 at slightly higher pressures. In a microwave H2 and
H2-Ar plasma at a power of 600 W Tatarova et al.63 measured Trot from the Q branch of the
Fulcher-α rotational spectrum (v‘ = v“ = 0). For the H2 plasma Trot varied between 500
and 600 K. For the H2-Ar plasma with an Ar fraction of 90 and 95 % Trot varied between 350
and 400 K. In their case Ar admixing led to a lowering of the dissociation degree. The lower
Trot in the mixture could therefore be due to a lower dissociative heating. Furthermore, in a
He-H2 plasma Trot was compared to the Doppler temperature of He63. From the agreement
of both the authors concluded that Trot is an indicator of Tg as assumed in Sect. III C 3.
In conclusion, the measured Trot seems to be reasonable in comparison with the existing
literature.
B. Dissociation degree
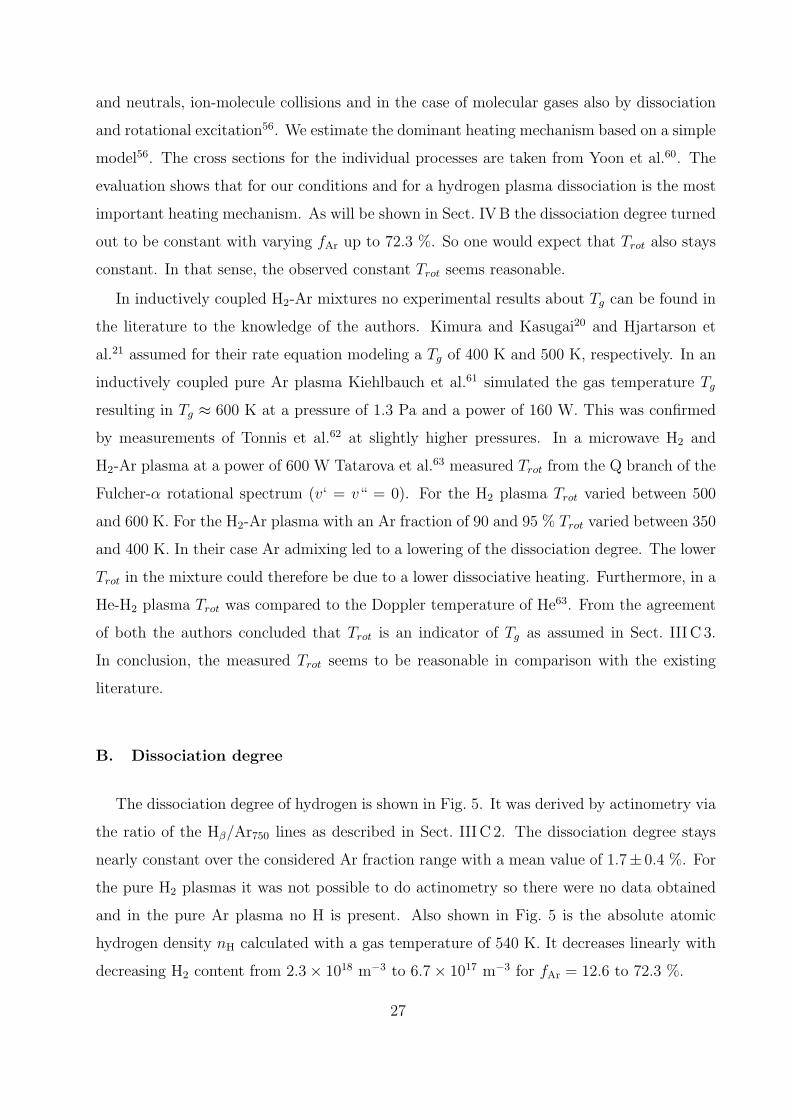
The dissociation degree of hydrogen is shown in Fig. 5. It was derived by actinometry via
the ratio of the Hβ/Ar750 lines as described in Sect. III C 2. The dissociation degree stays
nearly constant over the considered Ar fraction range with a mean value of 1.7± 0.4 %. For
the pure H2 plasmas it was not possible to do actinometry so there were no data obtained
and in the pure Ar plasma no H is present. Also shown in Fig. 5 is the absolute atomic
hydrogen density nH calculated with a gas temperature of 540 K. It decreases linearly with
decreasing H2 content from 2.3× 10¹⁸ m−3 to 6.7× 10¹⁷ m−3 for fAr = 12.6 to 72.3 %.
27
0 20 40 60 80 1000.00
0.01
0.02
0.03
0
1
2
3
fAr = pAr / (pAr + pH2
) (%)
n H (1
018 m
-3)
n H/n
H2
FIG. 5. Measured dissociation degree of hydrogen and absolute atomic density obtained with
actinometry as a function of fAr for a total pressure of 1.0 Pa.
Knowing the absolute atomic hydrogen nH density and the ion densities nk in the plasma
the atomic to ion flux ratio jH/ji can be calculated. jH is expressed by the particle flux into
a half space with a Maxwellian velocity distribution. ji is the total ion flux to the surface
(see Eqns. 8 and 9). So jH/ji,tot yields:
jHji,tot
=0.25× nH × vH∑k hl,k × nk × vB,k
. (33)
In the following this ratio is estimated for a pure H2 plasma. A dissociation degree of 1.7 % is
assumed so the atomic hydrogen density is nH = nH/nH2×p/(kBTg) = 2.0×10¹⁸ m−3. For the
determination of the atomic hydrogen velocity the temperature TH is assumed to be 3000 K
which is based on measurements of Tatarova et al.63. There the atomic hydrogen temperature
was measured in H2 microwave plasmas at 30 Pa. It was shown that TH lies between the half
of the dissociation energy (2.2 eV) and the gas temperature (600 K). The atomic hydrogen
mean velocity is estimated to 8.0×10³ ms−1. This results in an atomic hydrogen flux of
4.5× 10²¹ m−2s−1. ji,tot in the pure H2 plasma is 4.4× 10¹⁹ m−2s−1 calculated with Eqn. 18
and values taken from Sect. IVH. So the atomic to ion flux ratio yields jH/ji,tot = 102.
Manhard et al.64 measured an ion flux of 1.3×10¹⁹ m−2s−1 in an electron cyclotron resonance
deuterium plasma for 1 Pa and 144 W microwave input power. Furthermore, they estimated
the atomic deuterium flux to be in the order of 1 × 10²¹ m−2s−1 resulting in an atomic to
ion flux ratio of about 100. Their estimate is, therefore, in reasonable agreement with our
results.
28
0 5 10 15 20 25 30 35
1013
1014
1015
Ar
EEPF
(m-3 e
V-3
/2)
E (eV)
fAr
= 0 % f
Ar = 12.6 %
fAr
= 28.0 % f
Ar = 48.0 %
fAr
= 72.3 % f
Ar = 100 %H2
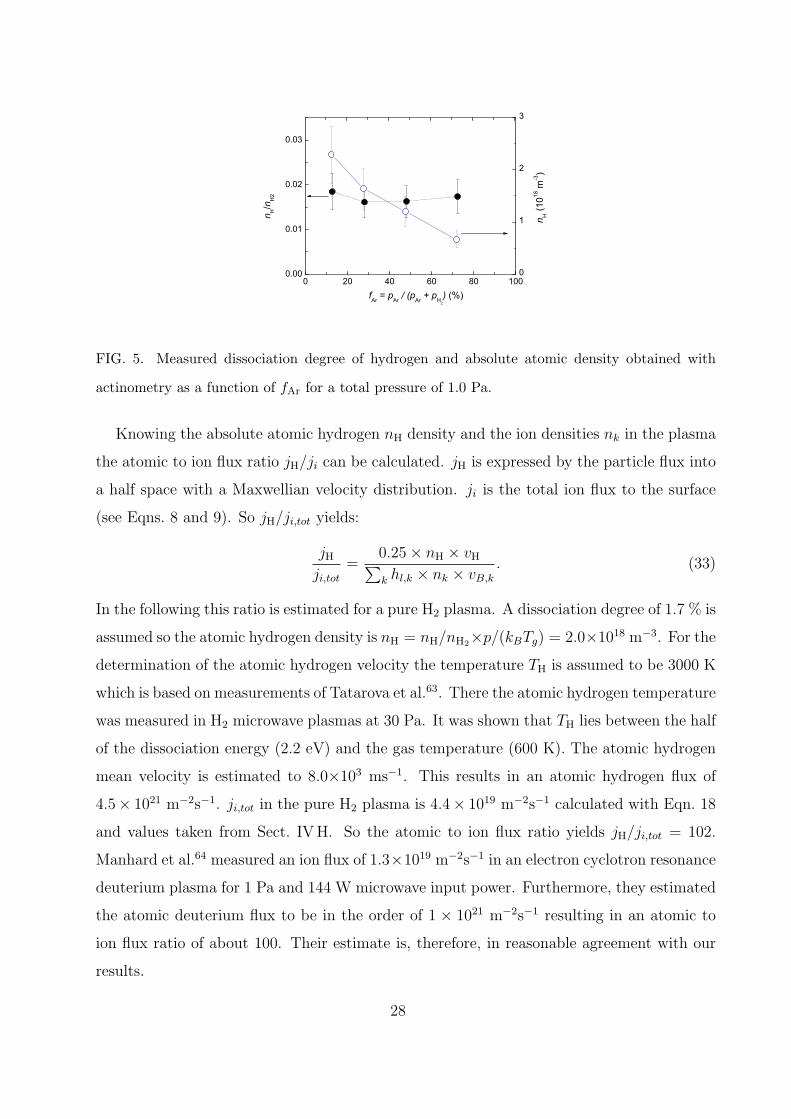
FIG. 6. Electron energy probability functions (EEPF) for various Ar fractions as determined by
Langmuir probe measurements for a total pressure of 1.0 Pa. The curves are smoothed within a
smoothing interval chosen to be 2 V.
The measured dissociation degree is considerably lower than the measurements and simu-
lations from Kimura and Kasugai20 where nH/nH2ploff was about 25 % (here nH2ploff denotes
the gas density of H2 during the plasma off state) for a pressure of 2.7 Pa, an absorbed power
of 120 W, a similar vessel geometry and an Ar fraction of 50 %. For the considered pressure
range the atomic H density depends sensitively on the surface loss probability for H loss at
the surrounding walls20,21,65,66. For the simulations Kimura and Kasugai used a surface loss
probability of 0.02. Hjartarson et al.21 also assumed a surface loss probability of 0.02 for
atomic hydrogen on stainless steel. Simulations with increasing surface loss probability from
0.02 to 1 showed a decrease of the dissociation degree by more than one order of magnitude.
A possible explanation for the different dissociation degree between the present study and
Kimura and Kasugai is that the surface loss probability in the present case is higher than
in the experiment by Kimura and Kasugai.
C. Electron energy probability function
Figure 6 shows electron energy probability functions in H2-Ar mixed plasmas with differ-
ent fAr in form of a semi-logarithmic plot for ptot=1.0 Pa. All distributions show a maximum
at around 2-3 eV. The height of this maximum increases with increasing fAr. This change
29
0 20 40 60 80 1000
2
4
6
8
10
0
10
20
30
40
fAr = pAr / (pAr + pH2
) (%)
Te,slope
Te,eff
Te, V
Te,calc
Meff
Mef
f (am
u)
T e (eV
)
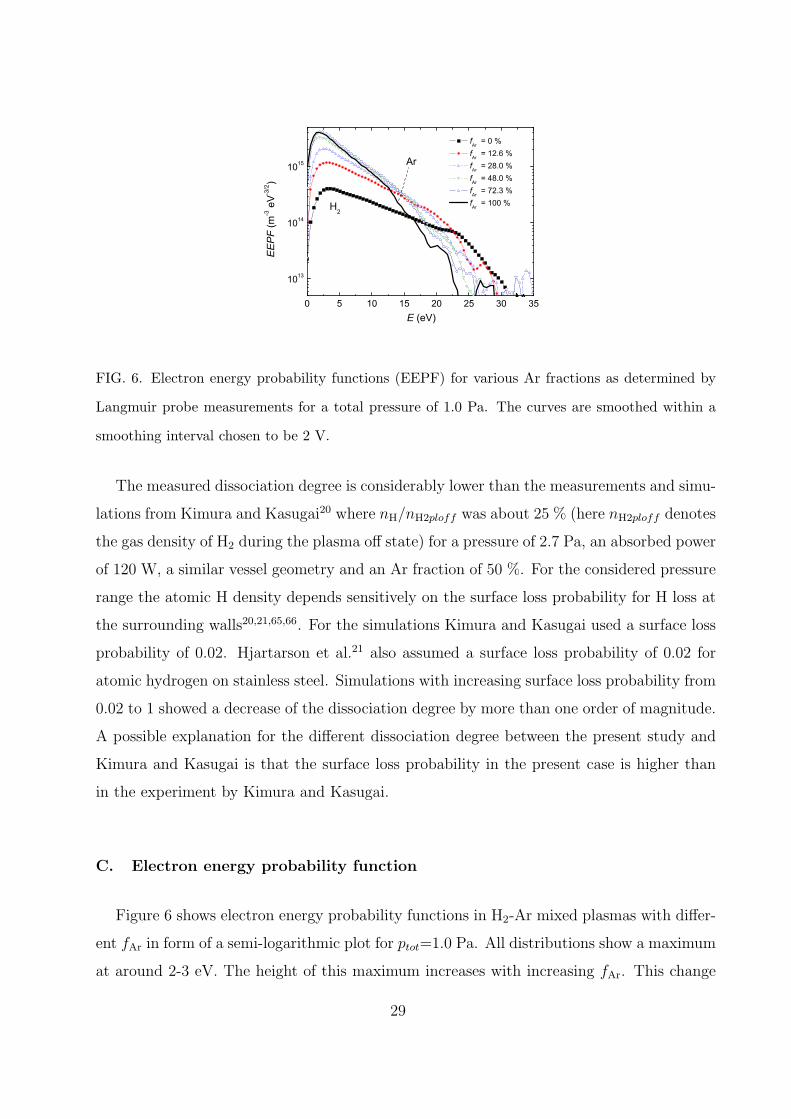
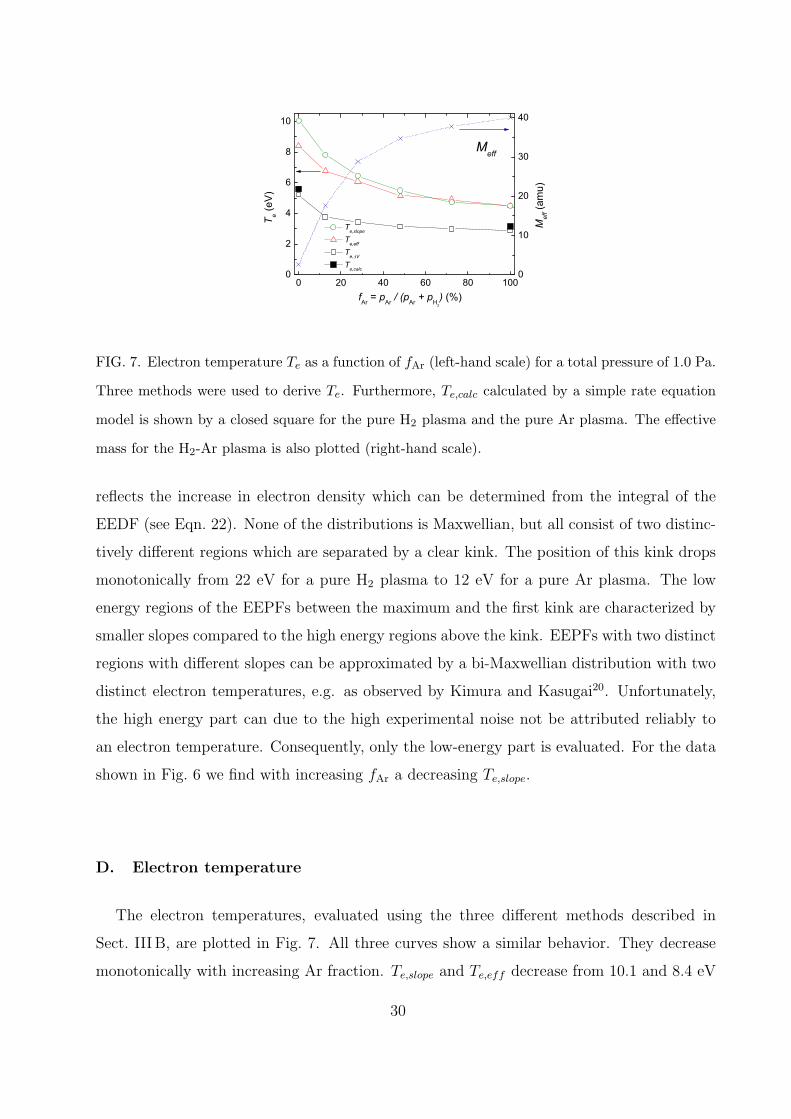
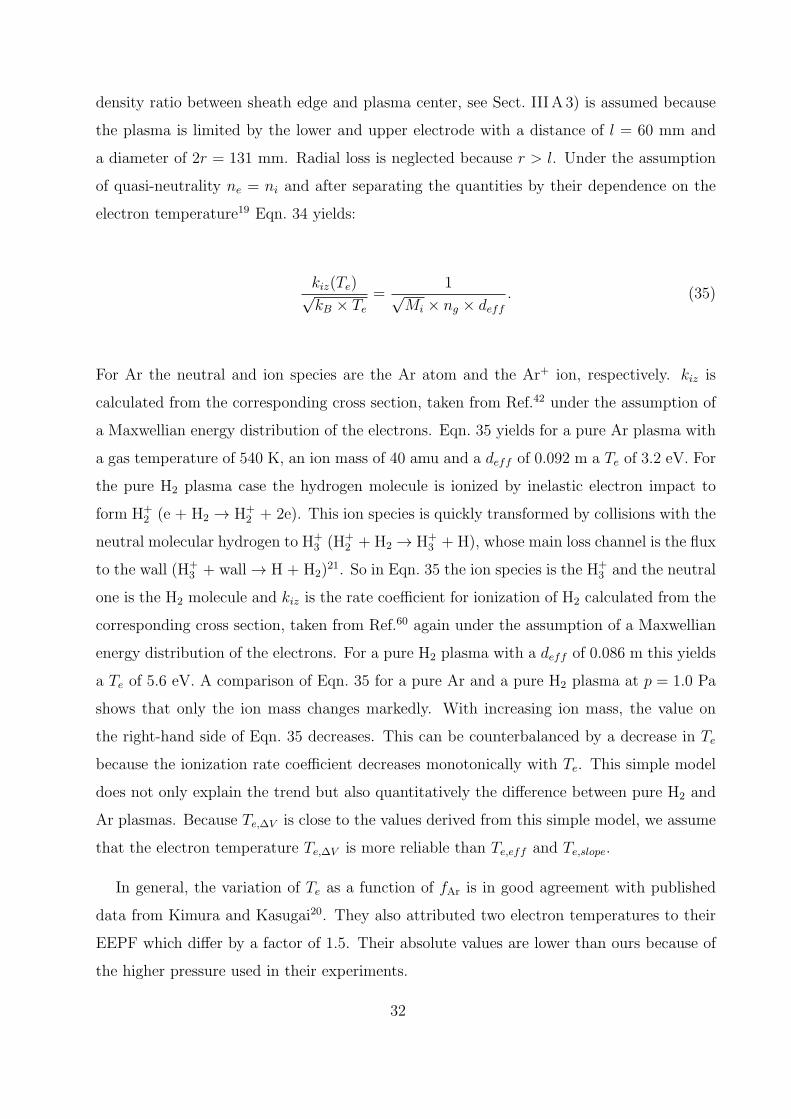
FIG. 7. Electron temperature Te as a function of fAr (left-hand scale) for a total pressure of 1.0 Pa.
Three methods were used to derive Te. Furthermore, Te,calc calculated by a simple rate equation
model is shown by a closed square for the pure H2 plasma and the pure Ar plasma. The effective
mass for the H2-Ar plasma is also plotted (right-hand scale).
reflects the increase in electron density which can be determined from the integral of the
EEDF (see Eqn. 22). None of the distributions is Maxwellian, but all consist of two distinc-
tively different regions which are separated by a clear kink. The position of this kink drops
monotonically from 22 eV for a pure H2 plasma to 12 eV for a pure Ar plasma. The low
energy regions of the EEPFs between the maximum and the first kink are characterized by
smaller slopes compared to the high energy regions above the kink. EEPFs with two distinct
regions with different slopes can be approximated by a bi-Maxwellian distribution with two
distinct electron temperatures, e.g. as observed by Kimura and Kasugai20. Unfortunately,
the high energy part can due to the high experimental noise not be attributed reliably to
an electron temperature. Consequently, only the low-energy part is evaluated. For the data
shown in Fig. 6 we find with increasing fAr a decreasing Te,slope.
D. Electron temperature
The electron temperatures, evaluated using the three different methods described in
Sect. III B, are plotted in Fig. 7. All three curves show a similar behavior. They decrease
monotonically with increasing Ar fraction. Te,slope and Te,eff decrease from 10.1 and 8.4 eV
30
for fAr =0 % to 4.5 eV for fAr =100 %. The strongest decrease occurs between 0 and 12.6 %
Ar fraction. The curve of Te,slope lies above Te,eff for low fAr. Above Ar fractions of 48 %
the two different methods yield practically identical Te values. In contrast, Te,∆V results in
significantly lower electron temperatures for all conditions. Te,∆V decreases from 5.2 eV for
0 % Ar fraction to 2.9 eV for 100 % Ar fraction.
The effective mass as derived from the PM measurements, which is necessary to determine
Te according to Eqn. 17, is also presented in Fig. 7. Meff increases with increasing Ar con-
tent. The increase is monotonic but not linear. Meff increases faster for low Ar fractions
than for high Ar fractions. Again the major increase occurs between a pure H2 plasma and
fAr = 12.6 %. The increasing effective ion mass is due to an increase in the ArH+ and Ar+
densities by a simultaneous decrease in the H+3 density for increasing fAr as will be shown
in Sect. IVH.
For a similar type of discharge Hjartarson et al.21 calculated the electron temperature for
the plasma studied by Gudmundsson17. They found a decrease from 6 eV to 3.4 eV when
changing from a pure H2 plasma to a pure Ar plasma at a pressure of 0.93 Pa. These values
are much closer to the Te,∆V values determined here than Te,slope and Te,eff .
A simple rate equation model for one ion species19 can provide additional arguments to asses
which Te value is more trustworthy. For the pure plasma case with only one dominant ion
species particle conservation is used to derive the electron temperature:
∂ni
∂t+∇× Γ = G− L, (34)
where ni is the ion density, Γ = niv describes the ion flux to the wall, v is the ion velocity,
and G and L are the rates for ion gain and loss processes in the plasma volume, respectively.
The rate for the ion gain process (ionization: e + g → g+ + 2e with e - electrons, g -
background gas in the plasma, g+ - ion species from g) is G = nengkiz (ne - electron density,
ng = p/(kBTg) - neutral gas density, p - neutral gas pressure, kB - Boltzmann constant,
Tg - neutral gas temperature, kiz - ionization rate coefficient). The rate for the ion loss
process (wall loss: g+ + wall → g) is given by the wall flux Γ = niv divided by an effective
length deff . deff is the ratio of the discharge volume to the effective area for particle loss,
which depends on the ratio of the ion density at the sheath to the ion density in the plasma
center (Eqn. 10) and is a function of the ion mean free path length of the considered ion
through the neutral gas. Here an effective loss area for the ions of 2πr2hl (r - radius, hl - ion
31
density ratio between sheath edge and plasma center, see Sect. III A 3) is assumed because
the plasma is limited by the lower and upper electrode with a distance of l = 60 mm and
a diameter of 2r = 131 mm. Radial loss is neglected because r > l. Under the assumption
of quasi-neutrality ne = ni and after separating the quantities by their dependence on the
electron temperature19 Eqn. 34 yields:
kiz(Te)√kB × Te
=1√
Mi × ng × deff. (35)
For Ar the neutral and ion species are the Ar atom and the Ar+ ion, respectively. kiz is
calculated from the corresponding cross section, taken from Ref.42 under the assumption of
a Maxwellian energy distribution of the electrons. Eqn. 35 yields for a pure Ar plasma with
a gas temperature of 540 K, an ion mass of 40 amu and a deff of 0.092 m a Te of 3.2 eV. For
the pure H2 plasma case the hydrogen molecule is ionized by inelastic electron impact to
form H+2 (e + H2 → H+
2 + 2e). This ion species is quickly transformed by collisions with the
neutral molecular hydrogen to H+3 (H+
2 + H2 → H+3 + H), whose main loss channel is the flux
to the wall (H+3 + wall → H + H2)
21. So in Eqn. 35 the ion species is the H+3 and the neutral
one is the H2 molecule and kiz is the rate coefficient for ionization of H2 calculated from the
corresponding cross section, taken from Ref.60 again under the assumption of a Maxwellian
energy distribution of the electrons. For a pure H2 plasma with a deff of 0.086 m this yields
a Te of 5.6 eV. A comparison of Eqn. 35 for a pure Ar and a pure H2 plasma at p = 1.0 Pa
shows that only the ion mass changes markedly. With increasing ion mass, the value on
the right-hand side of Eqn. 35 decreases. This can be counterbalanced by a decrease in Te
because the ionization rate coefficient decreases monotonically with Te. This simple model
does not only explain the trend but also quantitatively the difference between pure H2 and
Ar plasmas. Because Te,∆V is close to the values derived from this simple model, we assume
that the electron temperature Te,∆V is more reliable than Te,eff and Te,slope.
In general, the variation of Te as a function of fAr is in good agreement with published
data from Kimura and Kasugai20. They also attributed two electron temperatures to their
EEPF which differ by a factor of 1.5. Their absolute values are lower than ours because of
the higher pressure used in their experiments.
32
0
100
200
300
400
500
600
0 20 40 60 80 1000
1
2
3
4
5
6
fAr = pAr / (pAr + pH2
) (%)
ne,EEPF
ne,Iesat
Prf
Prf (
W)
n e (1
016m
-3)
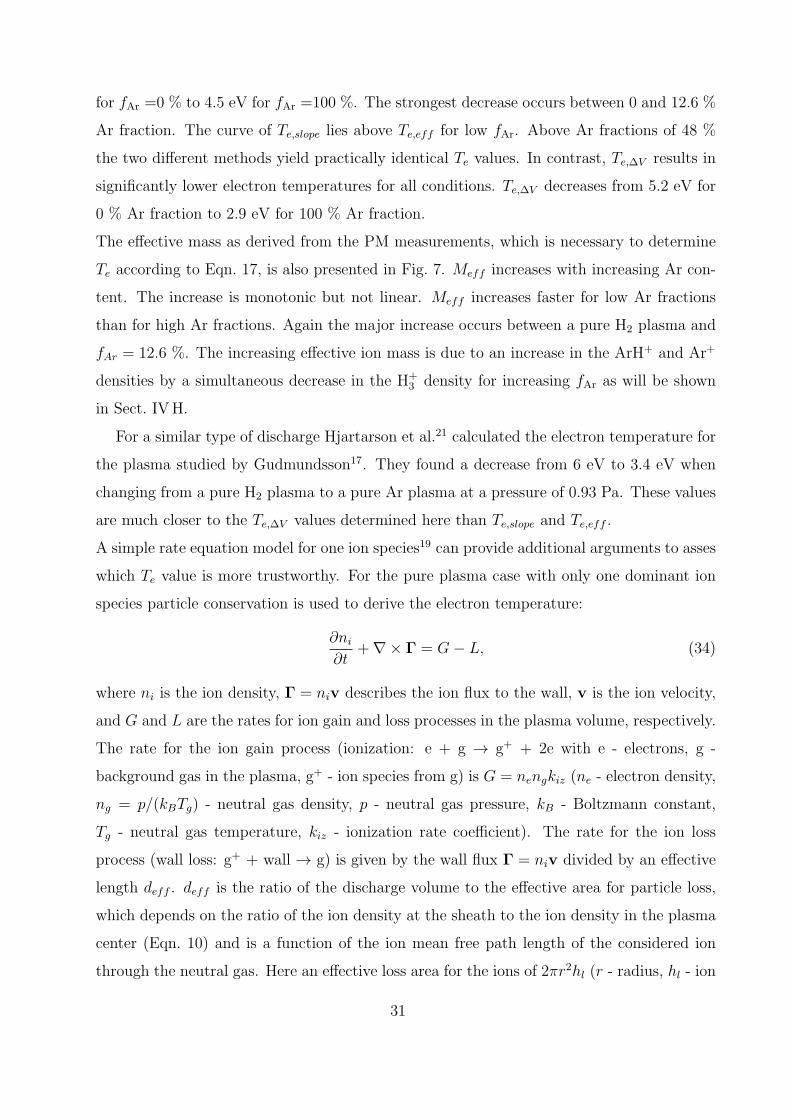
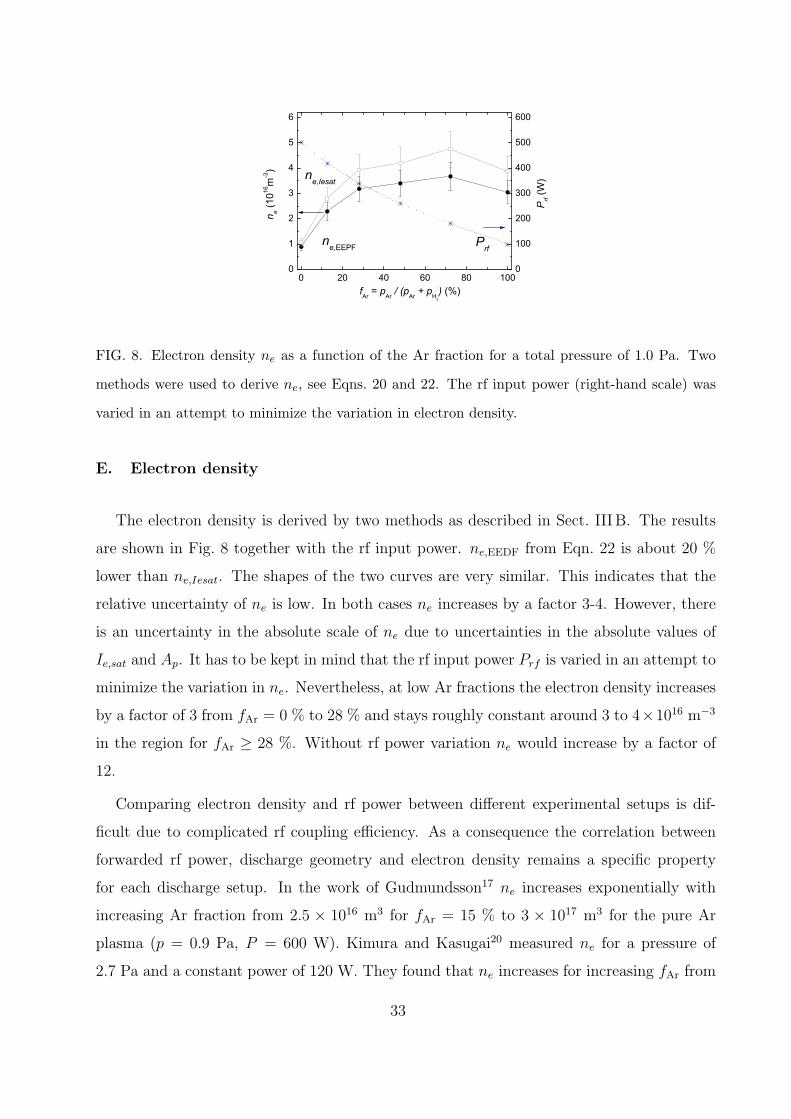
FIG. 8. Electron density ne as a function of the Ar fraction for a total pressure of 1.0 Pa. Two
methods were used to derive ne, see Eqns. 20 and 22. The rf input power (right-hand scale) was
varied in an attempt to minimize the variation in electron density.
E. Electron density
The electron density is derived by two methods as described in Sect. III B. The results
are shown in Fig. 8 together with the rf input power. ne,EEDF from Eqn. 22 is about 20 %
lower than ne,Iesat. The shapes of the two curves are very similar. This indicates that the
relative uncertainty of ne is low. In both cases ne increases by a factor 3-4. However, there
is an uncertainty in the absolute scale of ne due to uncertainties in the absolute values of
Ie,sat and Ap. It has to be kept in mind that the rf input power Prf is varied in an attempt to
minimize the variation in ne. Nevertheless, at low Ar fractions the electron density increases
by a factor of 3 from fAr = 0 % to 28 % and stays roughly constant around 3 to 4×10¹⁶ m−3
in the region for fAr ≥ 28 %. Without rf power variation ne would increase by a factor of
12.
Comparing electron density and rf power between different experimental setups is dif-
ficult due to complicated rf coupling efficiency. As a consequence the correlation between
forwarded rf power, discharge geometry and electron density remains a specific property
for each discharge setup. In the work of Gudmundsson17 ne increases exponentially with
increasing Ar fraction from 2.5 × 10¹⁶ m3 for fAr = 15 % to 3 × 10¹⁷ m3 for the pure Ar
plasma (p = 0.9 Pa, P = 600 W). Kimura and Kasugai20 measured ne for a pressure of
2.7 Pa and a constant power of 120 W. They found that ne increases for increasing fAr from
33
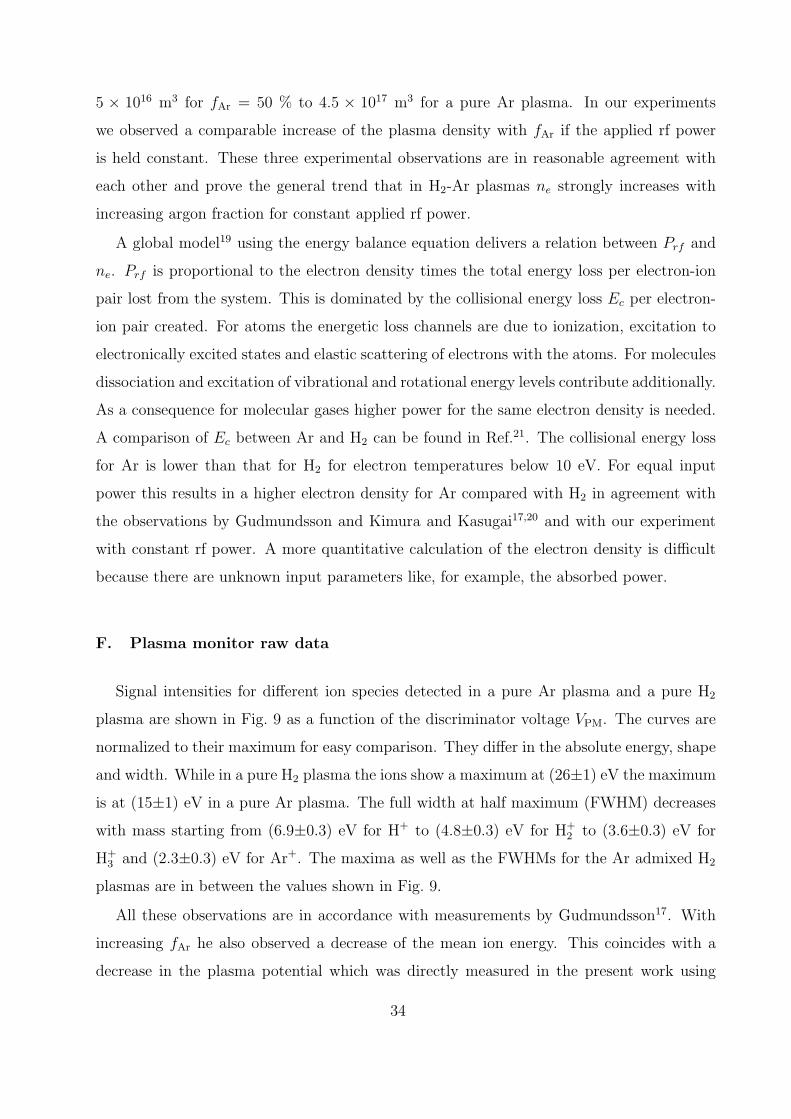
5 × 10¹⁶ m3 for fAr = 50 % to 4.5 × 10¹⁷ m3 for a pure Ar plasma. In our experiments
we observed a comparable increase of the plasma density with fAr if the applied rf power
is held constant. These three experimental observations are in reasonable agreement with
each other and prove the general trend that in H2-Ar plasmas ne strongly increases with
increasing argon fraction for constant applied rf power.
A global model19 using the energy balance equation delivers a relation between Prf and
ne. Prf is proportional to the electron density times the total energy loss per electron-ion
pair lost from the system. This is dominated by the collisional energy loss Ec per electron-
ion pair created. For atoms the energetic loss channels are due to ionization, excitation to
electronically excited states and elastic scattering of electrons with the atoms. For molecules
dissociation and excitation of vibrational and rotational energy levels contribute additionally.
As a consequence for molecular gases higher power for the same electron density is needed.
A comparison of Ec between Ar and H2 can be found in Ref.21. The collisional energy loss
for Ar is lower than that for H2 for electron temperatures below 10 eV. For equal input
power this results in a higher electron density for Ar compared with H2 in agreement with
the observations by Gudmundsson and Kimura and Kasugai17,20 and with our experiment
with constant rf power. A more quantitative calculation of the electron density is difficult
because there are unknown input parameters like, for example, the absorbed power.
F. Plasma monitor raw data
Signal intensities for different ion species detected in a pure Ar plasma and a pure H2
plasma are shown in Fig. 9 as a function of the discriminator voltage VPM. The curves are
normalized to their maximum for easy comparison. They differ in the absolute energy, shape
and width. While in a pure H2 plasma the ions show a maximum at (26±1) eV the maximum
is at (15±1) eV in a pure Ar plasma. The full width at half maximum (FWHM) decreases
with mass starting from (6.9±0.3) eV for H+ to (4.8±0.3) eV for H+2 to (3.6±0.3) eV for
H+3 and (2.3±0.3) eV for Ar+. The maxima as well as the FWHMs for the Ar admixed H2
plasmas are in between the values shown in Fig. 9.
All these observations are in accordance with measurements by Gudmundsson17. With
increasing fAr he also observed a decrease of the mean ion energy. This coincides with a
decrease in the plasma potential which was directly measured in the present work using
34
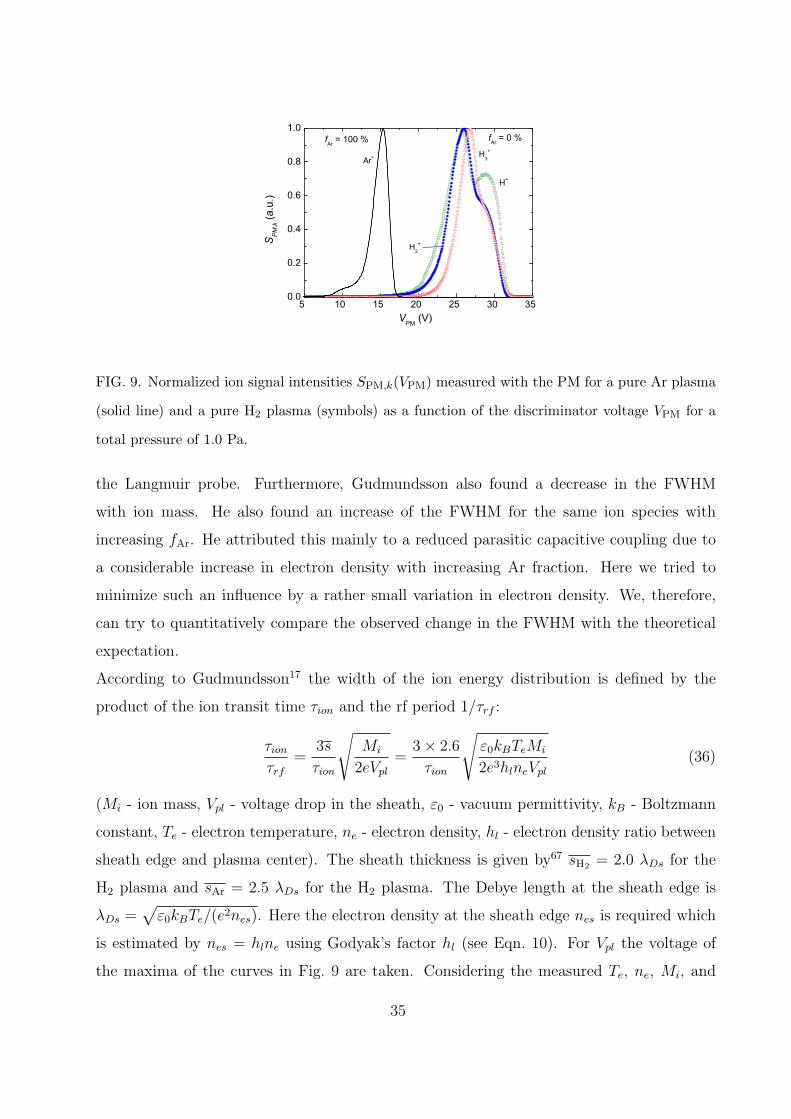
5 10 15 20 25 30 350.0
0.2
0.4
0.6
0.8
1.0fAr = 0 %fAr = 100 %
H+
H2+
Ar+ H3+
SPM,k (a
.u.)
VPM (V)
FIG. 9. Normalized ion signal intensities SPM,k(VPM) measured with the PM for a pure Ar plasma
(solid line) and a pure H2 plasma (symbols) as a function of the discriminator voltage VPM for a
total pressure of 1.0 Pa.
the Langmuir probe. Furthermore, Gudmundsson also found a decrease in the FWHM
with ion mass. He also found an increase of the FWHM for the same ion species with
increasing fAr. He attributed this mainly to a reduced parasitic capacitive coupling due to
a considerable increase in electron density with increasing Ar fraction. Here we tried to
minimize such an influence by a rather small variation in electron density. We, therefore,
can try to quantitatively compare the observed change in the FWHM with the theoretical
expectation.
According to Gudmundsson17 the width of the ion energy distribution is defined by the
product of the ion transit time τion and the rf period 1/τrf :
τionτrf
=3s
τion
√Mi
2eVpl
=3× 2.6
τion
√ε0kBTeMi
2e3hlneVpl
(36)
(Mi - ion mass, Vpl - voltage drop in the sheath, ε0 - vacuum permittivity, kB - Boltzmann
constant, Te - electron temperature, ne - electron density, hl - electron density ratio between
sheath edge and plasma center). The sheath thickness is given by67 sH2 = 2.0 λDs for the
H2 plasma and sAr = 2.5 λDs for the H2 plasma. The Debye length at the sheath edge is
λDs =√
ε0kBTe/(e2nes). Here the electron density at the sheath edge nes is required which
is estimated by nes = hlne using Godyak’s factor hl (see Eqn. 10). For Vpl the voltage of
the maxima of the curves in Fig. 9 are taken. Considering the measured Te, ne, Mi, and
35
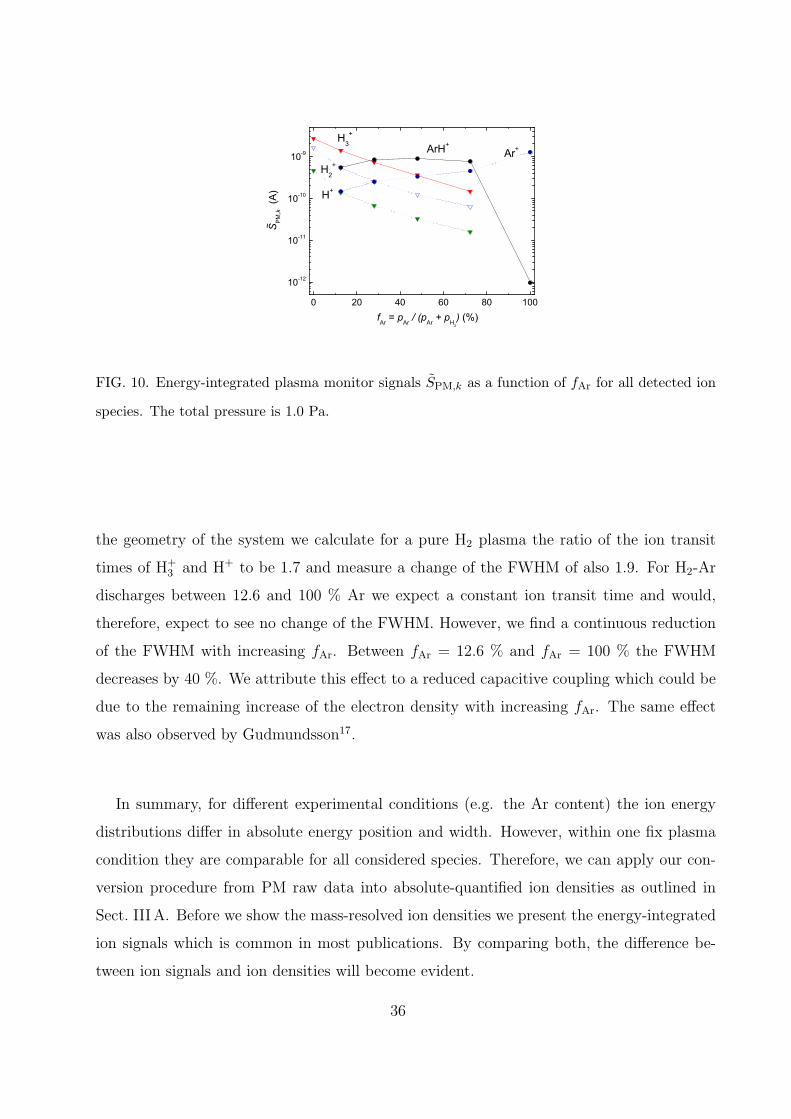
0 20 40 60 80 100
10-12
10-11
10-10
10-9
fAr = pAr / (pAr + pH2
) (%)
ArH+H3
+
Ar+
H2+
H+
SP
M,k (
A)
~
FIG. 10. Energy-integrated plasma monitor signals SPM,k as a function of fAr for all detected ion
species. The total pressure is 1.0 Pa.
the geometry of the system we calculate for a pure H2 plasma the ratio of the ion transit
times of H+3 and H+ to be 1.7 and measure a change of the FWHM of also 1.9. For H2-Ar
discharges between 12.6 and 100 % Ar we expect a constant ion transit time and would,
therefore, expect to see no change of the FWHM. However, we find a continuous reduction
of the FWHM with increasing fAr. Between fAr = 12.6 % and fAr = 100 % the FWHM
decreases by 40 %. We attribute this effect to a reduced capacitive coupling which could be
due to the remaining increase of the electron density with increasing fAr. The same effect
was also observed by Gudmundsson17.
In summary, for different experimental conditions (e.g. the Ar content) the ion energy
distributions differ in absolute energy position and width. However, within one fix plasma
condition they are comparable for all considered species. Therefore, we can apply our con-
version procedure from PM raw data into absolute-quantified ion densities as outlined in
Sect. III A. Before we show the mass-resolved ion densities we present the energy-integrated
ion signals which is common in most publications. By comparing both, the difference be-
tween ion signals and ion densities will become evident.
36
G. Mass-resolved and energy-integrated ion signals
Figure 10 shows energy-integrated plasma monitor ion signals SPM,k =∫SPM,k(V )dV for
k = Ar+, H+, H+2 , H
+3 and ArH+ as a function of the Ar fraction. As expected the signal
of the Ar+ ion increases with increasing Ar content and, correspondingly, the hydrogen ion
species decrease. The signals of the hydrogen ion species show all the same behavior. With
increasing fAr the signals decrease nearly exponentially with the H2 fraction. The most
striking observation in Fig. 10 is the fact that even at this low pressure the dominant ion
signals are from H+3 and ArH+, for low and high Ar admixture respectively. The signal of the
ArH+ ion stays roughly constant over the considered composition range. This dominance
is at first glance unexpected as these ions are not primary ions produced by direct electron
impact such as Ar+ and H+2 but secondary ions that are produced by ion-neutral collisions.
The dominant production channel for H+3 is33: H+
2 +H2 → H+3 +H. For ArH+ the dominant
production channel is33: Ar+ + H2 → ArH+ + H. Although the H2 gas flow was switched
off for the experiments with fAr = 100 % we still measured a small ArH+ signal. This is
attributed to small quantities of H2 released from the chamber walls.
The results shown in Fig. 10 can be qualitatively compared to published data. Gud-
mundsson16,17 investigated an inductively coupled H2-Ar plasma in a discharge vessel with
a height of 76 mm and a diameter of 305 mm. He used a pressure of p = 2.7 Pa and a
constant power of P = 400 W. No ArH+ was reported. He measured a low (< 0.1) H+/H+2
and a H+3 /H
+2 signal intensity ratio of about 1. In the present work similar results were ob-
tained for the H+/H+2 ion signal ratio, which is about 0.25. In the present study the H+
3 /H+2
ion signal ratio is higher which is confirmed by the results of20. Gudmundsson found that
the Ar+/H+2 signal intensity ratio is low (< 0.1) for fAr lower than 70 % and increases to
0.6 for fAr = 90 %. In the present study a Ar+/H+2 signal intensity ratio higher than 1
for fAr > 40 % is observed. The discrepancy can be due to good conversion of Ar+ into
ArH+. However, it could also be due to a different mass-dependent transmission of the PM
of Gudmundsson.
Jang and Lee18 studied an inductively coupled H2-Ar plasma at 13.56 MHz with an rf power
of 800 W and pressure of 4 Pa. They used an energy-dispersive mass spectrometer to study
the ion species. The Ar+ signal was about 3 % of the ArH+ signal and showed the same
dependence on fAr as ArH+. Both ion signals increased for increasing Ar fraction. The
37
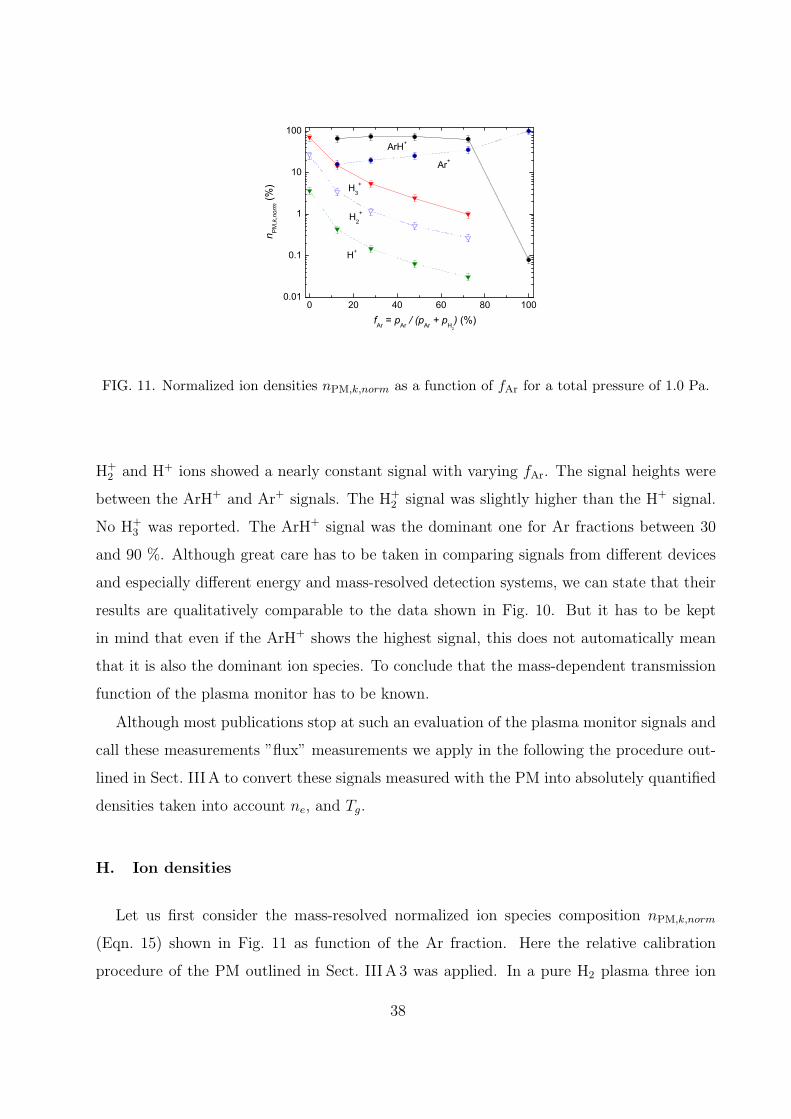
0 20 40 60 80 1000.01
0.1
1
10
100
fAr = pAr / (pAr + pH2
) (%)
ArH+
H3+
Ar+
H2+
H+
n PM
,k,norm (%
)
FIG. 11. Normalized ion densities nPM,k,norm as a function of fAr for a total pressure of 1.0 Pa.
H+2 and H+ ions showed a nearly constant signal with varying fAr. The signal heights were
between the ArH+ and Ar+ signals. The H+2 signal was slightly higher than the H+ signal.
No H+3 was reported. The ArH+ signal was the dominant one for Ar fractions between 30
and 90 %. Although great care has to be taken in comparing signals from different devices
and especially different energy and mass-resolved detection systems, we can state that their
results are qualitatively comparable to the data shown in Fig. 10. But it has to be kept
in mind that even if the ArH+ shows the highest signal, this does not automatically mean
that it is also the dominant ion species. To conclude that the mass-dependent transmission
function of the plasma monitor has to be known.
Although most publications stop at such an evaluation of the plasma monitor signals and
call these measurements ”flux” measurements we apply in the following the procedure out-
lined in Sect. III A to convert these signals measured with the PM into absolutely quantified
densities taken into account ne, and Tg.
H. Ion densities
Let us first consider the mass-resolved normalized ion species composition nPM,k,norm
(Eqn. 15) shown in Fig. 11 as function of the Ar fraction. Here the relative calibration
procedure of the PM outlined in Sect. III A 3 was applied. In a pure H2 plasma three ion
38
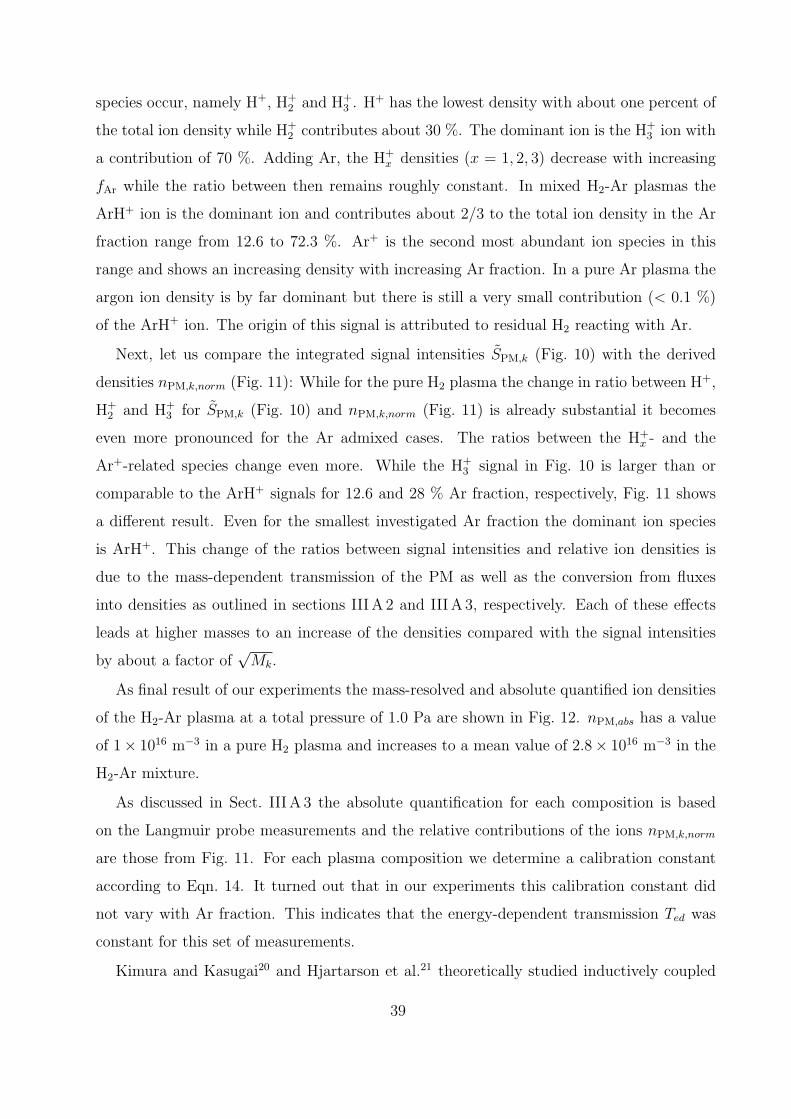
species occur, namely H+, H+2 and H+
3 . H+ has the lowest density with about one percent of
the total ion density while H+2 contributes about 30 %. The dominant ion is the H+
3 ion with
a contribution of 70 %. Adding Ar, the H+x densities (x = 1, 2, 3) decrease with increasing
fAr while the ratio between then remains roughly constant. In mixed H2-Ar plasmas the
ArH+ ion is the dominant ion and contributes about 2/3 to the total ion density in the Ar
fraction range from 12.6 to 72.3 %. Ar+ is the second most abundant ion species in this
range and shows an increasing density with increasing Ar fraction. In a pure Ar plasma the
argon ion density is by far dominant but there is still a very small contribution (< 0.1 %)
of the ArH+ ion. The origin of this signal is attributed to residual H2 reacting with Ar.
Next, let us compare the integrated signal intensities SPM,k (Fig. 10) with the derived
densities nPM,k,norm (Fig. 11): While for the pure H2 plasma the change in ratio between H+,
H+2 and H+
3 for SPM,k (Fig. 10) and nPM,k,norm (Fig. 11) is already substantial it becomes
even more pronounced for the Ar admixed cases. The ratios between the H+x - and the
Ar+-related species change even more. While the H+3 signal in Fig. 10 is larger than or
comparable to the ArH+ signals for 12.6 and 28 % Ar fraction, respectively, Fig. 11 shows
a different result. Even for the smallest investigated Ar fraction the dominant ion species
is ArH+. This change of the ratios between signal intensities and relative ion densities is
due to the mass-dependent transmission of the PM as well as the conversion from fluxes
into densities as outlined in sections IIIA 2 and IIIA 3, respectively. Each of these effects
leads at higher masses to an increase of the densities compared with the signal intensities
by about a factor of√Mk.
As final result of our experiments the mass-resolved and absolute quantified ion densities
of the H2-Ar plasma at a total pressure of 1.0 Pa are shown in Fig. 12. nPM,abs has a value
of 1× 10¹⁶ m−3 in a pure H2 plasma and increases to a mean value of 2.8× 10¹⁶ m−3 in the
H2-Ar mixture.
As discussed in Sect. III A 3 the absolute quantification for each composition is based
on the Langmuir probe measurements and the relative contributions of the ions nPM,k,norm
are those from Fig. 11. For each plasma composition we determine a calibration constant
according to Eqn. 14. It turned out that in our experiments this calibration constant did
not vary with Ar fraction. This indicates that the energy-dependent transmission Ted was
constant for this set of measurements.
Kimura and Kasugai20 and Hjartarson et al.21 theoretically studied inductively coupled
39
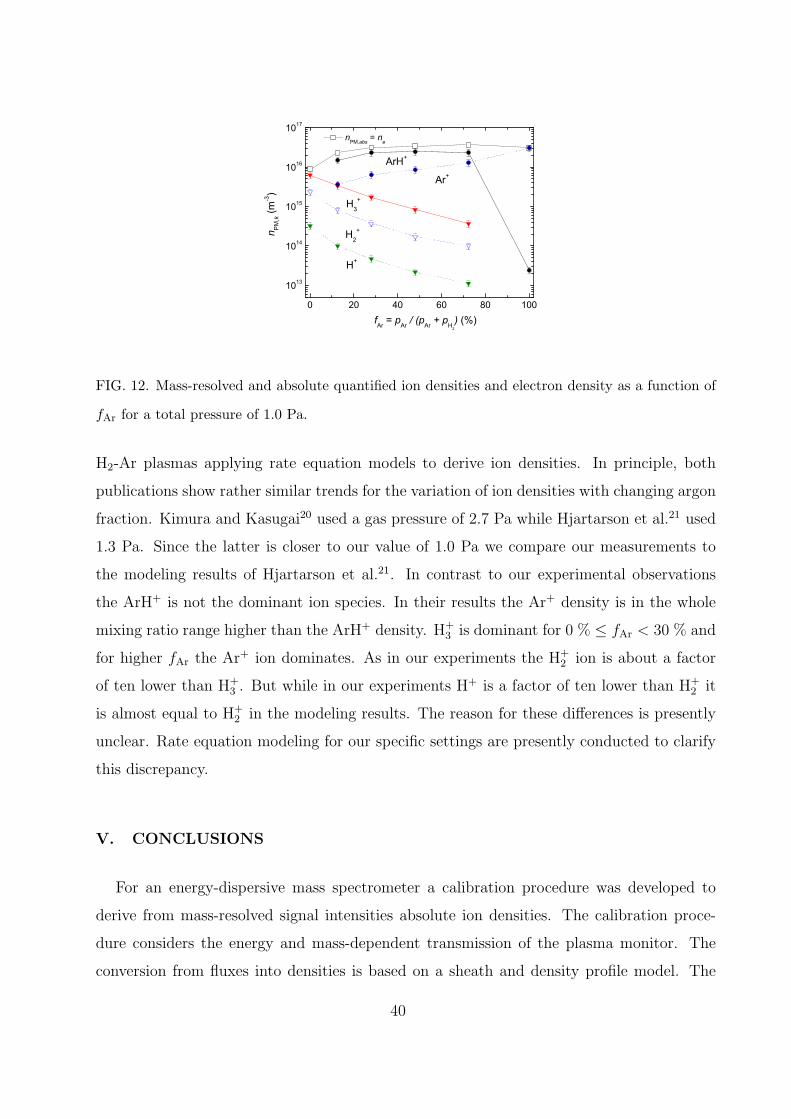
0 20 40 60 80 100
1013
1014
1015
1016
1017
fAr = pAr / (pAr + pH2
) (%)
nPM,abs = n
e
ArH+
H3+
Ar+
H2+
H+n P
M,k (m
-3)
FIG. 12. Mass-resolved and absolute quantified ion densities and electron density as a function of
fAr for a total pressure of 1.0 Pa.
H2-Ar plasmas applying rate equation models to derive ion densities. In principle, both
publications show rather similar trends for the variation of ion densities with changing argon
fraction. Kimura and Kasugai20 used a gas pressure of 2.7 Pa while Hjartarson et al.21 used
1.3 Pa. Since the latter is closer to our value of 1.0 Pa we compare our measurements to
the modeling results of Hjartarson et al.21. In contrast to our experimental observations
the ArH+ is not the dominant ion species. In their results the Ar+ density is in the whole
mixing ratio range higher than the ArH+ density. H+3 is dominant for 0 % ≤ fAr < 30 % and
for higher fAr the Ar+ ion dominates. As in our experiments the H+2 ion is about a factor
of ten lower than H+3 . But while in our experiments H+ is a factor of ten lower than H+
2 it
is almost equal to H+2 in the modeling results. The reason for these differences is presently
unclear. Rate equation modeling for our specific settings are presently conducted to clarify
this discrepancy.
V. CONCLUSIONS
For an energy-dispersive mass spectrometer a calibration procedure was developed to
derive from mass-resolved signal intensities absolute ion densities. The calibration proce-
dure considers the energy and mass-dependent transmission of the plasma monitor. The
conversion from fluxes into densities is based on a sheath and density profile model. The
40
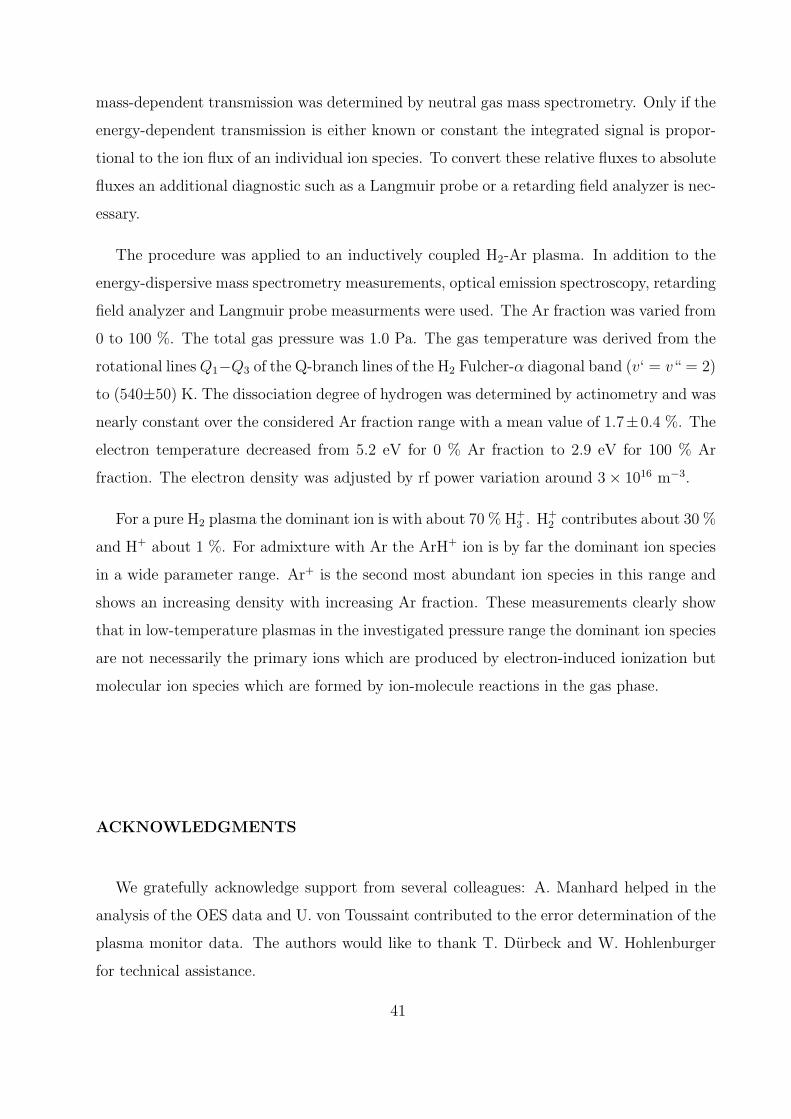
mass-dependent transmission was determined by neutral gas mass spectrometry. Only if the
energy-dependent transmission is either known or constant the integrated signal is propor-
tional to the ion flux of an individual ion species. To convert these relative fluxes to absolute
fluxes an additional diagnostic such as a Langmuir probe or a retarding field analyzer is nec-
essary.
The procedure was applied to an inductively coupled H2-Ar plasma. In addition to the
energy-dispersive mass spectrometry measurements, optical emission spectroscopy, retarding
field analyzer and Langmuir probe measurments were used. The Ar fraction was varied from
0 to 100 %. The total gas pressure was 1.0 Pa. The gas temperature was derived from the
rotational linesQ1−Q3 of the Q-branch lines of the H2 Fulcher-α diagonal band (v‘ = v“ = 2)
to (540±50) K. The dissociation degree of hydrogen was determined by actinometry and was
nearly constant over the considered Ar fraction range with a mean value of 1.7±0.4 %. The
electron temperature decreased from 5.2 eV for 0 % Ar fraction to 2.9 eV for 100 % Ar
fraction. The electron density was adjusted by rf power variation around 3× 10¹⁶ m−3.
For a pure H2 plasma the dominant ion is with about 70 % H+3 . H
+2 contributes about 30 %
and H+ about 1 %. For admixture with Ar the ArH+ ion is by far the dominant ion species
in a wide parameter range. Ar+ is the second most abundant ion species in this range and
shows an increasing density with increasing Ar fraction. These measurements clearly show
that in low-temperature plasmas in the investigated pressure range the dominant ion species
are not necessarily the primary ions which are produced by electron-induced ionization but
molecular ion species which are formed by ion-molecule reactions in the gas phase.
ACKNOWLEDGMENTS
We gratefully acknowledge support from several colleagues: A. Manhard helped in the
analysis of the OES data and U. von Toussaint contributed to the error determination of the
plasma monitor data. The authors would like to thank T. Durbeck and W. Hohlenburger
for technical assistance.
41
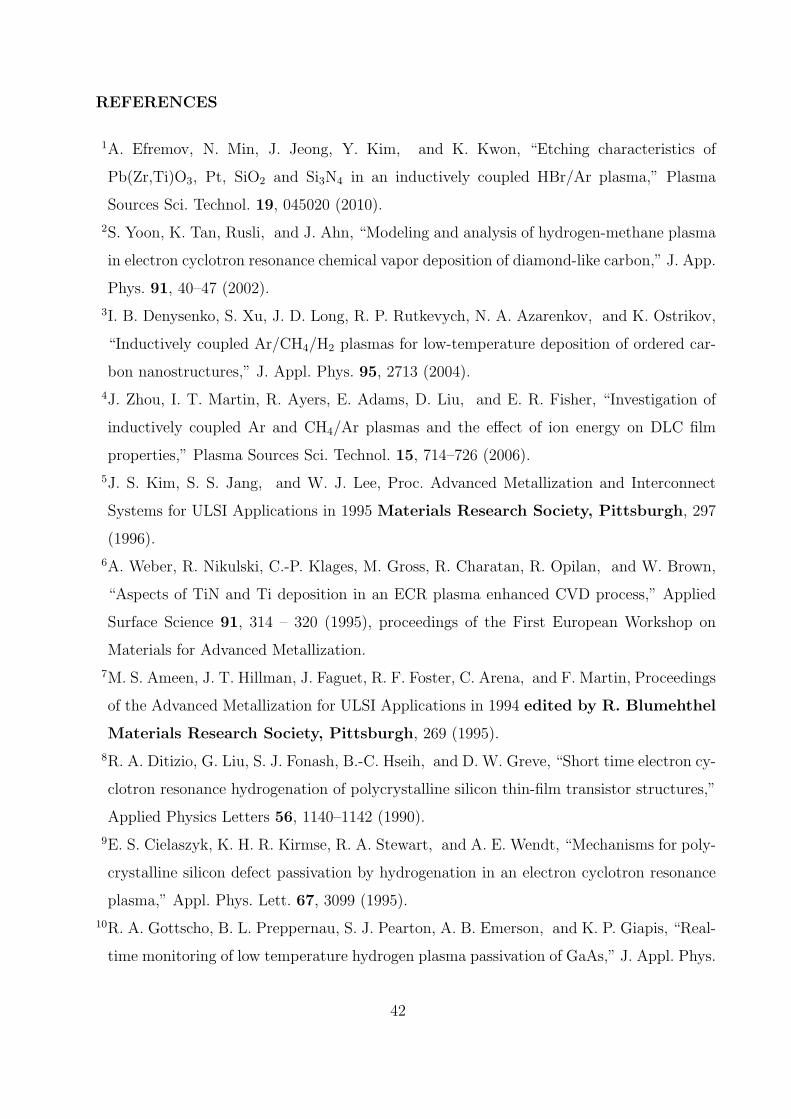
REFERENCES
1A. Efremov, N. Min, J. Jeong, Y. Kim, and K. Kwon, “Etching characteristics of
Pb(Zr,Ti)O3, Pt, SiO2 and Si3N4 in an inductively coupled HBr/Ar plasma,” Plasma
Sources Sci. Technol. 19, 045020 (2010).
2S. Yoon, K. Tan, Rusli, and J. Ahn, “Modeling and analysis of hydrogen-methane plasma
in electron cyclotron resonance chemical vapor deposition of diamond-like carbon,” J. App.
Phys. 91, 40–47 (2002).
3I. B. Denysenko, S. Xu, J. D. Long, R. P. Rutkevych, N. A. Azarenkov, and K. Ostrikov,
“Inductively coupled Ar/CH4/H2 plasmas for low-temperature deposition of ordered car-
bon nanostructures,” J. Appl. Phys. 95, 2713 (2004).
4J. Zhou, I. T. Martin, R. Ayers, E. Adams, D. Liu, and E. R. Fisher, “Investigation of
inductively coupled Ar and CH4/Ar plasmas and the effect of ion energy on DLC film
properties,” Plasma Sources Sci. Technol. 15, 714–726 (2006).
5J. S. Kim, S. S. Jang, and W. J. Lee, Proc. Advanced Metallization and Interconnect
Systems for ULSI Applications in 1995 Materials Research Society, Pittsburgh, 297
(1996).
6A. Weber, R. Nikulski, C.-P. Klages, M. Gross, R. Charatan, R. Opilan, and W. Brown,
“Aspects of TiN and Ti deposition in an ECR plasma enhanced CVD process,” Applied
Surface Science 91, 314 – 320 (1995), proceedings of the First European Workshop on
Materials for Advanced Metallization.
7M. S. Ameen, J. T. Hillman, J. Faguet, R. F. Foster, C. Arena, and F. Martin, Proceedings
of the Advanced Metallization for ULSI Applications in 1994 edited by R. Blumehthel
Materials Research Society, Pittsburgh, 269 (1995).
8R. A. Ditizio, G. Liu, S. J. Fonash, B.-C. Hseih, and D. W. Greve, “Short time electron cy-
clotron resonance hydrogenation of polycrystalline silicon thin-film transistor structures,”
Applied Physics Letters 56, 1140–1142 (1990).
9E. S. Cielaszyk, K. H. R. Kirmse, R. A. Stewart, and A. E. Wendt, “Mechanisms for poly-
crystalline silicon defect passivation by hydrogenation in an electron cyclotron resonance
plasma,” Appl. Phys. Lett. 67, 3099 (1995).
10R. A. Gottscho, B. L. Preppernau, S. J. Pearton, A. B. Emerson, and K. P. Giapis, “Real-
time monitoring of low temperature hydrogen plasma passivation of GaAs,” J. Appl. Phys.
42
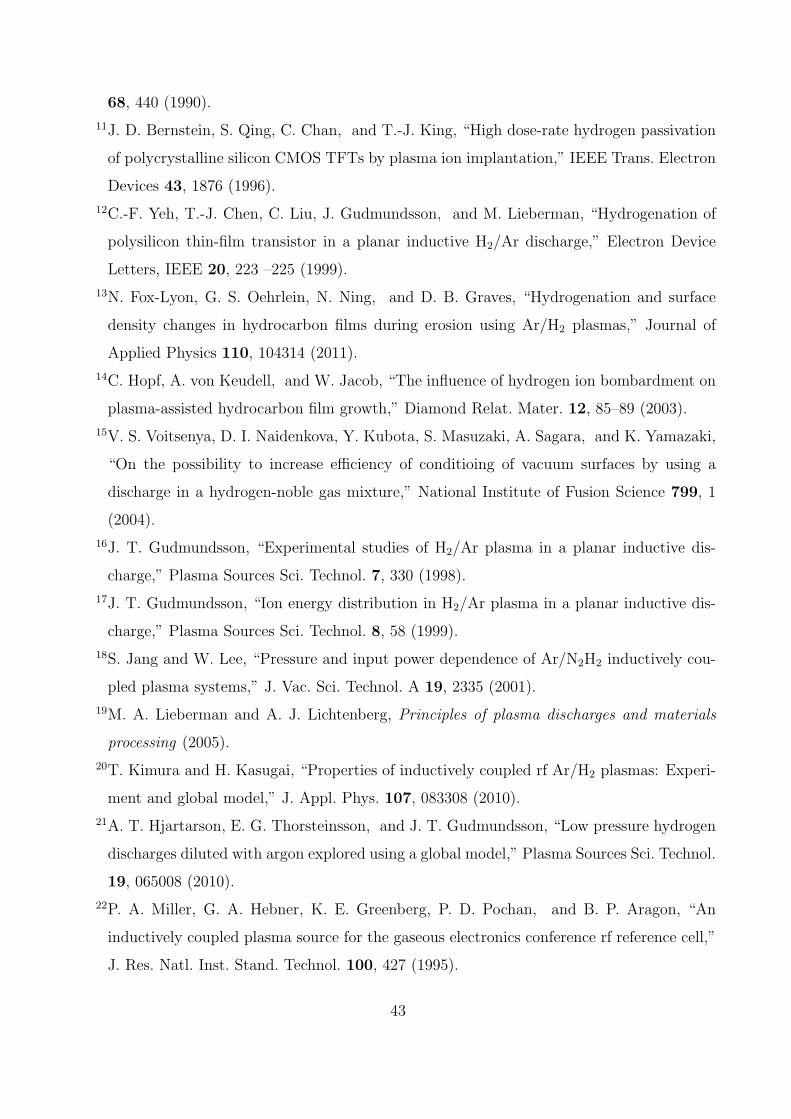
68, 440 (1990).
11J. D. Bernstein, S. Qing, C. Chan, and T.-J. King, “High dose-rate hydrogen passivation
of polycrystalline silicon CMOS TFTs by plasma ion implantation,” IEEE Trans. Electron
Devices 43, 1876 (1996).
12C.-F. Yeh, T.-J. Chen, C. Liu, J. Gudmundsson, and M. Lieberman, “Hydrogenation of
polysilicon thin-film transistor in a planar inductive H2/Ar discharge,” Electron Device
Letters, IEEE 20, 223 –225 (1999).
13N. Fox-Lyon, G. S. Oehrlein, N. Ning, and D. B. Graves, “Hydrogenation and surface
density changes in hydrocarbon films during erosion using Ar/H2 plasmas,” Journal of
Applied Physics 110, 104314 (2011).
14C. Hopf, A. von Keudell, and W. Jacob, “The influence of hydrogen ion bombardment on
plasma-assisted hydrocarbon film growth,” Diamond Relat. Mater. 12, 85–89 (2003).
15V. S. Voitsenya, D. I. Naidenkova, Y. Kubota, S. Masuzaki, A. Sagara, and K. Yamazaki,
“On the possibility to increase efficiency of conditioing of vacuum surfaces by using a
discharge in a hydrogen-noble gas mixture,” National Institute of Fusion Science 799, 1
(2004).
16J. T. Gudmundsson, “Experimental studies of H2/Ar plasma in a planar inductive dis-
charge,” Plasma Sources Sci. Technol. 7, 330 (1998).
17J. T. Gudmundsson, “Ion energy distribution in H2/Ar plasma in a planar inductive dis-
charge,” Plasma Sources Sci. Technol. 8, 58 (1999).
18S. Jang and W. Lee, “Pressure and input power dependence of Ar/N2H2 inductively cou-
pled plasma systems,” J. Vac. Sci. Technol. A 19, 2335 (2001).
19M. A. Lieberman and A. J. Lichtenberg, Principles of plasma discharges and materials
processing (2005).
20T. Kimura and H. Kasugai, “Properties of inductively coupled rf Ar/H2 plasmas: Experi-
ment and global model,” J. Appl. Phys. 107, 083308 (2010).
21A. T. Hjartarson, E. G. Thorsteinsson, and J. T. Gudmundsson, “Low pressure hydrogen
discharges diluted with argon explored using a global model,” Plasma Sources Sci. Technol.
19, 065008 (2010).
22P. A. Miller, G. A. Hebner, K. E. Greenberg, P. D. Pochan, and B. P. Aragon, “An
inductively coupled plasma source for the gaseous electronics conference rf reference cell,”
J. Res. Natl. Inst. Stand. Technol. 100, 427 (1995).
43
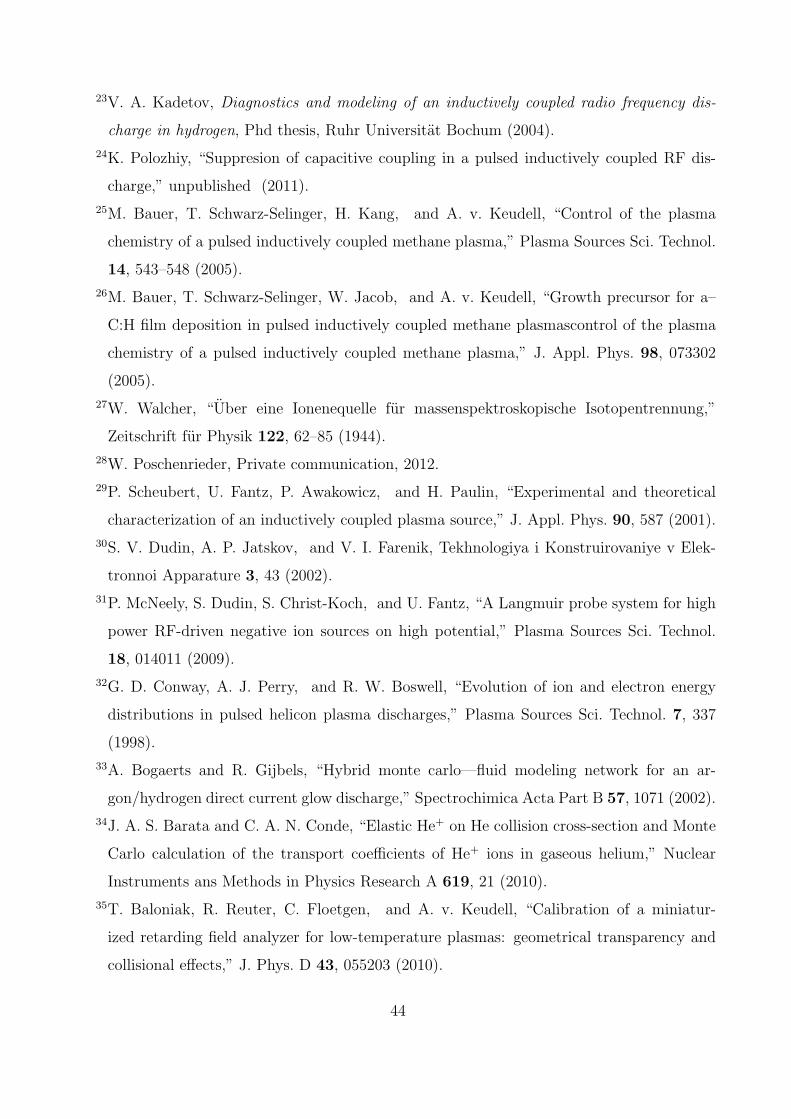
23V. A. Kadetov, Diagnostics and modeling of an inductively coupled radio frequency dis-
charge in hydrogen, Phd thesis, Ruhr Universitat Bochum (2004).
24K. Polozhiy, “Suppresion of capacitive coupling in a pulsed inductively coupled RF dis-
charge,” unpublished (2011).
25M. Bauer, T. Schwarz-Selinger, H. Kang, and A. v. Keudell, “Control of the plasma
chemistry of a pulsed inductively coupled methane plasma,” Plasma Sources Sci. Technol.
14, 543–548 (2005).
26M. Bauer, T. Schwarz-Selinger, W. Jacob, and A. v. Keudell, “Growth precursor for a–
C:H film deposition in pulsed inductively coupled methane plasmascontrol of the plasma
chemistry of a pulsed inductively coupled methane plasma,” J. Appl. Phys. 98, 073302
(2005).
27W. Walcher, “Uber eine Ionenequelle fur massenspektroskopische Isotopentrennung,”
Zeitschrift fur Physik 122, 62–85 (1944).
28W. Poschenrieder, Private communication, 2012.
29P. Scheubert, U. Fantz, P. Awakowicz, and H. Paulin, “Experimental and theoretical
characterization of an inductively coupled plasma source,” J. Appl. Phys. 90, 587 (2001).
30S. V. Dudin, A. P. Jatskov, and V. I. Farenik, Tekhnologiya i Konstruirovaniye v Elek-
tronnoi Apparature 3, 43 (2002).
31P. McNeely, S. Dudin, S. Christ-Koch, and U. Fantz, “A Langmuir probe system for high
power RF-driven negative ion sources on high potential,” Plasma Sources Sci. Technol.
18, 014011 (2009).
32G. D. Conway, A. J. Perry, and R. W. Boswell, “Evolution of ion and electron energy
distributions in pulsed helicon plasma discharges,” Plasma Sources Sci. Technol. 7, 337
(1998).
33A. Bogaerts and R. Gijbels, “Hybrid monte carlo—fluid modeling network for an ar-
gon/hydrogen direct current glow discharge,” Spectrochimica Acta Part B 57, 1071 (2002).
34J. A. S. Barata and C. A. N. Conde, “Elastic He+ on He collision cross-section and Monte
Carlo calculation of the transport coefficients of He+ ions in gaseous helium,” Nuclear
Instruments ans Methods in Physics Research A 619, 21 (2010).
35T. Baloniak, R. Reuter, C. Floetgen, and A. v. Keudell, “Calibration of a miniatur-
ized retarding field analyzer for low-temperature plasmas: geometrical transparency and
collisional effects,” J. Phys. D 43, 055203 (2010).
44
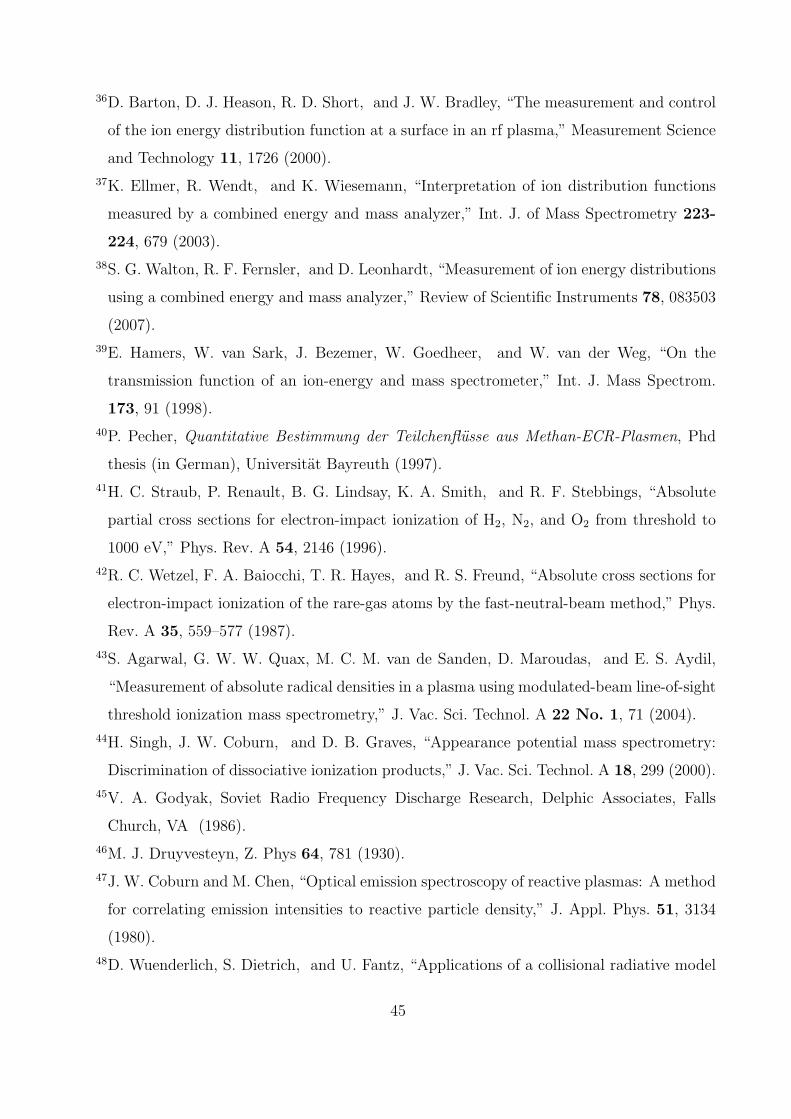
36D. Barton, D. J. Heason, R. D. Short, and J. W. Bradley, “The measurement and control
of the ion energy distribution function at a surface in an rf plasma,” Measurement Science
and Technology 11, 1726 (2000).
37K. Ellmer, R. Wendt, and K. Wiesemann, “Interpretation of ion distribution functions
measured by a combined energy and mass analyzer,” Int. J. of Mass Spectrometry 223-
224, 679 (2003).
38S. G. Walton, R. F. Fernsler, and D. Leonhardt, “Measurement of ion energy distributions
using a combined energy and mass analyzer,” Review of Scientific Instruments 78, 083503
(2007).
39E. Hamers, W. van Sark, J. Bezemer, W. Goedheer, and W. van der Weg, “On the
transmission function of an ion-energy and mass spectrometer,” Int. J. Mass Spectrom.
173, 91 (1998).
40P. Pecher, Quantitative Bestimmung der Teilchenflusse aus Methan-ECR-Plasmen, Phd
thesis (in German), Universitat Bayreuth (1997).
41H. C. Straub, P. Renault, B. G. Lindsay, K. A. Smith, and R. F. Stebbings, “Absolute
partial cross sections for electron-impact ionization of H2, N2, and O2 from threshold to
1000 eV,” Phys. Rev. A 54, 2146 (1996).
42R. C. Wetzel, F. A. Baiocchi, T. R. Hayes, and R. S. Freund, “Absolute cross sections for
electron-impact ionization of the rare-gas atoms by the fast-neutral-beam method,” Phys.
Rev. A 35, 559–577 (1987).
43S. Agarwal, G. W. W. Quax, M. C. M. van de Sanden, D. Maroudas, and E. S. Aydil,
“Measurement of absolute radical densities in a plasma using modulated-beam line-of-sight
threshold ionization mass spectrometry,” J. Vac. Sci. Technol. A 22 No. 1, 71 (2004).
44H. Singh, J. W. Coburn, and D. B. Graves, “Appearance potential mass spectrometry:
Discrimination of dissociative ionization products,” J. Vac. Sci. Technol. A 18, 299 (2000).
45V. A. Godyak, Soviet Radio Frequency Discharge Research, Delphic Associates, Falls
Church, VA (1986).
46M. J. Druyvesteyn, Z. Phys 64, 781 (1930).
47J. W. Coburn and M. Chen, “Optical emission spectroscopy of reactive plasmas: A method
for correlating emission intensities to reactive particle density,” J. Appl. Phys. 51, 3134
(1980).
48D. Wuenderlich, S. Dietrich, and U. Fantz, “Applications of a collisional radiative model
45
to atomic hydrogen for diagnostic purposes,” Journal of Quantitative Spectroscopy and
Radiative Transfer 110, 62 (2009).
49J. B. Boffard, R. O. Jung, C. C. Lin, and A. E. Wendt, “Optical emission measurements of
electron energy distributions in low-pressure argon inductively coupled plasmas,” Plasma
Sources Sci. Technol. 19, 065001 (2010).
50J. E. Chilton, J. B. Boffard, R. Scott, and C. C. Lin, “Measurement of electron-impact
excitation into the 3p5 4p levels of argon using Fourier-transform spectroscopy,” Phys.
Rev. A 57, 267 (1998).
51T. Czerwiec, F. Greer, and D. B. Graves, “Nitrogen dissociation in a low pressure cylin-
drical ICP discharge studied by actinometry and mass spectrometry,” J. Phys. D 38, 4278
(2005).
52B. P. Lavrov and A. V. Pipa, “Account of the fine structure of hydrogen atom levels in the
effective emission cross sections of Balmer lines excited by electron impact in gases and
plasma,” Optics and Spectroscopy 92, 647 (2002).
53G. L. Majstorovic, N. M. Sisovic, and N. Konjevic, “Rotational and vibrational temper-
atures of molecular hydrogen in a hollow cathode glow discharge,” Plasma Sources Sci.
Technol. 16, 750 (2007).
54Z. Gavare, G. Revalde, and A. Skudra, “Plasma temperature determination of hydrogen
containing high-frequency electrodeless lamps by intensity distribution measurements of
hydrogen molecular band,” Int. Journal of Spectroscopy 2010, 804506 (2010).
55U. Fantz, “Emission spectroscopy of molecular low pressure plasmas,” Contrib. Plasma
Phys. 44, 508–515 (2004).
56V. M. Donnelly and M. V. Malyshev, “Diagnostics of inductively coupled chlorine plasmas:
Measurements of the neutral gas temperature,” Applied Physics Letters 77, 2467 (2000).
57K. Behringer, “Diagnostics and modelling of ECRHmicrowave discharges,” Plasma Physics
and Controlled Fusion 33, 997 (1991).
58G. Dieke, “Principles of plasma discharges and materials processing,” Wiley Interscience
(1972).
59K. P. Huber and G. Herzberg, “Molecular spectra and molecular structure,” Van Nostrand
Reinhold Company 4 (1979).
60J.-S. Yoon, M.-Y. Song, J.-M. Han, S. H. Hwang, W.-S. Chang, B. Lee, and Y. Itikawa,
“Cross sections for electron collisions with hydrogen molecules,” J. Phys. Chem. Ref. Data
46
37, 913 (2008).
61M. W. Kiehlbauch and D. B. Graves, “Modeling argon inductively coupled plasmas: The
electron energy distribution function and metastable kinetics,” J. Appl. Phys. 91, 3539
(2002).
62E. J. Tonnis and D. B. Graves, “Neutral gas temperatures measured within a high-density,
inductively coupled plasma abatement device,” J. Vac. Sci. Technol. A 20, 1787 (2002).
63E. Tatarova, F. M. Dias, C. M. Ferreira, and N. Puac, “Spectroscopic determination of H,
He, and H2 temperatures in a large-scale microwave plasma source,” J. Appl. Phys. 101,
063306 (2007).
64A. Manhard, T. Schwarz-Selinger, and W. Jacob, “Quantification of the deuterium ion
fluxes from a plasma source,” Plasma Sources Sci. Technol. 20, 015010 (9pp) (2011).
65P. Kae-Nune, J. Perrin, J. Jolly, and J. Guillon, “Surface recombination probabilities of
H on stainless steel, a-Si:H and oxidized silicon determined by threshold ionization mass
spectrometry in H2 RF discharges,” Surface Science Letters 360, L495 (1996).
66S. Takashima, M. Hori, T. Goto, A. Kono, and K. Yoneda, “Absolute concentration and
loss kinetics of hydrogen atom in methane and hydrogen plasmas,” Journal of Applied
Physics 90, 5497–5503 (2001).
67E. Kawamura, V. Vahedi, M. A. Lieberman, and C. K. Birdsall, “Ion energy distributions
in rf sheaths; review, analysis and simulation,” Plasma Sources Science and Technology 8,
R45 (1999).
47