Embed Size (px)
Citation preview
Copyright 2006 Kyle Hailey
Waits Covered in this Section
1. db file sequential read2. db file scattered read3. db file parallel read4. read by other session5. direct path read 6. direct path write7. direct path read temp8. direct path write temp9. direct path write (lob)10. Local write wait11. data file init write
Buffer Cache I/OBuffer Cache I/O
PGA I/OPGA I/O
Special CasesSpecial Cases
Copyright 2006 Kyle Hailey
IO Waits
Data FilesData Files
DBWRDBWR
Buffer Buffer CacheCache
User1User1
SGASGA
Library Library CacheCache
Log Log BufferBuffer
Copyright 2006 Kyle Hailey
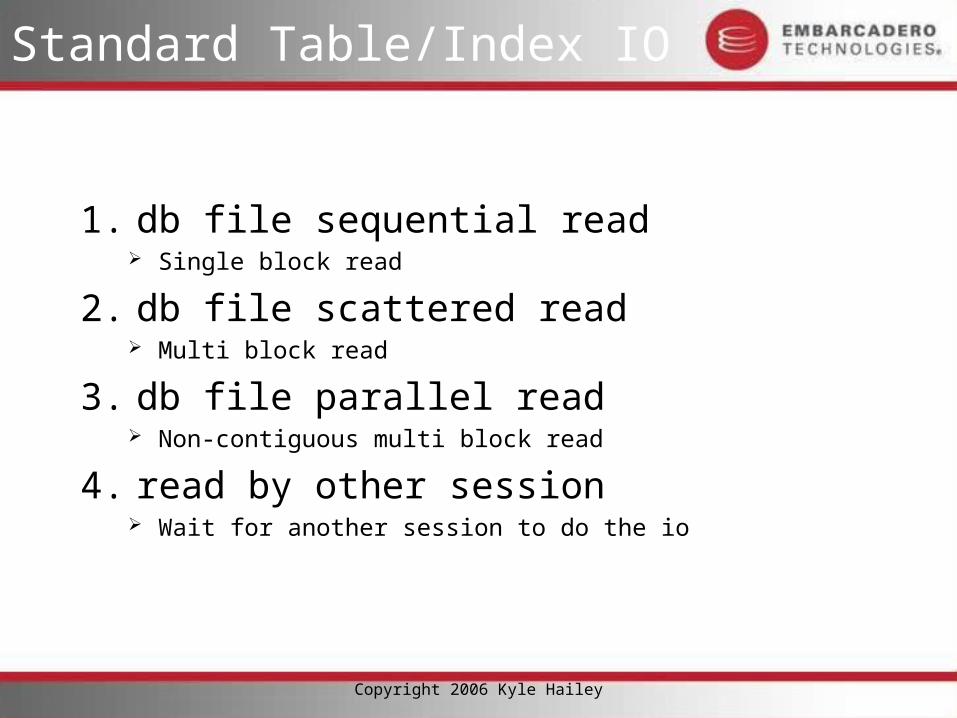
Standard Table/Index IO
1. db file sequential read Single block read
2. db file scattered read Multi block read
3. db file parallel read Non-contiguous multi block read
4. read by other session Wait for another session to do the io
Copyright 2006 Kyle Hailey
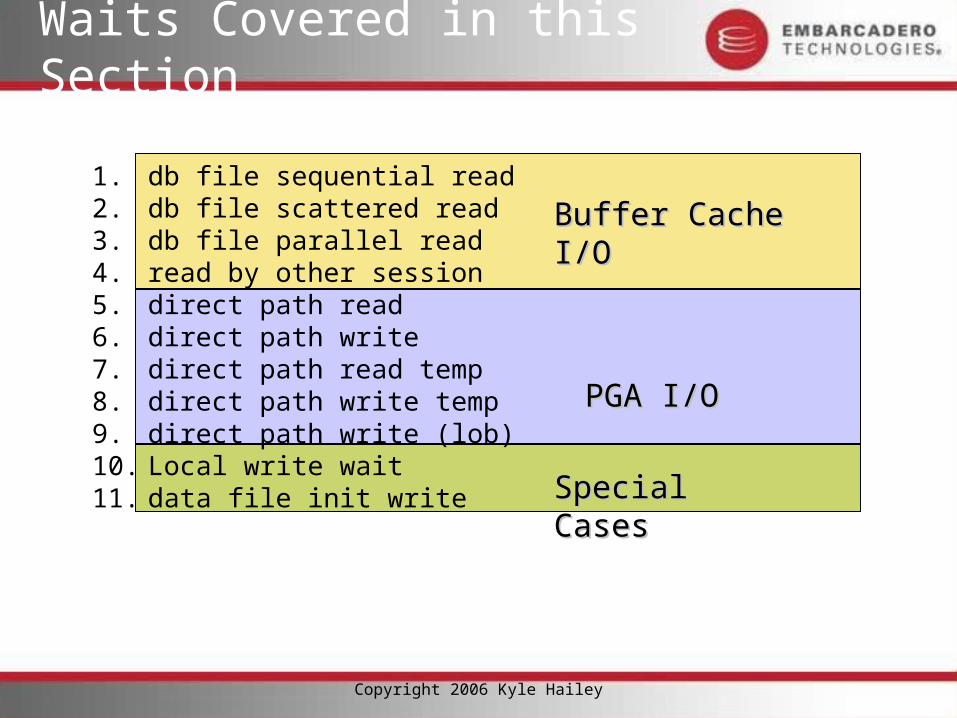
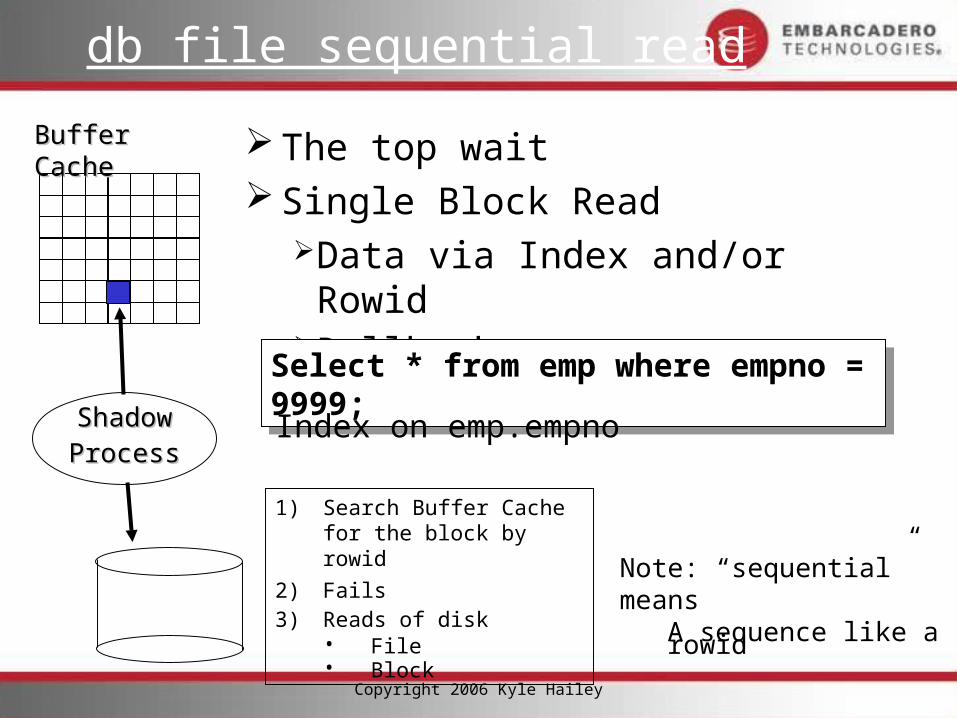
db file sequential read
ShadowShadowProcessProcess
1) Search Buffer Cache for the block by rowid
2) Fails3) Reads of disk
• File• Block
Buffer CacheBuffer Cache The top wait Single Block Read
Data via Index and/or RowidRollback (if expecting FTS => problem)
Select * from emp where empno = 9999;Select * from emp where empno = 9999;
Note: “sequential” meansA sequence like a rowid
Index on emp.empno
Copyright 2006 Kyle Hailey
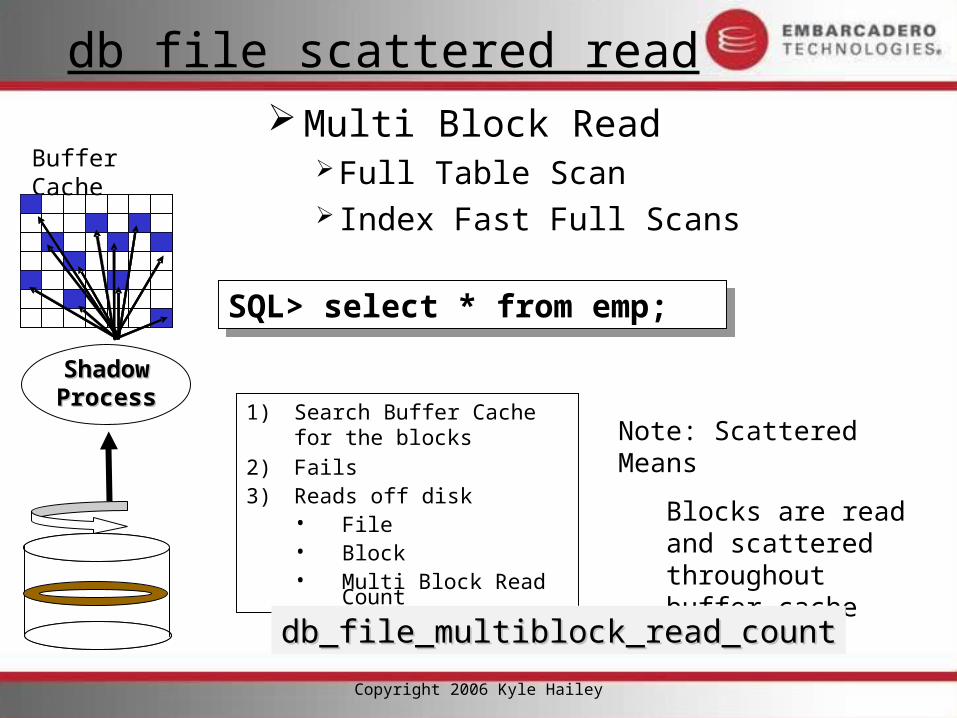
db file scattered read
ShadowShadowProcessProcess
1) Search Buffer Cache for the blocks
2) Fails3) Reads off disk
• File• Block• Multi Block Read Count
Buffer Cache
Multi Block ReadFull Table Scan Index Fast Full Scans
SQL> select * from emp;SQL> select * from emp;
Note: Scattered Means
Blocks are read and scattered throughout buffer cache
db_file_multiblock_read_countdb_file_multiblock_read_count
Copyright 2006 Kyle Hailey
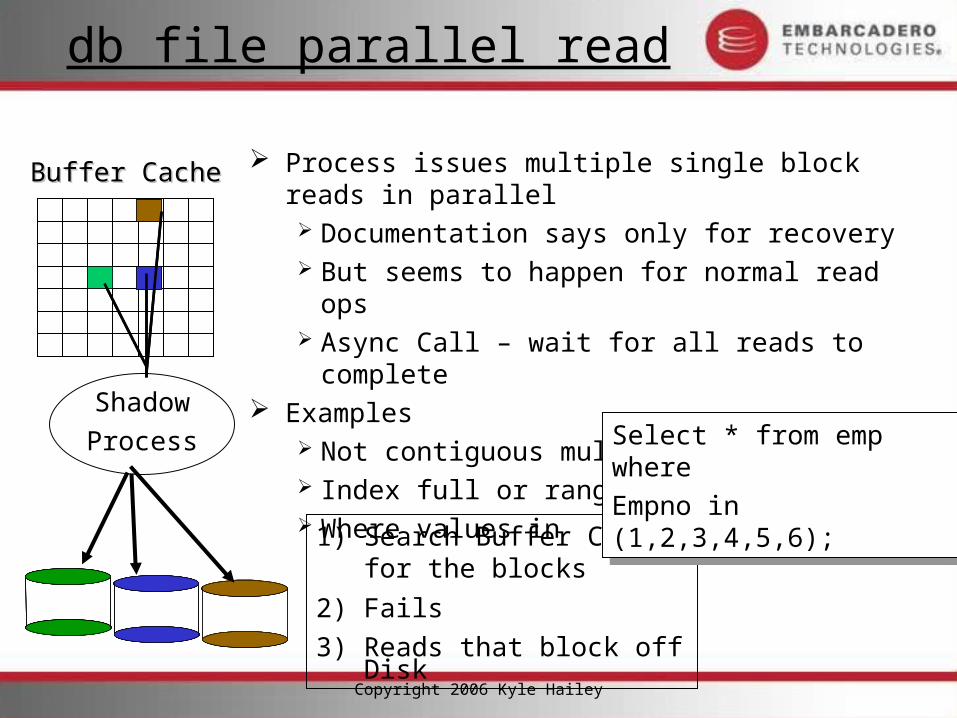
db file parallel read
Shadow
Process
1) Search Buffer Cache for the blocks
2) Fails
3) Reads that block off Disk
Buffer CacheBuffer Cache Process issues multiple single block reads in parallel Documentation says only for recovery But seems to happen for normal read ops Async Call – wait for all reads to complete
Examples Not contiguous multi block read Index full or range scan Where values in Select * from emp where
Empno in (1,2,3,4,5,6);
Select * from emp where
Empno in (1,2,3,4,5,6);
Copyright 2006 Kyle Hailey
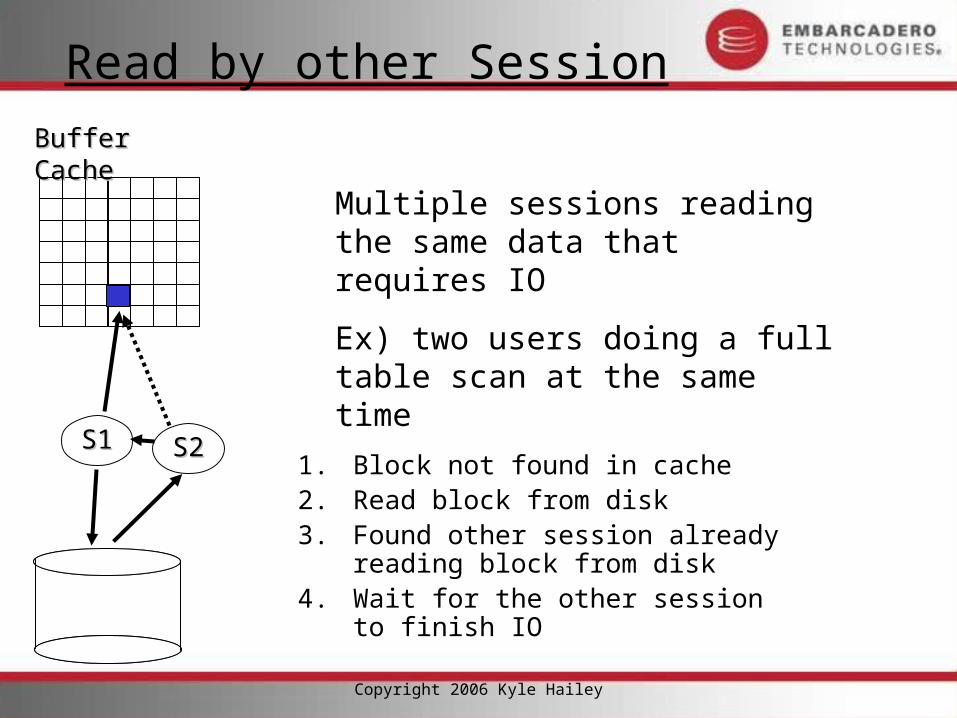
Read by other Session
1. Block not found in cache2. Read block from disk3. Found other session already
reading block from disk4. Wait for the other session to finish
IO
S1S1
Buffer CacheBuffer Cache
S2S2
Multiple sessions reading the same data that requires IO
Ex) two users doing a full table scan at the same time
Copyright 2006 Kyle Hailey
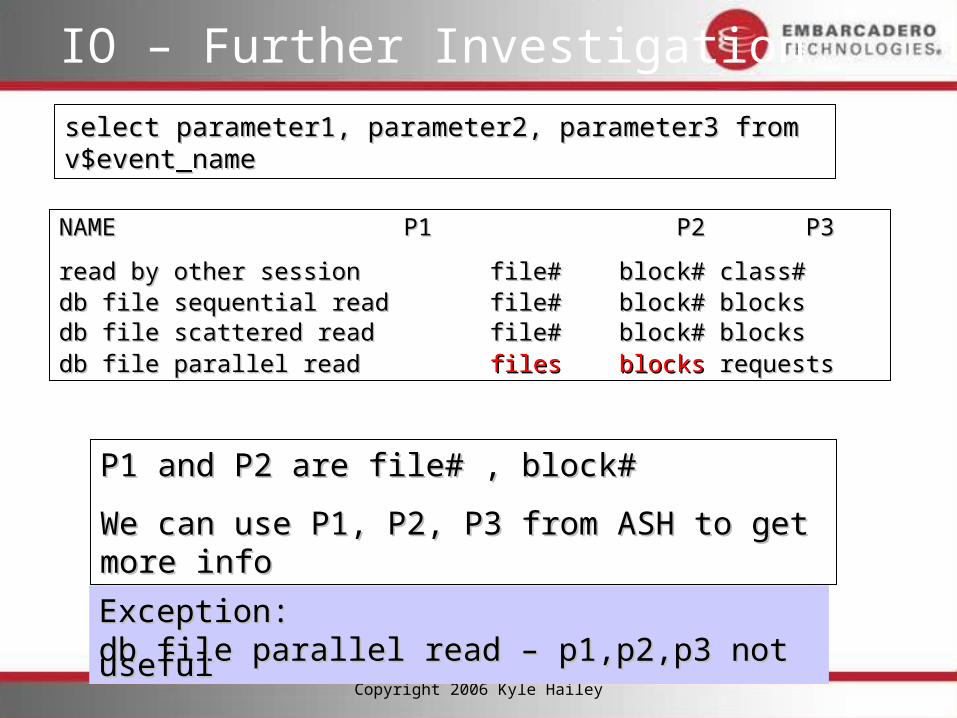
IO – Further Investigation
select parameter1, parameter2, parameter3 from v$event_nameselect parameter1, parameter2, parameter3 from v$event_name
NAME P1 P2 P3NAME P1 P2 P3
----------------------- ----------- --------- ------------------------------- ----------- --------- --------
read by other session file# block# class#read by other session file# block# class#db file sequential read file# block# blocksdb file sequential read file# block# blocksdb file scattered read file# block# blocksdb file scattered read file# block# blocksdb file parallel read db file parallel read filesfiles blocksblocks requests requests
P1 and P2 are file# , block# P1 and P2 are file# , block#
We can use P1, P2, P3 from ASH to get more info We can use P1, P2, P3 from ASH to get more info
Exception:Exception:db file parallel read – p1,p2,p3 not usefuldb file parallel read – p1,p2,p3 not useful
Copyright 2006 Kyle Hailey
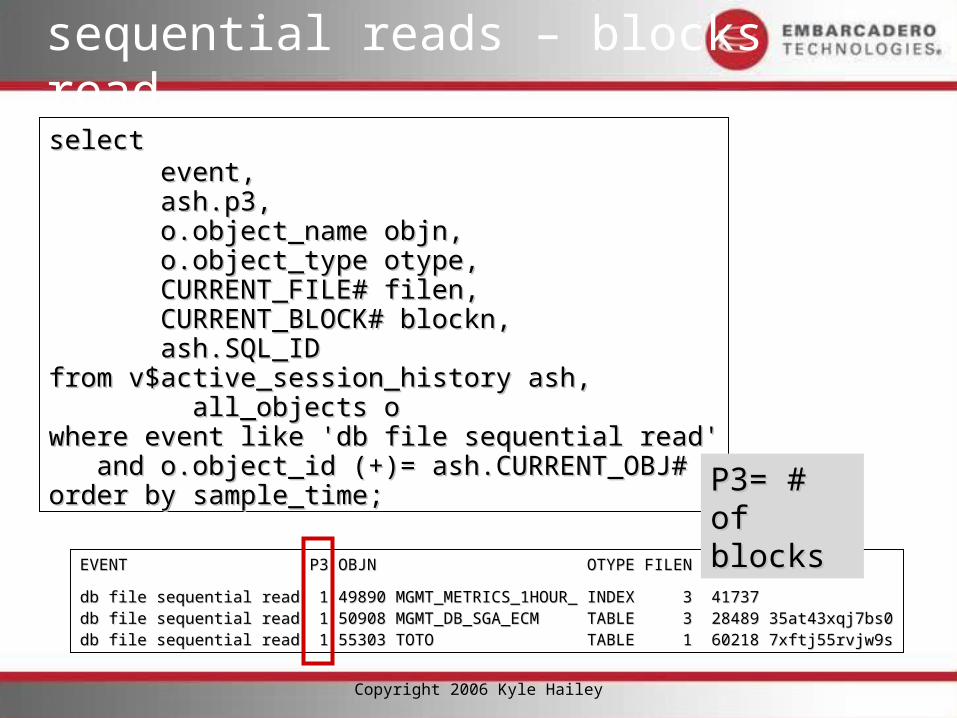
sequential reads – blocks read
selectselect event,event, ash.p3,ash.p3, o.object_name objn,o.object_name objn, o.object_type otype,o.object_type otype, CURRENT_FILE# filen,CURRENT_FILE# filen, CURRENT_BLOCK# blockn,CURRENT_BLOCK# blockn, ash.SQL_IDash.SQL_IDfrom v$active_session_history ash,from v$active_session_history ash, all_objects oall_objects owhere event like 'db file sequential read'where event like 'db file sequential read' and o.object_id (+)= ash.CURRENT_OBJ#and o.object_id (+)= ash.CURRENT_OBJ#order by sample_time;order by sample_time;
EVENT P3 OBJN OTYPE FILEN BLOCKN SQL_IDEVENT P3 OBJN OTYPE FILEN BLOCKN SQL_ID
----------------------- -- ------------------------- ----- ----- ------ ------------------------------------ -- ------------------------- ----- ----- ------ -------------
db file sequential read 1 49890 MGMT_METRICS_1HOUR_ INDEX 3 41737db file sequential read 1 49890 MGMT_METRICS_1HOUR_ INDEX 3 41737db file sequential read 1 50908 MGMT_DB_SGA_ECM TABLE 3 28489 35at43xqj7bs0db file sequential read 1 50908 MGMT_DB_SGA_ECM TABLE 3 28489 35at43xqj7bs0db file sequential read 1 55303 TOTO TABLE 1 60218 7xftj55rvjw9sdb file sequential read 1 55303 TOTO TABLE 1 60218 7xftj55rvjw9s
P3= # of P3= # of blocksblocks
Copyright 2006 Kyle Hailey
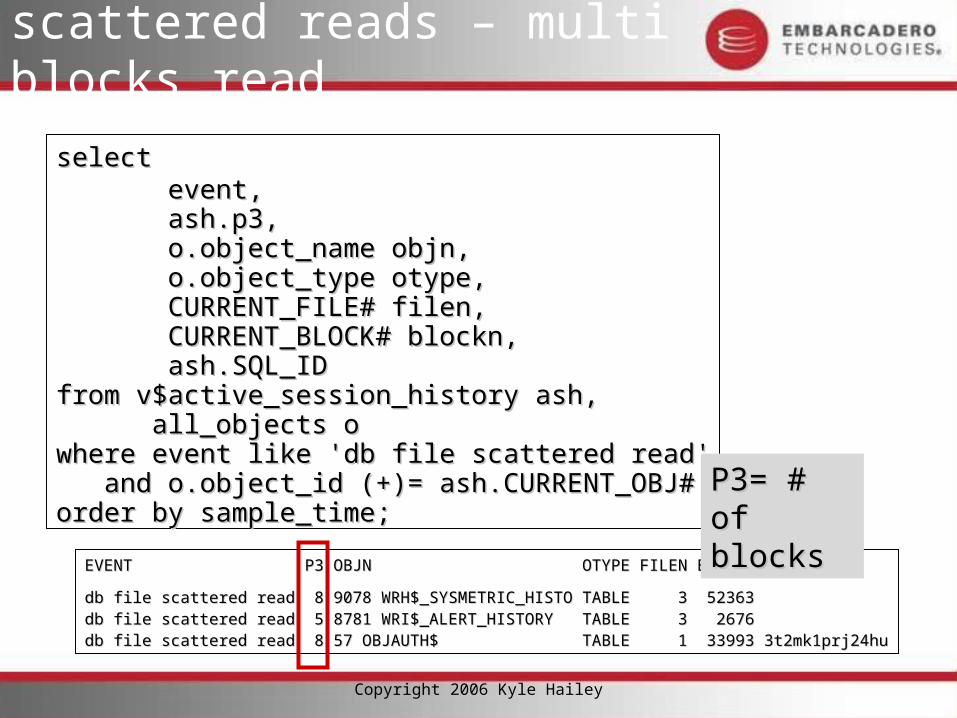
scattered reads – multi blocks read
selectselect event,event, ash.p3,ash.p3, o.object_name objn,o.object_name objn, o.object_type otype,o.object_type otype, CURRENT_FILE# filen,CURRENT_FILE# filen, CURRENT_BLOCK# blockn,CURRENT_BLOCK# blockn, ash.SQL_IDash.SQL_IDfrom v$active_session_history ash,from v$active_session_history ash, all_objects oall_objects owhere event like 'db file scattered read'where event like 'db file scattered read' and o.object_id (+)= ash.CURRENT_OBJ#and o.object_id (+)= ash.CURRENT_OBJ#order by sample_time;order by sample_time;
EVENT P3 OBJN OTYPE FILEN BLOCKN SQL_IDEVENT P3 OBJN OTYPE FILEN BLOCKN SQL_ID
---------------------- -- ------------------------- ----- ----- ------ ----------------------------------- -- ------------------------- ----- ----- ------ -------------
db file scattered read 8 9078 WRH$_SYSMETRIC_HISTO TABLE 3 52363db file scattered read 8 9078 WRH$_SYSMETRIC_HISTO TABLE 3 52363db file scattered read 5 8781 WRI$_ALERT_HISTORY TABLE 3 2676db file scattered read 5 8781 WRI$_ALERT_HISTORY TABLE 3 2676db file scattered read 8 57 OBJAUTH$ TABLE 1 33993 3t2mk1prj24hudb file scattered read 8 57 OBJAUTH$ TABLE 1 33993 3t2mk1prj24hu
P3= # of P3= # of blocksblocks
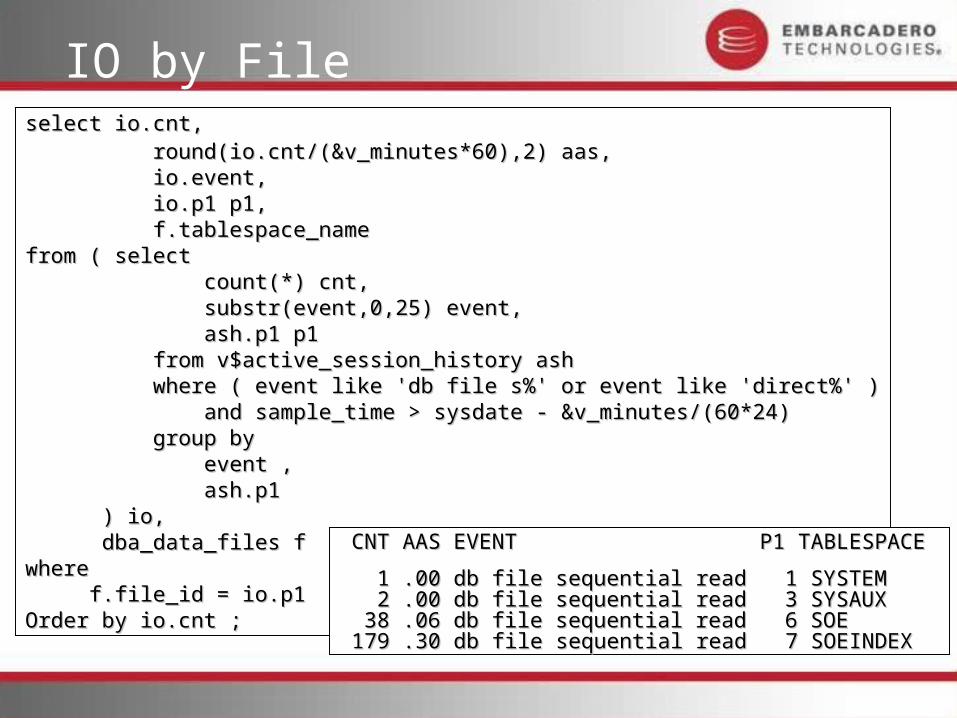
IO by Fileselect io.cnt,select io.cnt, round(io.cnt/(&v_minutes*60),2) aas, round(io.cnt/(&v_minutes*60),2) aas, io.event, io.event, io.p1 p1, io.p1 p1, f.tablespace_namef.tablespace_namefrom ( selectfrom ( select count(*) cnt,count(*) cnt, substr(event,0,25) event,substr(event,0,25) event, ash.p1 p1ash.p1 p1 from v$active_session_history ashfrom v$active_session_history ash where ( event like 'db file s%' or event like 'direct%' )where ( event like 'db file s%' or event like 'direct%' ) and sample_time > sysdate - &v_minutes/(60*24)and sample_time > sysdate - &v_minutes/(60*24) group by group by event , event , ash.p1ash.p1 ) io,) io, dba_data_files fdba_data_files fwhere where f.file_id = io.p1f.file_id = io.p1Order by io.cnt ;Order by io.cnt ;
CNT AAS EVENT P1 TABLESPACECNT AAS EVENT P1 TABLESPACE
---- --- ----------------------- --- -------------- --- ----------------------- --- ----------
1 .00 db file sequential read 1 SYSTEM1 .00 db file sequential read 1 SYSTEM 2 .00 db file sequential read 3 SYSAUX2 .00 db file sequential read 3 SYSAUX 38 .06 db file sequential read 6 SOE38 .06 db file sequential read 6 SOE 179 .30 db file sequential read 7 SOEINDEX179 .30 db file sequential read 7 SOEINDEX
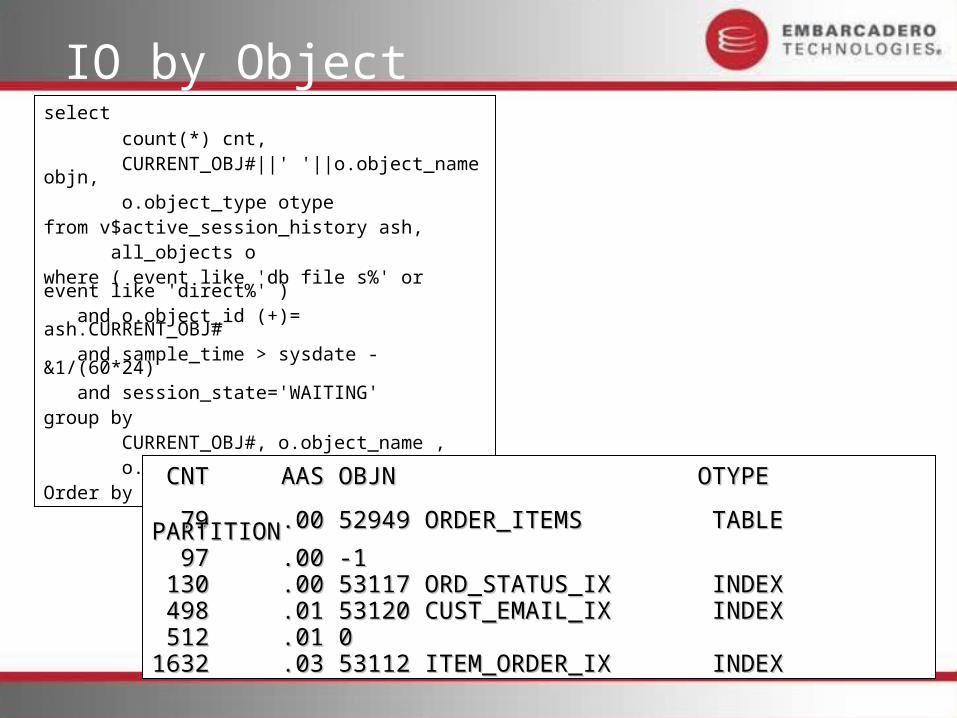
IO by Objectselect
count(*) cnt, CURRENT_OBJ#||' '||o.object_name objn, o.object_type otypefrom v$active_session_history ash, all_objects owhere ( event like 'db file s%' or event like 'direct%' ) and o.object_id (+)= ash.CURRENT_OBJ# and sample_time > sysdate - &1/(60*24) and session_state='WAITING'group by CURRENT_OBJ#, o.object_name , o.object_type Order by count(*)
CNT AAS OBJN OTYPECNT AAS OBJN OTYPE
---- ------- ------------------------- ---- ------- ------------------------- ------------------------------
79 .00 52949 ORDER_ITEMS TABLE 79 .00 52949 ORDER_ITEMS TABLE PARTITIONPARTITION 97 .00 -197 .00 -1 130 .00 53117 ORD_STATUS_IX INDEX130 .00 53117 ORD_STATUS_IX INDEX 498 .01 53120 CUST_EMAIL_IX INDEX498 .01 53120 CUST_EMAIL_IX INDEX 512 .01 0512 .01 01632 .03 53112 ITEM_ORDER_IX INDEX1632 .03 53112 ITEM_ORDER_IX INDEX
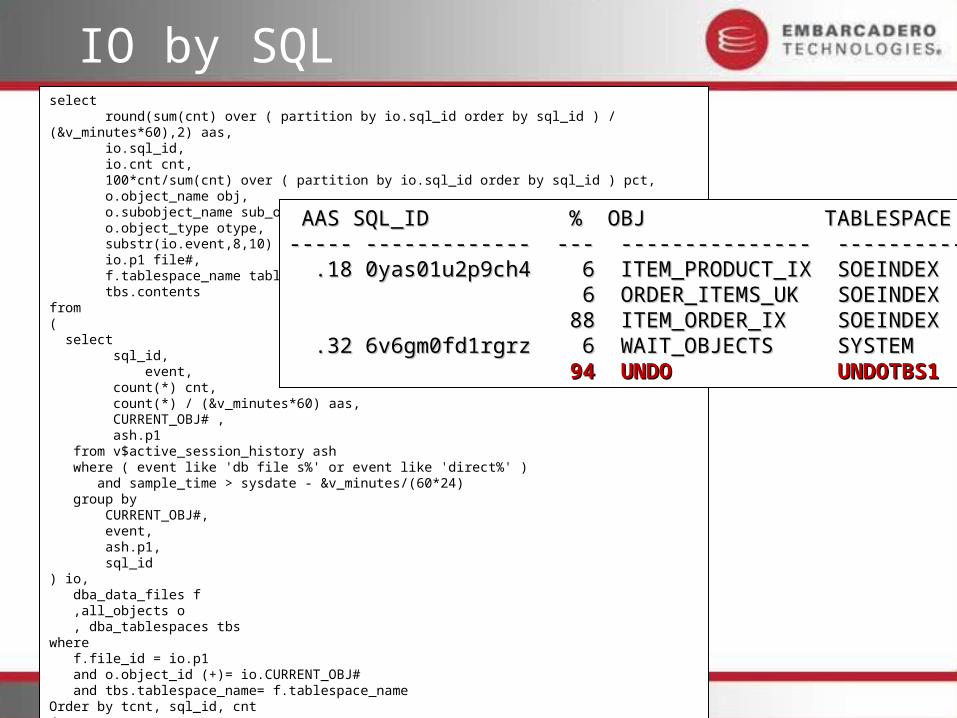
IO by SQL select round(sum(cnt) over ( partition by io.sql_id order by sql_id ) / (&v_minutes*60),2) aas, io.sql_id, io.cnt cnt, 100*cnt/sum(cnt) over ( partition by io.sql_id order by sql_id ) pct, o.object_name obj, o.subobject_name sub_obj, o.object_type otype, substr(io.event,8,10) event, io.p1 file#, f.tablespace_name tablespace_name, tbs.contentsfrom ( select sql_id,
event, count(*) cnt, count(*) / (&v_minutes*60) aas, CURRENT_OBJ# , ash.p1 from v$active_session_history ash where ( event like 'db file s%' or event like 'direct%' ) and sample_time > sysdate - &v_minutes/(60*24) group by CURRENT_OBJ#, event, ash.p1, sql_id) io, dba_data_files f ,all_objects o , dba_tablespaces tbswhere f.file_id = io.p1 and o.object_id (+)= io.CURRENT_OBJ# and tbs.tablespace_name= f.tablespace_name Order by tcnt, sql_id, cnt/
AAS SQL_ID % OBJ TABLESPACEAAS SQL_ID % OBJ TABLESPACE----- ------------- --- --------------- --------------- ------------- --- --------------- ---------- .18 0yas01u2p9ch4 6 ITEM_PRODUCT_IX SOEINDEX.18 0yas01u2p9ch4 6 ITEM_PRODUCT_IX SOEINDEX 6 ORDER_ITEMS_UK SOEINDEX 6 ORDER_ITEMS_UK SOEINDEX 88 ITEM_ORDER_IX SOEINDEX88 ITEM_ORDER_IX SOEINDEX .32 6v6gm0fd1rgrz 6 WAIT_OBJECTS SYSTEM.32 6v6gm0fd1rgrz 6 WAIT_OBJECTS SYSTEM 94 UNDO UNDOTBS194 UNDO UNDOTBS1
Copyright 2006 Kyle Hailey
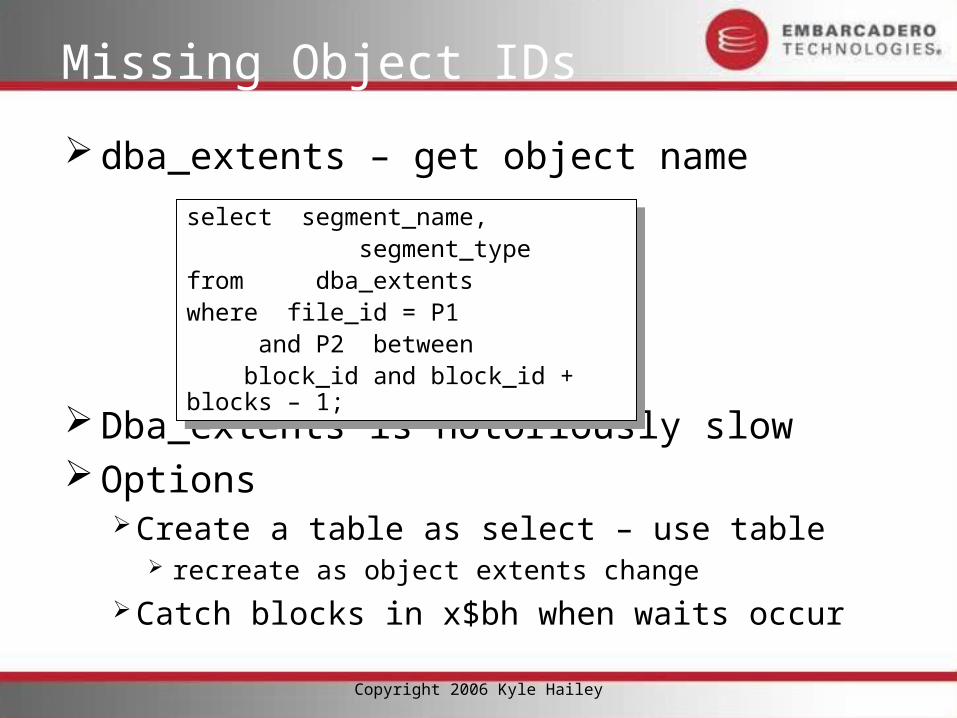
Missing Object IDs
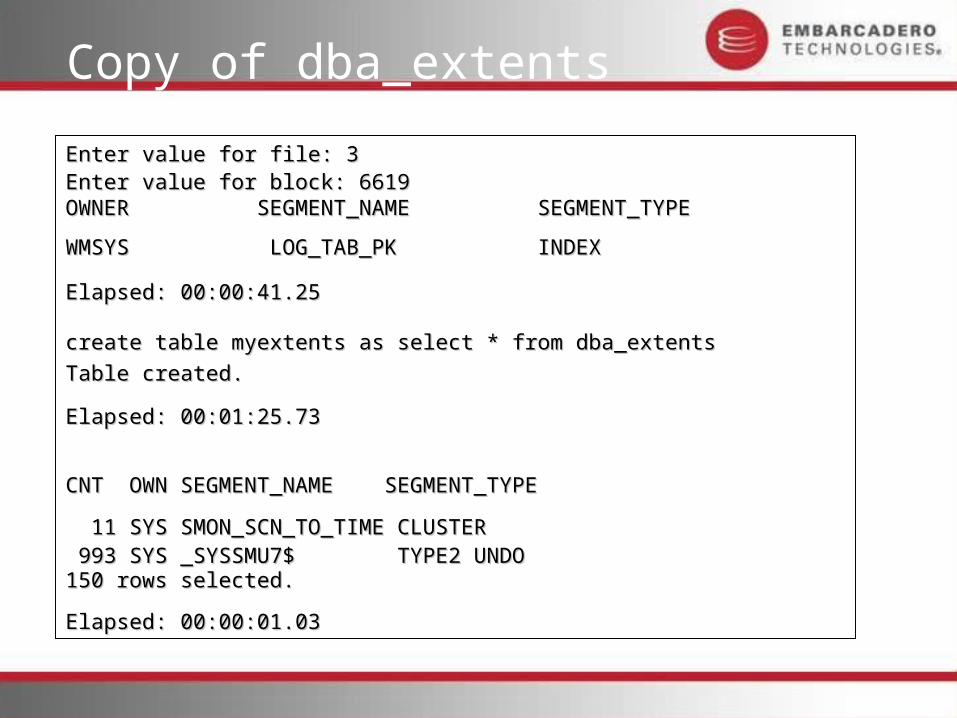
dba_extents – get object name
Dba_extents is notoriously slow Options
Create a table as select – use table recreate as object extents change
Catch blocks in x$bh when waits occur
select segment_name, segment_typefrom dba_extents where file_id = P1 and P2 between block_id and block_id + blocks – 1;
select segment_name, segment_typefrom dba_extents where file_id = P1 and P2 between block_id and block_id + blocks – 1;
Copy of dba_extents
Enter value for file: 3Enter value for file: 3Enter value for block: 6619Enter value for block: 6619OWNER SEGMENT_NAME SEGMENT_TYPEOWNER SEGMENT_NAME SEGMENT_TYPE
--------------- -------------------- --------------------------------- -------------------- ------------------
WMSYS LOG_TAB_PK INDEXWMSYS LOG_TAB_PK INDEX
Elapsed: 00:00:41.25Elapsed: 00:00:41.25
create table myextents as select * from dba_extentscreate table myextents as select * from dba_extents
Table created.Table created.
Elapsed: 00:01:25.73Elapsed: 00:01:25.73
CNT OWN SEGMENT_NAME SEGMENT_TYPECNT OWN SEGMENT_NAME SEGMENT_TYPE
--- ---- ---------------- ------------ --- ---- ---------------- ------------
11 SYS SMON_SCN_TO_TIME CLUSTER11 SYS SMON_SCN_TO_TIME CLUSTER 993 SYS _SYSSMU7$ TYPE2 UNDO993 SYS _SYSSMU7$ TYPE2 UNDO150 rows selected.150 rows selected.
Elapsed: 00:00:01.03Elapsed: 00:00:01.03
Copyright 2006 Kyle Hailey
IO Solutions
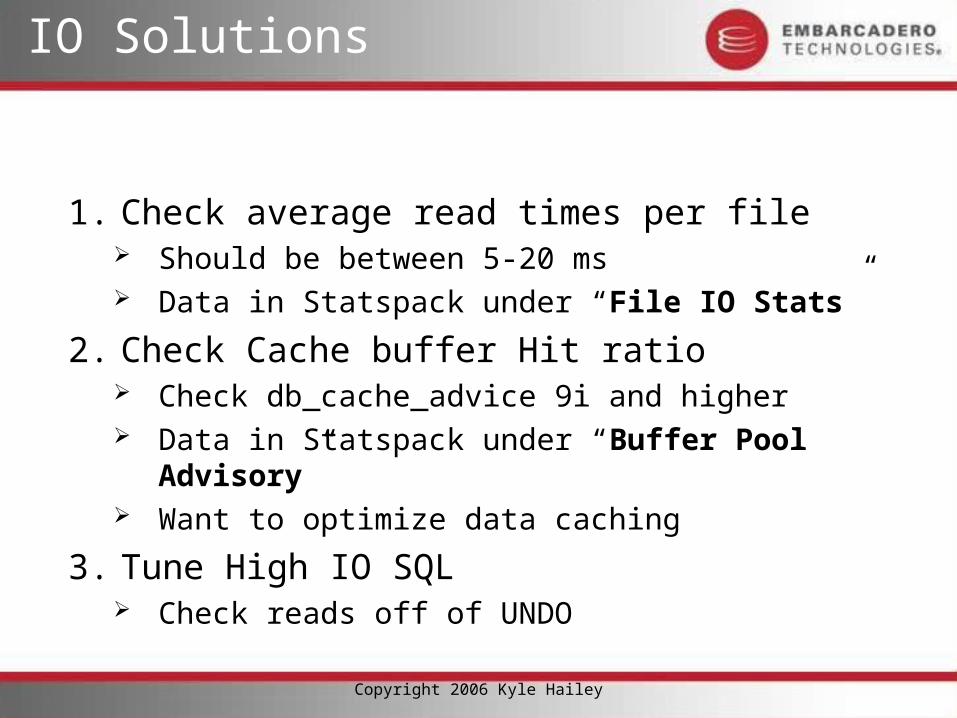
1. Check average read times per file Should be between 5-20 ms Data in Statspack under “File IO Stats”
2. Check Cache buffer Hit ratio Check db_cache_advice 9i and higher Data in Statspack under “Buffer Pool Advisory” Want to optimize data caching
3. Tune High IO SQL Check reads off of UNDO
Copyright 2006 Kyle Hailey
Step 1a: Ave Read Time
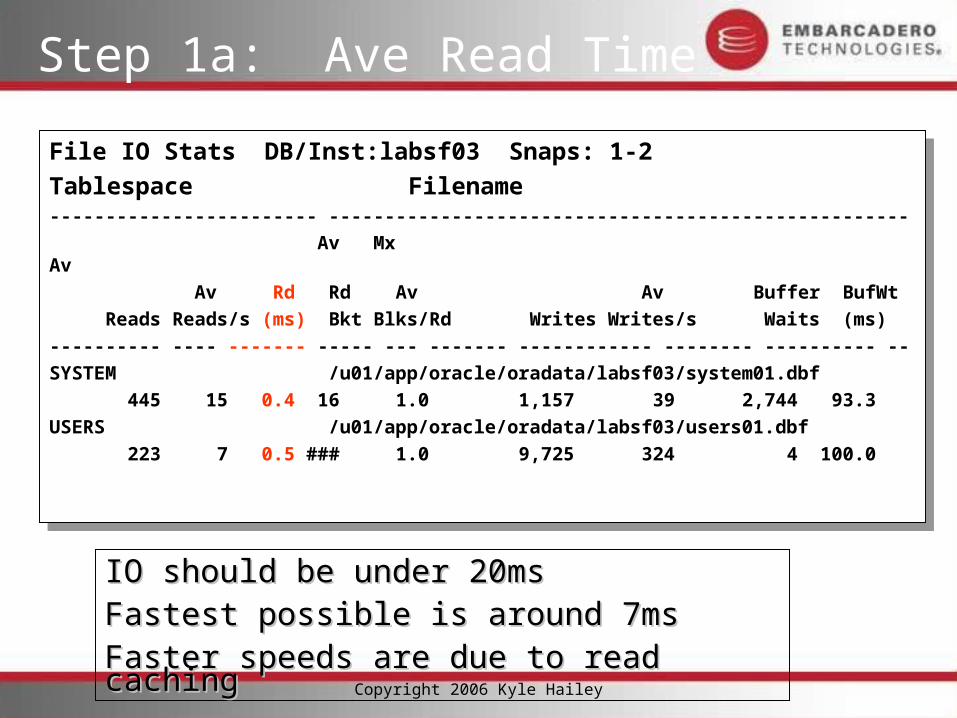
File IO Stats DB/Inst:labsf03 Snaps: 1-2
Tablespace Filename------------------------ ----------------------------------------------------
Av Mx Av
Av Rd Rd Av Av Buffer BufWt
Reads Reads/s (ms) Bkt Blks/Rd Writes Writes/s Waits (ms)
---------- ---- ------- ----- --- ------- ------------ -------- ---------- --
SYSTEM /u01/app/oracle/oradata/labsf03/system01.dbf
445 15 0.4 16 1.0 1,157 39 2,744 93.3
USERS /u01/app/oracle/oradata/labsf03/users01.dbf
223 7 0.5 ### 1.0 9,725 324 4 100.0
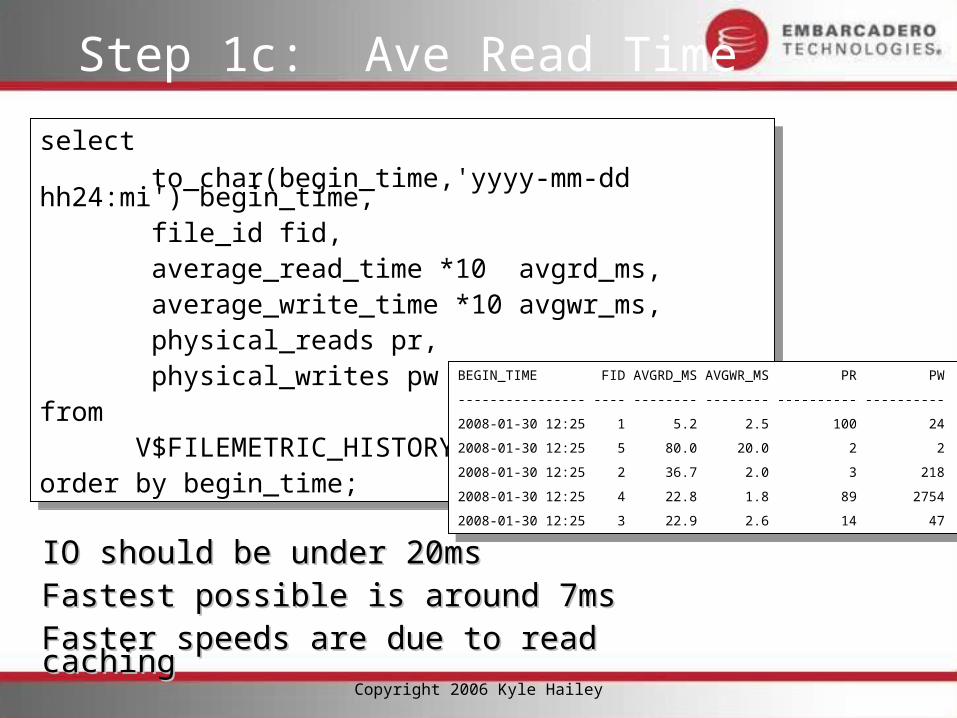
IO should be under 20msIO should be under 20msFastest possible is around 7msFastest possible is around 7msFaster speeds are due to read cachingFaster speeds are due to read caching
Copyright 2006 Kyle Hailey
Step 1b: Ave Read Time
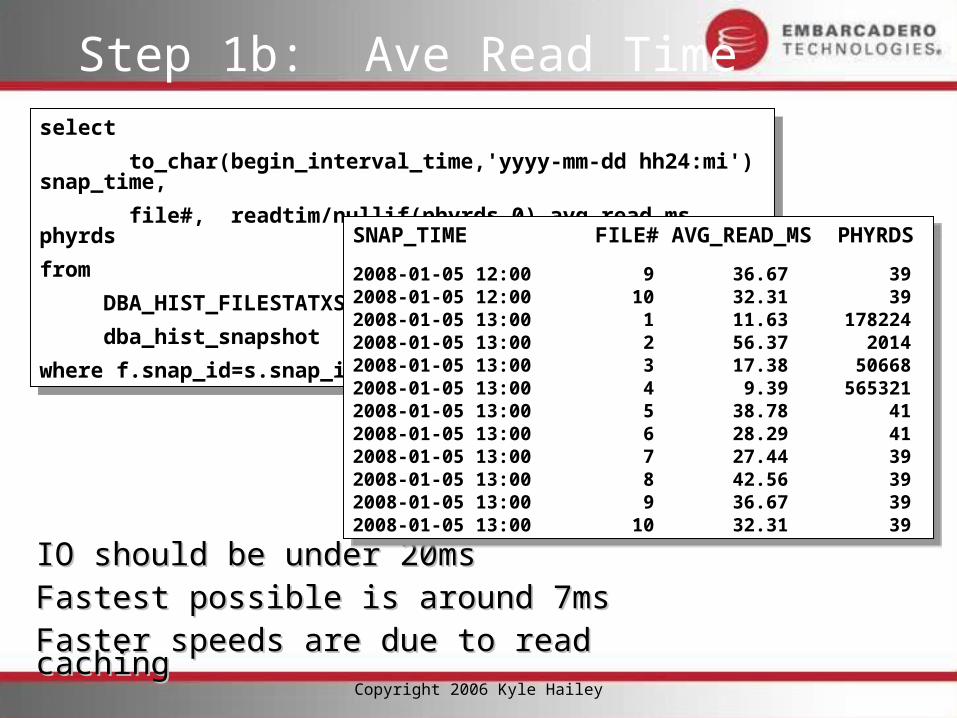
IO should be under 20msIO should be under 20msFastest possible is around 7msFastest possible is around 7msFaster speeds are due to read cachingFaster speeds are due to read caching
select
to_char(begin_interval_time,'yyyy-mm-dd hh24:mi') snap_time,
file#, readtim/nullif(phyrds,0) avg_read_ms, phyrds
from
DBA_HIST_FILESTATXS f,
dba_hist_snapshot s
where f.snap_id=s.snap_id ;
select
to_char(begin_interval_time,'yyyy-mm-dd hh24:mi') snap_time,
file#, readtim/nullif(phyrds,0) avg_read_ms, phyrds
from
DBA_HIST_FILESTATXS f,
dba_hist_snapshot s
where f.snap_id=s.snap_id ;
SNAP_TIME FILE# AVG_READ_MS PHYRDS
---------------- ---------- ----------- ----
2008-01-05 12:00 9 36.67 392008-01-05 12:00 10 32.31 392008-01-05 13:00 1 11.63 1782242008-01-05 13:00 2 56.37 20142008-01-05 13:00 3 17.38 506682008-01-05 13:00 4 9.39 5653212008-01-05 13:00 5 38.78 412008-01-05 13:00 6 28.29 412008-01-05 13:00 7 27.44 392008-01-05 13:00 8 42.56 392008-01-05 13:00 9 36.67 392008-01-05 13:00 10 32.31 39
Copyright 2006 Kyle Hailey
Step 1c: Ave Read Time
IO should be under 20msIO should be under 20msFastest possible is around 7msFastest possible is around 7msFaster speeds are due to read cachingFaster speeds are due to read caching
select
to_char(begin_time,'yyyy-mm-dd hh24:mi') begin_time, file_id fid, average_read_time *10 avgrd_ms, average_write_time *10 avgwr_ms, physical_reads pr, physical_writes pwfrom V$FILEMETRIC_HISTORY forder by begin_time;
select
to_char(begin_time,'yyyy-mm-dd hh24:mi') begin_time, file_id fid, average_read_time *10 avgrd_ms, average_write_time *10 avgwr_ms, physical_reads pr, physical_writes pwfrom V$FILEMETRIC_HISTORY forder by begin_time;
BEGIN_TIME FID AVGRD_MS AVGWR_MS PR PW
---------------- ---- -------- -------- ---------- ----------
2008-01-30 12:25 1 5.2 2.5 100 24
2008-01-30 12:25 5 80.0 20.0 2 2
2008-01-30 12:25 2 36.7 2.0 3 218
2008-01-30 12:25 4 22.8 1.8 89 2754
2008-01-30 12:25 3 22.9 2.6 14 47
BEGIN_TIME FID AVGRD_MS AVGWR_MS PR PW
---------------- ---- -------- -------- ---------- ----------
2008-01-30 12:25 1 5.2 2.5 100 24
2008-01-30 12:25 5 80.0 20.0 2 2
2008-01-30 12:25 2 36.7 2.0 3 218
2008-01-30 12:25 4 22.8 1.8 89 2754
2008-01-30 12:25 3 22.9 2.6 14 47
Step1 & OEM
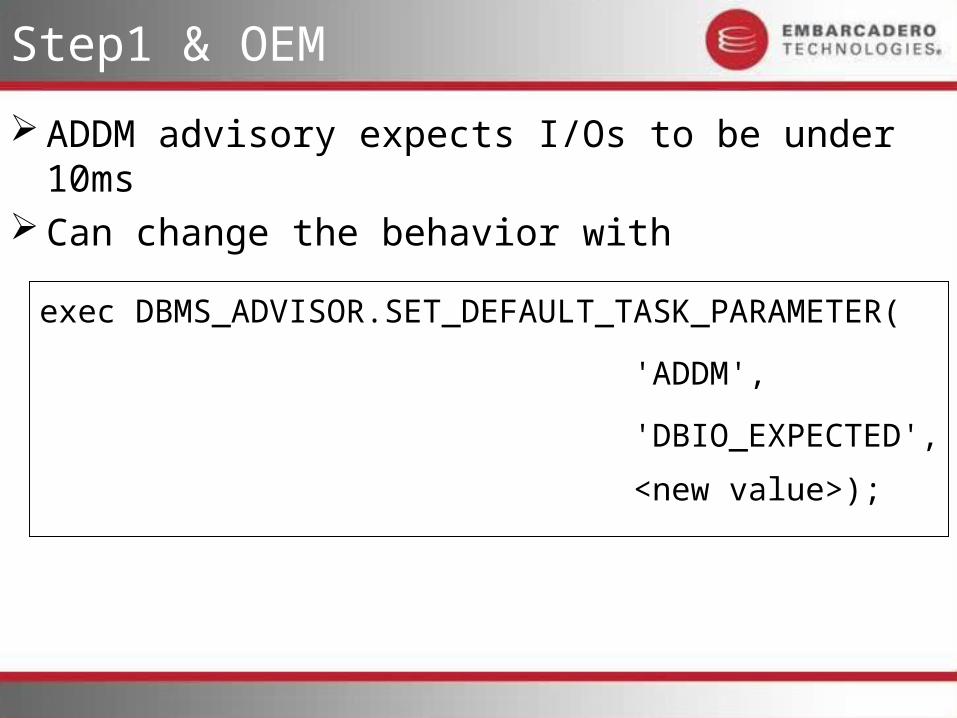
ADDM advisory expects I/Os to be under 10ms Can change the behavior with
exec DBMS_ADVISOR.SET_DEFAULT_TASK_PARAMETER(
'ADDM',
'DBIO_EXPECTED',
<new value>);
Copyright 2006 Kyle Hailey
Step 2 : Buffer Pool Advisory
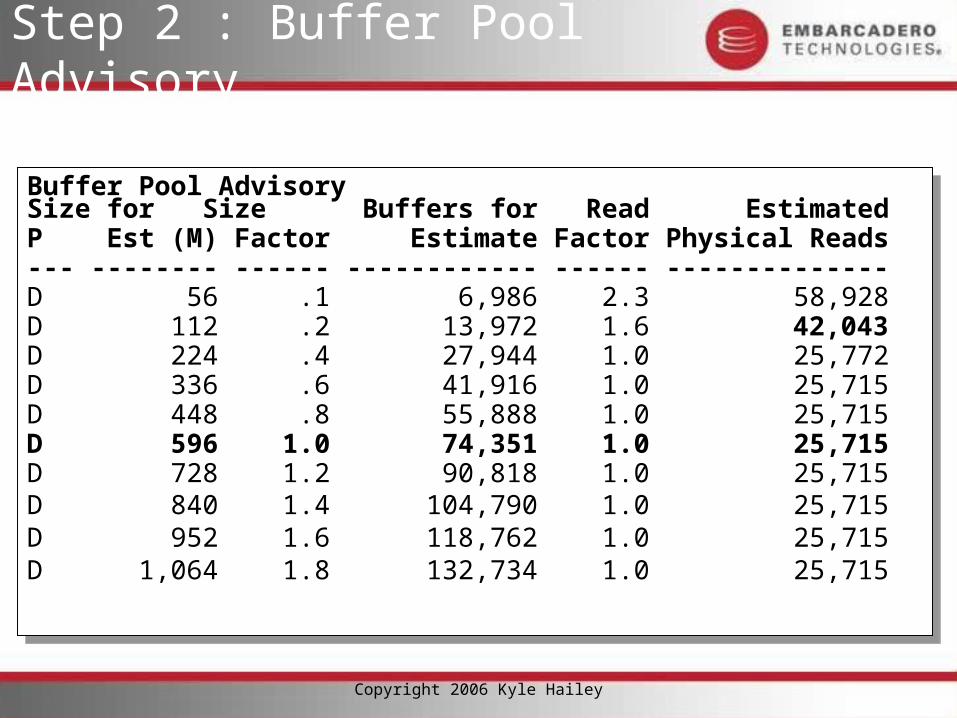
Buffer Pool Advisory Size for Size Buffers for Read EstimatedP Est (M) Factor Estimate Factor Physical Reads--- -------- ------ ------------ ------ --------------D 56 .1 6,986 2.3 58,928D 112 .2 13,972 1.6 42,043D 224 .4 27,944 1.0 25,772D 336 .6 41,916 1.0 25,715D 448 .8 55,888 1.0 25,715D 596 1.0 74,351 1.0 25,715D 728 1.2 90,818 1.0 25,715D 840 1.4 104,790 1.0 25,715D 952 1.6 118,762 1.0 25,715D 1,064 1.8 132,734 1.0 25,715
Buffer Pool Advisory Size for Size Buffers for Read EstimatedP Est (M) Factor Estimate Factor Physical Reads--- -------- ------ ------------ ------ --------------D 56 .1 6,986 2.3 58,928D 112 .2 13,972 1.6 42,043D 224 .4 27,944 1.0 25,772D 336 .6 41,916 1.0 25,715D 448 .8 55,888 1.0 25,715D 596 1.0 74,351 1.0 25,715D 728 1.2 90,818 1.0 25,715D 840 1.4 104,790 1.0 25,715D 952 1.6 118,762 1.0 25,715D 1,064 1.8 132,734 1.0 25,715
Copyright 2006 Kyle Hailey
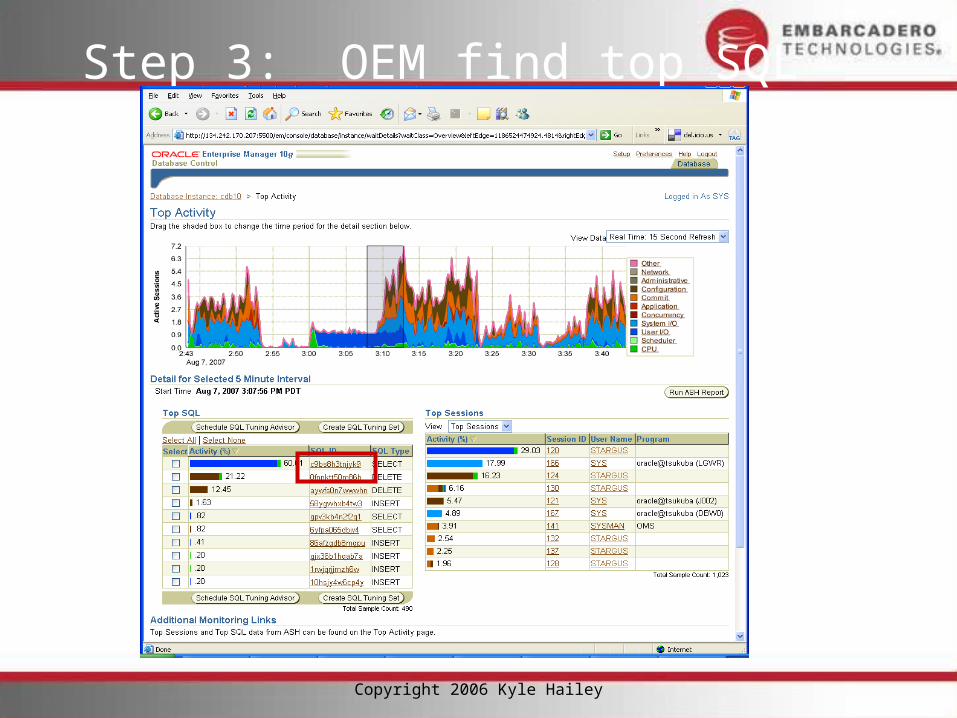
Step 3: Find Top I/O SQL
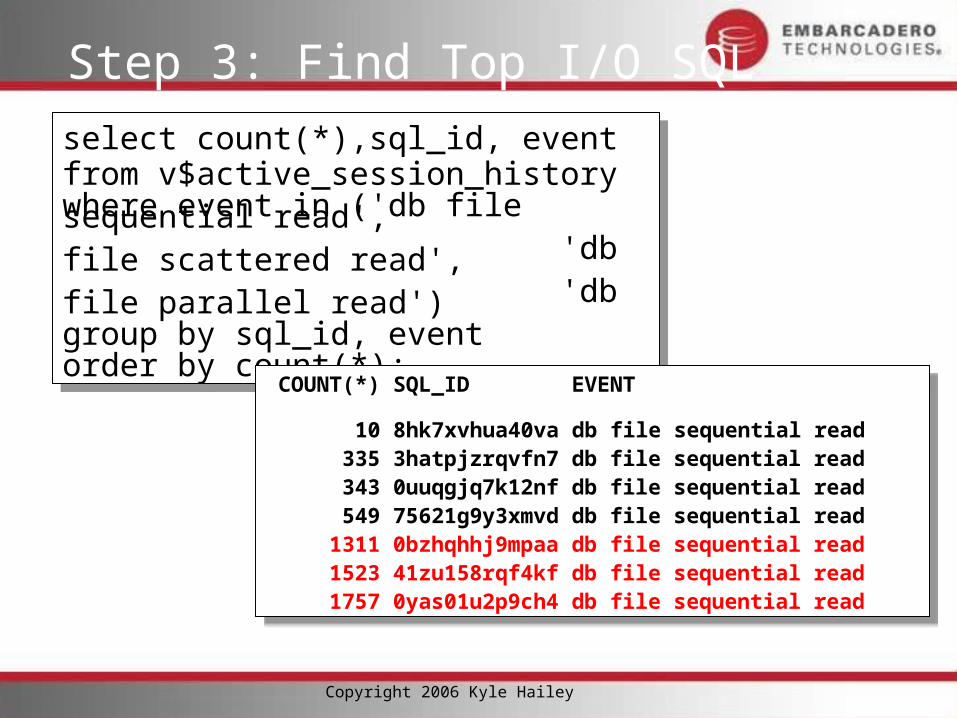
select count(*),sql_id, event from v$active_session_historywhere event in ('db file sequential read', 'db file scattered read', 'db file parallel read')group by sql_id, eventorder by count(*);
select count(*),sql_id, event from v$active_session_historywhere event in ('db file sequential read', 'db file scattered read', 'db file parallel read')group by sql_id, eventorder by count(*);
COUNT(*) SQL_ID EVENT
--------- ------------- ------------------------
10 8hk7xvhua40va db file sequential read 335 3hatpjzrqvfn7 db file sequential read 343 0uuqgjq7k12nf db file sequential read 549 75621g9y3xmvd db file sequential read 1311 0bzhqhhj9mpaa db file sequential read 1523 41zu158rqf4kf db file sequential read 1757 0yas01u2p9ch4 db file sequential read
Copyright 2006 Kyle Hailey
Step 3: OEM find top SQL
Copyright 2006 Kyle Hailey
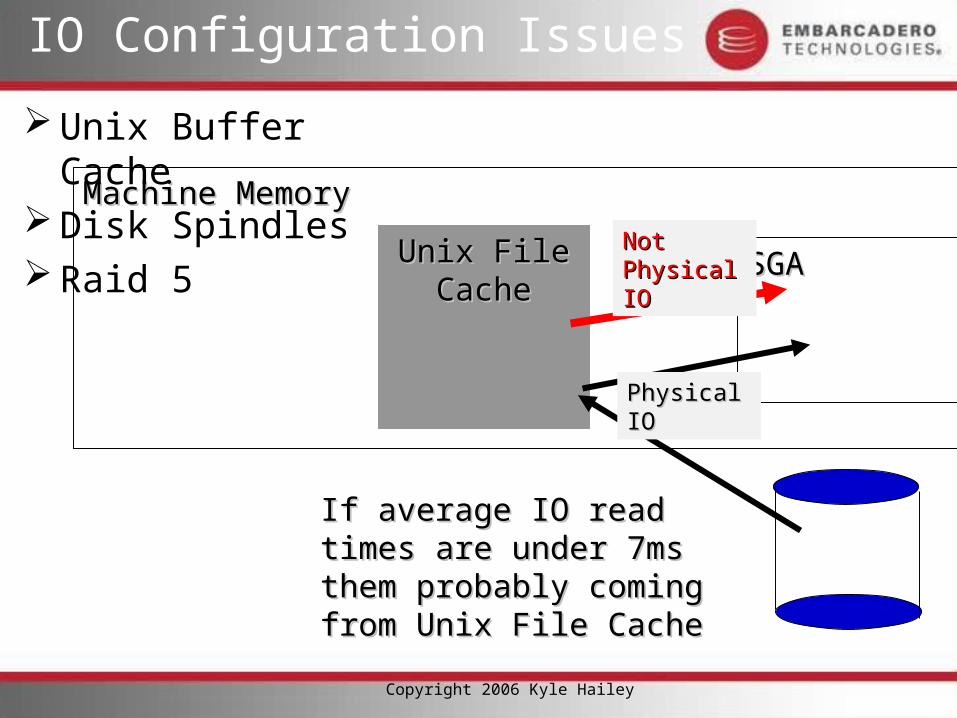
Machine Memory Machine Memory
IO Configuration Issues
SGA SGA Unix File Unix File CacheCache
If average IO read times If average IO read times are under 7ms them are under 7ms them probably coming from Unix probably coming from Unix File CacheFile Cache
Unix Buffer Cache Disk Spindles Raid 5 Not Not
Physical IOPhysical IO
Physical IOPhysical IO
Copyright 2006 Kyle Hailey
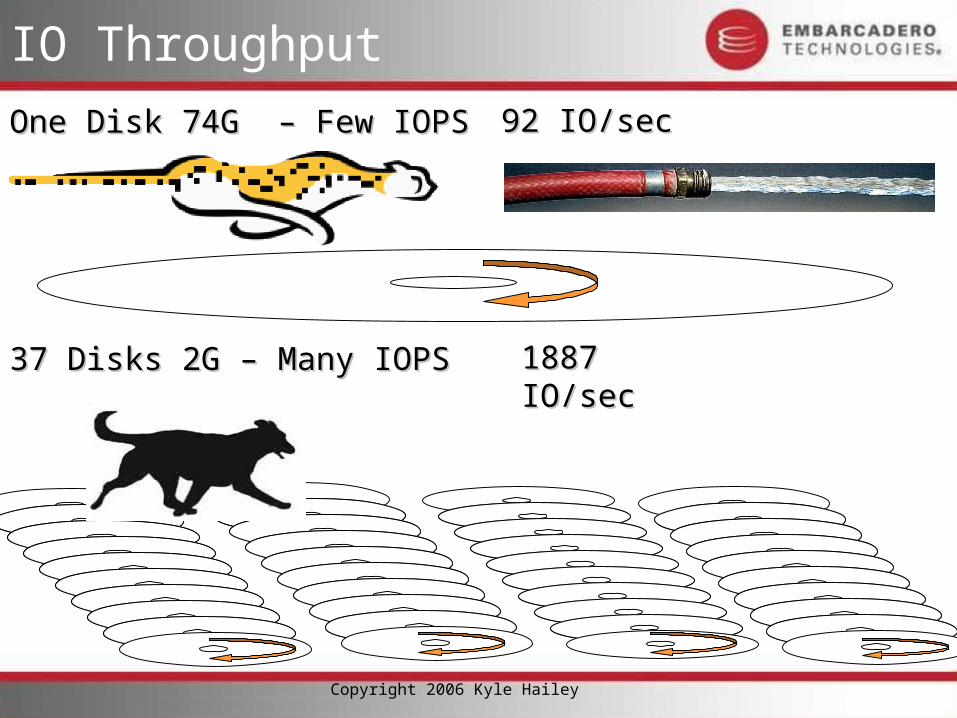
IO Throughput
One Disk 74G – Few IOPSOne Disk 74G – Few IOPS
37 Disks 2G – Many IOPS37 Disks 2G – Many IOPS
92 IO/sec92 IO/sec
1887 IO/sec1887 IO/sec
Copyright 2006 Kyle Hailey
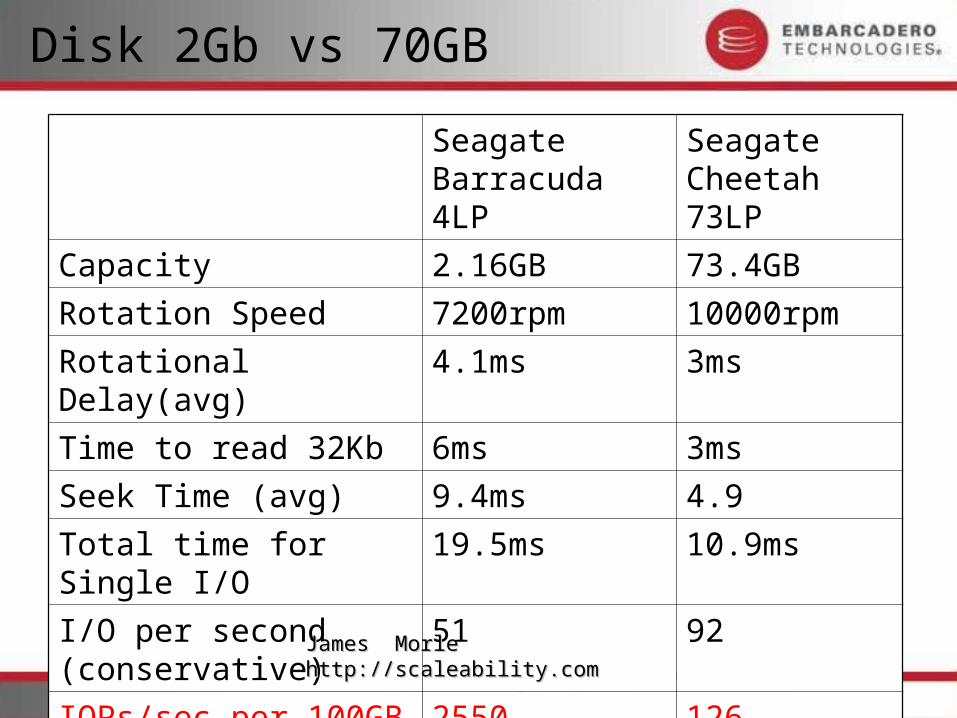
Disk 2Gb vs 70GB
Seagate Barracuda 4LP
Seagate Cheetah 73LP
Capacity 2.16GB 73.4GB
Rotation Speed 7200rpm 10000rpm
Rotational Delay(avg) 4.1ms 3ms
Time to read 32Kb 6ms 3ms
Seek Time (avg) 9.4ms 4.9
Total time for Single I/O 19.5ms 10.9ms
I/O per second (conservative)
51 92
IOPs/sec per 100GB 2550 126James Morle http://scaleability.com James Morle http://scaleability.com
Copyright 2006 Kyle Hailey
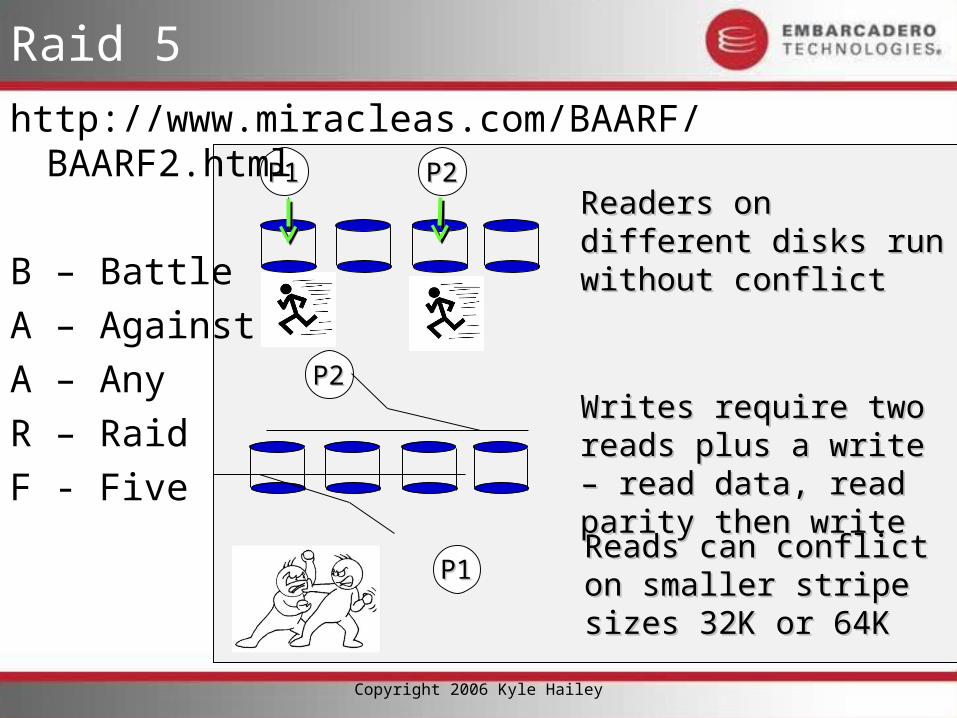
Raid 5
P1P1 P2P2
P1P1
P2P2Writes require two reads Writes require two reads plus a write – read data, plus a write – read data, read parity then writeread parity then write
Reads can conflict on Reads can conflict on smaller stripe sizes 32K smaller stripe sizes 32K or 64Kor 64K
Readers on different Readers on different disks run without conflictdisks run without conflict
http://www.miracleas.com/BAARF/BAARF2.html
B – Battle
A – Against
A – Any
R – Raid
F - Five
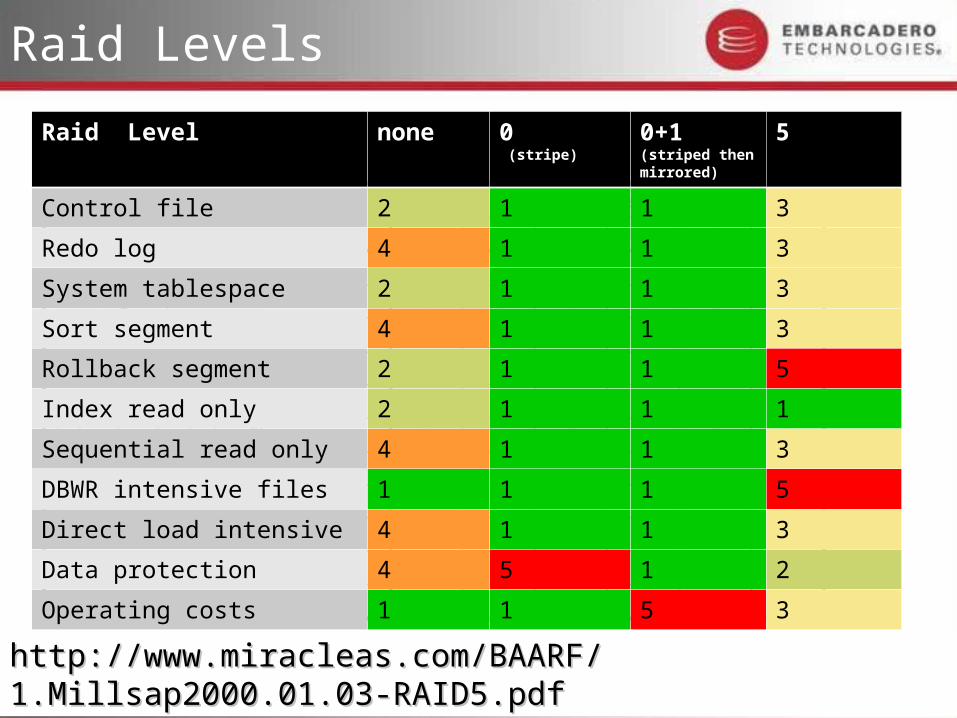
Raid Levels
Copyright 2006 Kyle Hailey
http://www.miracleas.com/BAARF/1.Millsap2000.01.03-RAID5.pdfhttp://www.miracleas.com/BAARF/1.Millsap2000.01.03-RAID5.pdf
Raid Level none 0 (stripe)
0+1(striped then mirrored)
5
Control file 2 1 1 3
Redo log 4 1 1 3
System tablespace 2 1 1 3
Sort segment 4 1 1 3
Rollback segment 2 1 1 5
Index read only 2 1 1 1
Sequential read only 4 1 1 3
DBWR intensive files 1 1 1 5
Direct load intensive 4 1 1 3
Data protection 4 5 1 2
Operating costs 1 1 5 3
Copyright 2006 Kyle Hailey
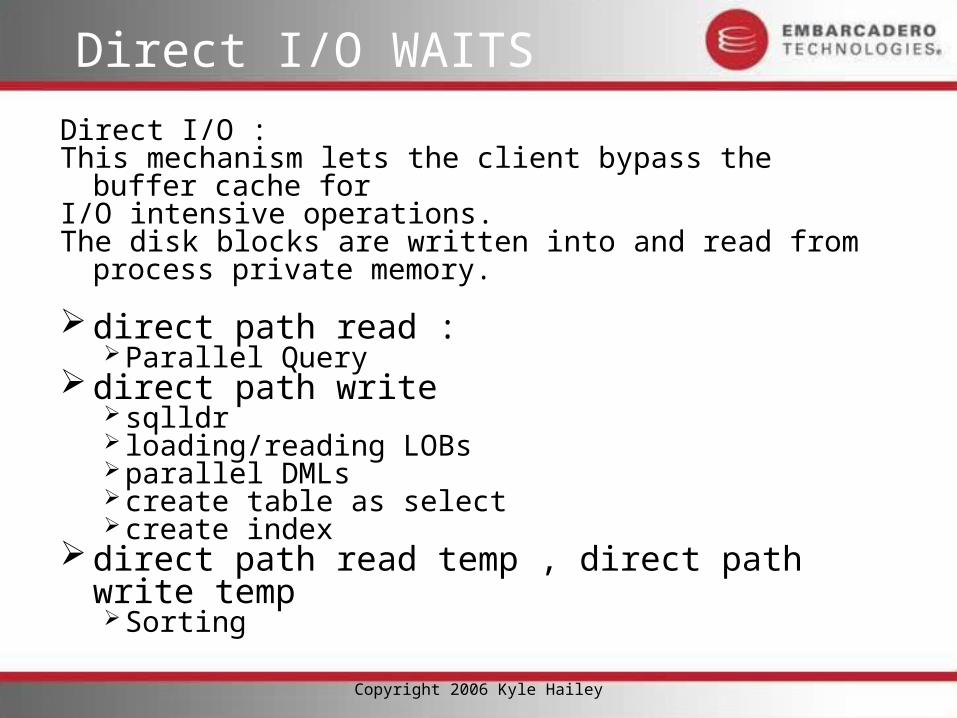
Direct I/O WAITS
Direct I/O : This mechanism lets the client bypass the buffer cache forI/O intensive operations. The disk blocks are written into and read from process
private memory.
direct path read :Parallel Query
direct path writesqlldr loading/reading LOBsparallel DMLscreate table as select create index
direct path read temp , direct path write tempSorting
Copyright 2006 Kyle Hailey
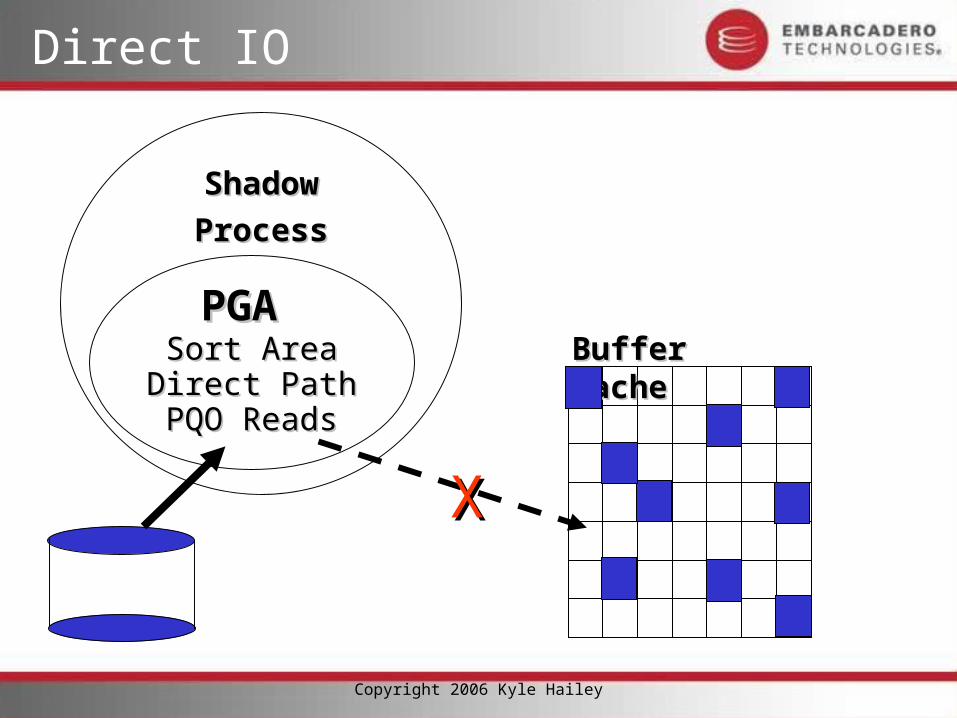
Direct IO
ShadowShadow
ProcessProcess
Buffer CacheBuffer CachePGA PGA
Sort AreaSort AreaDirect PathDirect PathPQO ReadsPQO Reads
XX
Copyright 2006 Kyle Hailey
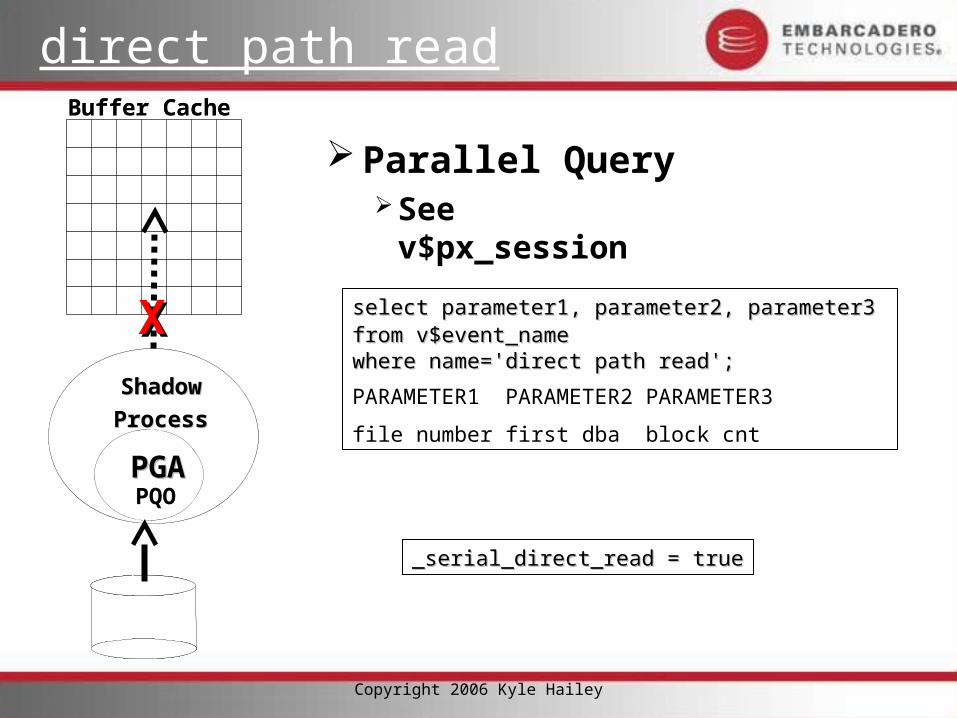
direct path read
_serial_direct_read = true_serial_direct_read = true
Buffer CacheBuffer CacheBuffer CacheBuffer Cache
ShadowShadow
ProcessProcess
PGAPGAPQO
ShadowShadow
ProcessProcess
PGAPGAPQO
XX
Parallel QuerySee v$px_session
select parameter1, parameter2, parameter3 select parameter1, parameter2, parameter3 from v$event_namefrom v$event_namewhere name='direct path read';where name='direct path read';
PARAMETER1 PARAMETER2 PARAMETER3
---------- ---------- ----------
file number first dba block cnt
Copyright 2006 Kyle Hailey
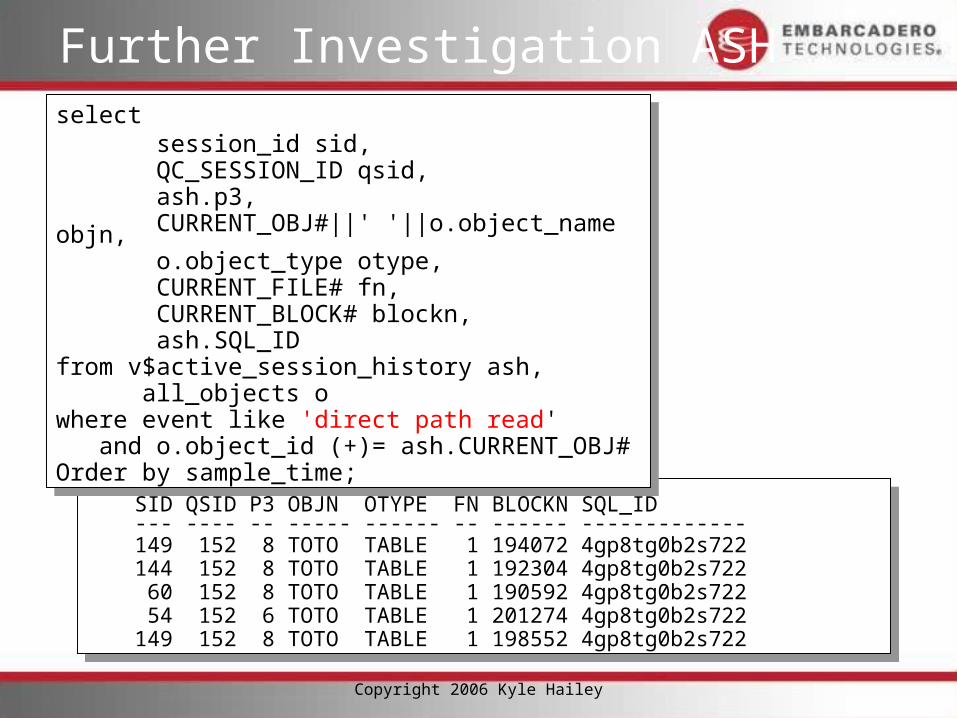
Further Investigation ASH
SID QSID P3 OBJN OTYPE FN BLOCKN SQL_ID--- ---- -- ----- ------ -- ------ -------------149 152 8 TOTO TABLE 1 194072 4gp8tg0b2s722144 152 8 TOTO TABLE 1 192304 4gp8tg0b2s722 60 152 8 TOTO TABLE 1 190592 4gp8tg0b2s722 54 152 6 TOTO TABLE 1 201274 4gp8tg0b2s722149 152 8 TOTO TABLE 1 198552 4gp8tg0b2s722
SID QSID P3 OBJN OTYPE FN BLOCKN SQL_ID--- ---- -- ----- ------ -- ------ -------------149 152 8 TOTO TABLE 1 194072 4gp8tg0b2s722144 152 8 TOTO TABLE 1 192304 4gp8tg0b2s722 60 152 8 TOTO TABLE 1 190592 4gp8tg0b2s722 54 152 6 TOTO TABLE 1 201274 4gp8tg0b2s722149 152 8 TOTO TABLE 1 198552 4gp8tg0b2s722
select session_id sid, QC_SESSION_ID qsid, ash.p3, CURRENT_OBJ#||' '||o.object_name objn, o.object_type otype, CURRENT_FILE# fn, CURRENT_BLOCK# blockn, ash.SQL_IDfrom v$active_session_history ash, all_objects owhere event like 'direct path read' and o.object_id (+)= ash.CURRENT_OBJ#Order by sample_time;
select session_id sid, QC_SESSION_ID qsid, ash.p3, CURRENT_OBJ#||' '||o.object_name objn, o.object_type otype, CURRENT_FILE# fn, CURRENT_BLOCK# blockn, ash.SQL_IDfrom v$active_session_history ash, all_objects owhere event like 'direct path read' and o.object_id (+)= ash.CURRENT_OBJ#Order by sample_time;
select
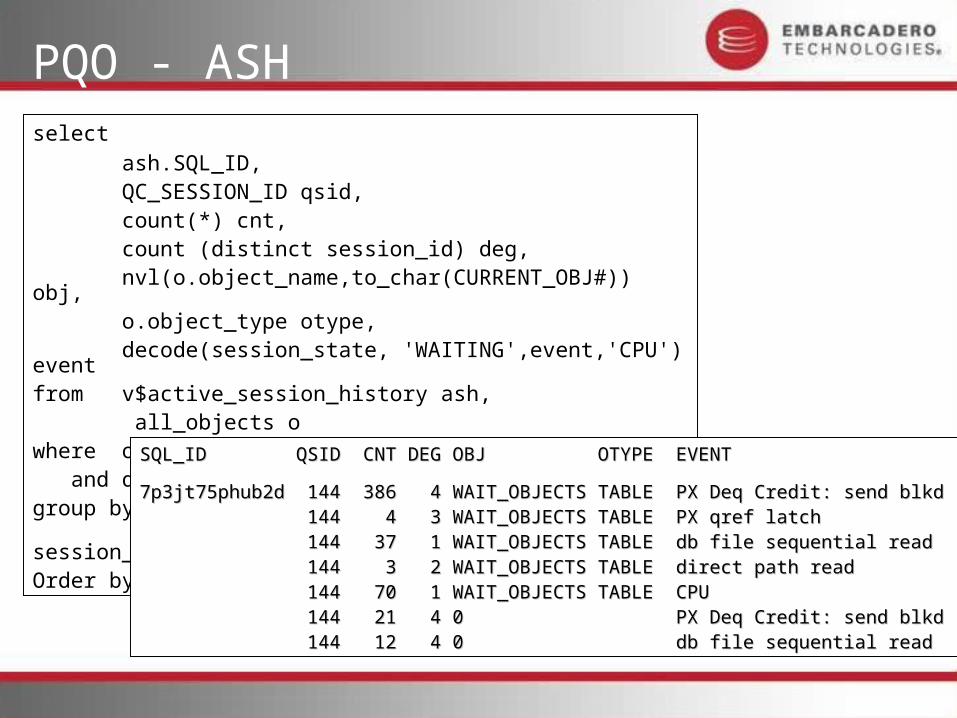
ash.SQL_ID, QC_SESSION_ID qsid, count(*) cnt, count (distinct session_id) deg, nvl(o.object_name,to_char(CURRENT_OBJ#)) obj, o.object_type otype, decode(session_state, 'WAITING',event,'CPU') eventfrom v$active_session_history ash, all_objects owhere o.object_id (+)= ash.CURRENT_OBJ# and qc_session_id is not nullgroup by qc_session_id, sql_id, o.object_name, o.object_type, CURRENT_OBJ#, event, session_stateOrder by qc_session_id, sql_id
PQO - ASH
SQL_ID QSID CNT DEG OBJ OTYPE EVENTSQL_ID QSID CNT DEG OBJ OTYPE EVENT
------------- ---- ---- --- ------------ ----- ------------- ---- ---- --- ------------ ----- ----------------------------------------------------
7p3jt75phub2d 144 386 4 WAIT_OBJECTS TABLE PX Deq Credit: send blkd7p3jt75phub2d 144 386 4 WAIT_OBJECTS TABLE PX Deq Credit: send blkd 144 4 3 WAIT_OBJECTS TABLE PX qref latch144 4 3 WAIT_OBJECTS TABLE PX qref latch 144 37 1 WAIT_OBJECTS TABLE db file sequential read144 37 1 WAIT_OBJECTS TABLE db file sequential read 144 3 2 WAIT_OBJECTS TABLE direct path read144 3 2 WAIT_OBJECTS TABLE direct path read 144 70 1 WAIT_OBJECTS TABLE CPU144 70 1 WAIT_OBJECTS TABLE CPU 144 21 4 0 PX Deq Credit: send blkd144 21 4 0 PX Deq Credit: send blkd 144 12 4 0 db file sequential read144 12 4 0 db file sequential read
Copyright 2006 Kyle Hailey
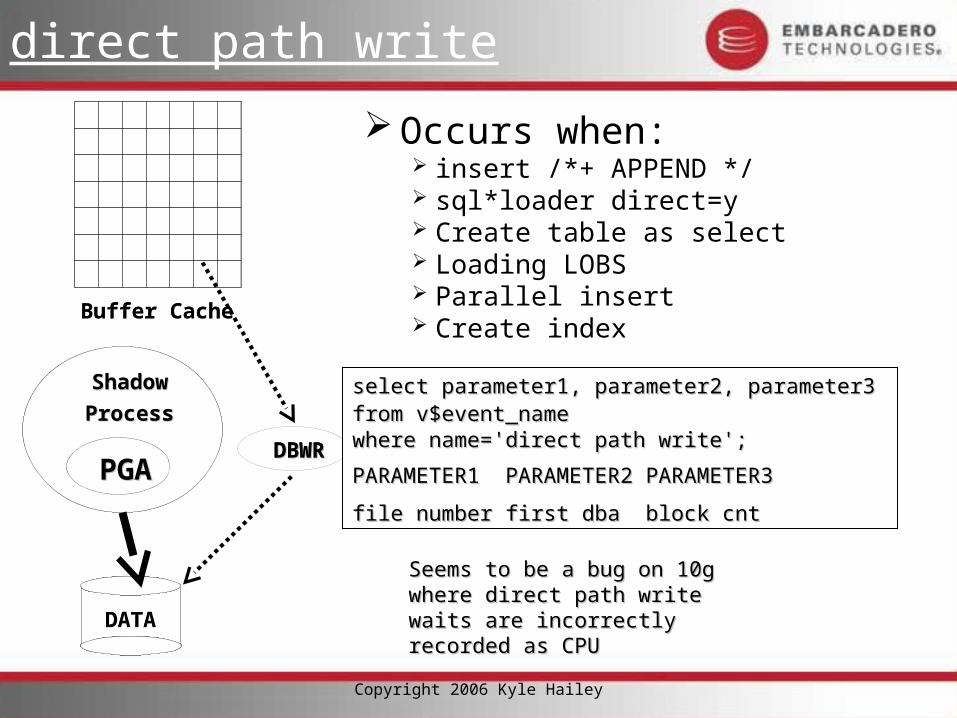
direct path write
Buffer CacheBuffer CacheBuffer CacheBuffer Cache
ShadowShadow
ProcessProcess
PGAPGA
ShadowShadow
ProcessProcess
PGAPGADBWRDBWRDBWRDBWR
DATADATADATADATA
Seems to be a bug on 10g where Seems to be a bug on 10g where direct path write waits are direct path write waits are incorrectly recorded as CPUincorrectly recorded as CPU
select parameter1, parameter2, parameter3 select parameter1, parameter2, parameter3 from v$event_namefrom v$event_namewhere name='direct path write';where name='direct path write';
PARAMETER1 PARAMETER2 PARAMETER3PARAMETER1 PARAMETER2 PARAMETER3
---------- ---------- -------------------- ---------- ----------
file number first dba block cntfile number first dba block cnt
Occurs when: insert /*+ APPEND */ sql*loader direct=y Create table as select Loading LOBS Parallel insert Create index
Copyright 2006 Kyle Hailey
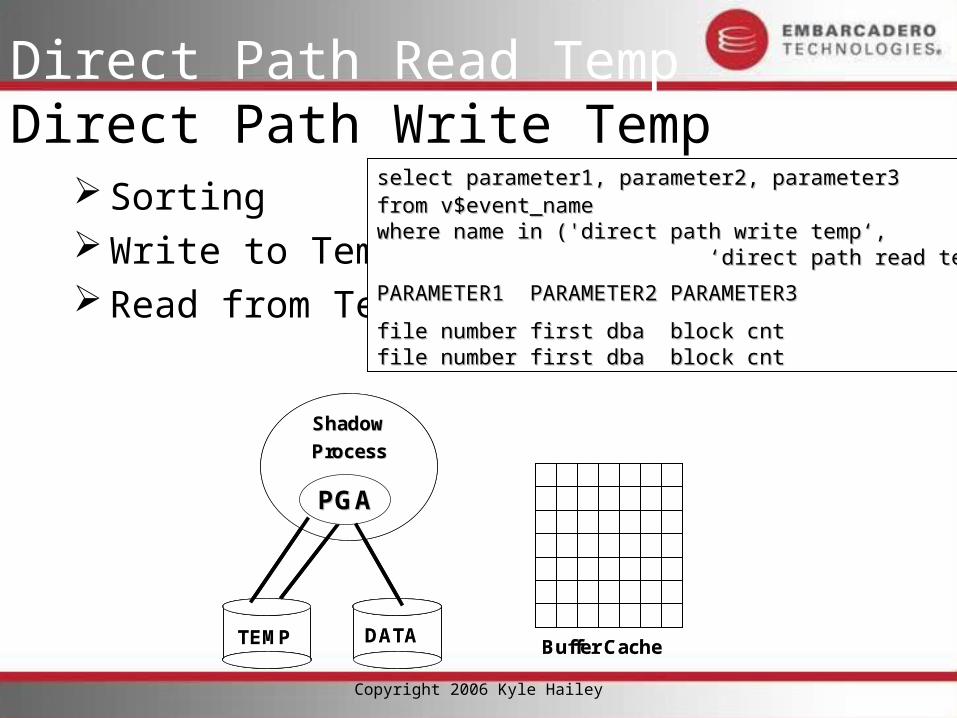
Direct Path Read TempDirect Path Write Temp
Sorting Write to Temp Read from Temp
ShadowShadow
ProcessProcess
Buffer CacheBuffer Cache
PGAPGA
TEMPTEMP DATADATA
ShadowShadow
ProcessProcess
Buffer CacheBuffer Cache
PGAPGA
TEMPTEMP DATADATA
select parameter1, parameter2, parameter3 select parameter1, parameter2, parameter3 from v$event_namefrom v$event_namewhere name in ('direct path write temp‘,where name in ('direct path write temp‘, ‘ ‘direct path read temp’);direct path read temp’);
PARAMETER1 PARAMETER2 PARAMETER3PARAMETER1 PARAMETER2 PARAMETER3
---------- ---------- -------------------- ---------- ----------
file number first dba block cntfile number first dba block cntfile number first dba block cntfile number first dba block cnt
Copyright 2006 Kyle Hailey
Direct Path Read TempDirect Path Write Temp
Buffer CacheBuffer CacheBuffer CacheBuffer Cache
ShadowShadow
ProcessProcess
PGAPGA
TEMPTEMP DATADATA
ShadowShadow
ProcessProcess
PGAPGA
TEMPTEMP DATADATA
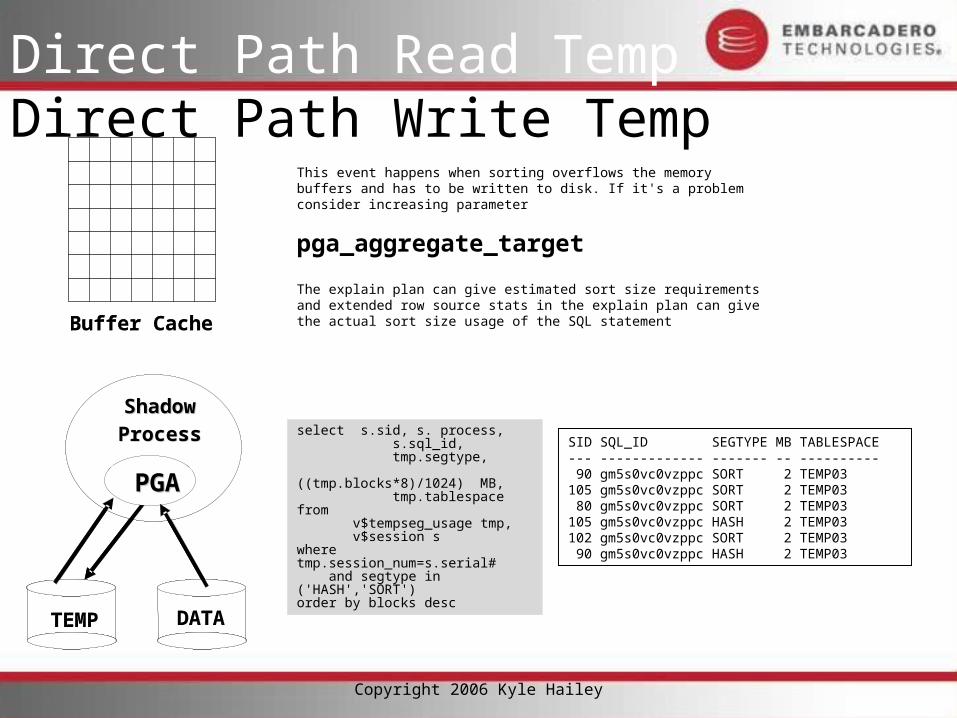
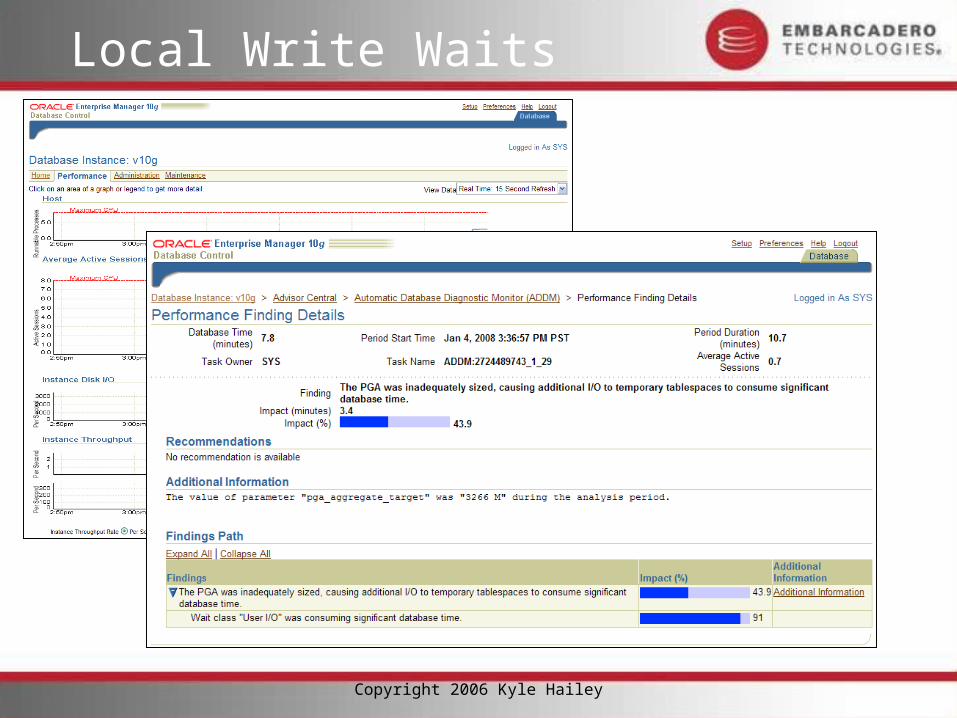
This event happens when sorting overflows the memory buffers and has to be written to disk. If it's a problem consider increasing parameter
pga_aggregate_target
The explain plan can give estimated sort size requirements and extended row source stats in the explain plan can give the actual sort size usage of the SQL statement
select s.sid, s. process, s.sql_id, tmp.segtype, ((tmp.blocks*8)/1024) MB, tmp.tablespacefrom v$tempseg_usage tmp, v$session swhere tmp.session_num=s.serial# and segtype in ('HASH','SORT')order by blocks desc
SID SQL_ID SEGTYPE MB TABLESPACE --- ------------- ------- -- ---------- 90 gm5s0vc0vzppc SORT 2 TEMP03105 gm5s0vc0vzppc SORT 2 TEMP03 80 gm5s0vc0vzppc SORT 2 TEMP03105 gm5s0vc0vzppc HASH 2 TEMP03102 gm5s0vc0vzppc SORT 2 TEMP03 90 gm5s0vc0vzppc HASH 2 TEMP03
PGA Aggregate Target
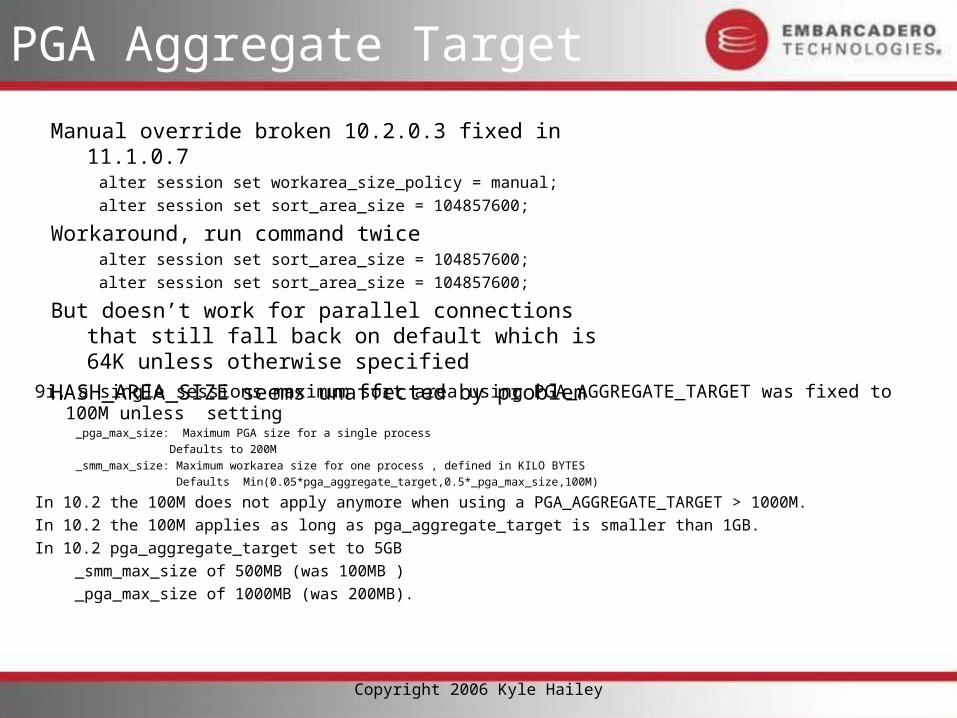
9i, a single sessions maximum sort area using PGA_AGGREGATE_TARGET was fixed to 100M unless setting
_pga_max_size: Maximum PGA size for a single process
Defaults to 200M
_smm_max_size: Maximum workarea size for one process , defined in KILO BYTES
Defaults Min(0.05*pga_aggregate_target,0.5*_pga_max_size,100M)
In 10.2 the 100M does not apply anymore when using a PGA_AGGREGATE_TARGET > 1000M.
In 10.2 the 100M applies as long as pga_aggregate_target is smaller than 1GB.
In 10.2 pga_aggregate_target set to 5GB
_smm_max_size of 500MB (was 100MB )
_pga_max_size of 1000MB (was 200MB).
Copyright 2006 Kyle Hailey
Manual override broken 10.2.0.3 fixed in 11.1.0.7alter session set workarea_size_policy = manual;
alter session set sort_area_size = 104857600;
Workaround, run command twicealter session set sort_area_size = 104857600;
alter session set sort_area_size = 104857600;
But doesn’t work for parallel connections that still fall back on default which is 64K unless otherwise specified
HASH_AREA_SIZE seems unaffected by problem
Copyright 2006 Kyle Hailey
Data file init write
When autoextend is set and many extensions are happening
Can be the root cause of other waitsEnq: TX - contention
Copyright 2006 Kyle Hailey
Local Write Wait
Truncating a table Wait for Data Cache to be cleared of all blocks of
truncated table Wait by shadow for DBWR
If a problem try GTT Reduce fast_start_mttr_target
Copyright 2006 Kyle Hailey
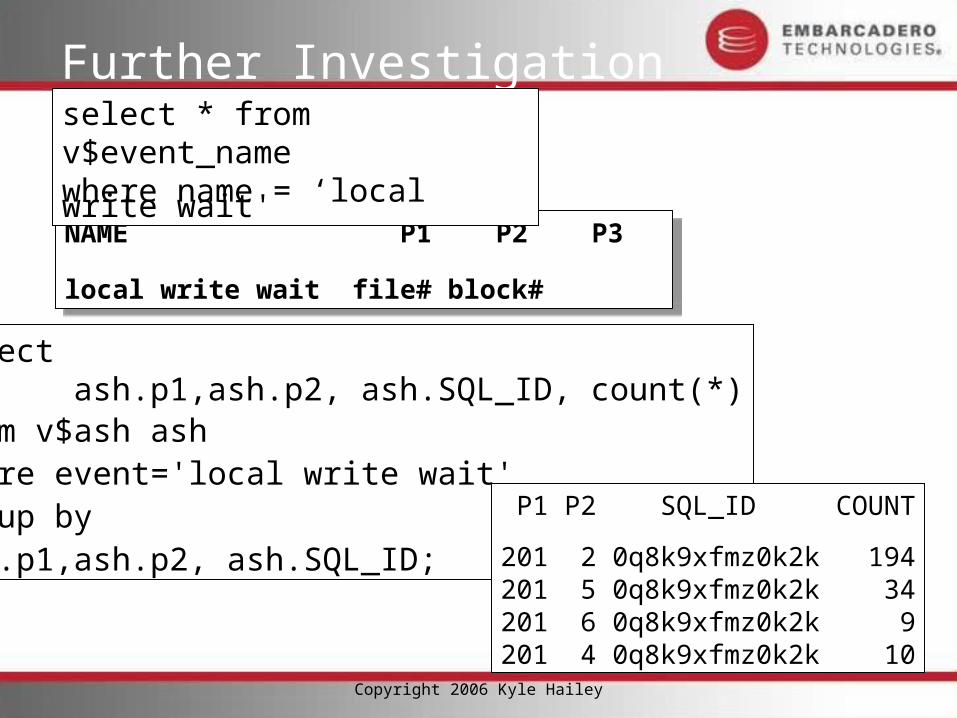
Further Investigation
NAME P1 P2 P3
----------------- ----- ------ -----
local write wait file# block#
NAME P1 P2 P3
----------------- ----- ------ -----
local write wait file# block#
select * from v$event_namewhere name = ‘local write wait'
select ash.p1,ash.p2, ash.SQL_ID, count(*)from v$ash ashwhere event='local write wait'group byash.p1,ash.p2, ash.SQL_ID;
P1 P2 SQL_ID COUNT
--- -- ------------- -----
201 2 0q8k9xfmz0k2k 194201 5 0q8k9xfmz0k2k 34201 6 0q8k9xfmz0k2k 9201 4 0q8k9xfmz0k2k 10
Copyright 2006 Kyle Hailey
Temporary File #’s
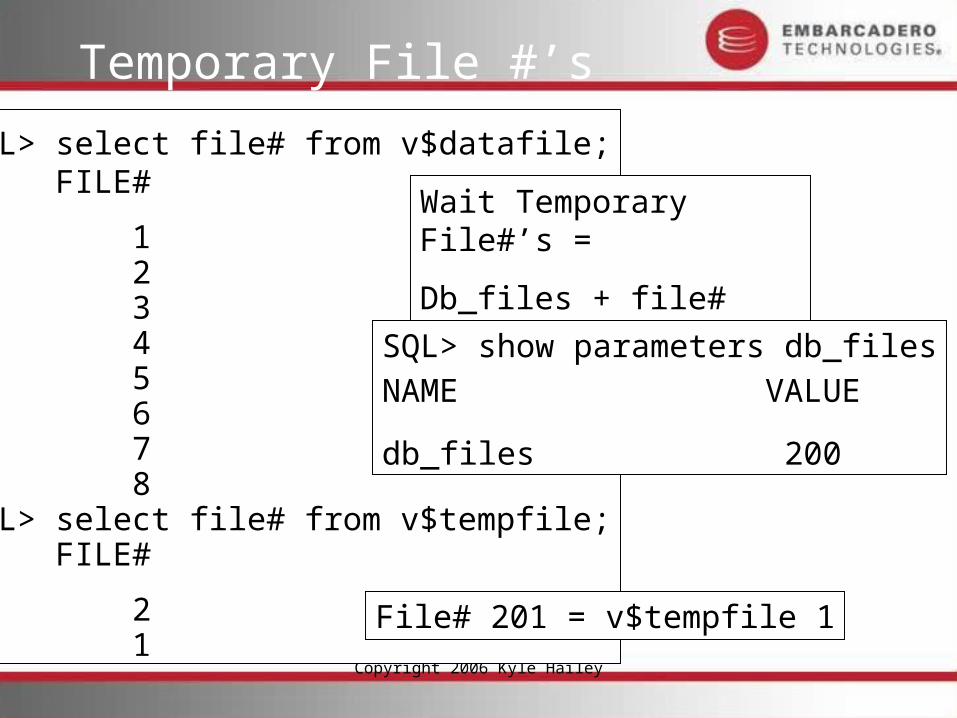
SQL> select file# from v$datafile; FILE#
----------
1 2 3 4 5 6 7 8SQL> select file# from v$tempfile; FILE#
----------
2 1
SQL> show parameters db_files
NAME VALUE
---------- -------------
db_files 200
Wait Temporary File#’s =
Db_files + file#
File# 201 = v$tempfile 1
Copyright 2006 Kyle Hailey
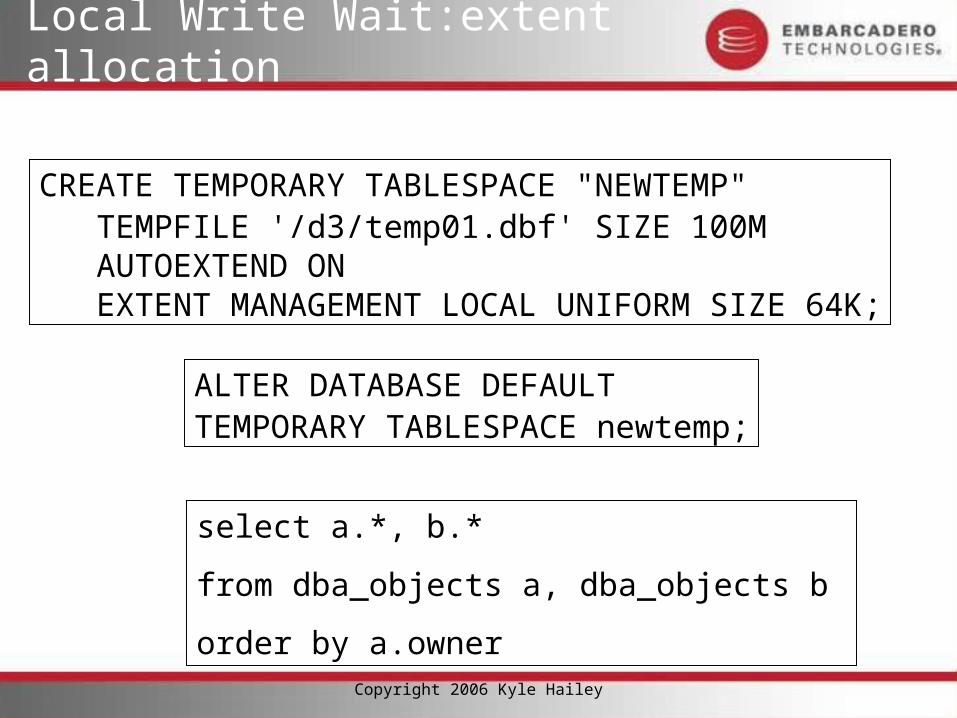
Local Write Wait:extent allocation
CREATE TEMPORARY TABLESPACE "NEWTEMP" TEMPFILE '/d3/temp01.dbf' SIZE 100M AUTOEXTEND ON EXTENT MANAGEMENT LOCAL UNIFORM SIZE 64K;
select a.*, b.*
from dba_objects a, dba_objects b
order by a.owner
ALTER DATABASE DEFAULT TEMPORARY TABLESPACE newtemp;
Copyright 2006 Kyle Hailey
Local Write Waits
Copyright 2006 Kyle Hailey
Local Write Wait: Solutions
Truncating a tableReduce fast_start_mttrUse GTT
Temporary Table Space Allocations Increase extent size
Copyright 2006 Kyle Hailey
Summary I/O
Buffer Cache IOdb file sequential readdb file scattered readdb file parallel read
Tune I/O’s should be 5-15msCheck Buffer Cache AdvisoryTune SQL
Copyright 2006 Kyle Hailey
Summary Direct I/O and Other
direct path read PQO
direct path write direct path operations
direct path read temp / direct path write temp sorts
direct path write (lob) stored NOCACHE
local write wait – Temp extensionsTruncates
data file init write – data file extension