Embed Size (px)
Citation preview
www.angelbroking.com
Market Outlook February 06, 2017
www.angelbroking.com
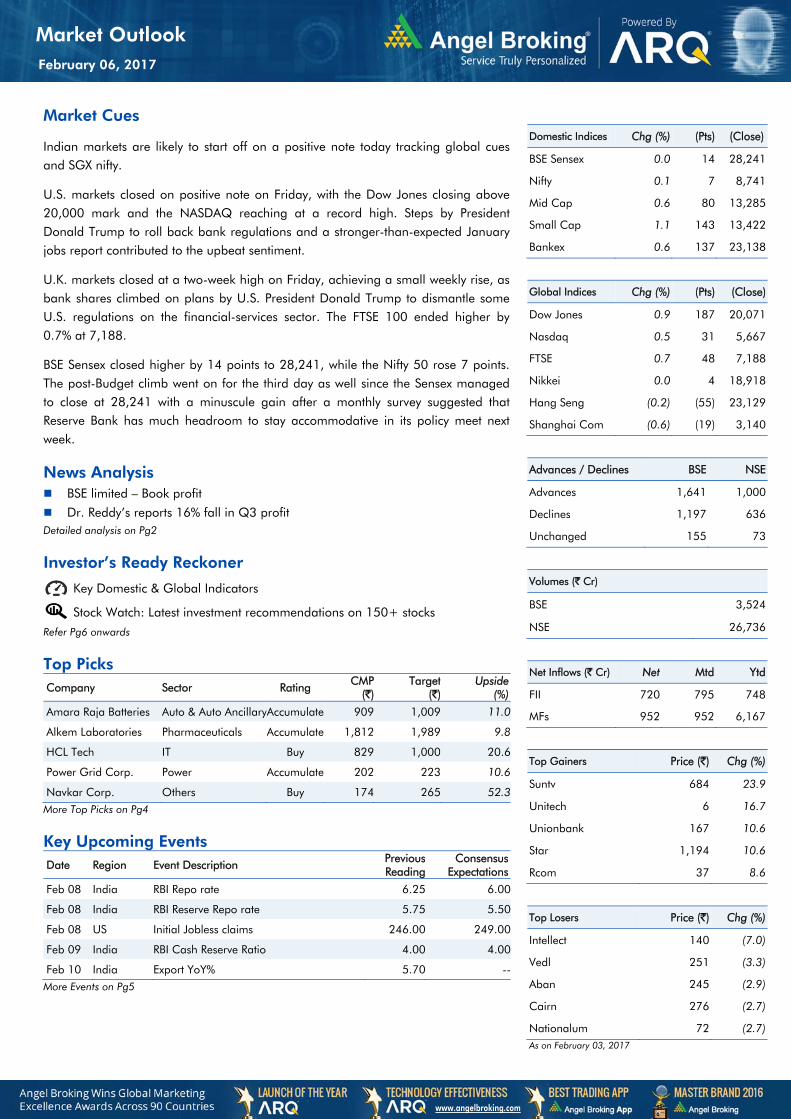
Market Cues
Indian markets are likely to start off on a positive note today tracking global cues and SGX nifty.
U.S. markets closed on positive note on Friday, with the Dow Jones closing above 20,000 mark and the NASDAQ reaching at a record high. Steps by President Donald Trump to roll back bank regulations and a stronger-than-expected January jobs report contributed to the upbeat sentiment.
U.K. markets closed at a two-week high on Friday, achieving a small weekly rise, as bank shares climbed on plans by U.S. President Donald Trump to dismantle some U.S. regulations on the financial-services sector. The FTSE 100 ended higher by 0.7% at 7,188.
BSE Sensex closed higher by 14 points to 28,241, while the Nifty 50 rose 7 points. The post-Budget climb went on for the third day as well since the Sensex managed to close at 28,241 with a minuscule gain after a monthly survey suggested that Reserve Bank has much headroom to stay accommodative in its policy meet next week.
News Analysis BSE limited – Book profit
Dr. Reddy’s reports 16% fall in Q3 profit Detailed analysis on Pg2
Investor’s Ready Reckoner
Key Domestic & Global Indicators
Stock Watch: Latest investment recommendations on 150+ stocks
Refer Pg6 onwards
Top Picks Company Sector Rating
CMP (`)
Target (`)
Upside (%)
Amara Raja Batteries Auto & Auto AncillaryAccumulate 909 1,009 11.0
Alkem Laboratories Pharmaceuticals Accumulate 1,812 1,989 9.8
HCL Tech IT Buy 829 1,000 20.6
Power Grid Corp. Power Accumulate 202 223 10.6
Navkar Corp. Others Buy 174 265 52.3More Top Picks on Pg4
Key Upcoming Events Date Region Event Description
Previous Reading
Consensus Expectations
Feb 08 India RBI Repo rate 6.25 6.00
Feb 08 India RBI Reserve Repo rate 5.75 5.50
Feb 08 US Initial Jobless claims 246.00 249.00
Feb 09 India RBI Cash Reserve Ratio 4.00 4.00
Feb 10 India Export YoY% 5.70 --More Events on Pg5
Domestic Indices Chg (%) (Pts) (Close)
BSE Sensex 0.0 14 28,241
Nifty 0.1 7 8,741
Mid Cap 0.6 80 13,285
Small Cap 1.1 143 13,422
Bankex 0.6 137 23,138
Global Indices Chg (%) (Pts) (Close)
Dow Jones 0.9 187 20,071
Nasdaq 0.5 31 5,667
FTSE 0.7 48 7,188
Nikkei 0.0 4 18,918
Hang Seng (0.2) (55) 23,129
Shanghai Com (0.6) (19) 3,140
Advances / Declines BSE NSE
Advances 1,641 1,000
Declines 1,197 636
Unchanged 155 73
Volumes (` Cr)
BSE 3,524
NSE 26,736
Net Inflows (` Cr) Net Mtd Ytd
FII 720 795 748
MFs 952 952 6,167
Top Gainers Price (`) Chg (%)
Suntv 684 23.9
Unitech 6 16.7
Unionbank 167 10.6
Star 1,194 10.6
Rcom 37 8.6
Top Losers Price (`) Chg (%)
Intellect 140 (7.0)
Vedl 251 (3.3)
Aban 245 (2.9)
Cairn 276 (2.7)
Nationalum 72 (2.7) As on February 03, 2017

www.angelbroking.com
Market Outlook February 06, 2017
www.angelbroking.com
News Analysis
BSE Limited– Book profit
Shares of BSE Ltd saw a stellar listing on Friday as they jumped nearly 33% on debut. The stock at the CMP of `1,069 is trading at the price to earnings ratio of 27.45x of its FY17E annualized EPS. We believe that the stock has captured the upside already and investors should book profit in the scrip.
Dr. Reddy’s reports 16% fall in Q3 profit
Dr Reddy’s Laboratories reported 16% fall in its third quarter profit due to weak sales in North America and emerging markets. Its net profit fell to `492.3cr in Q3FY17 vs. `585.7cr in Q3FY16. The net profit was ahead of market expectations of `377.1cr.
Net sales fell by 6.6% yoy to `3,653.4cr. Sales of generic drugs in North America, its biggest segment, fell by 15% due to increased competition in valgancyclovir and its injectables franchise coupled with continuing pricing pressure.
Sales in India rose by 2% yoy to `594.7cr, while revenues from emerging markets declined 7% to `594.8cr.
Economic and Political News Reserve Bank of India seen cutting rates February 8 to boost demand after
cash crunch
FPIs get back to buying mode, pump in `2,300 cr in 3 days
RBI mulls giving banks freedom to fix bank service charges for transactions
Demonetisation lowers India's gold demand to 7-year low in 2016
Corporate News
New AT1 rules double PSBs' debt servicing ability to `2.3 lakh crore
Coal shortage, procurement woes cost NTPC `11,000 cr in 2010-16
JSPL exploring options to reduce around `46,000cr debt
Mahindra recalls Bolero Maxi Truck Plus model in India
HDFC to raise `35,000cr via NCDs

www.angelbroking.com
Market Outlook February 06, 2017
www.angelbroking.com
Quarterly Bloomberg Brokers Consensus Estimate Bharat Heavy Electricals Ltd. - Feb 7, 2017 Particulars ( ` cr) 3QFY17E 3QFY16 y-o-y (%) 2QFY17 q-o-q (%)
Net sales 6,514 5,230 24.5 6,551 (0.6)
EBITDA 78 (1,639) 0.0 155 (49.7)
EBITDA margin (%) 1.2 -31.3 2.4
Net profit 70 (1,102) 0.0 109 (35.8)
Titan Co Ltd - Feb 7, 2017 Particulars ( ` cr) 3QFY17E 3QFY16 y-o-y (%) 2QFY17 q-o-q (%)
Net sales 3,052 3,398 (10.2) 2,636 15.8
EBITDA 277 310 (10.7) 276 0.1
EBITDA margin (%) 9.1 9.1 10.5
Net profit 188 225 (16.4) 183 3.1
Tata Steel Ltd Consol - Feb 7, 2017 Particulars ( ` cr) 3QFY17E 3QFY16 y-o-y (%) 2QFY17 q-o-q (%)
Net sales 27,243 27,819 (2.1) 26,292 3.6
EBITDA 3,359 776 333.0 2,970 13.1
EBITDA margin (%) 12.3 2.8 11.3
Net profit 740 (2,127) 0.0 (182) 0.0
Punjab National Bank - Feb 7, 2017 Particulars ( ` cr) 3QFY17E 3QFY16 y-o-y (%) 2QFY17 q-o-q (%)
Net profit 493 51 866.5 549 (10.3)
IDBI Bank Ltd - Feb 7, 2017 Particulars ( ` cr) 3QFY17E 3QFY16 y-o-y (%) 2QFY17 q-o-q (%)
Net profit 164 (2,184) 0.0 56 194.5
Hero MotoCorp Ltd - Feb 8, 2017 Particulars ( ` cr) 3QFY17E 3QFY16 y-o-y (%) 2QFY17 q-o-q (%)
Net sales 7,807 7,174 8.8 7,670 1.8
EBITDA 1,278 1,140 12.1 1,369 (6.6)
EBITDA margin (%) 16.4 15.9 17.8
Net profit 936 796 17.6 995 (5.9)

www.angelbroking.com
Market Outlook February 06, 2017
www.angelbroking.com
Top Picks ★★★★★ Large Cap Company
Market Cap (` Cr)
CMP(`)
Target (`)
Upside (%)
Rationale
Amara Raja Batteries 15,534 909 1,009 11.0To outpace battery industry growth due to bettertechnological products leading to market share gains in boththe automotive OEM and replacement segments.
Alkem Laboratories 21,662 1,812 1,989 9.8 Strong growth in domestic business due to its leadership inacute therapeutic segment. Alkem expects to launch moreproducts in USA, which bodes for its international business.
HCL Tech 1,17,052 829 1,000 20.6The stock is trading at attractive valuations and is factoringall the bad news.
Infosys 2,14,753 935 1,249 33.6Back on the growth trend, expect a long term growth of 14%to be a US$20bn in FY2020.
Larsen & Toubro 1,37,985 1,479 1,634 10.4Strong order backlog and improvement in execution wouldtrigger the growth for the L&T
Lupin 67,289 1,491 1,809 21.4One of the largest pharma companies with stronginternational presence. It has a rich pipeline of ANDAs whichis also one of the largest among the generic companies.
Power Grid Corporation 1,05,521 202 223 10.6Going forward, we expect the company to report strong top-line CAGR of ~16% and bottom-line CAGR of ~19% over FY16-18 on back of strong capitalization guidance
Source: Company, Angel Research
Mid Cap Company
Market Cap(` Cr)
CMP (`)
Target(`)
Upside (%)
Rationale
Asian Granito 815 271 351 29.6We expect the company would report strong profitability owing to better product mix, higher B2C sales and amalgamation synergy.
Bajaj Electricals 2,530 250 274 9.5 Among the top 4 players in the consumer durables segment. Improved profitability backed by turn around in E&P segment. Strong order book lends earnings visibility.
Blue Star 5,138 538 634 17.9
Favourable outlook for the AC industry to augur well for Cooling products business which is out pacing the market growth. EMPPAC division's profitability to improve once operating environment turns around.
Dewan Housing Finance 9,290 297 350 18.0With a focus on the low and medium income (LMI) consumer segment, the company has increased its presence in tier-II & III cities where the growth opportunity is immense.
Equitas Holdings 6,149 183 235 28.2Strong loan growth backed by diversified loan portfolio and adequate CAR. ROE & ROA likely to remain decent as risk of dilution remains low. Attractive valuations considering growth.
Jagran Prakashan 6,118 187 225 20.2
Economic recovery to have favourable impact on advertising & circulation revenue growth. Further, the acquisition of a radio business (Radio City) would also boost the company's revenue growth.
KEI Industries 1,308 168 207 23.1High order book execution in EPC segment, rising B2C sales and higher exports to boost the revenues and profitability
Mahindra Lifespace 1,461 356 522 46.6Speedier execution and speedier sales, strong revenue visibilty in short-to-long run, attractive valuations
Mirza International 1,118 93 107 15.2Higher growth in domestic branded sales and healthy export to boost the profitability.
Navkar Corporation 2,481 174 265 52.3Massive capacity expansion along with rail advantage at ICD as well CFS augurs well for the company
Siyaram Silk Mills 1,451 1,548 1,720 11.1Strong brands and distribution network would boost growth going ahead. Stock currently trades at an inexpensive valuation.
TV Today Network 1,609 270 385 42.7
Market leadership in Hindi news genre and no. 2 viewership ranking in English news genre, exit from the radio business, and anticipated growth in ad spends by corporates to benefit the stock.
Source: Company, Angel Research

Date Company
Feb 6, 2017 Automotive Axle, LMW, GSPL, Abbott India, Banco
Feb 7, 2017CEAT, BHEL, Ramco Cements, Punjab Natl.Bank, IDBI Bank, United Bank, Hexaware, Tata Steel, Godawari Ispat, L G Balakrishnan & Bros, Orchid Chemicals, NHPC
Feb 8, 2017Tata Chemicals, Hero Motocorp, Bharat Forge, Siemens, Thermax, Union Bank, Indraprasth Gas, Goodyear, Elecon Engineering, Cipla, NTPC, Reliance Power, Competent Automobiles, Coffee Day Enterprises Ltd
Feb 9, 2017JK Tyre, ABB, Jyoti Structures, Bank of India, Andhra Bank, SAIL, Cairn India, BPCL, Page Industries, Bajaj Electrical, Styrolution, Lupin, Aurobindo Pharma, Power Grid Corpn
Feb 10, 2017M&M, Bosch India, Crompton Greaves, St Bk of India, Bank of Baroda, Reliance Capital, Corporation Bank, Dena Bank, Sun TV Network, Jagran Prakashan, Hind. Zinc, Bhushan Steel, GAIL, Tide Water Oil India, Ipca labs, Tata Power Co., CESC, GIPCL, Anant Raj, Radico Khaitan
Result Calendar
Source: Bloomberg, Angel Research
Global economic events release calendar
Date Time Country Event Description Unit Period Bloomberg Data
Last Reported Estimated
Feb 8, 2017 2:30PM India RBI Reverse Repo rate % Feb 8 5.75 5.50
2:30PM India RBI Repo rate % Feb 8 6.25 6.00
7:00PM US Initial Jobless claims Thousands Feb 4 246.00 249.00
Feb 9, 2017 2:30PM India RBI Cash Reserve ratio % Feb 8 4.00 4.00
Feb 10, 2017 3:00PM UK Industrial Production (YoY) % Change Dec 2.00 3.20
India Exports YoY% % Change Jan 5.70 --
China Exports YoY% % Change Jan (6.20) 3.00
India Imports YoY% % Change Jan 0.50 --
5:30PM India Industrial Production YoY % Change Dec 5.70 1.40
Feb 14, 2017 3:30PM Euro Zone Euro-Zone GDP s.a. (QoQ) % Change 4Q P 0.50 --
7:00AM China Consumer Price Index (YoY) % Change Jan 2.10 2.40
12:00PM India Monthly Wholesale Prices YoY% % Change Jan 3.39 4.30
3:00PM UK CPI (YoY) % Change Jan 1.60 --
US Producer Price Index (mom) % Change Jan 0.80 --
12:30PM Germany GDP nsa (YoY) % Change 4Q P 1.50 --
Feb 15, 2017 3:00PM UK Jobless claims change % Change Jan (10.10) --
7:45PM US Industrial Production % Jan 0.83 (0.10)
7:00PM US Housing Starts Thousands Jan 1,226.00 1,228.00
Feb 16, 2017 7:00PM US Consumer price index (mom) % Change Jan 0.30 0.30
7:00PM US Building permits Thousands Jan 1,228.00 1,230.00
Feb 20, 2017 8:30PM Euro Zone Euro-Zone Consumer Confidence Value Feb A (4.90) --
Feb 21, 2017 2:00PM Germany PMI Services Value Feb P 53.40 --
2:00PM Germany PMI Manufacturing Value Feb P 56.40 --
Feb 22, 2017 3:30PM Euro Zone Euro-Zone CPI (YoY) % Jan F 1.80 --
8:30PM US Existing home sales Million Jan 5.49 5.55
3:00PM UK GDP (YoY) % Change 4Q P 2.20 --
Feb 24, 2017 8:30PM US New home sales Thousands Jan 536.00 570.00
Source: Bloomberg, Angel Research
Key Upcoming Events
Market Outlook
February 06, 2017

1
www.angelbroking.com
Market Outlook
February 06, 2017
www.angelbroking.com
Macro watch
Exhibit 1: Quarterly GDP trends
Source: CSO, Angel Research
Exhibit 2: IIP trends
Source: MOSPI, Angel Research
Exhibit 3: Monthly CPI inflation trends
Source: MOSPI, Angel Research
Exhibit 4: Manufacturing and services PMI
Source: Market, Angel Research; Note: Level above 50 indicates expansion
Exhibit 5: Exports and imports growth trends
Source: Bloomberg, Angel Research
Exhibit 6: Key policy rates
Source: RBI, Angel Research
6.4
5.8
7.5
8.3
6.6 6.7
7.5 7.6 7.2
7.9
7.1 7.3
3.0
4.0
5.0
6.0
7.0
8.0
9.0
3Q
FY
14
4Q
FY
14
1Q
FY
15
2Q
FY
15
3Q
FY
15
4Q
FY
15
1Q
FY
16
2Q
FY
16
3Q
FY
16
4Q
FY
16
1Q
FY
17
2Q
FY
17
(%)
(1.6)
1.9
0.3
(1.3)
1.3
2.2
(2.5)
(0.7)
0.7
(1.8)
5.7
(3.0)
(2.0)
(1.0)
-
1.0
2.0
3.0
4.0
5.0
6.0
7.0
Jan-16
Feb-16
Mar-16
Apr-16
May-16
Jun-16
Jul-16
Aug-16
Sep-16
Oct-16
Nov-16
(%)
5.7
5.3
4.8
5.5 5.8 5.8
6.1
5.1
4.4 4.2
3.6 3.4
-
1.0
2.0
3.0
4.0
5.0
6.0
7.0
Jan-16
Feb-16
Mar-16
Apr-16
May-16
Jun-16
Jul-16
Aug-16
Sep-16
Oct-16
Nov-16
Dec-16
(%)
42.0
44.0
46.0
48.0
50.0
52.0
54.0
56.0 D
ec-15
Jan-16
Feb-16
Mar-16
Apr-16
May-16
Jun-16
Jul-16
Aug-16
Sep-16
Oct-16
Nov-16
Dec-16
Jan-17
Mfg. PMI Services PMI
(30.0)
(25.0)
(20.0)
(15.0)
(10.0)
(5.0)
0.0
5.0
10.0
15.0
Jan-16
Feb-16
Mar-16
Apr-16
May-16
Jun-16
Jul-16
Aug-16
Sep-16
Oct-16
Nov-16
Dec-16
Exports yoy growth Imports yoy growth(%)
3.00
3.50
4.00
4.50
5.00
5.50
6.00
6.50
7.00
Feb
-16
Feb
-16
Mar-
16
Mar-
16
Apr-
16
Apr-
16
Ma
y-1
6
May
-16
Jun
-16
Jun
-16
Jun
-16
Jul-
16
Jul-
16
Au
g-1
6
Au
g-1
6
Se
p-1
6
Se
p-1
6
Oct-
16
Oct-
16
No
v-1
6
Nov-1
6
De
c-1
6
Dec-1
6Repo rate Reverse Repo rate CRR (%)
2
www.angelbroking.com
Market Outlook
February 06, 2017
www.angelbroking.com
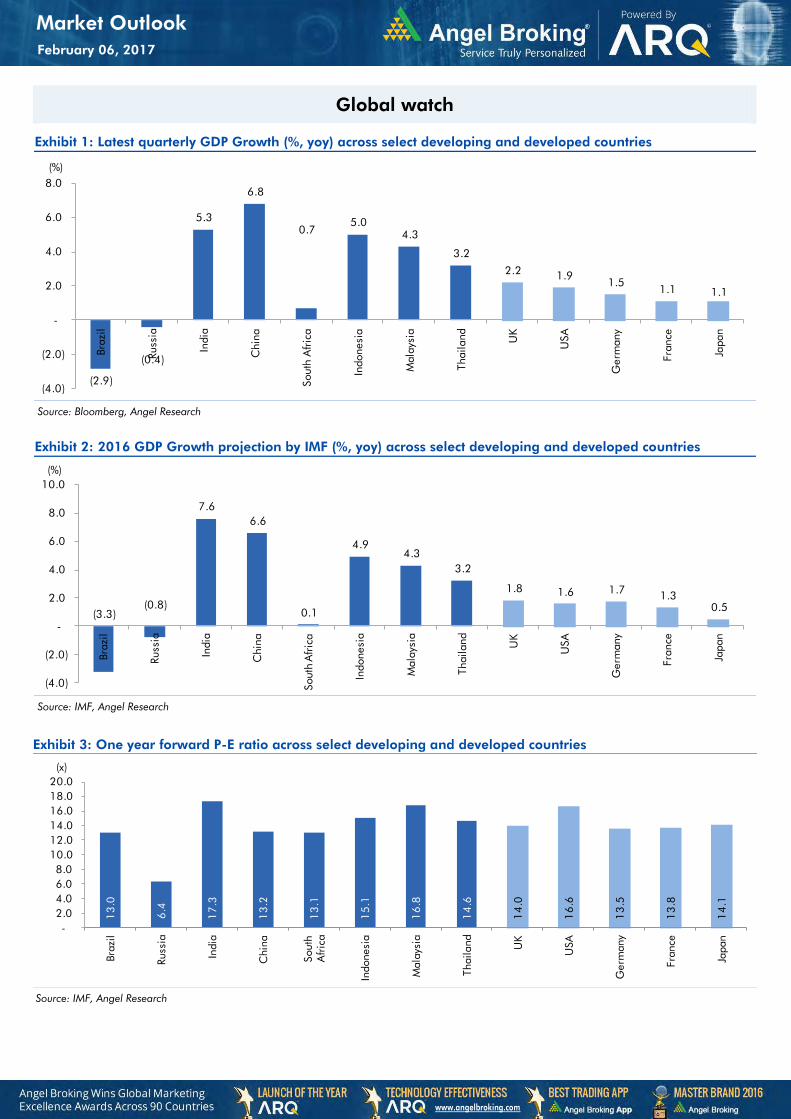
Global watch
Exhibit 1: Latest quarterly GDP Growth (%, yoy) across select developing and developed countries
Source: Bloomberg, Angel Research
Exhibit 2: 2016 GDP Growth projection by IMF (%, yoy) across select developing and developed countries
Source: IMF, Angel Research
Exhibit 3: One year forward P-E ratio across select developing and developed countries
Source: IMF, Angel Research
(2.9)
(0.4)
5.3
6.8
0.7
5.0
4.3
3.2
2.2 1.9
1.5 1.1 1.1
(4.0)
(2.0)
-
2.0
4.0
6.0
8.0
Brazil
Russia
India
China
South A
frica
Indonesia
Malaysia
Thailand
UK
USA
Germ
any
France
Japan
(%)
(3.3)
(0.8)
7.6
6.6
0.1
4.9
4.3
3.2
1.8 1.6 1.7
1.3
0.5
(4.0)
(2.0)
-
2.0
4.0
6.0
8.0
10.0
Brazil
Russia
India
China
South A
frica
Indonesia
Malaysia
Thailand
UK
USA
Germ
any
France
Japan
(%)
13
.0
6.4
17
.3
13
.2
13
.1
15
.1
16
.8
14
.6
14
.0
16
.6
13
.5
13
.8
14
.1
-
2.0
4.0
6.0
8.0
10.0
12.0
14.0
16.0
18.0
20.0
Brazil
Russia
India
China
South
Africa
Indonesia
Malaysia
Thailand
UK
USA
Germ
any
France
Japan
(x)

3
www.angelbroking.com
Market Outlook
February 06, 2017
www.angelbroking.com
Exhibit 4: Relative performance of indices across globe
Returns (%)
Country Name of index Closing price 1M 3M 1YR
Brazil Bovespa 64,954 5.1 2.6 64.1
Russia Micex 2,227 (1.6) 13.4 27.7
India Nifty 8,741 6.7 3.0 15.6
China Shanghai Composite 3,140 0.8 1.2 4.4
South Africa Top 40 45,418 3.3 2.2 5.7
Mexico Mexbol 47,225 1.4 1.2 11.4
Indonesia LQ45 893 0.1 (3.4) 12.4
Malaysia KLCI 1,685 2.6 0.8 3.3
Thailand SET 50 991 1.0 5.1 24.8
USA Dow Jones 20,071 1.0 11.3 23.9
UK FTSE 7,188 (0.0) 5.0 26.3
Japan Nikkei 18,918 (1.0) 8.4 13.2
Germany DAX 11,651 0.6 13.6 33.1
France CAC 4,825 (1.5) 10.2 17.3
Source: Bloomberg, Angel Research

Company Name Reco CMP Target Mkt Cap Sales ( ₹cr ) OPM(%) EPS (₹) PER(x) P/BV(x) RoE(%) EV/Sales(x)
( ₹ ) Price ( ₹) ( ₹ cr ) FY17E FY18E FY17E FY18E FY17E FY18E FY17E FY18E FY17E FY18E FY17E FY18E FY17E FY18E
Agri / Agri Chemical
Rallis Neutral 250 - 4,859 1,937 2,164 13.3 14.3 9.0 11.0 27.8 22.7 4.8 4.2 18.4 19.8 2.6 2.2
United Phosphorus Neutral 738 - 37,423 15,176 17,604 18.5 18.5 37.4 44.6 19.7 16.6 3.9 3.2 21.4 21.2 2.6 2.2
Auto & Auto Ancillary
Ashok Leyland Buy 95 111 26,894 22,407 26,022 10.6 10.6 5.2 6.4 18.1 14.7 4.1 3.5 23.6 24.7 1.3 1.1
Bajaj Auto Neutral 2,810 - 81,311 25,093 27,891 19.5 19.2 143.9 162.5 19.5 17.3 5.5 4.7 30.3 29.4 3.0 2.6
Bharat Forge Neutral 948 - 22,060 7,726 8,713 20.5 21.2 35.3 42.7 26.8 22.2 5.0 4.5 18.9 20.1 2.9 2.5
Eicher Motors Neutral 23,386 - 63,618 16,583 20,447 17.5 18.0 598.0 745.2 39.1 31.4 13.4 10.2 41.2 38.3 3.7 2.9
Gabriel India Buy 112 130 1,610 1,544 1,715 9.0 9.3 5.4 6.3 20.8 17.8 3.9 3.5 18.9 19.5 1.0 0.9
Hero Motocorp Accumulate 3,216 3,541 64,215 30,958 34,139 15.7 15.7 193.6 208.3 16.6 15.4 6.5 5.4 34.2 30.5 1.9 1.7
Jamna Auto Industries Neutral 194 - 1,541 1,486 1,620 9.8 9.9 15.0 17.2 12.9 11.3 2.8 2.4 21.8 21.3 1.1 1.0
L G Balakrishnan & Bros Neutral 588 - 923 1,302 1,432 11.6 11.9 43.7 53.0 13.5 11.1 1.9 1.7 13.8 14.2 0.8 0.7
Mahindra and Mahindra Neutral 1,263 - 78,447 46,534 53,077 11.6 11.7 67.3 78.1 18.8 16.2 3.1 2.7 15.4 15.8 1.7 1.4
Maruti Accumulate 6,118 6,560 184,813 67,822 83,288 16.0 16.4 253.8 312.4 24.1 19.6 5.5 4.5 23.0 22.9 2.4 1.9
Minda Industries Neutral 383 - 3,042 2,728 3,042 9.0 9.1 68.2 86.2 5.6 4.5 1.3 1.0 23.8 24.3 1.2 1.0
Motherson Sumi Neutral 340 - 47,744 45,896 53,687 7.8 8.3 13.0 16.1 26.1 21.1 8.4 6.7 34.7 35.4 1.1 0.9
Rane Brake Lining Neutral 975 - 771 511 562 11.3 11.5 28.1 30.9 34.7 31.5 5.3 4.8 15.3 15.0 1.6 1.5
Setco Automotive Neutral 37 - 494 741 837 13.0 13.0 15.2 17.0 2.4 2.2 0.4 0.4 15.8 16.3 1.1 1.0
Tata Motors Neutral 523 - 150,856 300,209 338,549 8.9 8.4 42.7 54.3 12.3 9.6 2.0 1.7 15.6 17.2 0.6 0.5
TVS Motor Neutral 392 - 18,612 13,390 15,948 6.9 7.1 12.8 16.5 30.7 23.7 7.6 6.1 26.3 27.2 1.4 1.2
Amara Raja Batteries Accumulate 909 1,009 15,534 5,305 6,100 16.0 16.3 28.4 34.0 32.0 26.8 6.2 5.2 19.3 19.3 2.9 2.5
Exide Industries Neutral 209 - 17,752 7,439 8,307 15.0 15.0 8.1 9.3 25.8 22.5 3.6 3.2 14.3 16.7 2.0 1.8
Apollo Tyres Buy 183 235 9,330 12,877 14,504 14.3 13.9 21.4 23.0 8.6 8.0 1.3 1.2 16.4 15.2 0.9 0.8
Ceat Buy 1,193 1,450 4,827 7,524 8,624 13.0 12.7 131.1 144.3 9.1 8.3 1.7 1.4 19.8 18.6 0.7 0.6
JK Tyres Neutral 121 - 2,754 7,455 8,056 15.0 15.0 21.8 24.5 5.6 5.0 1.2 1.0 22.8 21.3 0.5 0.4
Swaraj Engines Neutral 1,437 - 1,784 660 810 15.2 16.4 54.5 72.8 26.4 19.7 8.2 7.5 31.5 39.2 2.5 2.0
Subros Neutral 188 - 1,125 1,488 1,681 11.7 11.9 6.4 7.2 29.3 26.2 3.1 2.8 10.8 11.4 1.0 0.9
Indag Rubber Neutral 180 - 474 286 326 19.8 16.8 11.7 13.3 15.4 13.5 2.6 2.4 17.8 17.1 1.3 1.2
Capital Goods
ACE Neutral 53 - 523 709 814 4.1 4.6 1.4 2.1 37.8 25.2 1.6 1.5 4.4 6.0 0.9 0.8
BEML Neutral 1,256 - 5,232 3,451 4,055 6.3 9.2 31.4 57.9 40.0 21.7 2.4 2.2 6.3 10.9 1.6 1.4
Bharat Electronics Neutral 1,544 - 34,495 8,137 9,169 16.8 17.2 58.7 62.5 26.3 24.7 4.1 3.6 44.6 46.3 3.2 2.9
www.angelbroking.com
Stock WatchFebruary 06, 2017
Company Name Reco CMP Target Mkt Cap Sales ( ₹cr ) OPM(%) EPS (₹) PER(x) P/BV(x) RoE(%) EV/Sales(x)
( ₹ ) Price ( ₹) ( ₹ cr ) FY17E FY18E FY17E FY18E FY17E FY18E FY17E FY18E FY17E FY18E FY17E FY18E FY17E FY18E
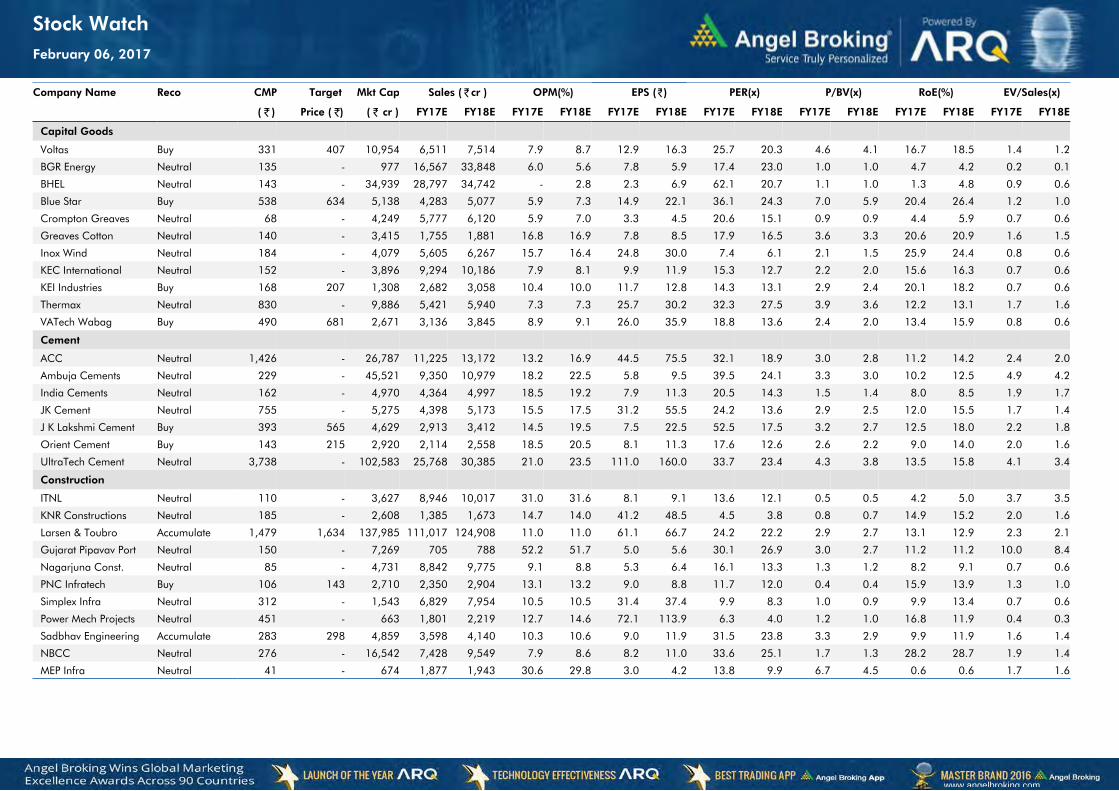
Capital Goods
Voltas Buy 331 407 10,954 6,511 7,514 7.9 8.7 12.9 16.3 25.7 20.3 4.6 4.1 16.7 18.5 1.4 1.2
BGR Energy Neutral 135 - 977 16,567 33,848 6.0 5.6 7.8 5.9 17.4 23.0 1.0 1.0 4.7 4.2 0.2 0.1
BHEL Neutral 143 - 34,939 28,797 34,742 - 2.8 2.3 6.9 62.1 20.7 1.1 1.0 1.3 4.8 0.9 0.6
Blue Star Buy 538 634 5,138 4,283 5,077 5.9 7.3 14.9 22.1 36.1 24.3 7.0 5.9 20.4 26.4 1.2 1.0
Crompton Greaves Neutral 68 - 4,249 5,777 6,120 5.9 7.0 3.3 4.5 20.6 15.1 0.9 0.9 4.4 5.9 0.7 0.6
Greaves Cotton Neutral 140 - 3,415 1,755 1,881 16.8 16.9 7.8 8.5 17.9 16.5 3.6 3.3 20.6 20.9 1.6 1.5
Inox Wind Neutral 184 - 4,079 5,605 6,267 15.7 16.4 24.8 30.0 7.4 6.1 2.1 1.5 25.9 24.4 0.8 0.6
KEC International Neutral 152 - 3,896 9,294 10,186 7.9 8.1 9.9 11.9 15.3 12.7 2.2 2.0 15.6 16.3 0.7 0.6
KEI Industries Buy 168 207 1,308 2,682 3,058 10.4 10.0 11.7 12.8 14.3 13.1 2.9 2.4 20.1 18.2 0.7 0.6
Thermax Neutral 830 - 9,886 5,421 5,940 7.3 7.3 25.7 30.2 32.3 27.5 3.9 3.6 12.2 13.1 1.7 1.6
VATech Wabag Buy 490 681 2,671 3,136 3,845 8.9 9.1 26.0 35.9 18.8 13.6 2.4 2.0 13.4 15.9 0.8 0.6
Cement
ACC Neutral 1,426 - 26,787 11,225 13,172 13.2 16.9 44.5 75.5 32.1 18.9 3.0 2.8 11.2 14.2 2.4 2.0
Ambuja Cements Neutral 229 - 45,521 9,350 10,979 18.2 22.5 5.8 9.5 39.5 24.1 3.3 3.0 10.2 12.5 4.9 4.2
India Cements Neutral 162 - 4,970 4,364 4,997 18.5 19.2 7.9 11.3 20.5 14.3 1.5 1.4 8.0 8.5 1.9 1.7
JK Cement Neutral 755 - 5,275 4,398 5,173 15.5 17.5 31.2 55.5 24.2 13.6 2.9 2.5 12.0 15.5 1.7 1.4
J K Lakshmi Cement Buy 393 565 4,629 2,913 3,412 14.5 19.5 7.5 22.5 52.5 17.5 3.2 2.7 12.5 18.0 2.2 1.8
Orient Cement Buy 143 215 2,920 2,114 2,558 18.5 20.5 8.1 11.3 17.6 12.6 2.6 2.2 9.0 14.0 2.0 1.6
UltraTech Cement Neutral 3,738 - 102,583 25,768 30,385 21.0 23.5 111.0 160.0 33.7 23.4 4.3 3.8 13.5 15.8 4.1 3.4
Construction
ITNL Neutral 110 - 3,627 8,946 10,017 31.0 31.6 8.1 9.1 13.6 12.1 0.5 0.5 4.2 5.0 3.7 3.5
KNR Constructions Neutral 185 - 2,608 1,385 1,673 14.7 14.0 41.2 48.5 4.5 3.8 0.8 0.7 14.9 15.2 2.0 1.6
Larsen & Toubro Accumulate 1,479 1,634 137,985 111,017 124,908 11.0 11.0 61.1 66.7 24.2 22.2 2.9 2.7 13.1 12.9 2.3 2.1
Gujarat Pipavav Port Neutral 150 - 7,269 705 788 52.2 51.7 5.0 5.6 30.1 26.9 3.0 2.7 11.2 11.2 10.0 8.4
Nagarjuna Const. Neutral 85 - 4,731 8,842 9,775 9.1 8.8 5.3 6.4 16.1 13.3 1.3 1.2 8.2 9.1 0.7 0.6
PNC Infratech Buy 106 143 2,710 2,350 2,904 13.1 13.2 9.0 8.8 11.7 12.0 0.4 0.4 15.9 13.9 1.3 1.0
Simplex Infra Neutral 312 - 1,543 6,829 7,954 10.5 10.5 31.4 37.4 9.9 8.3 1.0 0.9 9.9 13.4 0.7 0.6
Power Mech Projects Neutral 451 - 663 1,801 2,219 12.7 14.6 72.1 113.9 6.3 4.0 1.2 1.0 16.8 11.9 0.4 0.3
Sadbhav Engineering Accumulate 283 298 4,859 3,598 4,140 10.3 10.6 9.0 11.9 31.5 23.8 3.3 2.9 9.9 11.9 1.6 1.4
NBCC Neutral 276 - 16,542 7,428 9,549 7.9 8.6 8.2 11.0 33.6 25.1 1.7 1.3 28.2 28.7 1.9 1.4
MEP Infra Neutral 41 - 674 1,877 1,943 30.6 29.8 3.0 4.2 13.8 9.9 6.7 4.5 0.6 0.6 1.7 1.6
www.angelbroking.com
Stock WatchFebruary 06, 2017
Company Name Reco CMP Target Mkt Cap Sales ( ₹cr ) OPM(%) EPS (₹) PER(x) P/BV(x) RoE(%) EV/Sales(x)
( ₹ ) Price ( ₹) ( ₹ cr ) FY17E FY18E FY17E FY18E FY17E FY18E FY17E FY18E FY17E FY18E FY17E FY18E FY17E FY18E
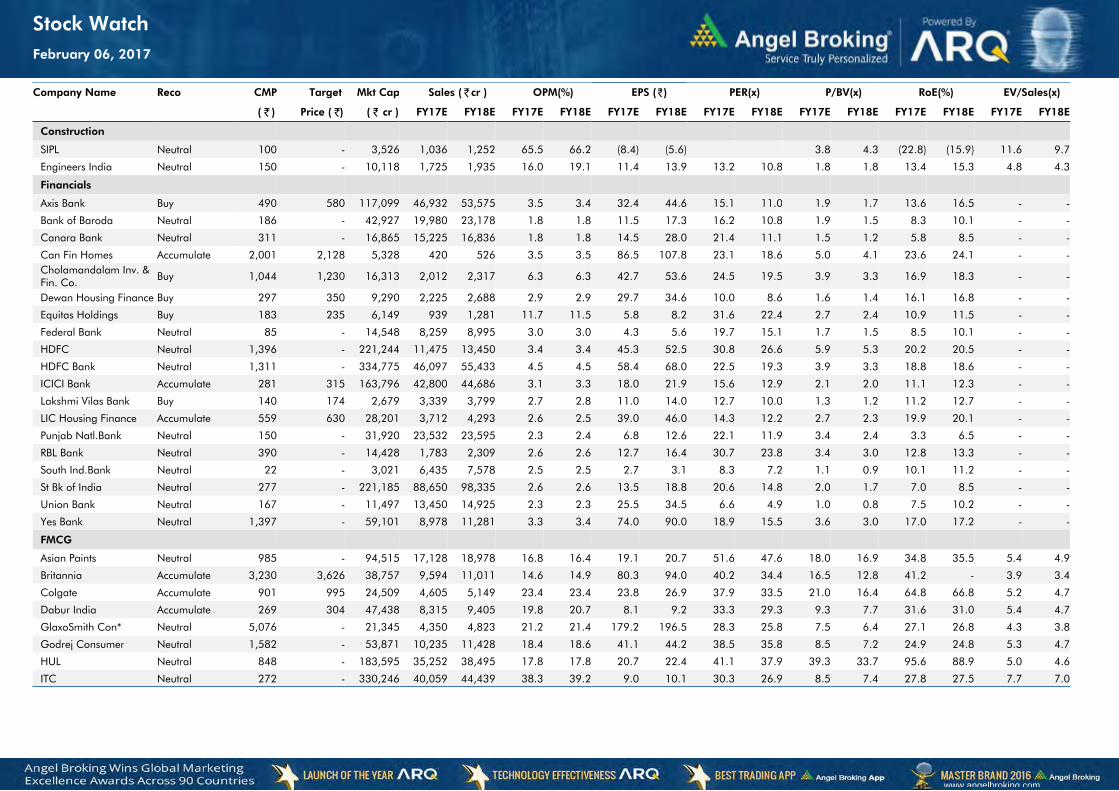
Construction
SIPL Neutral 100 - 3,526 1,036 1,252 65.5 66.2 (8.4) (5.6) 3.8 4.3 (22.8) (15.9) 11.6 9.7
Engineers India Neutral 150 - 10,118 1,725 1,935 16.0 19.1 11.4 13.9 13.2 10.8 1.8 1.8 13.4 15.3 4.8 4.3
Financials
Axis Bank Buy 490 580 117,099 46,932 53,575 3.5 3.4 32.4 44.6 15.1 11.0 1.9 1.7 13.6 16.5 - -
Bank of Baroda Neutral 186 - 42,927 19,980 23,178 1.8 1.8 11.5 17.3 16.2 10.8 1.9 1.5 8.3 10.1 - -
Canara Bank Neutral 311 - 16,865 15,225 16,836 1.8 1.8 14.5 28.0 21.4 11.1 1.5 1.2 5.8 8.5 - -
Can Fin Homes Accumulate 2,001 2,128 5,328 420 526 3.5 3.5 86.5 107.8 23.1 18.6 5.0 4.1 23.6 24.1 - -Cholamandalam Inv. & Fin. Co. Buy 1,044 1,230 16,313 2,012 2,317 6.3 6.3 42.7 53.6 24.5 19.5 3.9 3.3 16.9 18.3 - -
Dewan Housing Finance Buy 297 350 9,290 2,225 2,688 2.9 2.9 29.7 34.6 10.0 8.6 1.6 1.4 16.1 16.8 - -
Equitas Holdings Buy 183 235 6,149 939 1,281 11.7 11.5 5.8 8.2 31.6 22.4 2.7 2.4 10.9 11.5 - -
Federal Bank Neutral 85 - 14,548 8,259 8,995 3.0 3.0 4.3 5.6 19.7 15.1 1.7 1.5 8.5 10.1 - -
HDFC Neutral 1,396 - 221,244 11,475 13,450 3.4 3.4 45.3 52.5 30.8 26.6 5.9 5.3 20.2 20.5 - -
HDFC Bank Neutral 1,311 - 334,775 46,097 55,433 4.5 4.5 58.4 68.0 22.5 19.3 3.9 3.3 18.8 18.6 - -
ICICI Bank Accumulate 281 315 163,796 42,800 44,686 3.1 3.3 18.0 21.9 15.6 12.9 2.1 2.0 11.1 12.3 - -
Lakshmi Vilas Bank Buy 140 174 2,679 3,339 3,799 2.7 2.8 11.0 14.0 12.7 10.0 1.3 1.2 11.2 12.7 - -
LIC Housing Finance Accumulate 559 630 28,201 3,712 4,293 2.6 2.5 39.0 46.0 14.3 12.2 2.7 2.3 19.9 20.1 - -
Punjab Natl.Bank Neutral 150 - 31,920 23,532 23,595 2.3 2.4 6.8 12.6 22.1 11.9 3.4 2.4 3.3 6.5 - -
RBL Bank Neutral 390 - 14,428 1,783 2,309 2.6 2.6 12.7 16.4 30.7 23.8 3.4 3.0 12.8 13.3 - -
South Ind.Bank Neutral 22 - 3,021 6,435 7,578 2.5 2.5 2.7 3.1 8.3 7.2 1.1 0.9 10.1 11.2 - -
St Bk of India Neutral 277 - 221,185 88,650 98,335 2.6 2.6 13.5 18.8 20.6 14.8 2.0 1.7 7.0 8.5 - -
Union Bank Neutral 167 - 11,497 13,450 14,925 2.3 2.3 25.5 34.5 6.6 4.9 1.0 0.8 7.5 10.2 - -
Yes Bank Neutral 1,397 - 59,101 8,978 11,281 3.3 3.4 74.0 90.0 18.9 15.5 3.6 3.0 17.0 17.2 - -
FMCG
Asian Paints Neutral 985 - 94,515 17,128 18,978 16.8 16.4 19.1 20.7 51.6 47.6 18.0 16.9 34.8 35.5 5.4 4.9
Britannia Accumulate 3,230 3,626 38,757 9,594 11,011 14.6 14.9 80.3 94.0 40.2 34.4 16.5 12.8 41.2 - 3.9 3.4
Colgate Accumulate 901 995 24,509 4,605 5,149 23.4 23.4 23.8 26.9 37.9 33.5 21.0 16.4 64.8 66.8 5.2 4.7
Dabur India Accumulate 269 304 47,438 8,315 9,405 19.8 20.7 8.1 9.2 33.3 29.3 9.3 7.7 31.6 31.0 5.4 4.7
GlaxoSmith Con* Neutral 5,076 - 21,345 4,350 4,823 21.2 21.4 179.2 196.5 28.3 25.8 7.5 6.4 27.1 26.8 4.3 3.8
Godrej Consumer Neutral 1,582 - 53,871 10,235 11,428 18.4 18.6 41.1 44.2 38.5 35.8 8.5 7.2 24.9 24.8 5.3 4.7
HUL Neutral 848 - 183,595 35,252 38,495 17.8 17.8 20.7 22.4 41.1 37.9 39.3 33.7 95.6 88.9 5.0 4.6
ITC Neutral 272 - 330,246 40,059 44,439 38.3 39.2 9.0 10.1 30.3 26.9 8.5 7.4 27.8 27.5 7.7 7.0
www.angelbroking.com
Stock WatchFebruary 06, 2017

Company Name Reco CMP Target Mkt Cap Sales ( ₹cr ) OPM(%) EPS (₹) PER(x) P/BV(x) RoE(%) EV/Sales(x)
( ₹ ) Price ( ₹) ( ₹ cr ) FY17E FY18E FY17E FY18E FY17E FY18E FY17E FY18E FY17E FY18E FY17E FY18E FY17E FY18E
FMCG
Marico Buy 256 300 33,014 6,430 7,349 18.8 19.5 6.4 7.7 40.0 33.2 12.1 10.2 33.2 32.5 4.9 4.3
Nestle* Neutral 6,079 - 58,607 10,073 11,807 20.7 21.5 124.8 154.2 48.7 39.4 20.0 18.0 34.8 36.7 5.6 4.8
Tata Global Neutral 142 - 8,953 8,675 9,088 9.8 9.8 7.4 8.2 19.2 17.3 2.2 2.1 7.9 8.1 1.0 0.9Procter & Gamble Hygiene Accumulate 7,000 7,369 22,724 2,939 3,342 23.2 23.0 146.2 163.7 47.9 42.8 107.2 102.8 25.3 23.5 7.3 6.3
IT
HCL Tech^ Buy 829 1,000 117,052 49,242 57,168 20.5 20.5 55.7 64.1 14.9 12.9 3.0 2.3 20.3 17.9 2.2 1.8
Infosys Buy 935 1,249 214,753 68,350 77,326 27.0 27.0 62.5 69.4 15.0 13.5 3.2 2.9 21.3 21.6 2.6 2.2
TCS Buy 2,234 2,620 440,144 119,025 133,308 27.6 27.6 131.2 145.5 17.0 15.4 5.5 5.1 32.4 33.1 3.5 3.1
Tech Mahindra Buy 481 600 46,759 29,673 32,937 15.5 17.0 32.8 39.9 14.7 12.0 2.9 2.5 19.6 20.7 1.3 1.1
Wipro Buy 457 583 111,018 55,440 60,430 18.1 18.1 36.1 38.9 12.7 11.7 2.3 2.1 19.0 17.6 1.7 1.5
Media
D B Corp Neutral 379 - 6,971 2,297 2,590 27.4 28.2 21.0 23.4 18.1 16.2 4.2 3.7 23.7 23.1 2.8 2.4
HT Media Neutral 83 - 1,929 2,693 2,991 12.6 12.9 7.9 9.0 10.5 9.2 0.9 0.8 7.8 8.3 0.3 0.2
Jagran Prakashan Buy 187 225 6,118 2,355 2,635 28.0 28.0 10.8 12.5 17.3 15.0 3.8 3.3 21.7 21.7 2.6 2.3
Sun TV Network Neutral 684 - 26,949 2,850 3,265 70.1 71.0 26.2 30.4 26.1 22.5 6.7 5.9 24.3 25.6 9.1 7.8Hindustan Media Ventures Neutral 276 - 2,029 1,016 1,138 24.3 25.2 27.3 30.1 10.1 9.2 1.9 1.7 16.2 15.8 1.3 1.1
TV Today Network Buy 270 385 1,609 637 743 27.5 27.5 18.4 21.4 14.7 12.6 2.6 2.2 17.4 17.2 2.1 1.7
Metals & Mining
Coal India Neutral 326 - 202,393 84,638 94,297 21.4 22.3 24.5 27.1 13.3 12.0 5.5 5.3 42.6 46.0 1.9 1.7
Hind. Zinc Neutral 322 - 135,907 14,252 18,465 55.9 48.3 15.8 21.5 20.4 15.0 3.3 2.9 17.0 20.7 9.5 7.4
Hindalco Neutral 192 - 39,587 107,899 112,095 7.4 8.2 9.2 13.0 20.8 14.7 1.0 1.0 4.8 6.6 0.9 0.8
JSW Steel Neutral 191 - 46,169 53,201 58,779 16.1 16.2 130.6 153.7 1.5 1.2 0.2 0.2 14.0 14.4 1.6 1.4
NMDC Neutral 148 - 46,920 6,643 7,284 44.4 47.7 7.1 7.7 20.9 19.3 1.8 1.8 8.8 9.2 4.8 4.4
SAIL Neutral 66 - 27,073 47,528 53,738 (0.7) 2.1 (1.9) 2.6 25.2 0.7 0.7 (1.6) 3.9 1.4 1.3
Vedanta Neutral 251 - 74,340 71,744 81,944 19.2 21.7 13.4 20.1 18.7 12.5 1.6 1.4 8.4 11.3 1.4 1.1
Tata Steel Neutral 472 - 45,837 121,374 121,856 7.2 8.4 18.6 34.3 25.4 13.8 1.6 1.5 6.1 10.1 1.0 1.0
Oil & Gas
Cairn India Neutral 276 - 51,755 9,127 10,632 4.3 20.6 8.8 11.7 31.4 23.6 1.0 1.0 3.3 4.2 7.1 5.9
GAIL Neutral 478 - 60,601 56,220 65,198 9.3 10.1 27.1 33.3 17.6 14.4 1.6 1.5 9.3 10.7 1.3 1.1
ONGC Neutral 201 - 257,884 137,222 152,563 15.0 21.8 19.5 24.1 10.3 8.3 0.9 0.8 8.5 10.1 2.2 1.9
Indian Oil Corp Neutral 387 - 188,093 373,359 428,656 5.9 5.5 54.0 59.3 7.2 6.5 1.1 1.0 16.0 15.6 0.7 0.6
Reliance Industries Neutral 1,034 - 335,290 301,963 358,039 12.1 12.6 87.7 101.7 11.8 10.2 1.2 1.1 10.7 11.3 1.6 1.3
Pharmaceuticals
Alembic Pharma Neutral 557 - 10,506 3,483 4,083 20.2 21.4 24.3 30.4 22.9 18.3 5.2 4.2 25.5 25.3 3.0 2.4
www.angelbroking.com
Stock WatchFebruary 06, 2017
Company Name Reco CMP Target Mkt Cap Sales ( ₹cr ) OPM(%) EPS (₹) PER(x) P/BV(x) RoE(%) EV/Sales(x)
( ₹ ) Price ( ₹) ( ₹ cr ) FY17E FY18E FY17E FY18E FY17E FY18E FY17E FY18E FY17E FY18E FY17E FY18E FY17E FY18E
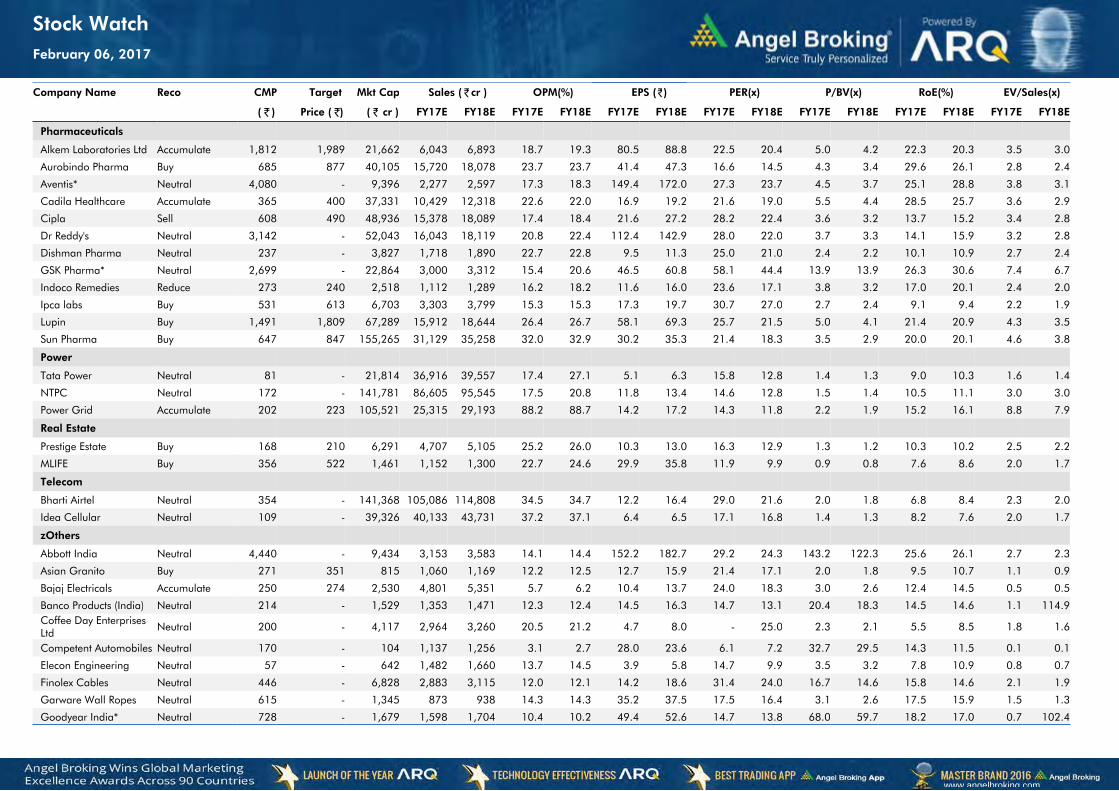
Pharmaceuticals
Alkem Laboratories Ltd Accumulate 1,812 1,989 21,662 6,043 6,893 18.7 19.3 80.5 88.8 22.5 20.4 5.0 4.2 22.3 20.3 3.5 3.0
Aurobindo Pharma Buy 685 877 40,105 15,720 18,078 23.7 23.7 41.4 47.3 16.6 14.5 4.3 3.4 29.6 26.1 2.8 2.4
Aventis* Neutral 4,080 - 9,396 2,277 2,597 17.3 18.3 149.4 172.0 27.3 23.7 4.5 3.7 25.1 28.8 3.8 3.1
Cadila Healthcare Accumulate 365 400 37,331 10,429 12,318 22.6 22.0 16.9 19.2 21.6 19.0 5.5 4.4 28.5 25.7 3.6 2.9
Cipla Sell 608 490 48,936 15,378 18,089 17.4 18.4 21.6 27.2 28.2 22.4 3.6 3.2 13.7 15.2 3.4 2.8
Dr Reddy's Neutral 3,142 - 52,043 16,043 18,119 20.8 22.4 112.4 142.9 28.0 22.0 3.7 3.3 14.1 15.9 3.2 2.8
Dishman Pharma Neutral 237 - 3,827 1,718 1,890 22.7 22.8 9.5 11.3 25.0 21.0 2.4 2.2 10.1 10.9 2.7 2.4
GSK Pharma* Neutral 2,699 - 22,864 3,000 3,312 15.4 20.6 46.5 60.8 58.1 44.4 13.9 13.9 26.3 30.6 7.4 6.7
Indoco Remedies Reduce 273 240 2,518 1,112 1,289 16.2 18.2 11.6 16.0 23.6 17.1 3.8 3.2 17.0 20.1 2.4 2.0
Ipca labs Buy 531 613 6,703 3,303 3,799 15.3 15.3 17.3 19.7 30.7 27.0 2.7 2.4 9.1 9.4 2.2 1.9
Lupin Buy 1,491 1,809 67,289 15,912 18,644 26.4 26.7 58.1 69.3 25.7 21.5 5.0 4.1 21.4 20.9 4.3 3.5
Sun Pharma Buy 647 847 155,265 31,129 35,258 32.0 32.9 30.2 35.3 21.4 18.3 3.5 2.9 20.0 20.1 4.6 3.8
Power
Tata Power Neutral 81 - 21,814 36,916 39,557 17.4 27.1 5.1 6.3 15.8 12.8 1.4 1.3 9.0 10.3 1.6 1.4
NTPC Neutral 172 - 141,781 86,605 95,545 17.5 20.8 11.8 13.4 14.6 12.8 1.5 1.4 10.5 11.1 3.0 3.0
Power Grid Accumulate 202 223 105,521 25,315 29,193 88.2 88.7 14.2 17.2 14.3 11.8 2.2 1.9 15.2 16.1 8.8 7.9
Real Estate
Prestige Estate Buy 168 210 6,291 4,707 5,105 25.2 26.0 10.3 13.0 16.3 12.9 1.3 1.2 10.3 10.2 2.5 2.2
MLIFE Buy 356 522 1,461 1,152 1,300 22.7 24.6 29.9 35.8 11.9 9.9 0.9 0.8 7.6 8.6 2.0 1.7
Telecom
Bharti Airtel Neutral 354 - 141,368 105,086 114,808 34.5 34.7 12.2 16.4 29.0 21.6 2.0 1.8 6.8 8.4 2.3 2.0
Idea Cellular Neutral 109 - 39,326 40,133 43,731 37.2 37.1 6.4 6.5 17.1 16.8 1.4 1.3 8.2 7.6 2.0 1.7
zOthers
Abbott India Neutral 4,440 - 9,434 3,153 3,583 14.1 14.4 152.2 182.7 29.2 24.3 143.2 122.3 25.6 26.1 2.7 2.3
Asian Granito Buy 271 351 815 1,060 1,169 12.2 12.5 12.7 15.9 21.4 17.1 2.0 1.8 9.5 10.7 1.1 0.9
Bajaj Electricals Accumulate 250 274 2,530 4,801 5,351 5.7 6.2 10.4 13.7 24.0 18.3 3.0 2.6 12.4 14.5 0.5 0.5
Banco Products (India) Neutral 214 - 1,529 1,353 1,471 12.3 12.4 14.5 16.3 14.7 13.1 20.4 18.3 14.5 14.6 1.1 114.9Coffee Day Enterprises Ltd Neutral 200 - 4,117 2,964 3,260 20.5 21.2 4.7 8.0 - 25.0 2.3 2.1 5.5 8.5 1.8 1.6
Competent Automobiles Neutral 170 - 104 1,137 1,256 3.1 2.7 28.0 23.6 6.1 7.2 32.7 29.5 14.3 11.5 0.1 0.1
Elecon Engineering Neutral 57 - 642 1,482 1,660 13.7 14.5 3.9 5.8 14.7 9.9 3.5 3.2 7.8 10.9 0.8 0.7
Finolex Cables Neutral 446 - 6,828 2,883 3,115 12.0 12.1 14.2 18.6 31.4 24.0 16.7 14.6 15.8 14.6 2.1 1.9
Garware Wall Ropes Neutral 615 - 1,345 873 938 14.3 14.3 35.2 37.5 17.5 16.4 3.1 2.6 17.5 15.9 1.5 1.3
Goodyear India* Neutral 728 - 1,679 1,598 1,704 10.4 10.2 49.4 52.6 14.7 13.8 68.0 59.7 18.2 17.0 0.7 102.4
www.angelbroking.com
Stock WatchFebruary 06, 2017

Company Name Reco CMP Target Mkt Cap Sales ( ₹cr ) OPM(%) EPS (₹) PER(x) P/BV(x) RoE(%) EV/Sales(x)
( ₹ ) Price ( ₹) ( ₹ cr ) FY17E FY18E FY17E FY18E FY17E FY18E FY17E FY18E FY17E FY18E FY17E FY18E FY17E FY18E
zOthers
Hitachi Neutral 1,429 - 3,884 2,081 2,433 8.8 8.9 33.4 39.9 42.8 35.8 34.5 28.8 22.1 21.4 1.9 1.6
HSIL Neutral 284 - 2,056 2,384 2,515 15.8 16.3 15.3 19.4 18.6 14.7 18.5 15.9 7.8 9.3 1.0 0.9
Interglobe Aviation Neutral 859 - 31,036 21,122 26,005 14.5 27.6 110.7 132.1 7.8 6.5 46.4 33.2 168.5 201.1 1.4 1.1
Jyothy Laboratories Neutral 351 - 6,368 1,440 2,052 11.5 13.0 8.5 10.0 41.3 35.1 10.0 9.3 18.6 19.3 4.7 3.3Kirloskar Engines India Ltd Neutral 343 - 4,959 2,554 2,800 9.9 10.0 10.5 12.1 32.7 28.3 13.7 12.9 10.7 11.7 1.6 1.4
Linc Pen & Plastics Neutral 267 - 395 382 420 9.3 9.5 13.5 15.7 19.8 17.0 3.4 2.9 17.1 17.3 1.1 1.0
M M Forgings Neutral 495 - 597 546 608 20.4 20.7 41.3 48.7 12.0 10.2 67.8 60.0 16.6 17.0 0.9 0.8
Manpasand Bever. Neutral 660 - 3,776 836 1,087 19.6 19.4 16.9 23.8 39.1 27.7 4.7 4.1 12.0 14.8 4.3 3.2
Mirza International Buy 93 107 1,118 1,024 1,148 18.0 18.0 6.9 8.0 13.5 11.6 2.3 1.9 16.6 16.3 1.3 1.1
MT Educare Neutral 127 - 507 366 417 17.7 18.2 9.4 10.8 13.6 11.8 3.0 2.6 22.2 22.3 1.3 1.1
Narayana Hrudaya Neutral 334 - 6,827 1,873 2,166 11.5 11.7 2.6 4.0 126.3 84.3 7.8 7.0 6.1 8.3 3.7 3.2
Navkar Corporation Buy 174 265 2,481 369 561 42.9 42.3 7.2 11.5 24.1 15.1 1.8 1.6 7.4 10.5 7.7 5.1
Navneet Education Neutral 133 - 3,107 1,062 1,147 24.0 24.0 6.1 6.6 21.8 20.1 4.5 4.0 20.6 19.8 3.0 2.8
Nilkamal Neutral 1,672 - 2,495 1,995 2,165 10.7 10.4 69.8 80.6 24.0 20.7 95.5 83.0 16.6 16.5 1.2 1.1
Page Industries Neutral 14,238 - 15,880 2,450 3,124 20.1 17.6 299.0 310.0 47.6 45.9 317.1 242.1 47.1 87.5 6.5 5.1
Parag Milk Foods Neutral 270 - 2,272 1,919 2,231 9.3 9.6 9.5 12.9 28.6 20.9 4.4 3.7 15.5 17.5 1.3 1.1
Quick Heal Neutral 278 - 1,949 408 495 27.3 27.0 7.7 8.8 35.9 31.6 3.3 3.3 9.3 10.6 3.9 3.2
Radico Khaitan Buy 122 147 1,629 1,667 1,824 13.0 13.2 6.7 8.2 18.4 15.0 1.7 1.5 9.0 10.2 1.4 1.2
Relaxo Footwears Neutral 438 - 5,259 2,085 2,469 9.2 8.2 7.6 8.0 57.9 55.1 22.5 19.2 17.9 18.8 2.6 2.2
S H Kelkar & Co. Neutral 312 - 4,517 1,036 1,160 15.1 15.0 6.1 7.2 51.2 43.5 5.5 5.0 10.7 11.5 4.2 3.7
Siyaram Silk Mills Accumulate 1,548 1,720 1,451 1,652 1,857 11.6 11.7 92.4 110.1 16.7 14.1 2.5 2.1 14.7 15.2 1.1 1.0
Styrolution ABS India* Neutral 637 - 1,119 1,440 1,537 9.2 9.0 40.6 42.6 15.7 14.9 40.0 36.4 12.3 11.6 0.7 0.6
Surya Roshni Neutral 191 - 837 3,342 3,625 7.8 7.5 17.3 19.8 11.1 9.7 21.0 16.9 10.5 10.8 0.5 0.5
Team Lease Serv. Neutral 941 - 1,608 3,229 4,001 1.5 1.8 22.8 32.8 41.3 28.6 4.4 3.8 10.7 13.4 0.4 0.3
The Byke Hospitality Neutral 164 - 656 287 384 20.5 20.5 7.6 10.7 21.5 15.3 4.5 3.6 20.7 23.5 2.3 1.7Transport Corporation of India Neutral 183 - 1,404 2,671 2,911 8.5 8.8 13.9 15.7 13.2 11.7 1.8 1.6 13.7 13.8 0.6 0.6
TVS Srichakra Neutral 3,306 - 2,531 2,304 2,614 13.7 13.8 231.1 266.6 14.3 12.4 371.4 292.5 33.9 29.3 1.1 0.9
UFO Moviez Neutral 422 - 1,166 619 685 33.2 33.4 30.0 34.9 14.1 12.1 2.0 1.7 13.8 13.9 1.6 1.3
Visaka Industries Neutral 207 - 329 1,051 1,138 10.3 10.4 21.0 23.1 9.9 9.0 26.6 24.9 9.0 9.2 0.6 0.5
www.angelbroking.com
Stock WatchFebruary 06, 2017

Company Name Reco CMP Target Mkt Cap Sales ( ₹cr ) OPM(%) EPS (₹) PER(x) P/BV(x) RoE(%) EV/Sales(x)
( ₹ ) Price ( ₹) ( ₹ cr ) FY17E FY18E FY17E FY18E FY17E FY18E FY17E FY18E FY17E FY18E FY17E FY18E FY17E FY18E
zOthers
VRL Logistics Neutral 302 - 2,752 1,902 2,119 16.7 16.6 14.6 16.8 20.7 17.9 4.5 4.0 21.9 22.2 1.6 1.4
Wonderla Holidays Neutral 377 - 2,129 287 355 38.0 40.0 11.3 14.2 33.4 26.5 4.8 4.2 21.4 23.9 7.1 5.8
Source: Company, Angel Research; Note: *December year end; #September year end; &October year end; Price as on February 04, 2017
www.angelbroking.com
Stock WatchFebruary 06, 2017

Research Team Tel: 022 - 39357800 E-mail: [email protected] Website: www.angelbroking.com
DISCLAIMER
Angel Broking Private Limited (hereinafter referred to as “Angel”) is a registered Member of National Stock Exchange of India Limited,Bombay Stock Exchange Limited and Metropolitan Stock Exchange Limited. It is also registered as a Depository Participant with CDSL and Portfolio Manager with SEBI. It also has registration with AMFI as a Mutual Fund Distributor. Angel Broking Private Limited is a registered entity with SEBI for Research Analyst in terms of SEBI (Research Analyst) Regulations, 2014 vide registration number INH000000164. Angel or its associates has not been debarred/ suspended by SEBI or any other regulatory authority for accessing /dealing in securities Market. Angel or its associates/analyst has not received any compensation / managed or co-managed public offering of securities of the company covered by Analyst during the past twelve months.
This document is solely for the personal information of the recipient, and must not be singularly used as the basis of any investmentdecision. Nothing in this document should be construed as investment or financial advice. Each recipient of this document should make such investigations as they deem necessary to arrive at an independent evaluation of an investment in the securities of the companies referred to in this document (including the merits and risks involved), and should consult their own advisors to determine the merits and risks of such an investment.
Reports based on technical and derivative analysis center on studying charts of a stock's price movement, outstanding positions andtrading volume, as opposed to focusing on a company's fundamentals and, as such, may not match with a report on a company'sfundamentals. Investors are advised to refer the Fundamental and Technical Research Reports available on our website to evaluate the contrary view, if any.
The information in this document has been printed on the basis of publicly available information, internal data and other reliablesources believed to be true, but we do not represent that it is accurate or complete and it should not be relied on as such, as thisdocument is for general guidance only. Angel Broking Pvt. Limited or any of its affiliates/ group companies shall not be in any wayresponsible for any loss or damage that may arise to any person from any inadvertent error in the information contained in this report.Angel Broking Pvt. Limited has not independently verified all the information contained within this document. Accordingly, we cannottestify, nor make any representation or warranty, express or implied, to the accuracy, contents or data contained within this document.While Angel Broking Pvt. Limited endeavors to update on a reasonable basis the information discussed in this material, there may beregulatory, compliance, or other reasons that prevent us from doing so.
This document is being supplied to you solely for your information, and its contents, information or data may not be reproduced,redistributed or passed on, directly or indirectly.
Neither Angel Broking Pvt. Limited, nor its directors, employees or affiliates shall be liable for any loss or damage that may arise fromor in connection with the use of this information.
www.angelbroking.com
Market OutlookFebruary 06, 2017