Embed Size (px)
Citation preview

1 1
www.angelbroking.com
Market Outlook
January 02, 2018
www.angelbroking.com
Market Cues
Indian markets are likely to open negative tracking global indices and SGX Nifty.
Most global stock markets remain closed today on New Year's Eve after posting their
best annual gain since 2013. The Dow Jones fell 0.48% to close at 24,719and the
Nasdaq Composite or 0.67 percent, to 6,903.
The majority of the European markets remain closed. However in the last trading
session the FTSE wrapped up with a solid increase, which drove the market to a new
high for the year. The FTSE 100 is down by 0.9% to close at 7,688.
Indian shares succumbed to profit after reaching record highs last year despite
sluggish corporate earnings and short-term disruptions caused by the
implementation of the GST. Lack of cues from global markets also weighed on
markets. The Sensex ended down 0.72% at 33,813.The Nifty ended at 10,436,
recording a loss of 0.9%.
News Analysis
Maruti Suzuki sales up ~10% in December, but exports hit slow lane
Detailed analysis on Pg2
Investor’s Ready Reckoner
Key Domestic & Global Indicators
Stock Watch: Latest investment recommendations on 150+ stocks
Refer Pg5 onwards
Top Picks
Company Sector Rating CMP
(`) Target
(`) Upside
(%)
Blue Star Capital Goods Accumulate 819 867 5.9
Dewan Housing Finance Financials Buy 591 712 20.5
Asian Granito Other Accumulate 570 639 12.1
Navkar Corporation Other Buy 191 265 38.5
KEI Industries Capital Goods Buy 374 436 16.6
More Top Picks on Pg4
Key Upcoming Events
Date Region Event Description Previous
Reading
Consensus
Expectations
Jan02 Germany PMI Manufacturing 63.30 63.30
Jan02 Germany Unemployment change (000's) (18.00) (13.00)
Jan03 UK PMI Manufacturing 58.20 57.90
Jan03 US Initial Jobless claims 245.00
Jan04 US Unnemployment rate 4.10 4.10
More Events on Pg7
Domestic Indices Chg (%) (Pts) (Close)
BSE Sensex (0.7) (244) 33,813
Nifty (0.9) (95) 10,436
Mid Cap 0.1 13 17,836
Small Cap 0.3 49 19,280
Bankex (0.8) (218) 28,639
Global Indices Chg (%) (Pts) (Close)
Dow Jones (0.5) (118) 24,719
Nasdaq (0.7) (47) 6,903
FTSE 0.9 65 7,688
Nikkei (0.1) (19) 22,765
Hang Seng 0.2 55 29,919
Shanghai Com 0.3 11 3,307
Advances / Declines BSE NSE
Advances 1,663 1,021
Declines 1,279 784
Unchanged 128 45
Volumes (` Cr)
BSE 4,865
NSE 28,339
Net Inflows (` Cr) Net Mtd Ytd
FII 1,254 (6,579) 51,053
*MFs 1,012 6,114 1,16,352
Top Gainers Price (`) Chg (%)
Rnaval 65 32.3
Rpower 61 20.7
Unitech 11 17.2
Ltts 1,068 4.6
Videoind 21 4.3
Top Losers Price (`) Chg (%)
Jpassociat 25 (3.5)
Idea 105 (3.1)
Coromandel 560 (2.9)
Irb 232 (2.5)
Rcom 35 (2.3)
As on January 01 2018

2
www.angelbroking.com
Market Outlook
January 02, 2018
www.angelbroking.com
News Analysis
Maruti Suzuki sales up ~10% in December, but exports hit slow lane
Automobile major Maruti Suzuki India reported a 10.3% rise in its monthly sales
for December. According to the company, its total sales including exports during
the month under review rose to 130,066 units from 117,908 units sold during the
corresponding month of 2016. This includes 119,286 units in the domestic market
and 10,780 units of exports. The company had sold a total of 117,908 units in
December 2016.
The company's December domestic sales edged higher by 12.1 per cent to
119,286 units from 106,414 units. However, exports dipped by 6.2 per cent, with
10,780 units that were shipped out during last month, up from 11,494 units sold
abroad in December 2016.
Economic and Political News
CPI for industrial workers up at 3.97% in Nov as food items get costlier.
United Payments Interface (UPI) closed the year on a high, as the volume of
transactions jumped 39% to 145.64 million in December.
Corporate News
Thermax wins Rs 327cr order for a co-generation power plant.
GAIL commissions India’s second largest rooftop solar plant.
Prestige Estates to buy CapitaLand’s stake in various entities for Rs 342cr.

3
www.angelbroking.com
Market Outlook
January 02, 2018
www.angelbroking.com
Top Picks HHHHH
Company Market Cap
(` Cr)
CMP
(`) Target
(`) Upside
(%) Rationale
Alkem Laboratories 26,615 2,226 2,341 5.2
Strong growth in domestic business due to its leade`hip
in acute therapeutic segment. Alkem expects to launch
more products in USA, which bodes for its international
business.
Asian Granito 1,715 570 639 12.1
We expect the company would report strong profitability
owing to better product mix, higher B2C sales and
amalgamation synergy.
Blue Star 7,851 819 867 5.9
Favorable outlook for the AC industry to augur well for
Cooling products business which is out pacing the
market growth. EMPPAC division's profitability to
improve once operating environment turns around.
Dewan Housing Finance 18,529 591 712 20.5
With a focus on the low and medium income (LMI)
consumer segment, the company has increased its
presence in tier-II & III cities where the growth
opportunity is immense.
Karur Vysya Bank 8,898 123 180 46.0
Loan growth is likely to pick up after a sluggish FY17.
Lower credit cost will help in strong bottom-line growth.
Increasing share of CASA will help in NIM
improvement.
KEI Industries 2,931 374 436 16.6
High order book execution in EPC segment, rising B2C
sales and higher exports to boost the revenues and
profitability
Music Broadcast 2,157 378 434 14.8 Expected to benefit from the lower capex requirement
and 15 year long radio broadcast licensing.
Navkar Corporation 2,881 191 265 38.5 Massive capacity expansion along with rail advantage
at ICD as well CFS augur well for the company
Siyaram Silk Mills 3,493 745 813 9.1
Strong brands and distribution network would boost
growth going ahead. Stock currently trades at an
inexpensive valuation.
TV Today Network 2,596 435 500 14.9
Market leadership in Hindi news genre and no. 2
viewership ranking in English news genre, exit from the
radio business, and anticipated growth in ad spends by
corporate to benefit the stock.
Maruti Suzuki 2,91,974 9,665 10,619 9.9
After GST, the company is expected to see higher
volumes along with improving product mix. The Gujarat
plant will also enable higher operating leverage which
will be margin accretive.
GIC Housing
2,490 462 655 41.7
We expect loan book to grow at 24.3% over next two
year; change in borrowing mix will help in NIM
improvement
Century Plyboards India 7,722 348 400 15.1
We expect CPIL to report net Revenue/PAT CAGR of
~17%/16% over FY2017-20E mainly due to healthy
growth in plywood & lamination business, forayed into
MDF & Particle boards on back of strong brand &
distribution network.
LT Foods 2,927 92 102 11.5
We expect sales/PAT to grow at 13.5%/20% over next
two years on the back of strong distribution network &
addition of new products in portfolio.
Ruchira Papers
450 201 244 21.6
We expect sales/PAT to grow at 13%/16% over next two
years on the back of strong healthy demand in writing
& printing paper and Kraft paper. Further, China had
banned making paper from waste pulp which would
benefit Indian paper companies.
Source: Company, Angel Research

1
www.angelbroking.com
Market Outlook
January 02, 2018
www.angelbroking.com
Key Upcoming Events
Global economic events release calendar
Date Time Country Event Description Unit Period
Bloomberg Data
Last Reported Estimated
Jan 02, 2018 2:25 PM Germany PMI Manufacturing Value Dec F 63.30 63.30
2:25 PM Germany Unemployment change (000's) Thousands Dec (18.00) (13.00)
Jan 03, 2018 3:00 PM UK PMI Manufacturing Value Dec 58.20 57.90
Jan 04, 2018 7:00 PM US Initial Jobless claims Thousands Dec 30 245.00
7:00 PM US Unnemployment rate % Dec 4.10 4.10
Jan 05, 2018 2:25 PM Germany PMI Services Value Dec F 55.80 55.80
7:00 PM US Change in Nonfarm payrolls Thousands Dec 228.00 189.00
Jan 08, 2018 3:30 PM Euro Zone Euro-Zone Consumer Confidence Value Dec F 0.50
Jan 10, 2018 3:00 PM UK Industrial Production (YoY) % Change Nov 3.60
India Imports YoY% % Change Dec 19.60
India Exports YoY% % Change Dec 30.60
7:00 AM China Consumer Price Index (YoY) % Change Dec 1.70 1.90
Jan 11, 2018
US Producer Price Index (mom) % Change Dec 1.40
Jan 12, 2018
China Exports YoY% % Change Dec 12.30
7:00 PM US Consumer price index (mom) % Change Dec 0.40
Jan 15, 2018 12:00 PM India Monthly Wholesale Prices YoY% % Change Dec 3.93
Jan 16, 2018 3:30 PM Euro Zone Euro-Zone CPI (YoY) % Dec F 1.50
Jan 17, 2018 3:00 PM UK CPI (YoY) % Change Dec 3.10
7:45 PM US Industrial Production % Dec 0.20
Jan 18, 2018 7:00 PM US Housing Starts Thousands Dec 1,297.00
7:00 PM US Building permits Thousands Dec 1,303.00
7:30 AM China Industrial Production (YoY) % Change Dec 6.10
7:30 AM China Real GDP (YoY) % Change 4Q 6.80
Jan 24, 2018 8:30 PM US Existing home sales Million Dec 5.81
Source: Bloomberg, Angel Research

3
www.angelbroking.com
Market Outlook
January 02, 2018
www.angelbroking.com
Macro watch
Exhibit 1: Quarterly GDP trends
Source: CSO, Angel Research
Exhibit 2: IIP trends
Source: MOSPI, Angel Research
Exhibit 3: Monthly CPI inflation trends
Source: MOSPI, Angel Research
Exhibit 4: Manufacturing and services PMI
Source: Market, Angel Research; Note: Level above 50 indicates expansion
Exhibit 5: Exports and imports growth trends
Source: Bloomberg, Angel Research
Exhibit 6: Key policy rates
Source: RBI, Angel Research
6.1
7.3 7.6
8.0
7.2
9.1
7.9
7.5
7.0
6.1
5.7
6.3
3.0
4.0
5.0
6.0
7.0
8.0
9.0
10.0
3Q
FY15
4Q
FY15
1Q
FY16
2Q
FY16
3Q
FY16
4Q
FY16
1Q
FY17
2Q
FY17
3Q
FY17
4Q
FY17
1Q
FY18
2Q
FY18
(%)
2.4
3.5
1.2
4.4
3.2
2.9
(0.3)
1.0
4.5
4.1
2.2
(1.0)
-
1.0
2.0
3.0
4.0
5.0
Dec-16
Jan-17
Feb-17
Mar-17
Apr-17
May-17
Jun-17
Jul-17
Aug-17
Sep-17
Oct-17
(%)
3.4 3.2
3.7 3.9
3.0
2.2
1.5
2.4
3.3 3.3
3.6
4.9
-
1.0
2.0
3.0
4.0
5.0
6.0
Dec-16
Jan-17
Feb-17
Mar-17
Apr-17
May-17
Jun-17
Jul-17
Aug-17
Sep-17
Oct-17
Nov-17
(%)
40.0
42.0
44.0
46.0
48.0
50.0
52.0
54.0
56.0 O
ct-16
Nov-16
Dec-16
Jan-17
Feb-17
Mar-17
Apr-17
May-17
Jun-17
Jul-17
Aug-17
Sep-17
Oct-17
Nov-17
Mfg. PMI Services PMI
(10.0)
0.0
10.0
20.0
30.0
40.0
50.0
60.0
Dec-16
Jan-17
Feb-17
Mar-17
Apr-17
May-17
Jun-17
Jul-17
Aug-17
Sep-17
Oct-17
Nov-17
Exports yoy growth Imports yoy growth(%)
3.00
3.50
4.00
4.50
5.00
5.50
6.00
6.50
No
v-1
6
Dec-1
6
Jan-17
Jan-17
Feb-1
7
Mar-17
Mar-17
Apr-17
May-17
May-17
Jun-1
7
Jul-1
7
Aug-17
Aug-17
Sep-1
7
Oct-1
7
Repo rate Reverse Repo rate CRR(%)
4
www.angelbroking.com
Market Outlook
January 02, 2018
www.angelbroking.com
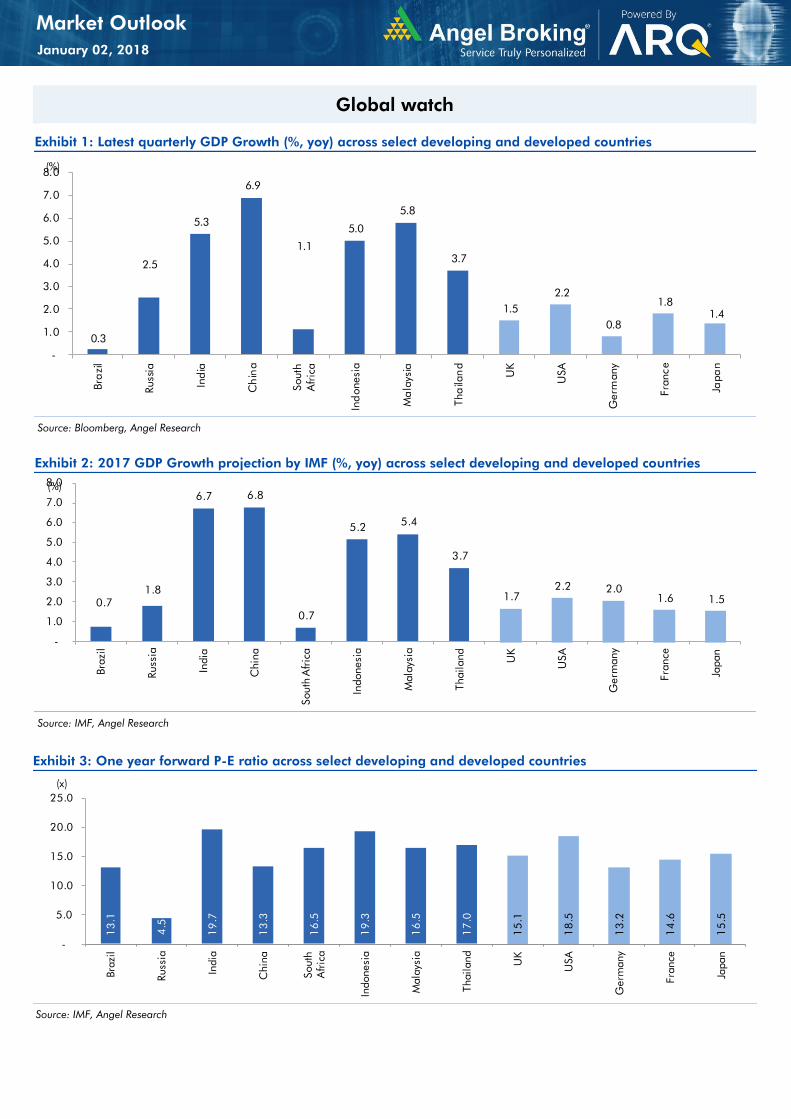
Global watch
Exhibit 1: Latest quarterly GDP Growth (%, yoy) across select developing and developed countries
Source: Bloomberg, Angel Research
Exhibit 2: 2017 GDP Growth projection by IMF (%, yoy) across select developing and developed countries
Source: IMF, Angel Research
Exhibit 3: One year forward P-E ratio across select developing and developed countries
Source: IMF, Angel Research
0.3
2.5
5.3
6.9
1.1
5.0
5.8
3.7
1.5
2.2
0.8
1.8
1.4
-
1.0
2.0
3.0
4.0
5.0
6.0
7.0
8.0
Bra
zil
Russia
Ind
ia
Ch
ina
South
Africa
Ind
onesia
Ma
laysia
Tha
ilan
d
UK
USA
Germ
any
France
Ja
pa
n
(%)
0.7
1.8
6.7 6.8
0.7
5.2 5.4
3.7
1.7
2.2 2.0
1.6 1.5
-
1.0
2.0
3.0
4.0
5.0
6.0
7.0
8.0
Brazil
Russia
India
China
South A
frica
Indonesia
Malaysia
Thailand
UK
USA
Germ
any
France
Japan
(%)
13
.1
4.5
19
.7
13
.3
16
.5
19
.3
16
.5
17
.0
15
.1
18
.5
13
.2
14
.6
15
.5
-
5.0
10.0
15.0
20.0
25.0
Brazil
Russia
India
China
South
Africa
Indonesia
Malaysia
Thailand
UK
USA
Germ
any
France
Japan
(x)

5
www.angelbroking.com
Market Outlook
January 02, 2018
www.angelbroking.com
Exhibit 4: Relative performance of indices across globe
Returns (%)
Country Name of index Closing price 1M 3M 1YR
Brazil Bovespa 76,402 3.2 1.3 33.4
Russia Micex 2,110 (0.7) 1.6 (7.7)
India Nifty 10,531 0.7 6.8 29.9
China Shanghai Composite 3,307 (0.9) (1.0) 5.4
South Africa Top 40 52,533 (2.4) 7.6 20.3
Mexico Mexbol 49,354 4.4 (2.0) 8.1
Indonesia LQ45 1,079 6.0 10.6 21.2
Malaysia KLCI 1,797 4.5 1.8 9.9
Thailand SET 50 1,135 4.7 6.3 20.7
USA Dow Jones 24,719 3.7 10.4 25.1
UK FTSE 7,688 4.1 5.0 7.1
Japan Nikkei 22,765 0.7 12.3 17.4
Germany DAX 12,918 (0.6) 2.5 11.4
France CAC 5,313 (0.9) 0.4 8.4
Source: Bloomberg, Angel Research p68in4

Company Name Reco CMP Target Mkt Cap Sales ( ₹cr ) OPM(%) EPS (₹) PER(x) P/BV(x) RoE(%) EV/Sales(x)
( ₹ ) Price ( ₹) ( ₹ cr ) FY18E FY19E FY18E FY19E FY18E FY19E FY18E FY19E FY18E FY19E FY18E FY19E FY18E FY19E
Agri / Agri Chemical
Rallis Sell 270 209 5,251 1,873 2,099 15.0 15.0 9.5 10.5 28.4 25.7 4.3 3.9 15.8 16.0 2.7 2.4
United Phosphorus Accumulate 757 820 38,495 18,922 21,949 18.0 18.5 36.2 45.6 20.9 16.6 4.4 3.6 22.7 23.8 2.2 1.8
Auto & Auto Ancillary
Ashok Leyland Accumulate 119 127 34,789 23,339 27,240 10.1 10.8 4.7 6.2 25.6 19.1 5.1 4.5 20.0 23.6 1.4 1.2
Bajaj Auto Neutral 3,293 - 95,300 23,936 27,955 19.5 20.1 142.7 167.3 23.1 19.7 5.0 4.5 21.8 22.8 3.6 3.0
Bharat Forge Buy 723 875 33,667 7,637 8,755 21.7 23.2 36.1 47.3 20.0 15.3 3.6 3.1 18.5 20.8 4.3 3.6
Eicher Motors Neutral 29,893 - 81,419 19,043 22,837 19.5 19.9 835.4 1,019.0 35.8 29.3 13.4 10.3 40.9 37.8 4.1 3.4
Gabriel India Neutral 202 - 2,897 1,782 2,033 9.7 10.2 7.1 8.9 28.4 22.8 5.7 4.9 21.0 22.2 1.6 1.4
Hero Motocorp Accumulate 3,769 4,129 75,266 32,239 36,878 16.0 15.6 184.4 206.5 20.4 18.3 6.4 5.6 31.3 30.7 2.1 1.8
Jamna Auto Industries Neutral 82 - 3,253 1,441 1,662 14.4 14.8 13.9 17.6 5.9 4.6 1.6 1.3 30.0 31.0 2.3 1.9
Mahindra and Mahindra Neutral 746 - 92,680 46,971 53,816 13.6 14.0 67.7 79.8 11.0 9.3 1.6 1.4 15.0 15.9 1.9 1.6
Maruti Accumulate 9,665 10,619 291,974 79,470 95,208 15.9 17.2 281.7 363.8 34.3 26.6 7.5 6.1 21.7 22.8 3.3 2.7
Minda Industries Neutral 1,277 - 11,038 4,328 5,084 11.0 11.9 27.3 36.4 46.9 35.1 9.9 7.8 23.1 25.6 2.6 2.2
Motherson Sumi Neutral 379 - 79,828 55,937 64,445 10.8 11.4 16.9 21.1 22.4 18.0 5.0 5.1 25.2 25.4 1.5 1.3
Tata Motors Neutral 425 - 122,828 303,167 343,649 11.8 13.8 33.1 54.7 12.9 7.8 2.1 1.7 16.9 23.0 0.5 0.4
TVS Motor Neutral 766 - 36,408 13,992 16,216 9.0 9.4 17.1 20.3 45.0 37.8 11.9 9.2 29.7 27.7 2.5 2.1
Amara Raja Batteries Neutral 834 - 14,239 6,140 7,122 14.3 15.6 29.3 39.0 28.5 21.4 4.9 4.1 17.1 19.0 2.3 2.0
Exide Industries Neutral 220 - 18,670 8,689 9,854 15.1 15.2 9.7 11.0 22.8 20.0 4.0 3.6 15.7 16.1 1.9 1.6
Apollo Tyres Neutral 269 - 15,368 15,739 17,326 13.3 14.6 20.4 26.7 13.2 10.1 1.6 1.4 20.4 26.7 1.2 1.1
Ceat Neutral 1,945 - 7,868 6,661 7,717 11.1 14.2 116.2 178.2 16.7 10.9 2.9 2.4 15.2 21.3 1.3 1.1
JK Tyres Neutral 147 - 3,330 8,318 9,239 16.2 16.4 21.0 27.5 7.0 5.3 1.4 1.1 19.1 20.4 0.8 0.7
Swaraj Engines Neutral 2,079 - 2,583 788 889 16.4 16.5 71.6 81.0 29.0 25.7 8.4 7.8 29.6 31.0 2.9 2.5
Subros Neutral 306 - 1,836 1,855 2,135 11.6 11.8 10.3 14.7 29.9 20.9 4.5 3.9 15.8 19.1 1.2 1.0
Capital Goods
BEML Neutral 1,599 - 6,658 4,286 5,194 7.1 8.2 42.9 58.1 37.3 27.5 3.1 2.8 7.6 8.7 1.6 1.3
Bharat Electronics Neutral 181 - 44,582 10,258 12,470 19.6 19.5 7.3 8.6 24.9 21.1 0.5 0.4 20.4 21.9 3.8 3.1
Voltas Neutral 649 - 21,463 6,778 8,004 9.6 11.0 17.1 22.4 37.9 29.0 9.1 7.9 17.7 19.8 2.9 2.4
BHEL Neutral 95 - 34,878 33,200 39,167 6.8 9.5 6.2 11.2 15.3 8.5 0.7 0.7 4.6 8.0 0.6 0.5
Blue Star Accumulate 819 867 7,851 5,220 6,207 6.3 6.6 16.8 22.3 48.7 36.7 9.7 8.6 19.9 23.3 1.5 1.2CG Power and Industrial Solutions Neutral 93 - 5,816 6,555 7,292 7.5 7.5 - 0.8 9,280.0 116.0 1.4 1.5 0.1 1.2 1.0 0.9
Greaves Cotton Neutral 140 - 3,425 1,778 1,993 14.7 15.1 8.1 9.1 17.3 15.4 3.9 3.6 21.8 23.6 1.7 1.5
www.angelbroking.com
Stock WatchJanuary 02, 2018

Company Name Reco CMP Target Mkt Cap Sales ( ₹cr ) OPM(%) EPS (₹) PER(x) P/BV(x) RoE(%) EV/Sales(x)
( ₹ ) Price ( ₹) ( ₹ cr ) FY18E FY19E FY18E FY19E FY18E FY19E FY18E FY19E FY18E FY19E FY18E FY19E FY18E FY19E
Capital Goods
KEC International Neutral 381 - 9,802 9,779 11,113 9.4 9.8 14.2 18.2 26.9 21.0 5.1 4.2 21.1 22.1 1.3 1.1
KEI Industries Buy 374 436 2,931 3,001 3,391 10.0 10.0 13.0 16.1 28.8 23.2 5.2 4.3 18.2 18.7 1.2 1.0
Thermax Neutral 1,207 - 14,383 4,125 4,747 10.3 10.8 26.7 31.5 45.2 38.3 5.1 4.6 11.2 12.0 3.2 2.8
VATech Wabag Accumulate 629 681 3,437 3,867 4,126 9.6 10.0 34.9 39.8 18.0 15.8 3.0 2.6 17.7 17.5 0.9 0.8
Cement
ACC Neutral 1,735 - 32,584 12,255 13,350 13.5 14.3 58.0 66.2 29.9 26.2 3.5 3.3 11.5 12.2 2.6 2.4
Ambuja Cements Neutral 268 - 53,126 10,250 11,450 17.5 19.0 7.2 8.3 37.2 32.2 2.7 2.5 7.0 7.8 5.0 4.4
India Cements Neutral 181 - 5,578 6,135 6,750 14.8 15.2 8.5 11.5 21.3 15.7 1.1 1.0 4.8 6.2 1.3 1.1
JK Cement Neutral 1,119 - 7,824 4,150 4,775 19.2 20.0 49.0 63.5 22.8 17.6 3.6 3.1 17.0 18.5 2.3 2.0
J K Lakshmi Cement Neutral 440 - 5,176 3,422 3,757 15.5 17.0 13.5 23.2 32.6 19.0 3.4 2.9 10.8 15.5 1.9 1.7
Orient Cement Neutral 168 - 3,442 2,215 3,233 16.8 17.0 5.9 6.9 28.5 24.4 2.2 2.0 10.8 10.1 2.6 1.7
Prism Cement Accumulate 117 131 5,892 5,155 5,616 7.0 7.0 2.0 3.0 58.5 39.0 5.4 4.7 10.0 13.8 1.4 1.3
UltraTech Cement Neutral 4,258 - 116,890 28,250 35,150 20.2 23.5 77.5 122.2 54.9 34.8 4.6 4.2 9.6 14.8 4.6 3.7
Construction
KNR Constructions Neutral 320 - 4,497 1,846 2,203 14.5 14.5 12.1 13.7 26.4 23.4 1.5 1.3 17.5 16.7 2.5 2.1
Larsen & Toubro Neutral 1,262 - 176,782 95,787 109,476 10.2 11.6 44.5 50.8 28.4 24.9 3.6 3.3 12.9 13.1 2.4 2.1
Gujarat Pipavav Port Neutral 137 - 6,613 739 842 61.6 62.7 5.1 6.2 26.8 22.2 3.3 3.3 12.7 14.9 8.4 7.3
PNC Infratech Neutral 212 - 5,434 2,040 2,935 13.0 13.0 6.4 9.0 33.1 23.5 0.9 0.8 9.7 12.2 2.7 1.9
Simplex Infra Neutral 574 - 2,838 6,012 6,619 11.6 11.7 21.1 31.0 27.3 18.5 1.9 1.7 6.5 8.6 1.0 0.9
Sadbhav Engineering Neutral 430 - 7,369 3,823 4,426 10.7 10.8 10.3 11.8 41.7 36.4 5.0 4.4 10.1 10.5 2.2 2.0
NBCC Neutral 247 - 22,230 9,099 12,706 6.4 6.4 7.3 9.6 33.9 25.8 1.5 1.2 27.5 30.5 2.3 1.7
MEP Infra Neutral 93 - 1,518 2,403 2,910 18.3 16.8 2.4 6.1 39.7 15.4 15.1 10.2 35.2 55.8 1.8 1.5
SIPL Neutral 146 - 5,146 2,060 2,390 46.8 47.7 (5.8) (3.1) 5.5 6.2 (14.2) (2.3) 7.3 6.7
Engineers India Neutral 196 - 13,208 1,795 2,611 21.1 22.4 5.9 8.1 33.2 24.2 2.4 2.3 12.9 16.1 5.7 3.8
Financials
Axis Bank Neutral 565 - 144,821 32,558 35,843 3.5 3.2 27.8 41.0 20.3 13.8 2.2 1.9 11.4 14.9 - -
Bank of Baroda Neutral 162 - 37,224 22,533 26,079 2.4 2.4 12.0 20.9 13.5 7.7 0.9 0.8 6.6 11.0 - -
Canara Bank Neutral 362 - 21,592 17,925 20,235 2.0 2.1 18.5 36.5 19.5 9.9 0.7 0.7 3.4 6.2 - -
Can Fin Homes Neutral 478 - 6,358 586 741 3.5 3.5 107.8 141.0 4.4 3.4 1.0 0.8 24.1 25.6 - -Cholamandalam Inv. & Fin. Co. Neutral 1,318 - 20,599 2,826 3,307 6.3 6.3 53.7 64.6 24.6 20.4 4.2 3.6 18.3 18.9 - -
Dewan Housing Finance Buy 591 712 18,523 2,676 3,383 2.4 2.7 37.4 49.7 15.8 11.9 2.1 1.8 13.8 16.2 - -
Equitas Holdings Buy 148 235 5,011 1,125 1,380 9.6 9.8 1.5 6.0 98.3 24.6 2.2 2.1 2.4 8.2 - -
www.angelbroking.com
Stock WatchJanuary 02, 2018

Company Name Reco CMP Target Mkt Cap Sales ( ₹cr ) OPM(%) EPS (₹) PER(x) P/BV(x) RoE(%) EV/Sales(x)
( ₹ ) Price ( ₹) ( ₹ cr ) FY18E FY19E FY18E FY19E FY18E FY19E FY18E FY19E FY18E FY19E FY18E FY19E FY18E FY19E
Financials
Federal Bank Accumulate 109 125 21,383 4,896 5,930 2.8 3.1 5.4 7.6 20.3 14.4 1.7 1.6 8.5 11.0 - -
GIC Housing Buy 462 655 2,490 376 477 3.6 3.7 33.0 40.0 14.0 11.6 2.5 2.1 20.0 23.0 - -
HDFC Bank Neutral 1,857 - 480,986 55,236 63,253 4.5 4.4 68.9 82.4 27.0 22.5 4.7 3.9 18.7 18.5 - -
ICICI Bank Neutral 311 - 199,437 42,361 51,378 3.6 3.9 18.4 25.7 16.9 12.1 1.8 1.8 11.3 15.0 - -
Karur Vysya Bank Buy 123 180 8,898 3,289 3,630 3.7 3.9 10.8 14.1 11.4 8.8 1.4 1.2 12.5 14.7 - -
LIC Housing Finance Accumulate 566 630 28,546 4,895 6,332 3.4 3.7 50.7 66.8 11.2 8.5 2.2 1.8 21.7 23.8 - -
Punjab Natl.Bank Neutral 170 - 41,174 23,708 25,758 2.1 2.1 5.9 16.4 28.9 10.3 0.9 0.8 3.0 8.3 - -
RBL Bank Neutral 509 - 21,234 2,309 2,888 2.6 2.5 16.4 19.1 31.1 26.7 3.9 3.5 13.3 13.8 - -
Repco Home Finance Buy 695 825 4,351 496 597 4.4 4.2 38.5 48.7 18.1 14.3 3.2 2.7 19.6 20.6 - -
South Ind.Bank Neutral 31 - 5,679 3,195 3,567 3.0 3.1 3.0 3.8 10.4 8.2 1.0 0.9 10.5 11.9 - -
St Bk of India Neutral 307 - 265,047 105,827 121,056 2.4 2.5 16.1 25.6 19.1 12.0 1.5 1.4 6.6 9.9 - -
Union Bank Neutral 145 - 12,404 14,650 16,225 2.3 2.3 23.1 32.5 6.3 4.5 0.5 0.4 7.1 9.2 - -
Yes Bank Neutral 313 - 71,996 11,088 13,138 3.0 2.9 84.0 99.3 3.7 3.2 0.6 0.5 16.3 16.8 - -
FMCG
Akzo Nobel India Neutral 1,860 - 8,921 3,164 3,607 13.8 13.7 58.6 67.9 31.8 27.4 7.8 6.9 24.5 25.1 2.7 2.3
Asian Paints Neutral 1,147 - 109,972 17,603 20,615 18.6 18.6 2,128.9 2,543.3 0.5 0.5 11.4 9.6 28.0 28.9 6.0 5.1
Britannia Neutral 4,739 - 56,897 9,690 11,278 14.8 15.4 84.0 101.0 56.4 46.9 20.6 16.3 40.6 39.0 5.8 5.0
Colgate Neutral 1,099 - 29,902 4,420 5,074 24.9 25.3 28.6 32.8 38.4 33.5 15.2 12.2 43.8 40.5 6.5 5.6
Dabur India Neutral 350 - 61,565 8,346 9,344 19.6 19.9 7.8 9.0 44.8 38.8 9.0 8.2 25.2 24.8 7.0 6.1
GlaxoSmith Con* Neutral 6,507 - 27,366 5,072 5,760 18.2 18.4 176.3 199.2 36.9 32.7 7.8 7.1 21.2 21.7 4.7 4.1
Godrej Consumer Neutral 988 - 67,295 10,171 11,682 20.8 21.5 21.7 27.1 45.5 36.5 10.2 8.8 22.3 23.4 6.7 5.8
HUL Neutral 1,347 - 291,609 37,077 41,508 20.3 21.8 5,189.9 6,318.5 0.3 0.2 41.1 35.1 74.8 82.0 7.7 6.9
ITC Neutral 263 - 320,548 44,588 49,853 37.0 37.3 9.6 11.0 27.4 23.9 6.7 6.4 25.1 27.3 6.7 5.9
Marico Neutral 321 - 41,414 6,788 7,766 18.5 19.2 7.1 8.5 45.2 37.8 15.8 13.5 36.9 38.0 5.9 5.2
Nestle* Neutral 7,851 - 75,698 10,083 11,182 20.0 20.9 119.7 141.3 65.6 55.6 231.2 211.3 36.7 39.8 7.2 6.4
Tata Global Neutral 313 - 19,748 7,121 7,641 11.9 12.3 6.9 8.0 45.4 39.1 3.0 2.9 6.8 7.2 2.6 2.4Procter & Gamble Hygiene Neutral 9,359 - 30,380 3,034 3,579 27.1 27.7 167.7 198.8 55.8 47.1 15.0 12.9 28.8 29.5 9.4 7.9
IT
HCL Tech^ Buy 881 1,014 125,718 50,009 54,608 22.1 22.1 62.8 67.6 14.0 13.0 3.2 2.7 22.4 20.6 2.2 1.9
Infosys Accumulate 1,035 1,120 237,635 70,333 75,960 26.0 26.0 61.7 65.9 16.8 15.7 3.2 2.9 18.9 18.7 2.8 2.5
TCS Reduce 2,655 2,442 508,176 123,384 134,488 26.1 26.1 133.2 143.7 19.9 18.5 5.5 5.1 27.6 27.8 3.8 3.4
www.angelbroking.com
Stock WatchJanuary 02, 2018

Company Name Reco CMP Target Mkt Cap Sales ( ₹cr ) OPM(%) EPS (₹) PER(x) P/BV(x) RoE(%) EV/Sales(x)
( ₹ ) Price ( ₹) ( ₹ cr ) FY18E FY19E FY18E FY19E FY18E FY19E FY18E FY19E FY18E FY19E FY18E FY19E FY18E FY19E
IT
Tech Mahindra Neutral 503 - 49,109 30,545 32,988 15.0 15.0 35.2 37.6 14.3 13.4 2.4 2.3 16.8 16.2 1.4 1.2
Wipro Neutral 318 - 154,639 54,164 56,544 22.3 22.3 18.8 19.5 16.9 16.3 2.7 2.3 15.0 13.6 2.1 1.8
Media
D B Corp Neutral 358 - 6,581 2,404 2,625 30.5 31.5 23.7 26.9 15.1 13.3 3.6 3.0 23.5 22.8 2.6 2.3
HT Media Neutral 102 - 2,364 2,589 2,830 15.1 15.4 8.3 10.9 12.2 9.3 1.0 0.9 8.4 10.4 0.5 0.3
Jagran Prakashan Buy 180 225 5,607 2,541 2,835 28.5 28.7 12.7 14.1 14.2 12.8 2.9 2.5 21.3 21.4 2.1 1.8
Sun TV Network Neutral 996 - 39,257 3,238 3,789 51.9 55.1 30.9 38.0 32.2 26.2 9.2 8.1 30.0 31.0 11.6 9.8Hindustan Media Ventures Neutral 255 - 1,870 1,002 1,074 23.3 23.5 29.2 33.8 8.7 7.5 1.4 1.2 15.6 15.4 0.9 0.6
TV Today Network Accumulate 435 500 2,596 667 727 27.7 27.7 18.6 20.1 23.4 21.7 3.6 3.7 15.6 17.3 3.4 3.2
Music Broadcast Limited Accumulate 378 434 2,157 271 317 91.0 109.0 6.0 10.0 63.0 37.8 3.9 3.6 6.5 9.3 7.5 6.2
Metals & Mining
Coal India Neutral 266 - 165,396 82,301 91,235 17.0 18.0 17.1 20.5 15.6 13.0 2.9 2.8 45.0 55.0 1.7 1.5
Hind. Zinc Neutral 309 - 130,605 22,108 24,555 57.0 58.0 22.1 26.3 14.0 11.8 4.5 3.7 32.0 35.0 4.9 4.1
Hindalco Neutral 271 - 60,893 102,350 105,355 13.5 14.5 21.5 24.5 12.6 11.1 1.7 1.5 15.0 15.2 1.2 1.1
JSW Steel Neutral 266 - 64,250 64,500 68,245 21.1 21.5 20.1 21.2 13.2 12.5 2.4 2.1 - - 1.7 1.6
NMDC Neutral 141 - 44,532 10,209 11,450 47.0 48.0 11.1 12.1 12.7 11.6 1.8 1.7 - - 3.9 3.5
SAIL Neutral 93 - 38,286 54,100 63,555 3.0 10.0 (10.0) 1.5 61.8 1.2 1.2 - - 1.7 1.5
Vedanta Neutral 325 - 120,976 81,206 87,345 28.0 29.0 26.5 33.5 12.3 9.7 2.8 2.4 - - 2.2 1.9
Tata Steel Neutral 724 - 70,287 121,445 126,500 16.2 17.2 65.4 81.3 11.1 8.9 1.8 1.5 - - 1.1 1.0
Oil & Gas
GAIL Neutral 500 - 84,557 53,115 52,344 14.2 15.3 30.0 31.1 16.7 16.1 2.1 1.9 - - 1.3 1.3
ONGC Neutral 192 - 246,912 83,111 84,934 44.2 44.9 16.4 16.9 11.7 11.4 1.4 1.3 - - 2.8 2.8
Indian Oil Corp Neutral 390 - 189,235 396,116 432,560 8.5 8.8 40.1 42.2 9.7 9.2 1.7 1.5 - - 0.6 0.6
Reliance Industries Neutral 912 - 592,854 257,711 267,438 17.0 18.2 89.1 89.5 10.2 10.2 1.0 0.9 - - 2.0 1.9
Pharmaceuticals
Alembic Pharma Accumulate 531 600 10,011 3,346 3,915 19.6 19.2 21.0 23.9 25.3 22.2 4.5 3.8 19.1 18.4 3.0 2.6
Alkem Laboratories Ltd Accumulate 2,207 2,341 26,382 6,320 7,341 17.5 19.8 72.7 96.6 30.4 22.8 5.4 4.5 16.7 18.7 4.1 3.5
Aurobindo Pharma Buy 685 823 40,142 17,086 19,478 22.1 22.0 44.7 51.4 15.3 13.3 3.4 2.7 24.7 22.7 2.5 2.1
Aventis* Neutral 4,691 - 10,804 2,411 2,698 18.8 18.8 151.6 163.9 30.9 28.6 4.8 3.9 25.4 27.5 4.1 3.4
Cadila Healthcare Reduce 433 411 44,313 11,365 12,926 20.0 20.0 18.4 20.5 23.5 21.1 5.2 4.3 24.3 22.2 4.0 3.5
Cipla Sell 612 462 49,242 16,163 18,711 16.6 16.9 20.7 24.3 29.6 25.2 3.5 3.1 12.6 13.1 3.2 2.7
Dr Reddy's Sell 2,412 2,040 39,988 13,734 15,548 17.7 20.2 69.9 102.0 34.5 23.6 3.1 2.8 9.2 12.4 3.1 2.7
GSK Pharma* Sell 2,458 2,000 20,822 2,968 3,324 13.8 15.9 37.8 46.3 65.0 53.1 11.4 12.5 16.7 22.4 6.8 6.2
www.angelbroking.com
Stock WatchJanuary 02, 2018

Company Name Reco CMP Target Mkt Cap Sales ( ₹cr ) OPM(%) EPS (₹) PER(x) P/BV(x) RoE(%) EV/Sales(x)
( ₹ ) Price ( ₹) ( ₹ cr ) FY18E FY19E FY18E FY19E FY18E FY19E FY18E FY19E FY18E FY19E FY18E FY19E FY18E FY19E
Pharmaceuticals
Indoco Remedies Sell 284 136 2,619 1,114 1,297 9.9 13.9 5.6 11.4 50.8 24.9 3.8 3.4 7.7 14.5 2.6 2.2
Ipca labs Neutral 596 - 7,517 3,256 3,647 14.1 17.1 16.2 25.4 36.8 23.5 2.8 2.6 8.0 11.5 2.4 2.1
Lupin Buy 884 1,091 39,968 16,240 18,562 21.3 21.7 42.5 49.6 20.8 17.8 2.6 2.3 13.3 13.7 2.6 2.2
Natco Pharma Accumulate 986 1,057 18,196 1,886 2,016 32.3 29.5 23.2 22.0 42.6 44.7 8.9 7.9 20.9 17.6 9.5 8.9
Sun Pharma Accumulate 574 630 137,621 28,312 32,153 20.7 23.1 18.5 23.3 31.0 24.6 3.5 3.2 11.5 14.6 4.5 3.9
Syngene International Accumulate 546 587 10,924 1,394 1,818 33.0 36.5 15.8 21.0 34.5 26.0 6.4 5.3 18.6 20.3 7.8 6.0
Power
Tata Power Neutral 97 - 26,277 32,547 33,806 20.5 20.5 4.7 5.4 20.7 18.2 2.0 1.7 10.5 10.5 1.8 1.7
NTPC Neutral 176 - 145,450 86,070 101,246 28.3 30.7 12.9 16.2 13.7 10.9 1.4 1.3 10.6 12.4 3.1 2.7
Power Grid Accumulate 200 223 104,789 29,183 32,946 89.7 90.0 18.0 20.8 11.2 9.6 1.9 1.7 17.7 18.2 7.5 7.0
Real Estate
Prestige Estate Neutral 317 - 11,891 4,607 5,146 21.0 22.2 7.9 9.8 40.1 32.4 2.5 2.3 10.3 12.0 3.8 3.4
MLIFE Accumulate 476 522 2,441 487 590 12.3 17.8 21.0 31.2 22.7 15.3 1.2 1.1 5.2 7.4 3.7 3.0
Telecom
Bharti Airtel Neutral 528 - 211,123 97,903 105,233 36.0 36.3 9.3 11.1 56.8 47.8 2.7 2.6 5.0 5.6 3.1 2.8
Idea Cellular Neutral 105 - 37,825 35,012 37,689 27.1 27.7 (4.4) (2.7) 1.6 1.7 (6.8) (4.6) 2.4 2.2
Others
Abbott India Neutral 5,513 - 11,715 3,244 3,723 14.9 16.1 167.5 209.4 32.9 26.3 7.3 6.1 23.7 24.8 3.3 2.8
Asian Granito Accumulate 570 639 1,715 1,169 1,286 12.5 12.5 16.0 19.7 35.7 28.9 3.8 3.4 10.7 11.6 1.7 1.5
Bajaj Electricals Neutral 488 - 4,973 4,646 5,301 6.7 7.6 16.1 22.3 30.3 21.9 5.0 4.2 16.4 19.2 1.1 0.9
Banco Products (India) Neutral 258 - 1,846 1,530 1,695 13.2 12.7 19.0 20.0 13.6 12.9 2.2 1.9 0.2 0.2 1.1 124.9Coffee Day Enterprises Ltd Neutral 280 - 5,913 3,494 3,913 17.4 18.0 4.8 5.7 - 49.1 2.5 2.4 - 0.1 2.2 1.9
Elecon Engineering Neutral 105 - 1,177 171 201 15.0 16.2 36.0 43.0 2.9 2.4 0.2 0.2 0.1 0.1 6.3 5.3
Garware Wall Ropes Neutral 937 - 2,051 928 1,003 15.2 15.2 39.4 43.2 23.8 21.7 3.9 3.4 16.5 15.4 2.1 1.9
Goodyear India* Neutral 1,091 - 2,516 1,717 1,866 11.8 12.3 47.9 49.8 22.8 21.9 3.5 3.1 15.6 15.7 1.2 166.8
Hitachi Neutral 2,685 - 7,301 2,355 2,715 10.3 10.8 49.0 60.9 54.8 44.1 12.8 10.1 0.2 0.2 3.1 2.7
HSIL Neutral 501 - 3,621 2,240 2,670 14.6 15.0 17.0 22.0 29.5 22.8 2.4 2.3 0.1 0.1 1.8 1.5
Interglobe Aviation Neutral 1,203 - 46,233 22,570 27,955 14.2 15.0 63.6 81.8 18.9 14.7 10.0 8.4 0.5 0.6 1.7 1.3
Jyothy Laboratories Neutral 377 - 6,851 1,781 2,044 14.1 15.0 9.4 10.5 40.3 35.9 8.6 8.1 0.2 0.2 4.1 3.5
Linc Pen & Plastics Neutral 389 - 576 420 462 9.3 9.3 15.3 17.1 25.5 22.8 4.3 4.4 16.9 19.5 1.4 1.3
M M Forgings Neutral 1,175 - 1,418 542 642 20.1 21.0 41.6 56.8 28.3 20.7 3.9 3.3 0.1 0.2 3.0 2.6
Mirza International Neutral 161 - 1,935 1,148 1,285 18.0 18.0 8.0 9.4 20.0 17.2 3.3 2.8 16.3 16.1 1.8 1.6
Navkar Corporation Buy 191 265 2,881 561 617 41.5 41.5 11.5 12.7 16.6 15.1 1.8 1.6 10.5 10.4 5.8 5.1
www.angelbroking.com
Stock WatchJanuary 02, 2018

Company Name Reco CMP Target Mkt Cap Sales ( ₹cr ) OPM(%) EPS (₹) PER(x) P/BV(x) RoE(%) EV/Sales(x)
( ₹ ) Price ( ₹) ( ₹ cr ) FY18E FY19E FY18E FY19E FY18E FY19E FY18E FY19E FY18E FY19E FY18E FY19E FY18E FY19E
Others
Nilkamal Neutral 1,864 - 2,781 2,317 2,525 11.4 11.1 96.0 105.0 19.4 17.8 3.3 2.9 0.2 0.2 1.2 1.1
Parag Milk Foods Neutral 298 - 2,506 1,987 2,379 7.6 9.0 12.4 18.3 24.0 16.3 3.4 3.0 8.2 13.2 1.4 1.2
Radico Khaitan Neutral 295 - 3,930 1,811 1,992 13.2 13.2 8.1 8.8 36.4 33.5 3.7 4.0 10.1 12.0 2.5 2.3
Relaxo Footwears Neutral 684 - 8,235 1,981 2,310 13.7 14.5 12.0 15.5 57.0 44.2 11.1 9.0 0.2 0.2 4.2 3.6
Siyaram Silk Mills Accumulate 745 813 3,493 1,769 1,981 12.7 12.7 22.6 26.2 32.9 28.4 5.1 4.4 15.5 15.5 2.2 1.9
Styrolution ABS India* Neutral 1,050 - 1,847 1,800 1,980 8.0 8.1 42.0 46.2 25.0 22.7 2.8 2.5 0.1 0.1 1.1 1.1
Surya Roshni Neutral 388 - 1,698 4,870 5,320 7.7 7.8 22.8 28.1 17.0 13.8 2.3 2.0 0.1 0.1 0.6 0.5
TVS Srichakra Neutral 3,953 - 3,027 2,729 2,893 12.7 12.5 248.5 265.0 15.9 14.9 4.5 3.7 0.3 0.3 1.1 1.0
Visaka Industries Neutral 656 - 1,041 1,104 1,214 12.1 12.6 31.0 37.9 21.2 17.3 2.6 2.3 0.1 0.1 1.2 1.0
VIP Industries Accumulate 351 400 4,964 1,450 1,693 10.4 10.5 6.5 7.8 53.7 45.0 11.4 9.9 21.1 22.1 3.4 2.9
Navin Fluorine Neutral 829 - 4,091 945 1,154 17.5 17.9 28.7 34.8 28.9 23.9 4.8 4.1 - - 3.8 3.0
Century Plyboards India Buy 348 400 7,722 2,007 2,510 22.4 22.6 8.4 11.1 41.4 31.3 8.8 7.1 21.3 22.9 4.2 3.4
LT Foods Accumulate 92 102 2,927 3,287 3,747 11.1 11.5 4.4 5.2 20.8 17.6 3.1 2.5 17.5 17.6 1.4 1.2
Ruchira Papers Buy 201 244 450 470 532 15.6 15.6 16.5 19.0 12.2 10.6 2.4 2.0 20.0 19.2 1.1 1.0
Source: Company, Angel Research; Note: *December year end; #September year end; &October year end; Price as on January 01, 2018
www.angelbroking.com
Stock WatchJanuary 02, 2018

Research Team Tel: 022 - 39357800 E-mail: [email protected] Website: www.angelbroking.com
DISCLAIMER
Angel Broking Private Limited (hereinafter referred to as “Angel”) is a registered Member of National Stock Exchange of India Limited,Bombay Stock Exchange Limited and Metropolitan Stock Exchange Limited. It is also registered as a Depository Participant with CDSL and Portfolio Manager with SEBI. It also has registration with AMFI as a Mutual Fund Distributor. Angel Broking Private Limited is a registered entity with SEBI for Research Analyst in terms of SEBI (Research Analyst) Regulations, 2014 vide registration number INH000000164. Angel or its associates has not been debarred/ suspended by SEBI or any other regulatory authority for accessing /dealing in securities Market. Angel or its associates/analyst has not received any compensation / managed or co-managed public offering of securities of the company covered by Analyst during the past twelve months.
This document is solely for the personal information of the recipient, and must not be singularly used as the basis of any investmentdecision. Nothing in this document should be construed as investment or financial advice. Each recipient of this document should make such investigations as they deem necessary to arrive at an independent evaluation of an investment in the securities of the companies referred to in this document (including the merits and risks involved), and should consult their own advisors to determine the merits and risks of such an investment.
Reports based on technical and derivative analysis center on studying charts of a stock's price movement, outstanding positions andtrading volume, as opposed to focusing on a company's fundamentals and, as such, may not match with a report on a company'sfundamentals. Investors are advised to refer the Fundamental and Technical Research Reports available on our website to evaluate the contrary view, if any.
The information in this document has been printed on the basis of publicly available information, internal data and other reliablesources believed to be true, but we do not represent that it is accurate or complete and it should not be relied on as such, as thisdocument is for general guidance only. Angel Broking Pvt. Limited or any of its affiliates/ group companies shall not be in any wayresponsible for any loss or damage that may arise to any person from any inadvertent error in the information contained in this report.Angel Broking Pvt. Limited has not independently verified all the information contained within this document. Accordingly, we cannottestify, nor make any representation or warranty, express or implied, to the accuracy, contents or data contained within this document.While Angel Broking Pvt. Limited endeavors to update on a reasonable basis the information discussed in this material, there may beregulatory, compliance, or other reasons that prevent us from doing so.
This document is being supplied to you solely for your information, and its contents, information or data may not be reproduced,redistributed or passed on, directly or indirectly.
Neither Angel Broking Pvt. Limited, nor its directors, employees or affiliates shall be liable for any loss or damage that may arise fromor in connection with the use of this information.
www.angelbroking.com
Market OutlookJanuary 02, 2018