Embed Size (px)
Citation preview
FINANCIAL ECONOMICS | RESEARCH ARTICLE
Investor sentiment and stock return volatility:Evidence from the Johannesburg Stock ExchangeLorraine Rupande1, Hilary Tinotenda Muguto1 and Paul-Francois Muzindutsi1*
Abstract: Volatility is an important component of asset pricing; an increase involatility on markets can trigger changes in the risk distribution of financialassets. In conventional financial theory, investors are considered to be rationaland any changes in relevant risk are assumed to be a result of the movement infundamental factors. However, herein this study, it is hypothesized that there aremovements in risk that are driven by volatility linked to sentiment-driven noisetrader activity whose patterns are irreconcilable with changes in fundamentalfactors. This assertion is tested using a daily sentiment composite index con-structed from a set of proxies and Generalised Autoregressive ConditionalHeteroscedasticity models on the South African market over a period spanningJuly 2002 to June 2018. The results show that there is a significant connectionbetween investor sentiment and stock return volatility which shows that beha-vioural finance can significantly explain the behaviour of stock returns on theJohannesburg Stock Exchange. It is, thus, recommended that due to the inade-quacies of popular asset pricing models such as the Capital Asset Pricing Model,consideration should be made towards augmenting these asset pricing modelswith a sentiment risk factor.
ABOUT THE AUTHORSLorraine Rupande is a PhD candidate at theUniversity of KwaZulu-Natal in the school ofAccounting, Economics and Finance. Her researchinterests include financial markets, behaviouralfinance and financial risk management.
Hilary Tinotenda Muguto is a PhD candidate atthe University of KwaZulu-Natal under the HEARDdivision. His research interests include healthcareequity and finance, financial markets, behaviouralfinance, investment analysis and developmenteconomics.
Paul-Francois Muzindutsi (PhD) is an associateprofessor of Finance in the School of Accounting,Economics and Finance, University of KwaZulu-Natal. His research interests include financialmarkets, behavioural finance, financial risk man-agement, time series analysis of macroeconomicvariables, investment analysis and developmenteconomics.
PUBLIC INTEREST STATEMENTThis paper investigates whether stock marketreturn volatility is influenced by market-wideinvestor sentiment on the South African market.Daily closing prices and dividend yields on theJohannesburg Stock Exchange All Share Indexwere employed to compute the returns anda composite sentiment index was constructedusing a set of seven proxies to measure senti-ment over the period spanning July 2002 toJune 2018. The Generalised AutoregressiveConditional Heteroscedasticity models were thenused to examine the relationship between mar-ket returns and investor sentiment. The empiricalfindings show that there is a significant rela-tionship between market-wide investor senti-ment and stock return volatility on the SouthAfrican market. Thus, although traditional assetpricing models ignore investor behaviouralbiases, their impact on asset pricing is significant.As such, consideration should be made towardsadding behavioural risk factors to the traditionalasset pricing models to ensure that financialassets are correctly priced.
Rupande et al., Cogent Economics & Finance (2019), 7: 1600233https://doi.org/10.1080/23322039.2019.1600233
© 2019 The Author(s). This open access article is distributed under a Creative CommonsAttribution (CC-BY) 4.0 license.
Received: 08 November 2018Accepted: 24 March 2019First Published: 31 March 2019
*Corresponding author: Paul-FrancoisMuzindutsi, University of KwaZulu-Natal, School of Accounting,Economics and Finance, Westvillecampus, Bag X 5400, Durban 4000,South AfricaE-mail: [email protected]
Reviewing editor:Zhaojun Yang, Finance, SouthernUniversity of Science andTechnology, China
Additional information is available atthe end of the article
Page 1 of 16

Subjects: Behavioural Finance; Corporate Finance; Financial Asset Pricing; Financial AssetPrice Discovery; Investment & Securities; Risk Management; Traditional Asset PricingModels
Keywords: Generalised autoregressive conditional heteroscedasticity model (GARCH);investor sentiment; stock return volatility; noise tradersJEL classification: G11; G12; G14; G40; G41
1. IntroductionBehavioural finance, a new paradigm in finance, continues to burgeon. Introduced as a response tothe modern finance theory, behavioural finance replaces the supposition that investors always actrationally whenmaking investment decisions with the idea that investors do not always act rationallyas they are prone to various behavioural biases. This replacement has certain consequences for assetpricing; it implies that the mean-variance portfolio theory (Markowitz, 1952) is replaced by beha-vioural portfolio theory (Shefrin & Statman, 2000). It also implies that the traditional asset pricingmodels such as the capital asset pricing model (Linter, 1964; Sharpe, 1964) are replaced by beha-vioural asset pricing models (Statman, 2014). This is because the mean-variance portfolio theory andthe traditional asset pricing models are based on the assertion that expected returns are determinedby risk and that risk is determined by movements in fundamental factors only. Instead, in addition tothe fundamental risk, behavioural portfolio theory and behavioural asset pricingmodels recognize theimpact of behavioural biases on investors’ decisions (Kapoor & Prosad, 2017).
The irrational traders identified in behavioural finance are termed as noise traders (Herve,Zouaoui, & Belvaux, 2019). These are the investors whose wants, cognitive errors and emotionsaffect their preferences for certain stocks (Shefrin & Statman, 1984). Consequently, they irration-ally act on noise in their investment decision-making as if it were fundamental information thatwould allow them to consistently earn abnormal returns on the financial markets (Peress &Schmidt, 2017). In traditional finance, there is an argument that the noise traders are eradicatedfrom the markets by their rational counterparts through the process of arbitrage. The sophisticatedinstitutional investors, considered to be rational, exploit less sophisticated retail investors, con-sidered to be the noise traders (Lin, Sias, & Wei, 2018). The process of exploitation of the mispricingis aided by the increased liquidity that comes with the noise traders (Barrot, Kaniel, & Sraer, 2016).As a result, the presence and the impact of the irrational noise traders on financial markets isconsidered to be only transient at best. This explains why traditional finance did not take them intoaccount when the framework was constructed.
However, this process of exploitation might not occur as quickly as expected (Lin, Sias, et al., 2018).This means that the noise traders may survive in the market for protracted periods. Further, rationalinvestors demand a risk premium to trade stocks that are prone to noise trading. This is because theunpredictability of the noise traders’ beliefs creates a risk—termed as noise trader risk—in the price ofthe asset that deters rational arbitrageurs from aggressively betting against them. Even if there issome form ofmispricing that can be exploited tomake a profit, rational investors face the risk that themispricing might get worse in the short run, triggering margin calls and thereby forcing early liquida-tion of their positions at a loss (Ljungqvist & Qian, 2016). Only when the premium is high enough willthe rational traders bet against the irrational noise traders (Akbas, Boehmer, Jiang, & Koch, 2019). Thismay also result in noise traders surviving for protracted periods on the financial markets. Add to that,there are limits to arbitrage on most financial markets which prevent sophisticated investors fromtrading profitably against the irrational noise traders (Chu, Hirshleifer, & Ma, 2017). These include theshort-selling constraints in regulation and short-selling risk such as stock loans becoming expensiveand being recalled (Engelberg, Reed, & Ringgenberg, 2018).
The trading patterns of noise traders have been found to be linked to the prevailing market-widesentiment (Brown, 1999). Sentiment is defined as the overall attitude of investors towards parti-cular financial assets or financial markets that is not dependent on the flow of fundamental
Rupande et al., Cogent Economics & Finance (2019), 7: 1600233https://doi.org/10.1080/23322039.2019.1600233
Page 2 of 16
information (Antoniou, Doukas, & Subrahmanyam, 2015). Noise traders usually enter the marketduring high sentiment periods because they interpret the high optimism that typifies high senti-ment periods as fundamental information instead of a noisy signal that it is (Shen, Yu, & Zhao,2017). Incorrect assumptions are made about the distribution of returns of financial securities dueto a marked overreliance on recent non-fundamental information, all of which results in mispricing(Miwa, 2016). In low sentiment periods, characterized by a negative outlook, the incidence of noisetraders on the financial markets is low because these traders are reluctant to take on shortpositions in their portfolios (Uygur & Taş, 2014). Therefore, mispricing is more likely to occur inhigh sentiment periods than in low sentiment periods.
The mispricing that occurs in high sentiment periods as a result of the increased incidence of noisetraders leads to increased market volatility (Bahloul & Bouri, 2016). According to Devault, Sias, andStarks (2019), sentiment traders shift from safer to more speculative stocks when sentimentincreases. Due to herd behaviour, the sentiment-driven noise traders trade in concert, causingtrading volumes to increase rapidly, all of which results in increased market volatility (Blasco,Corredor, & Ferrer, 2018; Economou, Hassapis, & Philippas, 2018; Hudson, Yan, & Zhang, 2018). Asthe incidence of the sentiment traders on the markets increases, mispricing occurs. It would be veryprofitable for rational arbitrageurs to enter the market to exploit that mispricing. However, they areconstrained by noise trader risk and various limits to arbitrage such as short-selling constraints. Asa result, overvaluation due to the under-pricing of risk by sentiment traders and the lack of arbitrageactivity from the rational traders occurs, leading to the formation of pricing bubbles (Taffler, Agarwal,& Wang, 2017). When sentiment and expectations reverse, these pricing bubbles burst due to theensuing mass liquidation of portfolios by the sentiment traders. This process induces volatility in thefinancial markets (Shu & Chang, 2015).
The link between sentiment-driven noise trading and volatility has implications for financialmarket participants. Traditional asset pricing models assume that the only relevant risk is relatedto fundamental factors. However, increased volatility on markets as a result of the sentiment-driven noise trading can trigger changes in risk that are irreconcilable with changes in fundamentalvariables. Therefore, the risk in financial securities can exceed the bounds implied by traditionalasset pricing models that assume rationality. There is a need, therefore, to determine whetherthere is a link between sentiment and stock market volatility so that investors and policymakerscan be informed. This is because risk management, portfolio management, policymaking and pricediscovery are all aspects of financial markets that profoundly depend on the ability of marketparticipants to measure risk. Failure to do so would result in poor risk management, inefficientportfolio strategies, persistent mispricing and poor price discovery.
Accordingly, this study investigated the link between investor sentiment and volatility on theJohannesburg Stock Exchange market using the All Share Index and a composite sentiment indexconstructed using a set of proxies. It was hypothesised herein that investor sentiment-driven noisetrader activity increases financial market volatility on the South African market. The impact of thenoise trader activity was expected to be significant and persists for protracted periods of time due tothe substantial incidence of sentiment-driven noise traders on the Johannesburg Stock Exchangeand various limits to arbitrage. Sentiment-augmented GARCH models were used to test the effect ofinvestor sentiment on the returns in the mean equation and the conditional volatility in the varianceequation. The empirical findings from the estimations showed a significant relationship betweenmarket-wide investor sentiment and stock return volatility on the South African market.
2. Literature reviewAs alluded to above, sentiment affects volatility through its influence on noise trading activity onfinancial markets. This reasoning is consistent with the finding by Liu (2015) that there is anincrease in liquidity on the U.S market which is linked to increases in sentiment. As sentimentincreases, the incidence of noise traders increases, causing mispricing. Rational arbitrageurs thenenter the market to exploit their irrational counterparts. Their trades are essentially contrarian to
Rupande et al., Cogent Economics & Finance (2019), 7: 1600233https://doi.org/10.1080/23322039.2019.1600233
Page 3 of 16
the irrational traders’ bets so the ensuing buying and selling between these two groups createliquidity on financial markets. This is only possible when there are no limits to arbitrage and whenthe abnormal returns are commensurate to the noise trader risk that the rational investors getexposed to when they enter the market. Alfano, Feuerriegel, and Neumann (2015), however, foundthat sentiment not only influences unsophisticated noise traders but it also influences informedtraders, the investors that are generally assumed to be rational.
Alfano et al.’s (2015) results are contrary to the noise trader theory which states that there arenoise traders and rational traders; the former trade noise signals while the latter trade oninformation (Herve et al., 2019). However, many studies have shown that even rational investorsdemand speculative stocks during high sentiment periods (Devault et al., 2019; Jang & Kang,2018). Others have also reported herd behaviour among sophisticated institutional traders. Forinstance, Nofsinger and Sias (1999) found that institutional investors positive-feedback trade morethan individual investors and that institutional herding effects prices more than herding byindividual investors. This trend-chasing behaviour among institutional investors means that thereis a lack of contrarian trades against noise traders. It can lead to extreme volatility on financialmarkets for protracted periods when sentiment mean-reverts. It is possible that this behaviour isa result of noise trader risk and limits to arbitrage.
Another study by Chau, Deesomsak, and Koutmos (2016) found that there was sentiment-induced buying and selling on the US market. However, their findings further showed that some-times sentiment-driven investors behave rationally by trading against the herd and sell whenfinancial market assets are overpriced as a result of high optimism that characterises highsentiment periods. Therefore, sentiment-driven noise traders may not be as irrational as originallypurported in the noise trader theory. Nevertheless, even if some noise traders sometimes behave“rationally”, their effect cannot be substantial as there are also some rational institutional inves-tors with more funds who also behave irrationally in high sentiment periods through herding andfeedback trading (Devault et al., 2019). Also, other irrational traders trade in concert in these highsentiment periods. This is consistent with the finding of a deterioration of the risk-return relation-ship in high sentiment periods due to the impact of less sophisticated noise traders (Antoniouet al., 2015; Kim, Kim, & Seo, 2017; Piccoli, Da Costa, Da Silva, & Cruz, 2018).
The connection between stock market volatility and sentiment-driven noise trading activity haslong been established by models developed in behavioural finance (Black, 1986; Campbell & Kyle,1993; De Long, Shleifer, Summers, & Waldmann, 1990). All these models predict that noise tradershave a significant impact on financial markets—both the returns and the volatility thereof. Anincreased incidence of noise trading activity increases the return volatility as well as contempora-neous returns due to increased mispricing. Further, in the recent agent-based models (Ghonghadze& Lux, 2016; Hessary & Hadzikadic, 2017; Xiao, Wang, & Niu, 2016), noise traders are seen asa source of added volatility in the stock market. This is because the mispricing in the highsentiment periods eventually gets corrected through falling prices and bubble bursts as sentimentmean reverts. The unwillingness by irrational traders to short-sell and the shunning of financialmarkets result in protracted periods of high volatility on the market.
The predictions of these models are consistent with the findings of a number of authors thathave examined the relationship between sentiment and volatility. For instance, Chuang, Ouyang,and Lo (2010) found that changes in investor sentiment, measured by trading volume, significantlyaffect market volatility on the on the Taiwan Stock Exchange. Bullish sentiment periods hadincreased trading volume and market volatility, indicative of increased incidence of noise tradersin high sentiment periods. Rahman, Shien, and Sadique (2013) also investigated the impact ofsentiment-driven noise trading on expected returns and volatility on the Bangladesh stock market.Their results showed that changes in investor sentiment affected the returns and volatility of thesestocks. Rahman et al’s (2013) findings are consistent with the findings by Uygur and Taş (2014)
Rupande et al., Cogent Economics & Finance (2019), 7: 1600233https://doi.org/10.1080/23322039.2019.1600233
Page 4 of 16
that sentiment significantly affects conditional volatility on the U.S., Japan, Hong Kong, U.K.,France, Germany and Turkey financial markets.
Abdelhédi-Zouch, Abbes, and Boujelbène (2015) also found a determinant role of investorsentiment in the amplification of volatility during the subprime financial crisis in the U.S. Thiswas a period characterised by very high sentiment due to the positive outlook on financial markets.Naik and Padhi (2016) and Kumari and Mahakud (2016) found that sentiment influences theconditional volatility on the Indian market. The latter study also found that the relationshipbetween stock return volatility and sentiment was persistent, suggesting that investor sentimentin India does play a significant role in determining the stock market volatility. Ya’cob and Ya’cob(2016) found that sentiment predicts volatility on the Malaysian stock market. This remainedsignificant even when they adjusted for financial crises. Bahloul and Bouri (2016) found thatsentiment is positively related to price volatility on thirteen major futures markets in theU.S. and that sentiment destabilised these markets.
A study by Dai and Yang (2018) examined the link between investor sentiment and feedbacktrading, a phenomenon defined as a trading strategy that involves buying when prices rise andselling when they fall in the market. The study found that that positive feedback traders are morelikely to trade when sentiment is relatively high. This finding is consistent with earlier findings byKurov (2008) and Chau, Deesomsak, and Lau (2011) that the intensity of positive feedback tradingwas linked to the prevailing sentiment, consistent with the notion that feedback trading is drivenby expectations of noise traders on the U.S. market. Per Charteris and Rupande (2017), positivefeedback trading perpetuates trends and is thus destabilising, as it drives prices away from theirfundamental value and contributes to volatility. Thus, positive feedback trading amplifies volatilityon markets in high sentiment periods when the incidence of these feedback traders is high.
Despite all this evidence of investor sentiment’s impact on markets, no uncontroversial measureof investor sentiment exists. This could be because sentiment is related to these fundamentalfactors in that sentiment-prone investors also react to fundamental information but only do soirrationally or to the noise surrounding those fundamental factors (Shleifer & Summers, 1990).Also, the extensive debate about which group between individual investors (Frazzini & Lamont,2005; Schmeling, 2007), institutional investors (Devault et al., 2019; Hong & Stein, 2007) or both(Nofsinger & Sias, 1999; Verma & Soydemir, 2009) are prone to sentiment biases has not beenresolved yet. There are groups of authors that argue that sentiment-driven investors are irrelevant(Black, 1986) while some argue that they have a positive impact (Tetlock, 2007) and others haveidentified their negative impact on markets (Da, Larrain, Sialm, & Tessada, 2015; De Long et al.,1990). All of this contention has undermined the progress towards the development of a much-needed sentiment measure.
3. Data and description of the variablesIn this study, we employed daily closing prices, dividend yields and volume turnover on the JSE AllShare Index (JSEALSI) from McGregor BFA database (July 2002—April 2018). Daily data waspreferred to weekly and monthly frequency because modelling volatility is more accurate withhigh-frequency data. The total daily return on the JSEALSI, Rt, was computed using Pt, the closingprice on day t, Pt-1, the closing price on the previous day and Dt, the dividend payment on dayt. The dividend payment estimated by multiplying the JSEALSI dividend yield on day t, DYt, by Pt. Rtwas then determined as:
Rt ¼ lnf½Pt þ ðDYt � Ptð Þ=100Þ�=Pt�1g � 100 (1)
Owing to the absence of an uncontroversial measure of sentiment, a new sentiment measure(InvSent) was constructed using daily data on the exchange rate between the South African Randand the US dollar (Exch), the prime rate (Prime), the 90-day Treasury bill rate (Treasury), the reporate (Repo), the trading volume of the JSEALSI (Volume), the volume-weighted average price
Rupande et al., Cogent Economics & Finance (2019), 7: 1600233https://doi.org/10.1080/23322039.2019.1600233
Page 5 of 16
changes on the JSEALSI (Vwap) and the SAVI index (Savi). The choice of proxies was governed bythe availability of data—most series employed in literature are only available in monthly, quarterlyand annual frequencies. Principal component analysis (PCA) was then employed to derivea sentiment index from the fitted proxies. This procedure was chosen to construct the compositesentiment index because it allowed for the reduction of the dimensionality of the dataset, whichhelped in increasing interpretability without information loss in the determination of whethersentiment influences volatility on the South African market (Jolliffe & Cadima, 2016). Also, giventhat there are seven imperfect sentiment proxies, it was pertinent that focus is only on theircommon component—considered to be sentiment—instead of what these series measure.
The PCA technique uses orthogonal transformation to translate a set of correlated series into anarray of linearly uncorrelated ones (Jolliffe & Cadima, 2016). For rotation, the Varimax rotation wasused to rotate the PCA matrix in order to maximise the variance of the loadings. According toBaker and Wurgler (2006), some sentiment proxies take longer to reveal sentiment than others so,to account for this, an index with the first principal components of the current values as well as theone-period lagged values was constructed. Subsequently, the correlation between the first stageindex and the current and lagged values of each of the proxies was examined. A composite index,InvSent, was then defined as the first principal component of the correlation matrix of the factors—each corresponding proxy’s current or lagged value, whichever had a greater correlation with thefirst-stage index as:
Sentimentt ¼ θ1Excht�1 þ θ2Excht þ θ3Primet�1 þ θ4Primet þ θ5Treasuryt�1 þ θ6Treasurytþ θ7Repot�1 þ θ8Repot þ θ9Volumet�1 þ θ10Volumet þ θ11Vwapt�1
þ θ12Vwapt þ θ13Savit�1 þ θ14Savit
(2)
InvSentt ¼ θ1Exch t�1=t þ θ2Prime t�1=t þ θ3Treasury t�1=t þ θ3Repo t�1=t þ θ3Volume t�1=t
þ θ3Vwap t�1=t þ θ3Savi t�1=t(3)
Where: θi represent the factor loadings on the first principal components of the proxies—laggedand contemporaneously.
4. Method of analysisTo test the impact of sentiment on conditional volatility, the GARCH (1.1), the GJR-GARCH (1.1) ofGlosten, Jagannathan, and Runkle (1993) and the E-GARCH (1.1) of Nelson (1991) were employed.Of note, the GARCH models were estimated following unit root and stationarity tests using theAugmented Dickey-Fuller (ADF) and Kwiatkowski-Phillips-Schmidt-Shin (KPSS) tests, respectively.The lag order of (1.1) was used as most empirical work in South Africa has shown that it capturesthe ARCH effects and the autocorrelation in the variance (Dedi & Yavas, 2016; Mandimika &Chinzara, 2012; Mangani, 2008). In cases where these first order models failed to capture theinherent ARCH effects and autocorrelation, higher order models were used.
Although the simple GARCH (1, 1) model has been most successful in the estimation of in-sample parameters and out-of-sample volatility forecasts (Hurditt, 2004), it fails to capture asym-metry in volatility (Chinzara & Aziakpono, 2009). This is where positive and negative shocks ofequal magnitude have a different impact on stock market volatility, termed the leverage effect(Black, 1976). This has led to extensions such as the GJR-GARCH and the E-GARCH being developedto deal with this asymmetry as negative shocks provide higher volatility than positive shocks of thesame magnitude (Engle & Ng, 1993). The GJR GARCH adds a multiplicative dummy variable tocheck whether there is a statistically significant difference when shocks are negative.
Here in this study, we chose the GARCH models instead of other alternatives because, in thefinance literature, it is now widely accepted that volatility is best modelled through GARCH type ofmodels. These models estimate the variance of the next forecasted return based on past forecasterrors as well as past estimates of volatility (Bose, 2007). The superiority of these models over
Rupande et al., Cogent Economics & Finance (2019), 7: 1600233https://doi.org/10.1080/23322039.2019.1600233
Page 6 of 16
some of the historical and stochastic volatility models have been proven in the literature (seeAlberg, Shalit, & Yosef, 2008; Hien & Thanh, 2008; Lim & Sek, 2013; Liu, Lee, & Lee, 2009; Matei,2009). According to Matei (2009), GARCH models provide better quality volatility forecast relativeto any other alternative model. This has been aided by the constant refining and evolving of theGARCH models to improve their performances in forecasting volatility by solving the inefficienciesof the previous versions.
In these GARCH models, the sentiment index, ΔInvSent, was introduced into the mean andvariance equations to capture the role of investor sentiment in explaining the returns and volatilityof the JSE ALSI. The persistence of serial correlation in the data was tested using the Ljung-Boxand the ARCH-LM (Engle & Ng, 1993) tests before estimating the GARCH models for correctspecification, and after the estimation for model adequacy checks. The GARCH models follow thesame mean equation with the conditional variance nested in the mean so as to capture the risk-premium on the JSEALSI returns. This allows for any direct feedback between the mean andconditional variance to be observed (Brooks, 2014). The mean equation was specified as:
yt ¼ μþ αyt�1 þ νεt�1 þ δht�1 þ θΔInvSentt þ εt (4)
Where: yt represents the index returns, δ denotes the risk premium, α captures the effect of pastreturns, ν captures the effect of past shocks and ΔInvSentt represents the changes in investorsentiment in the mean and conditional variance equation. The conditional variance for the GARCH(1.1), GJR-GARCH (1.1) and the E-GARCH (1.1) are modelled as follows, respectively:
ht ¼ ωþ αε2t�j þ βht�i þ φΔInvSentt (5)
ht ¼ ωþ αε2t�1 þ βht�j þ γε2t�1dt�1 þ φΔInvSentt (6)
log htð Þ ¼ ωþ αεt�jpht�j
� Eεt�jpht�j
� ���������
� �þ γk
εt�kpht�k
þ βht�i þ φΔInvSentt (7)
Where: ht is the conditional variance in all models. The leverage effect in Equation (6) is denoted bya positive γ. However, since the non-negativity constraints may still be violated under the GJR-GARCHmodel, the condition for non-negativity where ω > 0, α > 0, β ≥ 0, and α + γ ≥ 0 has to be satisfied. Themodel is still admissible, even if γ < 0, provided that α + γ ≥ 0.With the E-GARCH in Equation (7), there isno need to artificially impose the non-negativity constraints as it models conditional variance in logs.The log of conditional variance makes the leverage effect exponential instead of quadratic, andtherefore, the estimates of the conditional variance are guaranteed to be non-negative.
However, the following conditions still need to be met where ω0 > 0, αj + βi < 1. The leverage effectunder the E-GARCH is shown when γ < 0. Equations (5–7) were estimated and compared under allthe three error distribution assumptions—normal distribution, Student’s t-distribution and the gen-eralized error distribution (GED). The best model was selected based on Akaike’s InformationCriterion (AIC), Schwarz’s Bayesian Criterion (SBIC), Hannan and Quinn’s Criterion (HQ) and the log-likelihood (LL). That is, the best model minimised the information criteria and maximised the LL(Brooks, 2014). The results from the estimated models are reported in the section below.
5. Results and discussionThe composite sentiment index, InvSent, yielded by the principal component analysis approach inEquation (3) has certain desirable qualities. Firstly, all the seven proxies enter the final equationwith the expected sign—negative for those that decrease with sentiment and positive for thosethat increase with sentiment. Secondly, all of them enter the equation with the expected timing inreflecting sentiment. Thirdly, the creation of the index eradicates some extreme values in some ofthe proxies such as the Trading volume and VWAP, for instance. This is important because,according to Baker and Wurgler (2006), for the proxies to work as predictors, their levels of
Rupande et al., Cogent Economics & Finance (2019), 7: 1600233https://doi.org/10.1080/23322039.2019.1600233
Page 7 of 16
extremity must be matched by extremity in the returns. This would not have been the case if thecomponent analysis procedure had not been used.
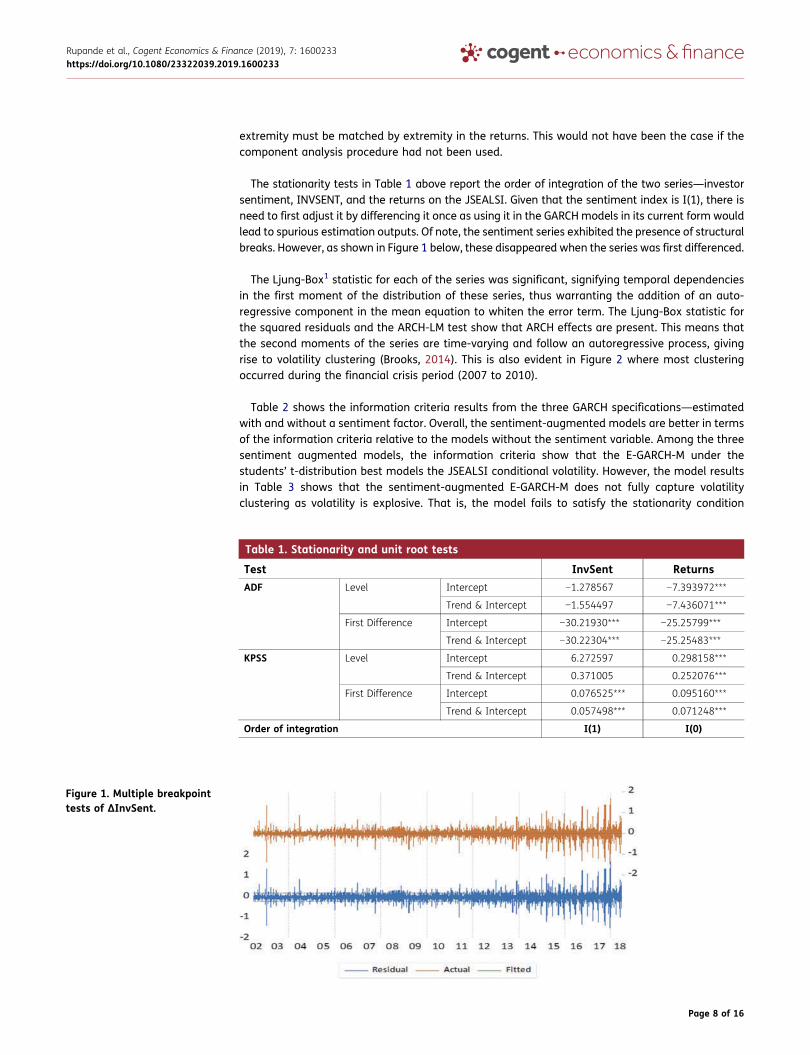
The stationarity tests in Table 1 above report the order of integration of the two series—investorsentiment, INVSENT, and the returns on the JSEALSI. Given that the sentiment index is I(1), there isneed to first adjust it by differencing it once as using it in the GARCHmodels in its current form wouldlead to spurious estimation outputs. Of note, the sentiment series exhibited the presence of structuralbreaks. However, as shown in Figure 1 below, these disappeared when the series was first differenced.
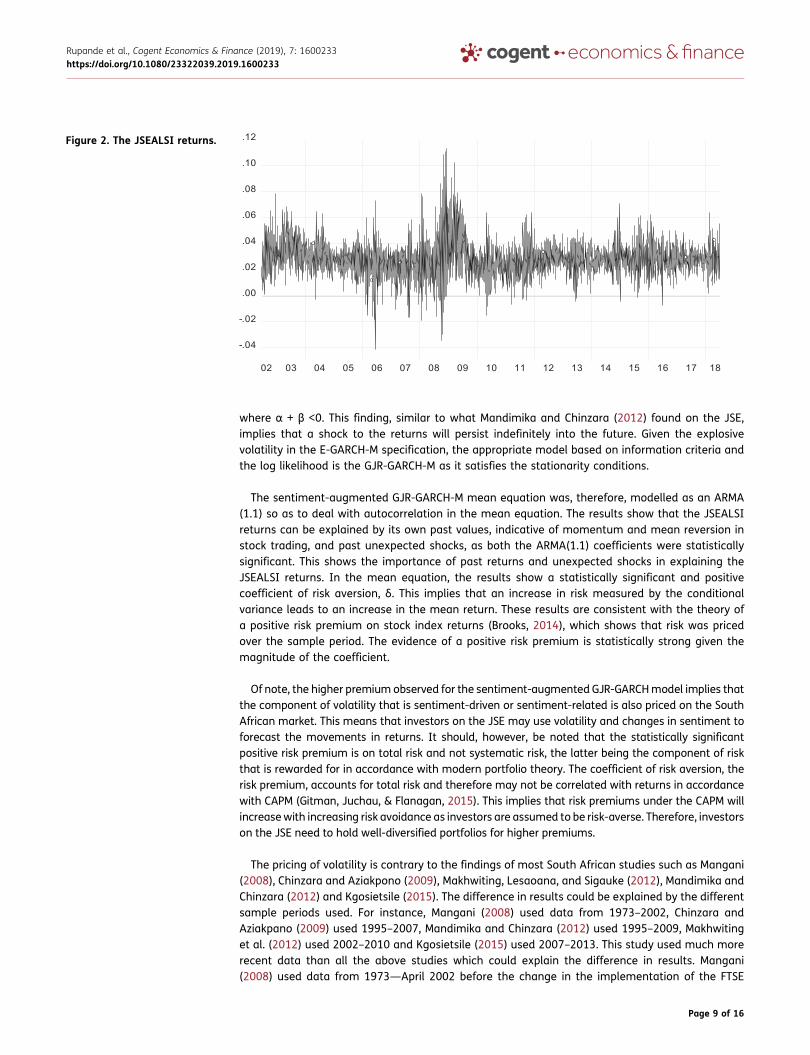
The Ljung-Box1 statistic for each of the series was significant, signifying temporal dependenciesin the first moment of the distribution of these series, thus warranting the addition of an auto-regressive component in the mean equation to whiten the error term. The Ljung-Box statistic forthe squared residuals and the ARCH-LM test show that ARCH effects are present. This means thatthe second moments of the series are time-varying and follow an autoregressive process, givingrise to volatility clustering (Brooks, 2014). This is also evident in Figure 2 where most clusteringoccurred during the financial crisis period (2007 to 2010).
Table 2 shows the information criteria results from the three GARCH specifications—estimatedwith and without a sentiment factor. Overall, the sentiment-augmented models are better in termsof the information criteria relative to the models without the sentiment variable. Among the threesentiment augmented models, the information criteria show that the E-GARCH-M under thestudents’ t-distribution best models the JSEALSI conditional volatility. However, the model resultsin Table 3 shows that the sentiment-augmented E-GARCH-M does not fully capture volatilityclustering as volatility is explosive. That is, the model fails to satisfy the stationarity condition
Table 1. Stationarity and unit root tests
Test InvSent ReturnsADF Level Intercept −1.278567 −7.393972***
Trend & Intercept −1.554497 −7.436071***
First Difference Intercept −30.21930*** −25.25799***
Trend & Intercept −30.22304*** −25.25483***
KPSS Level Intercept 6.272597 0.298158***
Trend & Intercept 0.371005 0.252076***
First Difference Intercept 0.076525*** 0.095160***
Trend & Intercept 0.057498*** 0.071248***
Order of integration I(1) I(0)
Figure 1. Multiple breakpointtests of ΔInvSent.
Rupande et al., Cogent Economics & Finance (2019), 7: 1600233https://doi.org/10.1080/23322039.2019.1600233
Page 8 of 16
where α + β <0. This finding, similar to what Mandimika and Chinzara (2012) found on the JSE,implies that a shock to the returns will persist indefinitely into the future. Given the explosivevolatility in the E-GARCH-M specification, the appropriate model based on information criteria andthe log likelihood is the GJR-GARCH-M as it satisfies the stationarity conditions.
The sentiment-augmented GJR-GARCH-M mean equation was, therefore, modelled as an ARMA(1.1) so as to deal with autocorrelation in the mean equation. The results show that the JSEALSIreturns can be explained by its own past values, indicative of momentum and mean reversion instock trading, and past unexpected shocks, as both the ARMA(1.1) coefficients were statisticallysignificant. This shows the importance of past returns and unexpected shocks in explaining theJSEALSI returns. In the mean equation, the results show a statistically significant and positivecoefficient of risk aversion, δ. This implies that an increase in risk measured by the conditionalvariance leads to an increase in the mean return. These results are consistent with the theory ofa positive risk premium on stock index returns (Brooks, 2014), which shows that risk was pricedover the sample period. The evidence of a positive risk premium is statistically strong given themagnitude of the coefficient.
Of note, the higher premium observed for the sentiment-augmented GJR-GARCHmodel implies thatthe component of volatility that is sentiment-driven or sentiment-related is also priced on the SouthAfrican market. This means that investors on the JSE may use volatility and changes in sentiment toforecast the movements in returns. It should, however, be noted that the statistically significantpositive risk premium is on total risk and not systematic risk, the latter being the component of riskthat is rewarded for in accordance with modern portfolio theory. The coefficient of risk aversion, therisk premium, accounts for total risk and therefore may not be correlated with returns in accordancewith CAPM (Gitman, Juchau, & Flanagan, 2015). This implies that risk premiums under the CAPM willincreasewith increasing risk avoidance as investors are assumed to be risk-averse. Therefore, investorson the JSE need to hold well-diversified portfolios for higher premiums.
The pricing of volatility is contrary to the findings of most South African studies such as Mangani(2008), Chinzara and Aziakpono (2009), Makhwiting, Lesaoana, and Sigauke (2012), Mandimika andChinzara (2012) and Kgosietsile (2015). The difference in results could be explained by the differentsample periods used. For instance, Mangani (2008) used data from 1973–2002, Chinzara andAziakpano (2009) used 1995–2007, Mandimika and Chinzara (2012) used 1995–2009, Makhwitinget al. (2012) used 2002–2010 and Kgosietsile (2015) used 2007–2013. This study used much morerecent data than all the above studies which could explain the difference in results. Mangani(2008) used data from 1973—April 2002 before the change in the implementation of the FTSE
-.04
-.02
.00
.02
.04
.06
.08
.10
.12
02 03 04 05 06 07 08 09 10 11 12 13 14 15 16 17 18
Figure 2. The JSEALSI returns.
Rupande et al., Cogent Economics & Finance (2019), 7: 1600233https://doi.org/10.1080/23322039.2019.1600233
Page 9 of 16
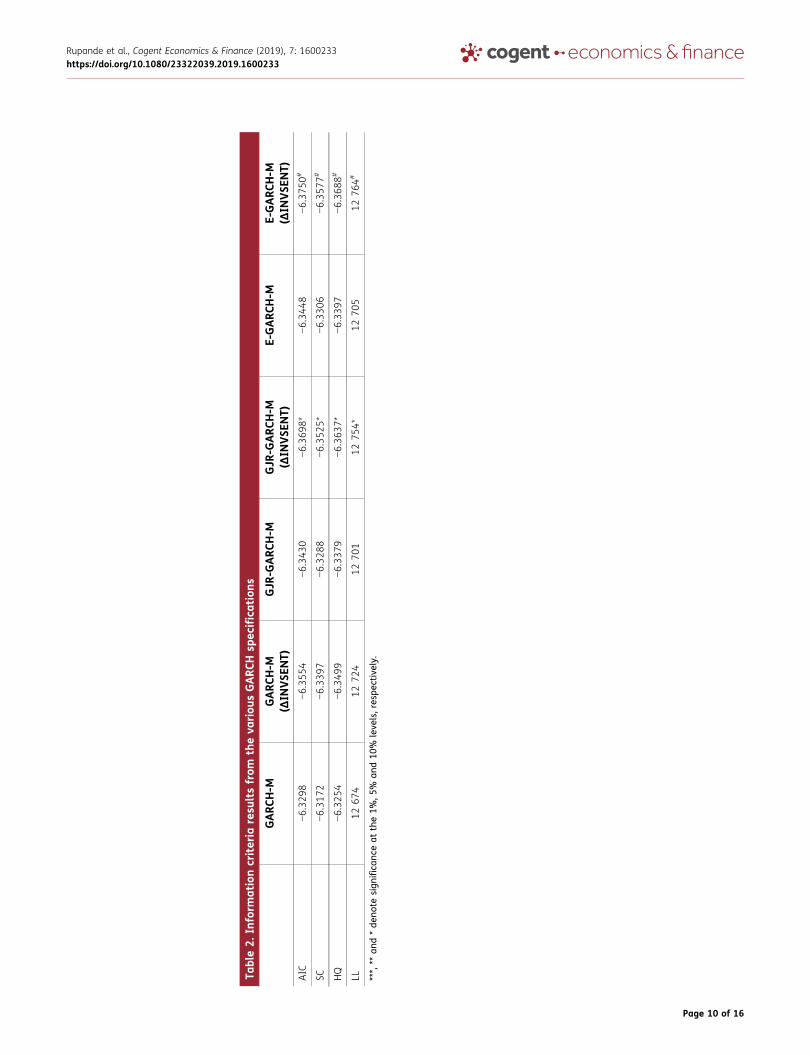
Table2.
Inform
ationcriteria
resu
ltsfrom
theva
riou
sGARC
Hsp
ecifications
GARC
H-M
GARC
H-M
(ΔIN
VSE
NT)
GJR
-GARC
H-M
GJR
-GARC
H-M
(ΔIN
VSE
NT)
E-GARC
H-M
E-GARC
H-M
(ΔIN
VSE
NT)
AIC
−6.32
98−6.35
54−6.34
30−6.36
98*
−6.34
48−6.37
50#
SC−6.31
72−6.33
97−6.32
88−6.35
25*
−6.33
06−6.35
77#
HQ
−6.32
54−6.34
99−6.33
79−6.36
37*
−6.33
97−6.36
88#
LL12
674
1272
412
701
1275
4*12
705
1276
4#
***,**
and*de
note
sign
ifica
nceat
the1%
,5%
and10
%leve
ls,res
pectively.
Rupande et al., Cogent Economics & Finance (2019), 7: 1600233https://doi.org/10.1080/23322039.2019.1600233
Page 10 of 16
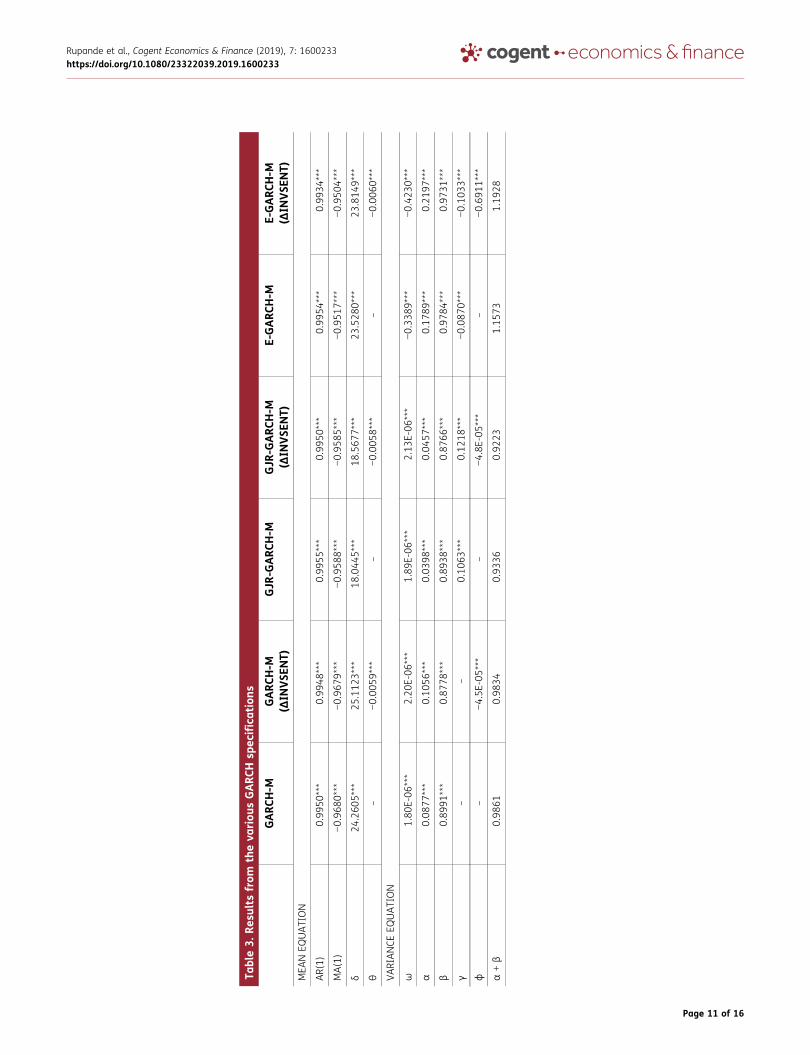
Table3.
Resu
ltsfrom
theva
riou
sGARC
Hsp
ecifications
GARC
H-M
GARC
H-M
(ΔIN
VSE
NT)
GJR
-GARC
H-M
GJR
-GARC
H-M
(ΔIN
VSE
NT)
E-GARC
H-M
E-GARC
H-M
(ΔIN
VSE
NT)
MEA
NEQ
UATION
AR(1)
0.99
50***
0.99
48***
0.99
55***
0.99
50***
0.99
54***
0.99
34***
MA(1)
−0.96
80***
−0.96
79***
−0.95
88***
−0.95
85***
−0.95
17***
−0.95
04***
δ24
.260
5***
25.112
3***
18.044
5***
18.567
7***
23.528
0***
23.814
9***
θ–
−0.00
59***
–−0.00
58***
–−0.00
60***
VARIANCE
EQUATION
ω1.80
E-06
***
2.20
E-06
***
1.89
E-06
***
2.13
E-06
***
−0.33
89***
−0.42
30***
α0.08
77***
0.10
56***
0.03
98***
0.04
57***
0.17
89***
0.21
97***
β0.89
91***
0.87
78***
0.89
38***
0.87
66***
0.97
84***
0.97
31***
γ–
–0.10
63***
0.12
18***
−0.08
70***
−0.10
33***
φ–
−4.5E
-05***
–−4.8E
-05***
–−0.69
11***
α+β
0.98
610.98
340.93
360.92
231.15
731.19
28
Rupande et al., Cogent Economics & Finance (2019), 7: 1600233https://doi.org/10.1080/23322039.2019.1600233
Page 11 of 16
global classification system by the JSE in June 2002 which induced a significant decline in thenumber of stocks constituting the JSE All Share Index (ALSI) as the market capitalization formulachanged (JSE, 2018). Also, the study period like Chinzara and Aziakpano (2009) does not includethe financial crisis period where volatility was significantly greater than most years in SouthAfrican history which is included in this study. Instead, these studies account for the low volatilityperiods such as the post-apartheid era where there was financial liberalisation, high growth ratesamong other innovations, hence low volatility.
The difference in results could also be explained by the fact that this study adjusted the returns fordividends. This approach was taken because dividends are a significant contributor to returns as theyrepresent a large portion of the historic total return for shares. Huxley (2007) found that high dividendyield shares were less volatile, thus, the exclusion of dividends may affect the results obtained. Brooks(2014) also documented that excluding dividends not only distorts the real value of the shares butmay also provide an inappropriate measure of risk. The lower frequency data used by studies such asMangani (2008) and the normal distribution assumption used by some studies to model the errorterm could explain the difference in results. This is because financial time series data is not alwaysnormally distributed hence using the incorrect error distribution assumption may result in misspeci-fication (Mandimika & Chinzara, 2012).
In the conditional variance equation, it can be noted that all the parameters are statisticallysignificant. This indicates that the current volatility can be explained by past shocks, α, volatility inthe previous period, β, and changes in investor sentiment, ᵠ, with previous period volatility explainingmost of the volatility. Although the volatility of the sentiment-augmented GJR-GARCH-M is stationary,α + β is close to one, which means that volatility is highly persistent. A shock in current volatility willinfluence the expectation of volatility many periods in the future. Further, the results from Table 3show that the leverage effect is significantly positive for the sentiment-augmented GJR-GARCH-Mmodel. This means that negative shocks increase volatility more than positive shocks of the samemagnitude. This was also evidenced by Chinzara and Aziakpano (2009), Makhwiting et al. (2012) andKgosietsile (2015) on the South African market. The leverage effect is slightly higher in the sentiment-augmented GJR-GARCH-Mmodel, indicating that changes in sentiment amplify the effect of negativeshocks. However, the difference is minute.
It is interesting to note that changes in investor sentiment have a negative effect on both thereturns and conditional volatility. This is because changes in investor sentiment reflect meanreversion of sentiment. As sentiment mean-reverts, noise traders exit the market, which meansthat their incidence and impact on the market reduces, resulting in low volatility on the market.When sentiment is high, there is increased mispricing in the market- precisely, overvaluation-however, when sentiment mean-reverts, expectations fall. This results in a fall in the prices andconsequently the returns. This is consistent with a study by Stambaugh, Yu, and Yuan (2012) onthe US market and Dalika and Seetharam (2015) on the South African market.
Model diagnostic checks on the selected model showed an improvement in normality.Furthermore, all the mean and variance equations have no serial correlation and heteroscedasti-city based on the Ljung-Box2 statistics and the ARCH-LM tests, respectively. Although this studyaugments the model with a sentiment variable, the findings are consistent with Mandimika andChinzara’s (2012) who found that a GJR-GARCH better models conditional variance on the JSE.
6. Concluding remarksThis study analysed the dynamics of investor sentiment and volatility on the JSE by using theGARCH-M specifications augmented by a sentiment factor under the three error distributionassumptions using daily data over the period 2002–2018. The results show that the JSEALSIreturns can be modelled as an ARMA (1.1) process, implying that the effect of past returns andpast shocks to the conditional mean will dissipate after a single period. Also, the results showsignificant evidence of a positive risk-return relationship on the JSE, showing that volatility is
Rupande et al., Cogent Economics & Finance (2019), 7: 1600233https://doi.org/10.1080/23322039.2019.1600233
Page 12 of 16
a priced factor on the JSE. The results show the presence of volatility persistence and leverageeffects. Concerning investor sentiment, the results show that it is a significant factor in explainingthe returns and the conditional variance on the JSE. Overall, the most appropriate model formodelling volatility for the JSEALSI series was the GJR-GARCH-M with an investor sentiment factor.This affirms the importance of investor sentiment on the JSE.
The study’s findings bear implications for investors and policymakers. For investors, the fact thatvolatility is priced, including the sentiment-driven component, means that their strategies shouldinclude a sentiment factor when measuring the total risk. Given the significant positive risk-premium, investors need to hold well-diversified portfolios to be rewarded for the component ofrisk borne which is systematic risk as per CAPM. For policymakers, volatility persistence may havea negative impact on the functioning of markets and the pricing of assets. This impact may beamplified by changes in investor sentiment, leading to capital outflows and financial instability asinvestors seek better quality markets. Therefore, policymakers need to not focus only on estab-lished fundamental drivers of volatility but also on investor sentiment. The significant leverageeffects imply that policymakers need to pay more attention to negative shocks and changes ininvestor sentiment as volatility is amplified.
The study has certain limitations in its scope. For instance, it employed a broad market index in thedetermination of the influence that investor sentiment has on volatility. However, sentiment mayaffect the volatility and returns of different companies differently. Future research may try to look atthe effect of investor sentiment on individual shares or a portfolio of similar shares. The study alsoused proxies to measure sentiment due to the unavailability of direct measures such as sentimentsurveys on the South Africanmarket. However, proxies are indirect measures. The study is also limitedto the South African market, especially in terms of the constructed sentiment index. As a result, itsgeneralisability to other African stock market or other emerging market is also limited. However, itcan easily be replicated in those markets to see whether similar conclusions would be reached at.
Future studies may employ a Markov-switching GARCH to determine the effect of sentiment-drivennoise trading on the South African market. Other studies may also attempt to construct new senti-ment-augmented multifactor models and test their performance against the traditional models todetermine whether the explanatory power increases. It is possible that a better model in terms ofasset pricing may be developed. This would aid the price discovery processes and increase theefficiency of markets. Future studies may also attempt to determine whether investor sentimentcan be used to predict phenomena that comes with extreme volatility on financial markets such asfinancial crises and price bubble bursts. An ability to predict these events before they occurmay help incontrolling their effects or in stopping them from happening altogether.
FundingThe authors received no direct funding for this research.
Author detailsLorraine Rupande1
E-mail: [email protected] Tinotenda Muguto1
E-mail: [email protected] Muzindutsi1
E-mail: [email protected] ID: http://orcid.org/0000-0002-4819-82181 The University of KwaZulu-Natal, School of Accounting,Economics and Finance, Westville campus, Bag X 5400,Durban 4000, South Africa.
Citation informationCite this article as: Investor sentiment and stock returnvolatility: Evidence from the Johannesburg StockExchange, Lorraine Rupande, Hilary Tinotenda Muguto &Paul-Francois Muzindutsi, Cogent Economics & Finance(2019), 7: 1600233.
Notes1. The test results: LB (36)—1297***, LB2 (36)—6728***
and ARCH LM—0.23*** .2. The test results: LB (36)—36.5, LB2 (36)—36.9 and
ARCH LM—0.23 (All are insignificant).
ReferencesAbdelhédi-Zouch, M., Abbes, M. B., & Boujelbène, Y.
(2015). Volatility spillover and investor sentiment:Subprime crisis. Asian Academy of ManagementJournal of Accounting & Finance, 11(2), 1–37.
Akbas, F., Boehmer, E., Jiang, C., & Koch, P. D. (2019).Overnight returns, daytime reversals, and future stockreturns: The risk of investing in a tug of war with noisetraders (Working Paper, pp. 1–57). Cambridge, MA:Social Science Research Network. doi:10.2139/ssrn.3324880
Alberg, D., Shalit, H., & Yosef, R. (2008). Estimating stockmarket volatility using asymmetric GARCH models.Applied Financial Economics, 18(15), 1201–1208.doi:10.1080/09603100701604225
Rupande et al., Cogent Economics & Finance (2019), 7: 1600233https://doi.org/10.1080/23322039.2019.1600233
Page 13 of 16
Alfano, S. J., Feuerriegel, S., & Neumann, D. (2015). Isnews sentiment more than just noise? Twenty-ThirdEuropean Conference on Information Systems,Münster, Germany, (pp. 1–16). ConferenceProceedings.
Antoniou, C., Doukas, J. A., & Subrahmanyam, A. (2015).Investor sentiment, beta, and the cost of equitycapital. Management Science, 62(2), 347–367.doi:10.1287/mnsc.2014.2101
Bahloul, W., & Bouri, A. (2016). The impact of investorsentiment on returns and conditional volatility in USfutures markets. Journal of Multinational FinancialManagement, 36(1), 89–102. doi:10.1016/j.mulfin.2016.07.003
Baker, M., & Wurgler, J. (2006). Investor sentiment andthe cross-section of stock returns. Journal of Finance,61(4), 1645–1680. doi:10.1111/j.1540-6261.2006.00885.x
Barrot, J. N., Kaniel, R., & Sraer, D. (2016). Are retailtraders compensated for providing liquidity? Journalof Financial Economics, 120(1), 146–168.
Black, F. (1976). Studies of stock price volatility changes.American Association of Business & EconomicsStatistics, 5(2), 177–181.
Black, F. (1986). Noise. Journal of Finance, 41(3), 528–543.doi:10.1111/j.1540-6261.1986.tb04513.x
Blasco, N., Corredor, P., & Ferrer, E. (2018). Analystsherding: When does sentiment matter? AppliedEconomics, 50(51), 5495–5509. doi:10.1080/00036846.2018.1486999
Bose, S. (2007). Understanding the volatility characteris-tics and transmission effects in the Indian stockindex and index futures market. ICRA Bulletin, Money& Finance, 139–162.
Brooks, C. (2014). Introductory econometrics for finance.Cambridge, United Kingdom: Cambridge Books.
Brown, G. W. (1999). Volatility, sentiment, and noisetraders. Financial Analysts Journal, 55(2), 82–90.doi:10.2469/faj.v55.n2.2263
Campbell, J. Y., & Kyle, A. S. (1993). Smart money, noisetrading and stock price behaviour. The Review ofEconomic Studies, 60(1), 1–34. doi:10.2307/2297810
Charteris, A., & Rupande, L. (2017). Feedback trading onthe JSE. Investment Analysts Journal, 46(3), 235–248.doi:10.1080/10293523.2017.1342319
Chau, F., Deesomsak, R., & Koutmos, D. (2016). Doesinvestor sentiment really matter? InternationalReview of Financial Analysis, 48(1), 221–232.
Chau, F., Deesomsak, R., & Lau, M. C. (2011). Investorsentiment and feedback trading: Evidence from theexchange-traded fund markets. International Reviewof Financial Analysis, 20(5), 292–305. doi:10.1016/j.irfa.2011.06.006
Chinzara, Z., & Aziakpono, M. J. (2009). Dynamicreturns linkages and volatility transmissionbetween South African and world major stockmarkets. Studies in Economics and Econometrics,33(3), 69–94.
Chu, Y., Hirshleifer, D., & Ma, L. (2017). The causal effect oflimits to arbitrage on asset pricing anomalies (No.24144, pp. 1–61). Cambridge, MA: National Bureau ofEconomic Research, Inc.
Chuang, W. J., Ouyang, L. Y., & Lo, W. C. (2010). Theimpact of investor sentiment on excess returns:A Taiwan stock market case. International Journal ofInformation & Management Sciences, 21(1), 13–28.
Da, Z., Larrain, B., Sialm, C., & Tessada, J. (2015). Pricepressure from coordinated noise trading: Evidencefrom pension fund reallocations (Working Paper No.22161, pp. 1–48). Cambridge, MA: National Bureau ofEconomic Research, Inc.
Dai, Z. M., & Yang, D. C. (2018). Positive feedback tradingand investor sentiment. Emerging Markets Finance &Trade, 54(10), 2400–2408. doi:10.1080/1540496X.2018.1469003
Dalika, N., & Seetharam, Y. (2015). Sentiment and returns:An analysis of investor sentiment in the SouthAfrican market. Investment Management & FinancialInnovations, 12(1), 267–276.
De Long, J. B., Shleifer, A., Summers, L. H., &Waldmann, R. J. (1990). Noise trader risk in financialmarkets. Journal of Political Economy, 98(4),703–738. doi:10.1086/261703
Dedi, L., & Yavas, B. F. (2016). Return and volatility spil-lovers in equity markets: An investigation using var-ious GARCH methodologies. Cogent Economics &Finance, 4(1), 1–18. doi:10.1080/23322039.2016.1266788
Devault, L., Sias, R., & Starks, L. (2019). Sentiment metricsand investor demand. Journal of Finance, 74(2), 985–1024.
Economou, F., Hassapis, C., & Philippas, N. (2018).Investors’ fear and herding in the stock market.Applied Economics, 50(34), 3654–3663. doi:10.1080/00036846.2018.1436145
Engelberg, J. E., Reed, A. V., & Ringgenberg, M. C. (2018).Short-selling risk. Journal of Finance, 73(2), 755–786.doi:10.1111/jofi.12601
Engle, R. F., & Ng, V. K. (1993). Measuring and testing theimpact of news on volatility. Journal of Finance, 48(5), 1749–1778. doi:10.1111/j.1540-6261.1993.tb05127.x
Frazzini, A., & Lamont, O. A. (2005). Dumb money: Mutualfund flows and the cross-section of stock returns(NBER Working Paper No 11526, pp. 1–35).Cambridge, MA: National Bureau of EconomicResearch.
Ghonghadze, J., & Lux, T. (2016). Bringing an elementaryagent-based model to the data: Estimation via GMMand an application to forecasting of asset pricevolatility. Journal of Empirical Finance, 37(1), 1–19.doi:10.1016/j.jempfin.2016.02.002
Gitman, L. J., Juchau, R., & Flanagan, J. (2015). Principlesof managerial finance. Sydney, Australia: PearsonHigher Education.
Glosten, L. R., Jagannathan, R., & Runkle, D. E. (1993). Onthe relation between the expected value and thevolatility of the nominal excess return on stocks.Journal of Finance, 48(5), 1779–1801. doi:10.1111/j.1540-6261.1993.tb05128.x
Herve, F., Zouaoui, M., & Belvaux, B. (2019). Noise tradersand smart money: Evidence from online searches.Economic Modelling, 1–25. Elsvier B.V. doi:10.1016/j.econmod.2019.02.005
Hessary, Y. K., & Hadzikadic, M. (2017). Role of behaviouralheterogeneity in aggregate financial market beha-vior: An agent-based approach. Procedia ComputerScience, 108(1), 978–987. doi:10.1016/j.procs.2017.05.254
Hien, M. T. T., & Thanh, T. (2008). Modelling and forecast-ing volatility by GARCH-type models: The case ofVietnam stock exchange. Doctoral Dissertation,University Of Nottingham, United Kingdom. pp. 1–97.
Hong, H., & Stein, J. C. (2007). Disagreement and the stockmarket. Journal of Economic Perspectives, 21(2),109–128. doi:10.1257/jep.21.2.109
Hudson, Y., Yan, M., & Zhang, D. (2018). Herd behaviour &investor sentiment: Evidence from UKmutual funds(Working Paper, Social Science Research Network).Elsevier. doi:10.2139/ssrn.3222312
Hurditt, P. (2004). An assessment of volatility transmis-sion in the Jamaican financial system. Journal of
Rupande et al., Cogent Economics & Finance (2019), 7: 1600233https://doi.org/10.1080/23322039.2019.1600233
Page 14 of 16
Business, Finance & Economics in EmergingEconomies, 1(1), 1–28.
Huxley, T. H. (2007). The high dividend yield returnadvantage: An examination of empirical data asso-ciating investment in high dividend yield securitieswith attractive returns over long measurementperiods (Working Paper, pp. 1–18). New York: TweedyBrowne Company LLC. doi:10.1094/PDIS-91-4-0467B
Jang, J., & Kang, J. (2018). Probability of price crashes,rational speculative bubbles, and the cross-section ofstock returns. Journal of Financial Economics, 132(1),222–247. doi:10.1016/j.jfineco.2018.10.005
Johannesburg Stock Exchange. (2018, August 17).Headline – All Share (J203). [Internet]. Retrieved fromhttps://www.jse.co.za/services/market-data/indices/ftse-jse-africa-index-series/headline
Jolliffe, I. T., & Cadima, J. (2016). Principal componentanalysis: A review and recent developments.Philosophical transactions of the royal society.Mathematical, Physical and Engineering Sciences, 374(2065), 1–16. doi:10.1098/rsta.2015.0202
Kapoor, S., & Prosad, J. M. (2017). Behavioural finance: Areview. Procedia Computer Science, 122(1), 50–54.doi:10.1016/j.procs.2017.11.340
Kgosietsile, O. (2015). Modelling and Forecasting theVolatility of JSE Returns: A Comparison ofCompeting Univariate GARCH Models.Witswatersrand University, South Africa. DoctoralDissertation, 1–55.
Kim, J. S., Kim, D. H., & Seo, S. W. (2017). Individualmean-variance relation and stock-level investorsentiment. Journal of Business Economics andManagement, 18(1), 20–34. doi:10.3846/16111699.2016.1252794
Kumari, J., & Mahakud, J. (2016). Investor sentiment andstock market volatility: Evidence from India. Journalof Asia-Pacific Business, 17(2), 173–202. doi:10.1080/10599231.2016.1166024
Kurov, A. (2008). Investor sentiment, trading behaviorand informational efficiency in index futuresmarkets. Financial Review, 43(1), 107–127.doi:10.1111/fire.2008.43.issue-1
Lim, C. M., & Sek, S. K. (2013). Comparing the performancesof GARCH-type models in capturing the stock marketvolatility in Malaysia. Procedia Economics & Finance, 5(1), 478–487. doi:10.1016/S2212-5671(13)00056-7
Lin, C. B., Chou, R. K., & Wang, G. H. (2018). Investorsentiment and price discovery: Evidence from thepricing dynamics between the futures and spotmarkets. Journal of Banking & Finance, 90(1), 17–31.doi:10.1016/j.jbankfin.2018.02.014
Lin, M., Sias, R. W., & Wei, Z. (2018). The survival of noisetraders: Evidence from peer-to-peer lending (ResearchPaper No. 18–22). Georgia: Georgia Tech SchellerCollege of Business. doi:10.2139/ssrn.3185608
Lintner, J. (1964). The valuation of risk assets and theselection of risky investments in stock portfolios andcapital budgets: A reply. Review of Economics &Statistics, 1(1), 222–224.
Liu, H. C., Lee, Y. H., & Lee, M. C. (2009). Forecasting Chinastock markets volatility via GARCH models underskewed-GED distribution. Journal of Money,Investment & Banking, 7(1), 1–23.
Liu, S. (2015). Investor Sentiment and Stock MarketLiquidity. Journal of Behavioural Finance, 16(1),51–67. doi:10.1080/15427560.2015.1000334
Ljungqvist, A., & Qian, W. (2016). How constraining arelimits to arbitrage? Review of Financial Studies, 29(8),1975–2028.
Makhwiting, M. R., Lesaoana, M., & Sigauke, C. (2012).Modelling volatility and financial market risk of
shares on the Johannesburg Stock Exchange. AfricanJournal of Business Management, 6(27), 8065–8070.doi:10.5897/AJBM11.2525
Mandimika, N. Z., & Chinzara, Z. (2012). Risk-return trade-off and behaviour of volatility on the South AfricanStock market: Evidence from both aggregate anddisaggregate data. South African Journal ofEconomics, 80(3), 345–366. doi:10.1111/saje.2012.80.issue-3
Mangani, R. (2008). Modelling return volatility on the JSEsecurities exchange of South Africa. African FinanceJournal, 10(1), 55–71.
Markowitz, H. (1952). Portfolio selection. Journal ofFinance, 7(1), 77–91.
Matei, M. (2009). Assessing volatility forecasting models:Why GARCH models take the lead. Romanian Journalof Economic Forecasting, 12(4), 42–65.
Miwa, K. (2016). Investor sentiment, stock mispricing, andlong-term growth expectations. Research inInternational Business & Finance, 36(1), 414–423.doi:10.1016/j.ribaf.2015.10.003
Naik, P. K., & Padhi, P. (2016). Investor sentiment, stockmarket returns and volatility: evidence from NationalStock Exchange of India. International Journal ofManagement Practice, 9(3), 213–237. doi:10.1504/IJMP.2016.077816
Nelson, D. B. (1991). Conditional heteroskedasticity inasset returns: A new approach. Journal of theEconometric Society, 21(1), 347–370. doi:10.2307/2938260
Nofsinger, J. R., & Sias, R. W. (1999). Herding and feed-back trading by institutional and individual investors.Journal of Finance, 54(6), 2263–2295. doi:10.1111/0022-1082.00188
Peress, J., & Schmidt, D. (2017). Noise traders incarnate:Describing a realistic noise trading process (Centre forEconomic Policy Research Working Paper No.DP12434, pp. 1–73). London: Social Science ResearchNetwork.
Piccoli, P., Da Costa, N. C., Jr, Da Silva, W. V., & Cruz, J. A.(2018). Investor sentiment and the risk-returntrade-off in the Brazilian market. Accounting &Finance, 58(1), 599–618.
Rahman, M. A., Shien, L. K., & Sadique, M. S. (2013).Swings in sentiment and stock returns: Evidencefrom a frontier market. International Journal ofTrade, Economics & Finance, 4(6), 347–363.doi:10.7763/IJTEF.2013.V4.315
Schmeling, M. (2007). Institutional and individual senti-ment: Smart money and noise trader risk?International Journal of Forecasting, 23(1), 127–145.doi:10.1016/j.ijforecast.2006.09.002
Sharpe, W. F. (1964). Capital asset prices: A theory ofmarket equilibrium under conditions of risk. Journalof Finance, 19(3), 425–442.
Shefrin, H., & Statman, M. (2000). Behavioural portfoliotheory. Journal of Financial & Quantitative Analysis,35(2), 127–151. doi:10.2307/2676187
Shefrin, H. M., & Statman, M. (1984). Explaining investorpreference for cash dividends. Journal of FinancialEconomics, 13(2), 253–282. doi:10.1016/0304-405X(84)90025-4
Shen, J., Yu, J., & Zhao, S. (2017). Investor sentiment andeconomic forces. Journal of Monetary Economics, 86(1), 1–21. doi:10.1016/j.jmoneco.2017.01.001
Shleifer, A., & Summers, L. H. (1990). The noise traderapproach to finance. Journal of EconomicPerspectives, 4(2), 19–33. doi:10.1257/jep.4.2.19
Shu, H. C., & Chang, J. H. (2015). Investor sentiment andfinancial market volatility. Journal of Behavioral
Rupande et al., Cogent Economics & Finance (2019), 7: 1600233https://doi.org/10.1080/23322039.2019.1600233
Page 15 of 16
Finance, 16(3), 206–219. doi:10.1080/15427560.2015.1064930
Stambaugh, R. F., Yu, J., & Yuan, Y. (2012). The short of it:Investor sentiment and anomalies. Journal ofFinancial Economics, 104(2), 288–302. doi:10.1016/j.jfineco.2011.12.001
Statman, M. (2014). Behavioural finance: Finance withnormal people. Borsa Istanbul Review, 14(2), 65–73.doi:10.1016/j.bir.2014.03.001
Taffler, R. J., Agarwal, V., & Wang, C. (2017). Asset pricingbubbles and investor emotions: An empirical analysisof the 2014–2016 Chinese stock market bubble.Behavioural Finance Working Group Meeting, QueenMary University, London.pp. 1–50.
Tetlock, P. C. (2007). Giving content to investor sentiment:The role of media in the stock market. Journal ofFinance, 62(3), 1139–1168. doi:10.1111/j.1540-6261.2007.01232.x
Uygur, U., & Taş, O. (2014). The impacts of investorsentiment on returns and conditional volatility of
international stock markets. Quality & Quantity,48(3), 1165–1179. doi:10.1007/s11135-013-9827-3
Verma, R., & Soydemir, G. (2009). The impact of individualand institutional investor sentiment on the marketprice of risk. Quarterly Review of Economics & Finance,49(3), 1129–1145. doi:10.1016/j.qref.2008.11.001
Xiao, D., Wang, J., & Niu, H. (2016). Volatility analysisof financial agent-based market dynamics fromstochastic contact system. ComputationalEconomics, 48(4), 607–625. doi:10.1007/s10614-015-9539-y
Ya‘Cob, N., & Ya’cob, M. (2016). The Determinants of StockMarket Volatility: Macroeconomic Fundamentals andInvestor Sentiment. Doctoral Dissertation, UniversityOf Malaya, Malaysia. pp. 1–234.
Yu, J., & Yuan, Y. (2011). Investor sentiment and themean-variance relation. Journal of FinancialEconomics, 100(2), 367–381. doi:10.1016/j.jfineco.2010.10.011
©2019 The Author(s). This open access article is distributed under a Creative Commons Attribution (CC-BY) 4.0 license.
You are free to: Share — copy and redistribute the material in any medium or format.Adapt — remix, transform, and build upon the material for any purpose, even commercially.The licensor cannot revoke these freedoms as long as you follow the license terms.
Under the following terms:Attribution — You must give appropriate credit, provide a link to the license, and indicate if changes were made.You may do so in any reasonable manner, but not in any way that suggests the licensor endorses you or your use.No additional restrictions
Youmay not apply legal terms or technological measures that legally restrict others from doing anything the license permits.
Cogent Economics & Finance (ISSN: 2332-2039) is published by Cogent OA, part of Taylor & Francis Group.
Publishing with Cogent OA ensures:
• Immediate, universal access to your article on publication
• High visibility and discoverability via the Cogent OA website as well as Taylor & Francis Online
• Download and citation statistics for your article
• Rapid online publication
• Input from, and dialog with, expert editors and editorial boards
• Retention of full copyright of your article
• Guaranteed legacy preservation of your article
• Discounts and waivers for authors in developing regions
Submit your manuscript to a Cogent OA journal at www.CogentOA.com
Rupande et al., Cogent Economics & Finance (2019), 7: 1600233https://doi.org/10.1080/23322039.2019.1600233
Page 16 of 16