Embed Size (px)
Citation preview
Investor Roadshow
Delivering a World Class Service to the Region from within the Region
Mermaid Maritime Plc
July 2015
This presentation has been prepared by Mermaid Maritime Plc. for stakeholders, solely for information purposes.
The views expressed here contain some information derived from publicly available sources that have not been independently verified.
No representation or warranty is made as to the accuracy, completeness or reliability of the information. Any forward looking information in this presentation has been prepared on the basis of a number of assumptions which may prove to be incorrect.
This presentation should not be relied upon as a recommendation or forecast by Mermaid Maritime Plc. Nothing in this release should be construed as either an offer to sell or a solicitation or an offer to buy or sell shares in any jurisdiction.
2
Introduction
Investment Highlights
Company Strategy & Outlook
3


MERMAID MARITIME SNAPSHOT
Having served the industry for over 30 years, Mermaid Maritime boasts of a proven track record for subsea and drilling oil service excellence. Headquartered in Thailand, Mermaid Maritime operations span from Saudi Arabia to the United Arab Emirates, Qatar, Singapore, and Indonesia.
Mermaid Maritime mission is to provide essential services in the areas of subsea engineering and offshore drilling to the offshore oil and gas industry that is safe, efficient, on time and on budget. With a team of more than 1,000 people including professional divers, drillers, technicians, surveyors, and modern vessels and equipment, Mermaid Maritime commands a solid reputation in the market place for serving customers in the region from within the region.
The relentless focus on customer satisfaction and RESPECT has resulted in Mermaid winning repeat customers and new customers over the years. It is also an achievement that we intend to use as the foundation for our further growth.
30+ years industry experience including CEO of Thailand’s National Oil Company PTT and Chairman of PTT Exploration and Production
Mr. Prasert Bunsumpun Chairman
Proven track record of successfully managing and growing a variety of businesses including coffee, steel, copper, shipping, media, entertainment, resorts and golf course
Mr. Chalermchai Mahagitsiri Executive Vice Chairman & CEO
5
A Leading International Oil
Service Specialist
One of the World’s Largest Subsea Diving
Services Company
Owner & Operator of a Diversified Subsea
Vessel & Drilling Rig Asset Portfolio
Excellent Operational
Performance & Proven Track
Record
Core Values
R • Respect for Customer, Shareholders, Employees, Service Partners, and General Public
E • Enhancing Value
S • Safety Commitment & Performance
P • Protecting the Environment
E • Ethical Business Standards
C • Compliance with Policies & Procedures
T • Technically Leading Solutions
PM Group
Thoresen Thai Agencies Plc
(Investment Group)
Mermaid Maritime Plc
(Offshore Oil Services)
Thoresen Shipping Singapore Pte Ltd
(Dry Bulk Shipping)
Unique Mining Services Plc
(Coal)
PM Thoresen Asia Holdings Ltd
(Fertilizer/Logistics)
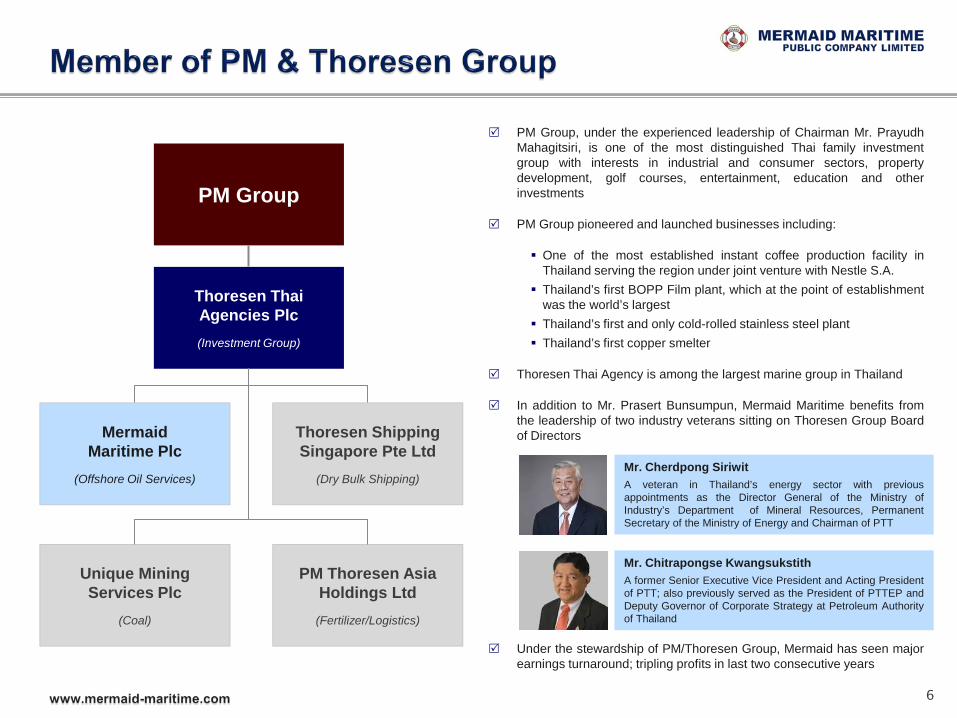
PM Group, under the experienced leadership of Chairman Mr. Prayudh Mahagitsiri, is one of the most distinguished Thai family investment group with interests in industrial and consumer sectors, property development, golf courses, entertainment, education and other investments
PM Group pioneered and launched businesses including:
One of the most established instant coffee production facility in Thailand serving the region under joint venture with Nestle S.A.
Thailand’s first BOPP Film plant, which at the point of establishment was the world’s largest
Thailand’s first and only cold-rolled stainless steel plant Thailand’s first copper smelter
Thoresen Thai Agency is among the largest marine group in Thailand
In addition to Mr. Prasert Bunsumpun, Mermaid Maritime benefits from the leadership of two industry veterans sitting on Thoresen Group Board of Directors
Under the stewardship of PM/Thoresen Group, Mermaid has seen major earnings turnaround; tripling profits in last two consecutive years
6
Mr. Chitrapongse Kwangsukstith A former Senior Executive Vice President and Acting President of PTT; also previously served as the President of PTTEP and Deputy Governor of Corporate Strategy at Petroleum Authority of Thailand
Mr. Cherdpong Siriwit A veteran in Thailand’s energy sector with previous appointments as the Director General of the Ministry of Industry’s Department of Mineral Resources, Permanent Secretary of the Ministry of Energy and Chairman of PTT
7
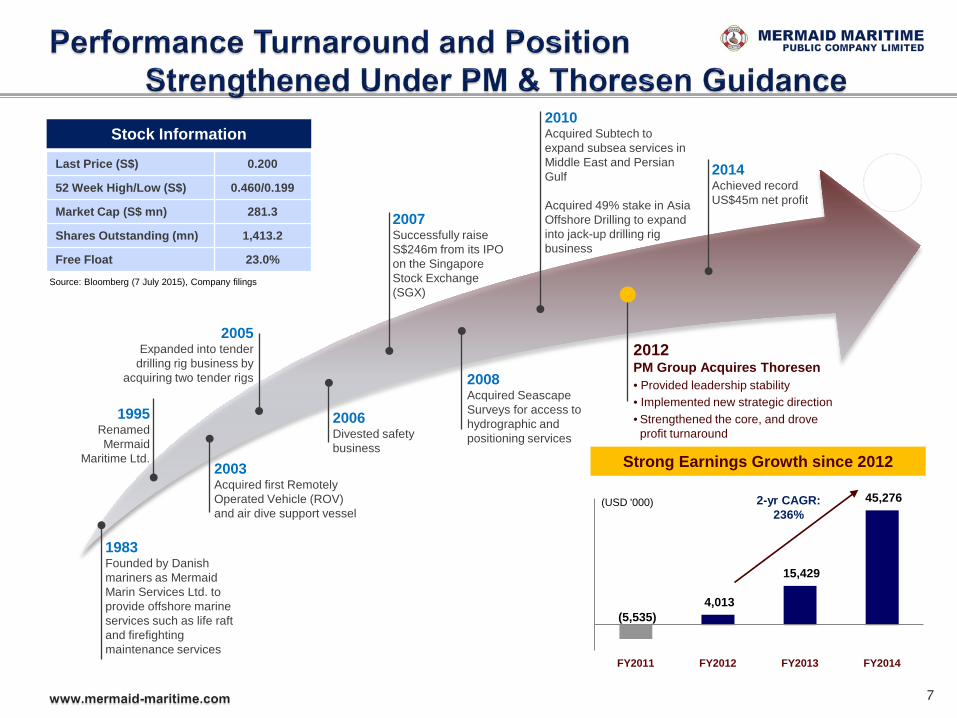
1983 Founded by Danish mariners as Mermaid Marin Services Ltd. to provide offshore marine services such as life raft and firefighting maintenance services
1995 Renamed Mermaid
Maritime Ltd. 2003 Acquired first Remotely Operated Vehicle (ROV) and air dive support vessel
2005 Expanded into tender
drilling rig business by acquiring two tender rigs
2006 Divested safety business
2007 Successfully raise S$246m from its IPO on the Singapore Stock Exchange (SGX)
2008 Acquired Seascape Surveys for access to hydrographic and positioning services
2010 Acquired Subtech to expand subsea services in Middle East and Persian Gulf Acquired 49% stake in Asia Offshore Drilling to expand into jack-up drilling rig business
2012 PM Group Acquires Thoresen • Provided leadership stability • Implemented new strategic direction • Strengthened the core, and drove profit turnaround
2014 Achieved record US$45m net profit
(5,535) 4,013
15,429
45,276
FY2011 FY2012 FY2013 FY2014
(USD '000)
Strong Earnings Growth since 2012
2-yr CAGR: 236%
Stock Information
Last Price (S$) 0.200
52 Week High/Low (S$) 0.460/0.199
Market Cap (S$ mn) 281.3
Shares Outstanding (mn) 1,413.2
Free Float 23.0%
Source: Bloomberg (7 July 2015), Company filings
8
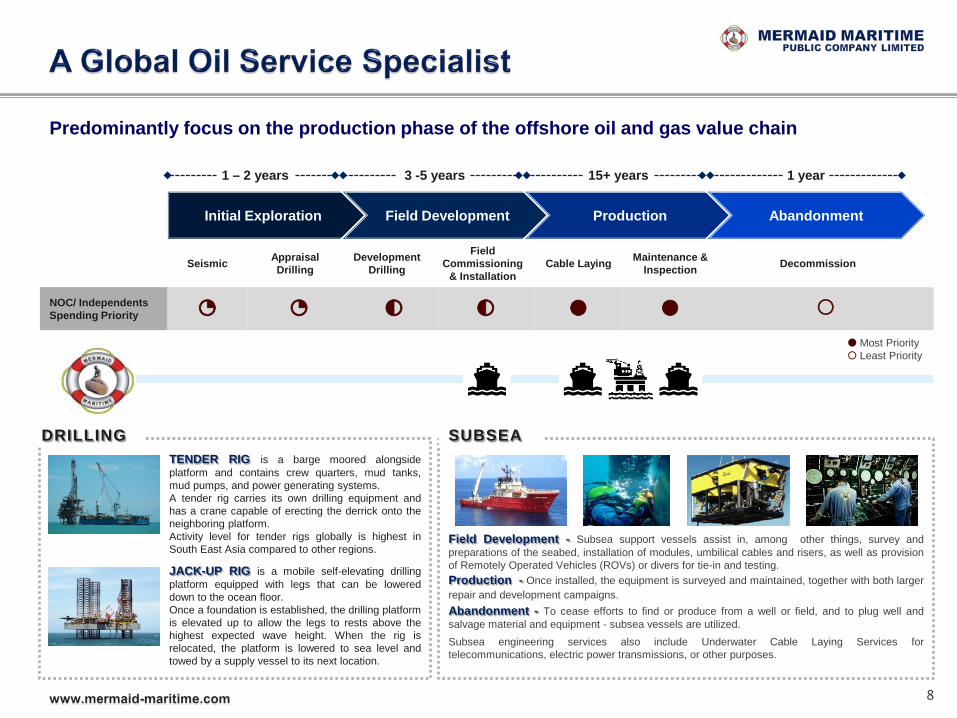
Initial Exploration Field Development Production Abandonment
Predominantly focus on the production phase of the offshore oil and gas value chain
1 – 2 years 3 -5 years 15+ years 1 year
Seismic Appraisal Drilling
Development Drilling
Field Commissioning
& Installation Cable Laying Maintenance &
Inspection Decommission
NOC/ Independents Spending Priority ◔ ◔ ◐ ◐ ● ●
Most Priority Least Priority
TENDER RIG is a barge moored alongside platform and contains crew quarters, mud tanks, mud pumps, and power generating systems. A tender rig carries its own drilling equipment and has a crane capable of erecting the derrick onto the neighboring platform. Activity level for tender rigs globally is highest in South East Asia compared to other regions.
JACK-UP RIG is a mobile self-elevating drilling platform equipped with legs that can be lowered down to the ocean floor. Once a foundation is established, the drilling platform is elevated up to allow the legs to rests above the highest expected wave height. When the rig is relocated, the platform is lowered to sea level and towed by a supply vessel to its next location.
Field Development - Subsea support vessels assist in, among other things, survey and preparations of the seabed, installation of modules, umbilical cables and risers, as well as provision of Remotely Operated Vehicles (ROVs) or divers for tie-in and testing.
DRILLING SUBSEA
Production - Once installed, the equipment is surveyed and maintained, together with both larger repair and development campaigns. Abandonment - To cease efforts to find or produce from a well or field, and to plug well and salvage material and equipment - subsea vessels are utilized. Subsea engineering services also include Underwater Cable Laying Services for telecommunications, electric power transmissions, or other purposes.
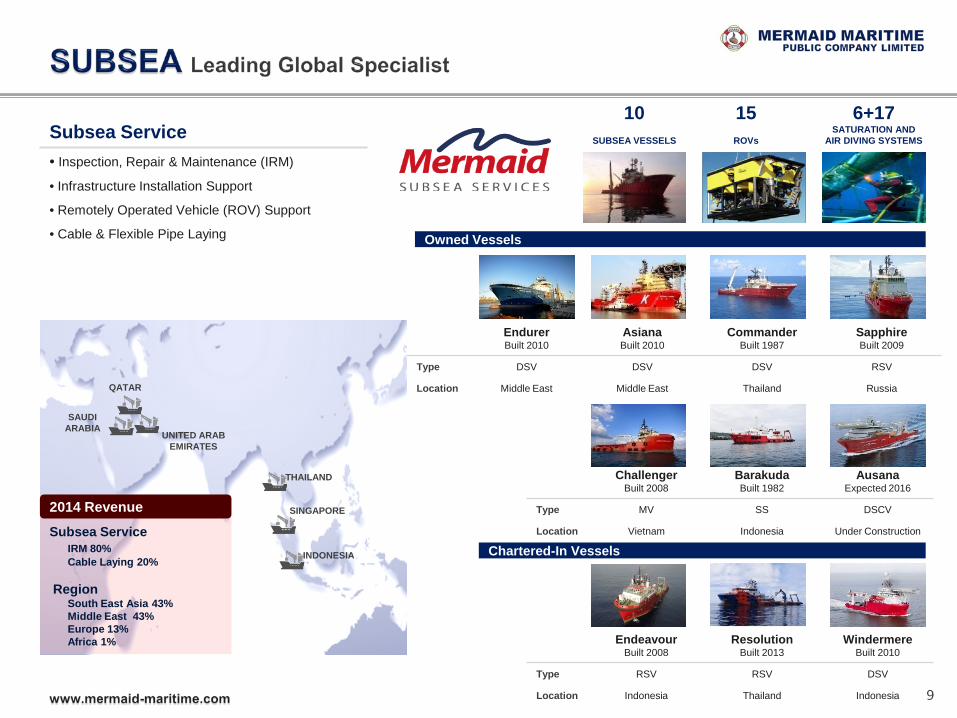
THAILAND
SINGAPORE
INDONESIA
UNITED ARAB EMIRATES
SAUDI ARABIA
QATAR
Subsea Service IRM 80%
Cable Laying 20% Region
South East Asia 43% Middle East 43% Europe 13% Africa 1%
Endurer Built 2010
Asiana Built 2010
Commander Built 1987
Sapphire Built 2009
Type DSV DSV DSV RSV
Location Middle East Middle East Thailand Russia
Challenger Built 2008
Barakuda Built 1982
Ausana Expected 2016
Type MV SS DSCV
Location Vietnam Indonesia
Under Construction
Owned Vessels
Chartered-In Vessels
Endeavour Built 2008
Resolution Built 2013
Windermere Built 2010
Type RSV RSV DSV
Location Indonesia Thailand Indonesia
Subsea Service • Inspection, Repair & Maintenance (IRM)
• Infrastructure Installation Support
• Remotely Operated Vehicle (ROV) Support
• Cable & Flexible Pipe Laying
15
ROVs
10
SUBSEA VESSELS
6+17 SATURATION AND
AIR DIVING SYSTEMS
2014 Revenue
9

Tender Rigs
Drilling Service • Offshore Drilling and Work Over Service
• Accommodation Rig Service
MTR-1
Accommodation and Work Over Barge
Built 1978 Upgraded 1998
ABS classed, Singapore flagged
Operating Water Depths: Conventional Mooring 100 meters Pre-Laid Mooring 680 meters
MTR-2
Tender Assist Drilling Rig
Built 1981 Upgraded Twice 1997 & 2007
ABS classed, Thailand flagged
Operating Water Depths: Conventional Mooring 100 meters Pre-Laid Mooring 680 meters
Drilling Depth: 18,045 feet
MTR-3 & MTR-4
High Performance Class Tender Assist Drilling Rigs
Under Construction with Delivery scheduled for 2016
ABS classed, Singapore flagged
Operating Water Depths: Conventional Mooring 243 meters Pre-Laid Mooring 914 meters
Drilling Depth: 25,000 feet
Large deck space and tank storage with bigger cranes and fast rig moves
Jack-Up Rigs*
AOD I & AOD II & AOD III
High-Spec Jack-Up Drilling Rigs
Built 2013
Panama flagged
Operating Water Depth: 400 meters
Drilling Depth: 30,000 feet
3+1 year drilling contract with Saudi Aramco
* Owned by Asia Offshore Drilling Ltd. in which Mermaid has 33.76% ownership interest
3 HIGH-SPEC
JACK-UP RIGS
4 TENDER RIGS
Asia Offshore Drilling
In Partnership with Seadrill Ltd
10
Investment Highlights
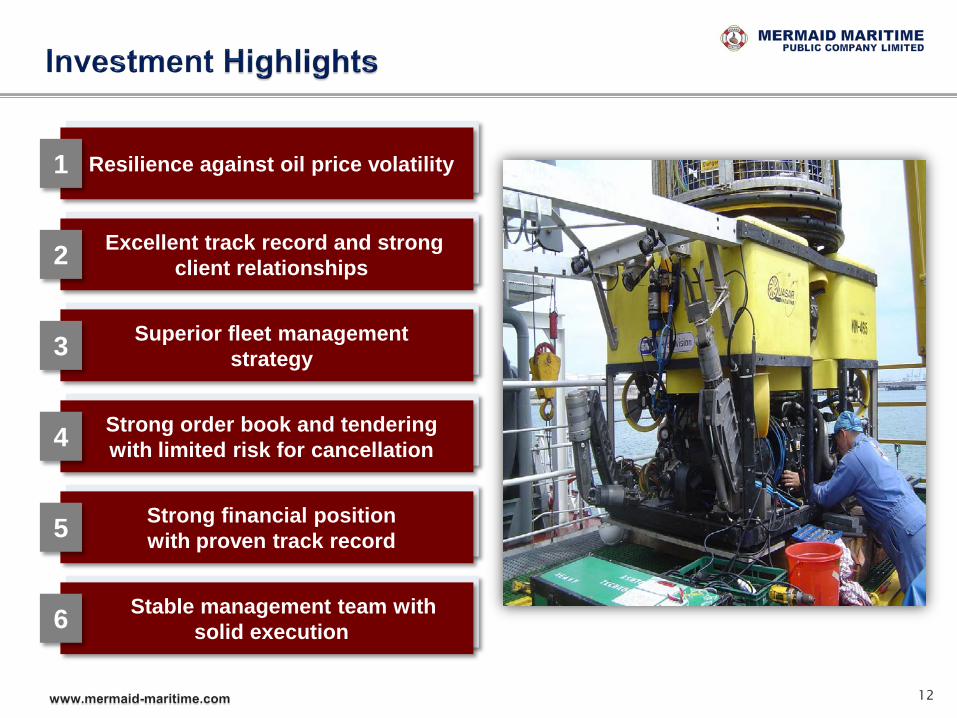
Resilience against oil price volatility 1
Excellent track record and strong client relationships 2
Strong order book and tendering with limited risk for cancellation 4
Strong financial position with proven track record 5
Stable management team with solid execution 6
Superior fleet management strategy 3
12
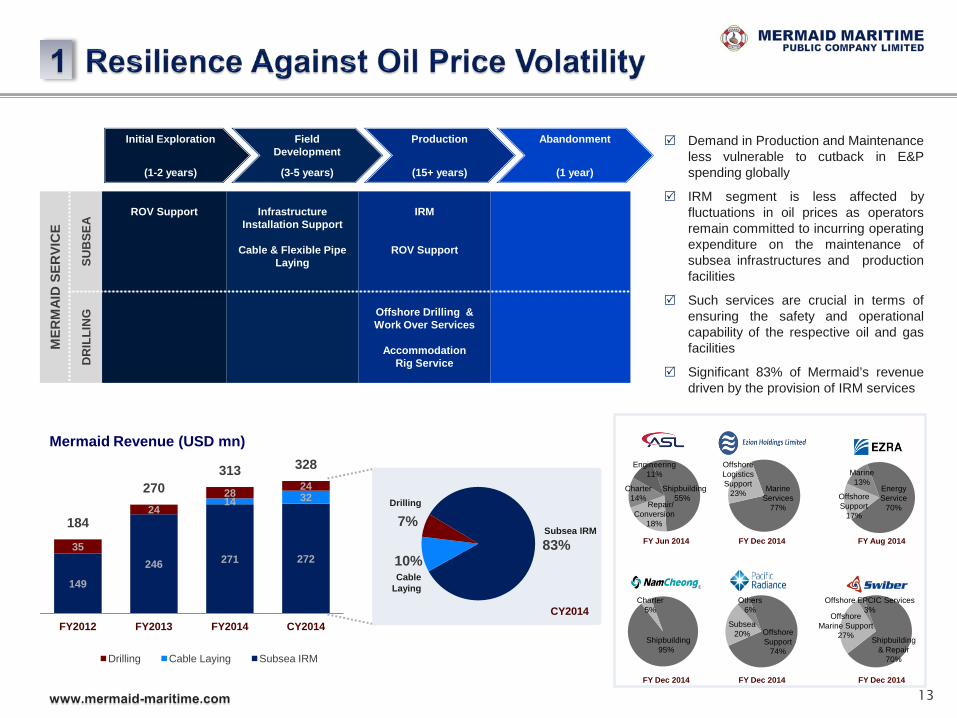
Demand in Production and Maintenance less vulnerable to cutback in E&P spending globally
IRM segment is less affected by fluctuations in oil prices as operators remain committed to incurring operating expenditure on the maintenance of subsea infrastructures and production facilities
Such services are crucial in terms of ensuring the safety and operational capability of the respective oil and gas facilities
Significant 83% of Mermaid’s revenue driven by the provision of IRM services
149
246 271 272
14 32
35
24 28 24
184
270 313 328
FY2012 FY2013 FY2014 CY2014
Drilling Cable Laying Subsea IRM
13
83% 10%
7% Drilling
CY2014
Subsea IRM
Mermaid Revenue (USD mn)
Initial Exploration
(1-2 years)
Field Development
(3-5 years)
Production
(15+ years)
Abandonment
(1 year)
Cable Laying
Marine 13%
Offshore Support
17%
Energy Service
70%
FY Aug 2014
Engineering 11%
Charter 14%
Repair/ Conversion
18%
Shipbuilding 55%
FY Jun 2014
Offshore Logistics Support
23% Marine Services
77%
FY Dec 2014
Shipbuilding 95%
Charter 5%
FY Dec 2014
Offshore Support
74%
Subsea 20%
Others 6%
Shipbuilding & Repair
70%
Offshore Marine Support
27%
Offshore EPCIC Services 3%
FY Dec 2014 FY Dec 2014
MER
MAI
D S
ERVI
CE
SUB
SEA
ROV Support
Infrastructure Installation Support
Cable & Flexible Pipe
Laying
IRM
ROV Support
DR
ILLI
NG
Offshore Drilling & Work Over Services
Accommodation
Rig Service
THAILAND
SINGAPORE
INDONESIA
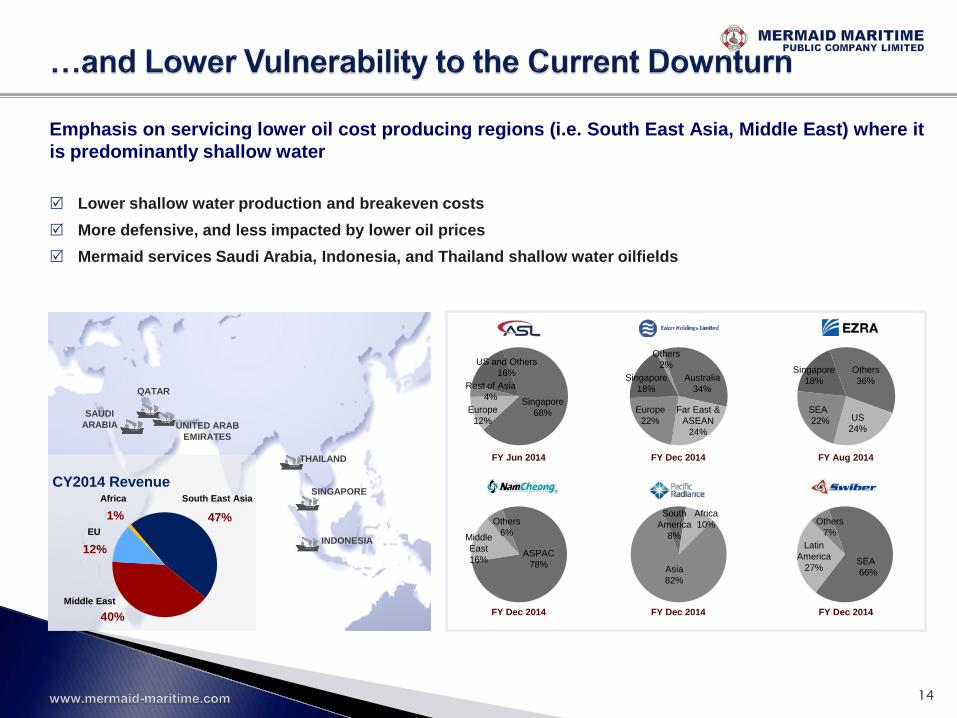
Emphasis on servicing lower oil cost producing regions (i.e. South East Asia, Middle East) where it is predominantly shallow water
Lower shallow water production and breakeven costs More defensive, and less impacted by lower oil prices Mermaid services Saudi Arabia, Indonesia, and Thailand shallow water oilfields
QATAR
UNITED ARAB EMIRATES
SAUDI ARABIA
Singapore 18%
Others 36%
US 24%
SEA 22%
Singapore 68%
US and Others 16%
Europe 12%
Rest of Asia 4%
Far East & ASEAN
24%
Australia 34%
Europe 22%
Singapore 18%
Others 2%
Others 6%
ASPAC 78%
Middle East 16%
Asia 82%
Africa 10%
South America
8%
SEA 66%
Others 7%
Latin America
27%
47%
40%
12%
1%
CY2014 Revenue
Middle East
EU
Africa South East Asia
14
FY Jun 2014 FY Dec 2014 FY Aug 2014
FY Dec 2014 FY Dec 2014 FY Dec 2014

Solid reputation in the provision of subsea and drilling services
Consistent execution of high quality services
Proven efficiency
Excellent Health Safety and Environment (HSE) track record
Experienced personnel with strong technical expertise and commitment to safety
Continuous provision of innovative solutions to clients
Dedicated customer support to offer customised solutions and quick responses to emergency call outs and variation orders
Ability to move up the value chain to comprehensively meet clients’ demands
Improved brand recognition and cross selling under a unified
subsea brand
0
1
2
3
4
2008 2009 2010 2011 2012 2013 2014
Cas
es
HSE Track Record
Medical Treatment Cases (MTC) Restricted Work Cases (RWC)
Lost Times Incidents (LTI) & Fatality (FAT)
15
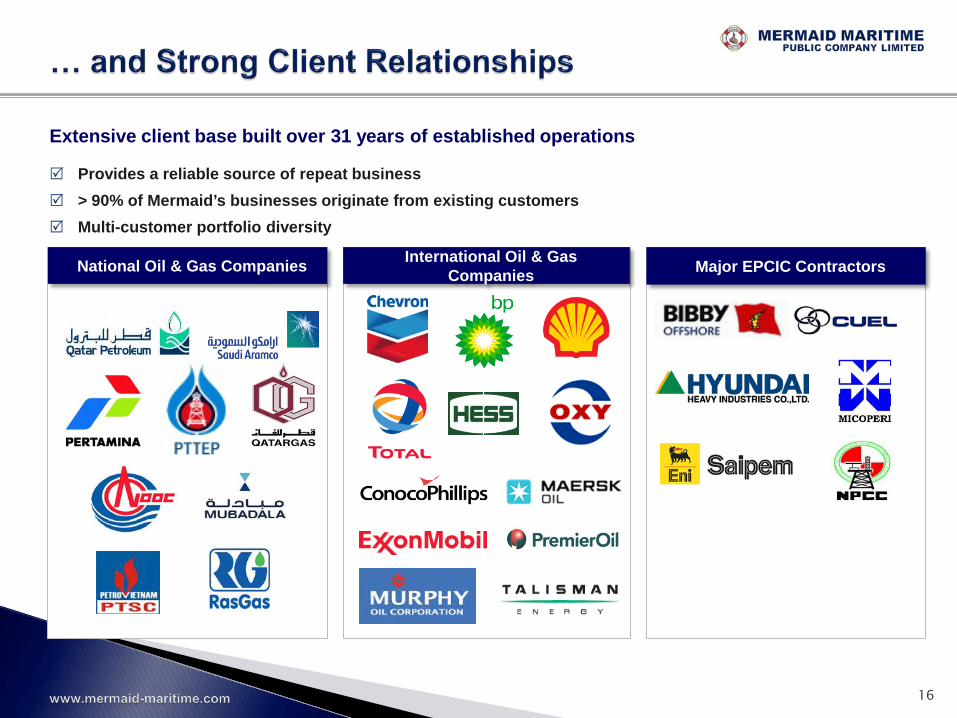
Major EPCIC Contractors International Oil & Gas Companies National Oil & Gas Companies
Extensive client base built over 31 years of established operations
Provides a reliable source of repeat business > 90% of Mermaid’s businesses originate from existing customers Multi-customer portfolio diversity
16
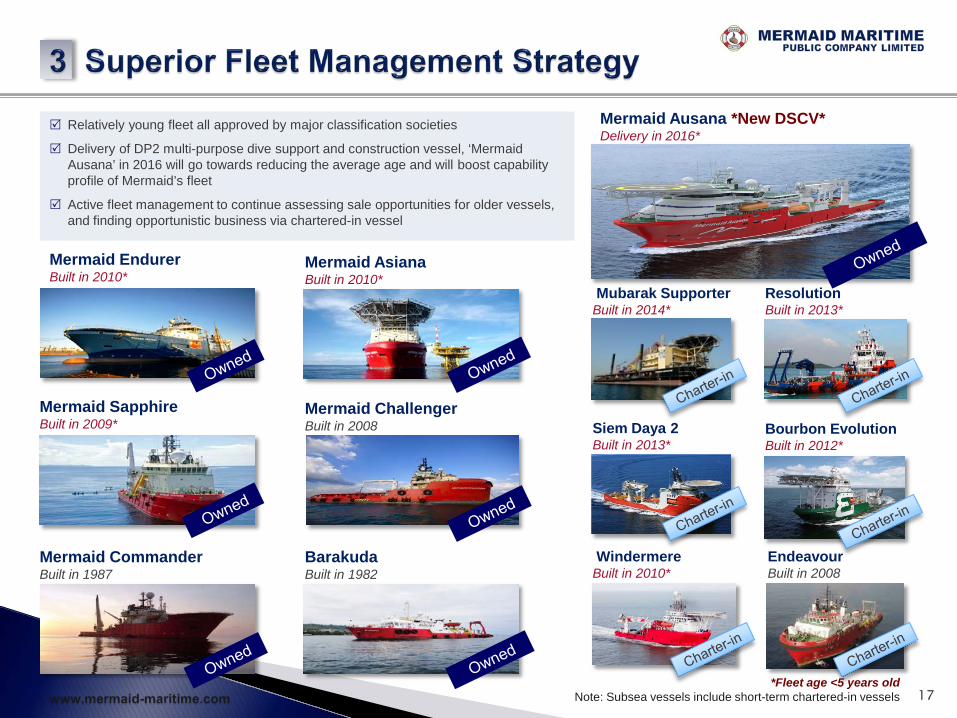
Mermaid Endurer Built in 2010*
Mubarak Supporter Built in 2014*
Resolution Built in 2013*
Mermaid Ausana *New DSCV* Delivery in 2016*
Mermaid Asiana Built in 2010*
Mermaid Commander Built in 1987
Mermaid Challenger Built in 2008
Barakuda Built in 1982
Mermaid Sapphire Built in 2009* Siem Daya 2
Built in 2013* Bourbon Evolution Built in 2012*
Endeavour Built in 2008
Windermere Built in 2010*
Relatively young fleet all approved by major classification societies
Delivery of DP2 multi-purpose dive support and construction vessel, ‘Mermaid Ausana’ in 2016 will go towards reducing the average age and will boost capability profile of Mermaid’s fleet
Active fleet management to continue assessing sale opportunities for older vessels, and finding opportunistic business via chartered-in vessel
*Fleet age <5 years old Note: Subsea vessels include short-term chartered-in vessels 17

1,702
1,955
2,133
2,312
2,125
58%
67%
73% 70%
65%
FY2011 FY2012 FY2013 FY2014 CY2014
Operational Day Utilization Rate
18
Additional Long-Term Chartered-In
Vessels under Management
8
Own Vessels
1
Long-Term Chartered-In Vessel
Opportunistic business via long-term chartered-in vessels
RSV ‘Resolution’
DSV ‘Windermere’
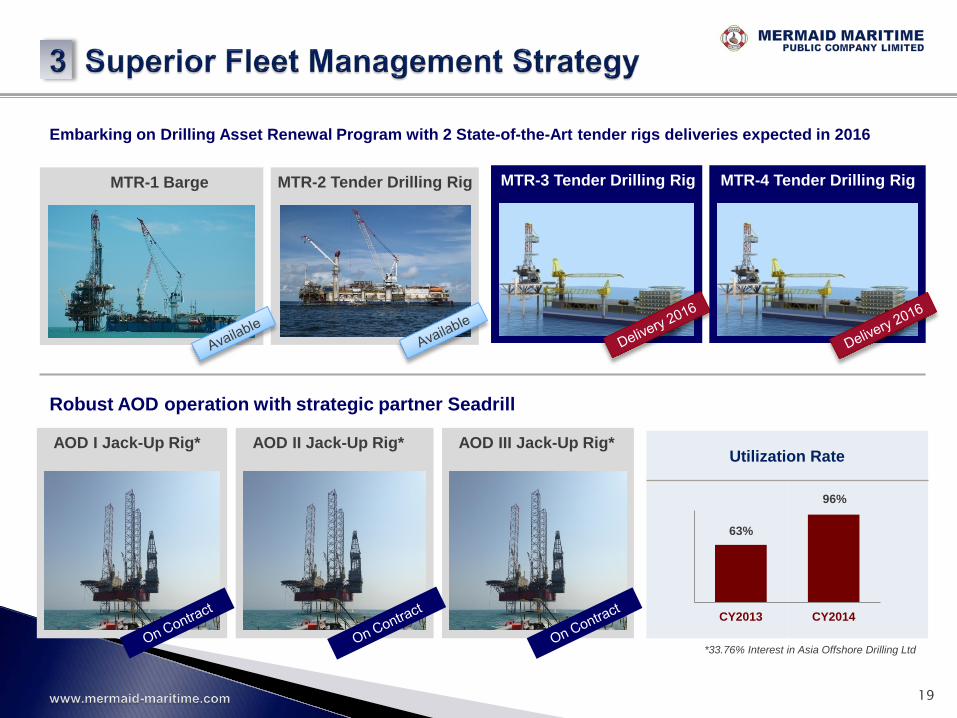
Embarking on Drilling Asset Renewal Program with 2 State-of-the-Art tender rigs deliveries expected in 2016
MTR-1 Barge MTR-2 Tender Drilling Rig MTR-3 Tender Drilling Rig MTR-4 Tender Drilling Rig
AOD III Jack-Up Rig* AOD II Jack-Up Rig* AOD I Jack-Up Rig*
Robust AOD operation with strategic partner Seadrill
Utilization Rate
CY2013 CY2014
63%
96%
*33.76% Interest in Asia Offshore Drilling Ltd
19
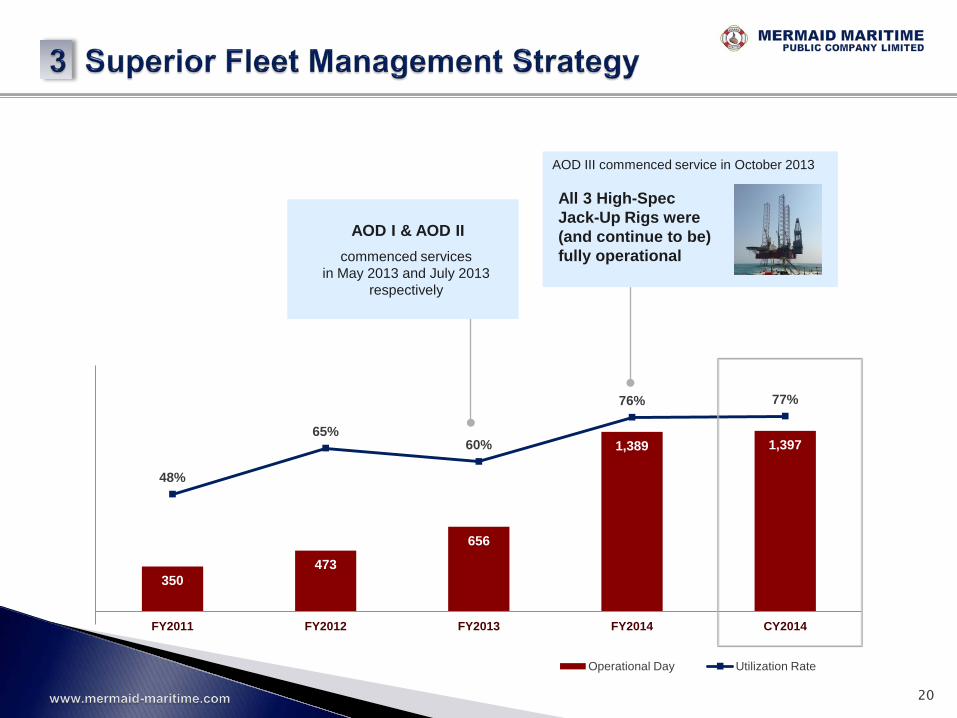
350 473
656
1,389 1,397
48%
65% 60%
76% 77%
FY2011 FY2012 FY2013 FY2014 CY2014
Operational Day Utilization Rate
20
AOD III commenced service in October 2013 All 3 High-Spec Jack-Up Rigs were (and continue to be) fully operational
AOD I & AOD II
commenced services in May 2013 and July 2013
respectively
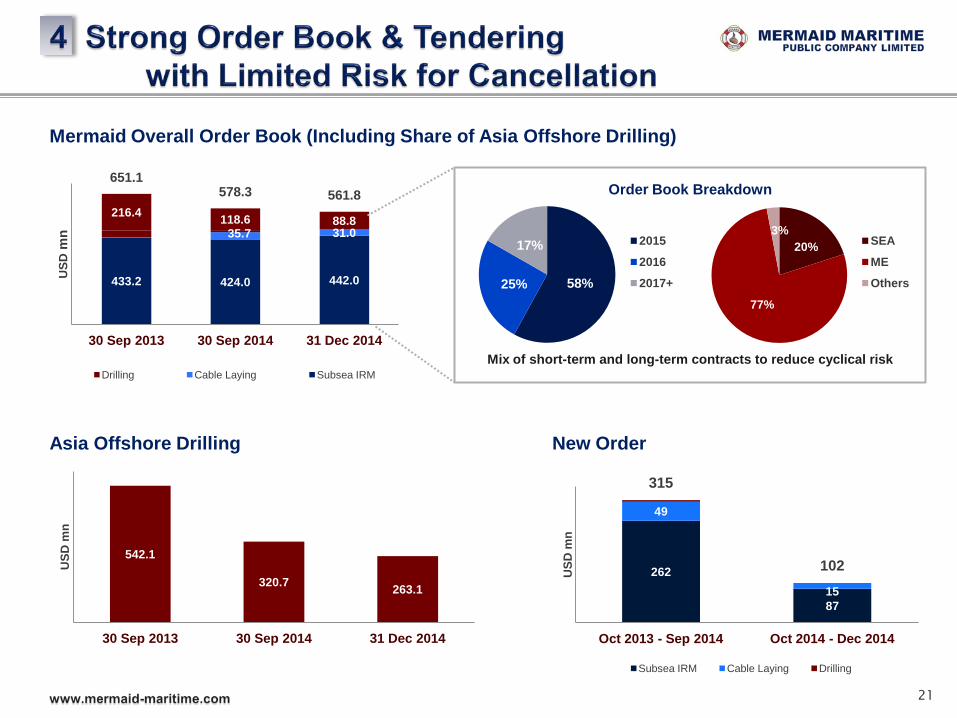
Mermaid Overall Order Book (Including Share of Asia Offshore Drilling)
58% 25%
17% 2015
2016
2017+
20%
77%
3% SEA
ME
Others 433.2 424.0 442.0
35.7 31.0 216.4 118.6 88.8
651.1 578.3 561.8
30 Sep 2013 30 Sep 2014 31 Dec 2014
USD
mn
Drilling Cable Laying Subsea IRM
542.1
320.7 263.1
30 Sep 2013 30 Sep 2014 31 Dec 2014
USD
mn
262
87
49
15
315
102
Oct 2013 - Sep 2014 Oct 2014 - Dec 2014
USD
mn
Subsea IRM Cable Laying Drilling
Asia Offshore Drilling New Order
21
Mix of short-term and long-term contracts to reduce cyclical risk
Order Book Breakdown
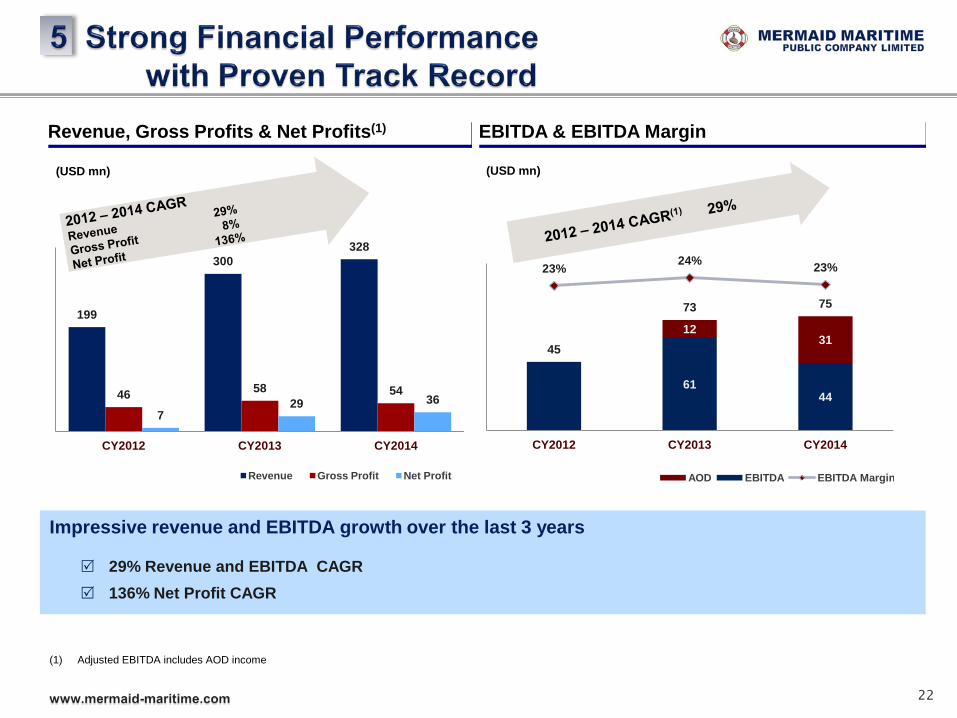
Revenue, Gross Profits & Net Profits(1)
199
300 328
46 58 54
7 29 36
CY2012 CY2013 CY2014
Revenue Gross Profit Net Profit
(USD mn)
EBITDA & EBITDA Margin
(1) Adjusted EBITDA includes AOD income
61 44
12 31
45
73 75
23% 24% 23%
CY2012 CY2013 CY2014
AOD EBITDA EBITDA Margin
(USD mn)
22
Impressive revenue and EBITDA growth over the last 3 years
29% Revenue and EBITDA CAGR 136% Net Profit CAGR

Revenue Growth(1) Net Income Growth(1)
Net Margin(2) Total Equity / Total Assets(2)
136%
68% 46% 44%
-17% -24% -30% Mermaid Ezion Pacific
Radiance Nam
Cheong Ezra ASL Swiber
Source: Bloomberg (1) Compounded annual growth rates for the last three fiscal years (2) Most recent fiscal year
23
56%
44%
29% 23%
16% 15%
-13% Ezion Nam
Cheong Mermaid Ezra ASL Pacific
Radiance Swiber
58%
40%
16% 11%
4% 3% 3%
Ezion Pacific Radiance
Nam Cheong
Mermaid ASL Ezra Swiber
0.7x
0.5x
0.4x 0.4x 0.4x
0.3x 0.3x
Mermaid Pacific Radiance
Ezion Nam Cheong
Ezra ASL Swiber
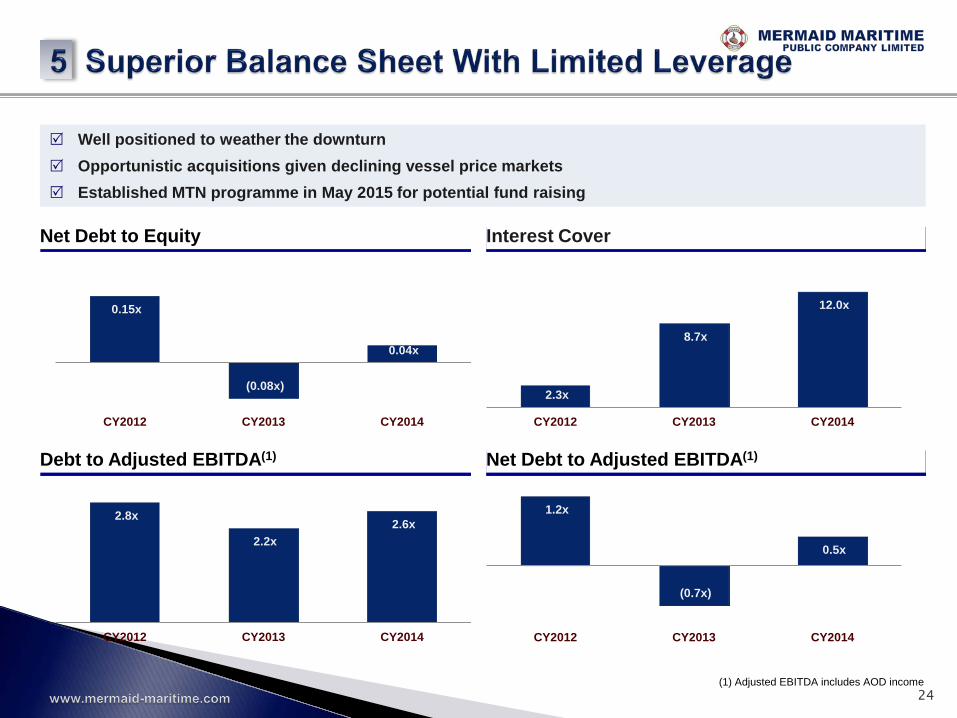
Well positioned to weather the downturn Opportunistic acquisitions given declining vessel price markets Established MTN programme in May 2015 for potential fund raising
2.8x
2.2x 2.6x
CY2012 CY2013 CY2014
1.2x
(0.7x)
0.5x
CY2012 CY2013 CY2014
2.3x
8.7x
12.0x
CY2012 CY2013 CY2014
0.15x
(0.08x)
0.04x
CY2012 CY2013 CY2014
Net Debt to Equity Interest Cover
Debt to Adjusted EBITDA(1) Net Debt to Adjusted EBITDA(1)
(1) Adjusted EBITDA includes AOD income 24
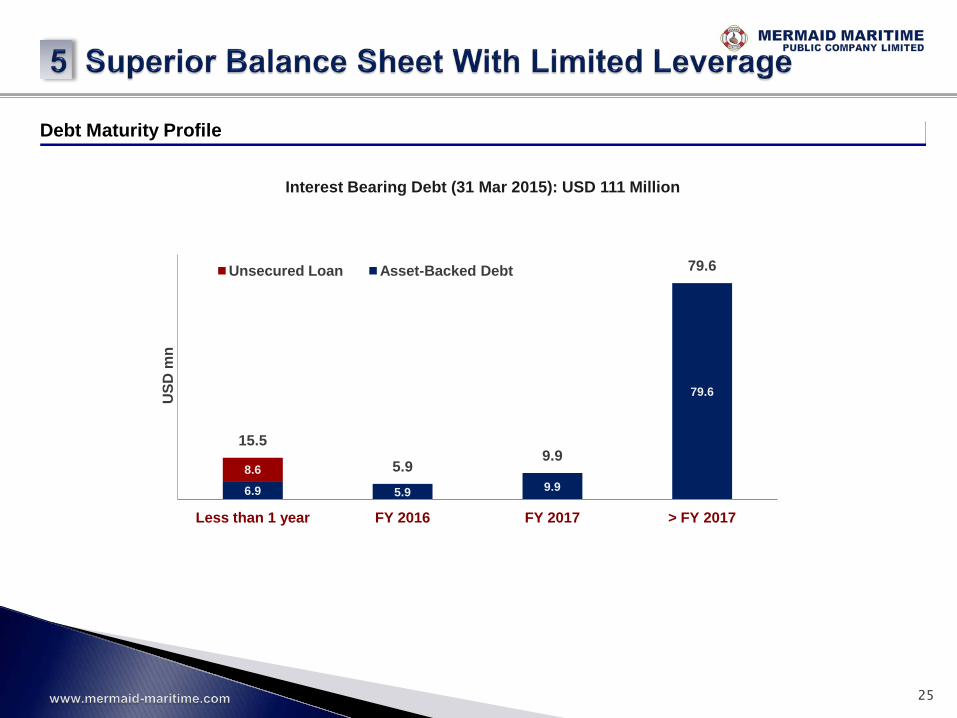
Debt Maturity Profile
6.9 5.9 9.9
79.6
8.6
15.5
5.9 9.9
79.6
Less than 1 year FY 2016 FY 2017 > FY 2017
USD
mn
Interest Bearing Debt (31 Mar 2015): USD 111 Million
Unsecured Loan Asset-Backed Debt
25
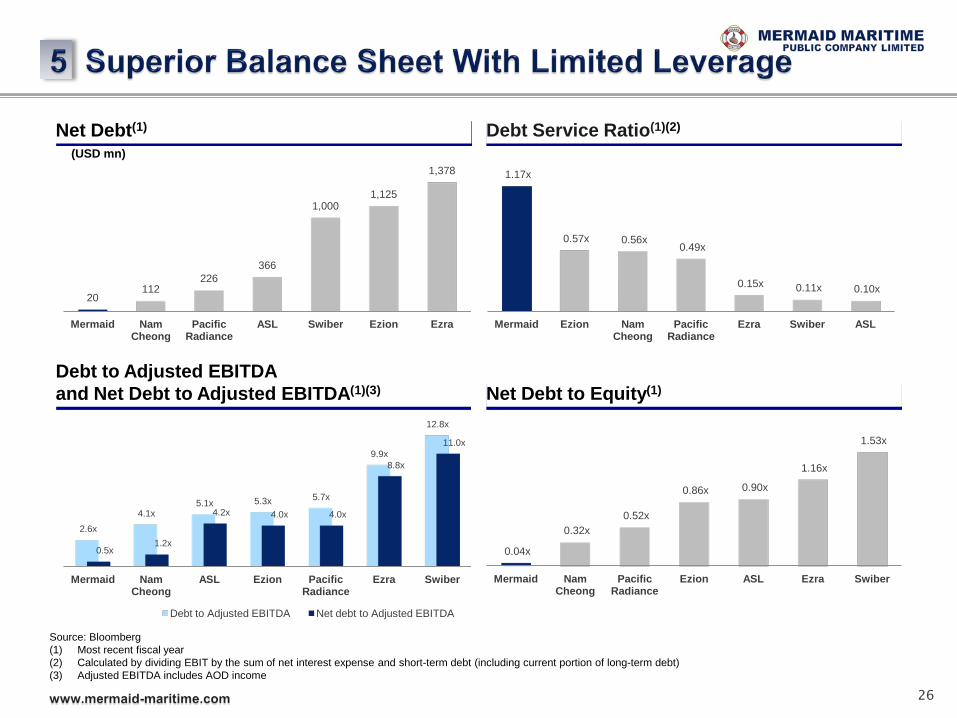
Net Debt(1) Debt Service Ratio(1)(2)
Debt to Adjusted EBITDA and Net Debt to Adjusted EBITDA(1)(3) Net Debt to Equity(1)
20 112
226 366
1,000 1,125
1,378
Mermaid Nam Cheong
Pacific Radiance
ASL Swiber Ezion Ezra
(USD mn)
2.6x 4.1x
5.1x 5.3x 5.7x
9.9x
12.8x
0.5x 1.2x
4.2x 4.0x 4.0x
8.8x
11.0x
Mermaid Nam Cheong
ASL Ezion Pacific Radiance
Ezra Swiber
Debt to Adjusted EBITDA Net debt to Adjusted EBITDA
0.04x
0.32x 0.52x
0.86x 0.90x
1.16x
1.53x
Mermaid Nam Cheong
Pacific Radiance
Ezion ASL Ezra Swiber
Source: Bloomberg (1) Most recent fiscal year (2) Calculated by dividing EBIT by the sum of net interest expense and short-term debt (including current portion of long-term debt) (3) Adjusted EBITDA includes AOD income
26
1.17x
0.57x 0.56x 0.49x
0.15x 0.11x 0.10x
Mermaid Ezion Nam Cheong
Pacific Radiance
Ezra Swiber ASL
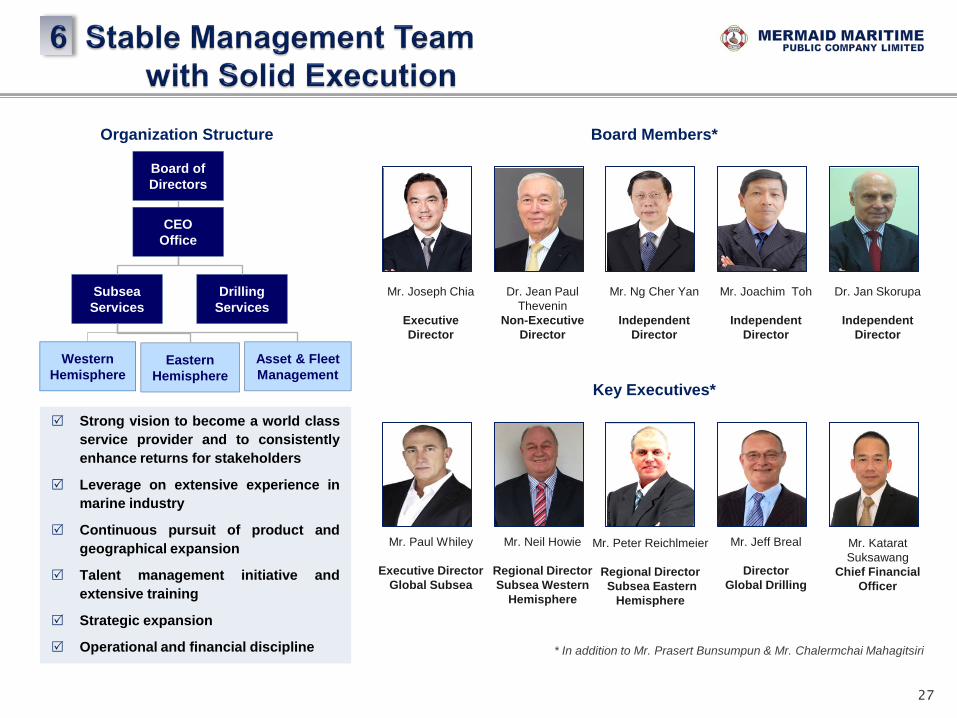
Organization Structure
Board of Directors
Subsea Services
Drilling Services
Eastern Hemisphere
Western Hemisphere
Asset & Fleet Management
Strong vision to become a world class service provider and to consistently enhance returns for stakeholders
Leverage on extensive experience in marine industry
Continuous pursuit of product and geographical expansion
Talent management initiative and extensive training
Strategic expansion
Operational and financial discipline
Board Members*
Dr. Jean Paul Thevenin
Non-Executive Director
Mr. Ng Cher Yan
Independent Director
Dr. Jan Skorupa
Independent Director
Mr. Joachim Toh
Independent Director
Mr. Joseph Chia
Executive Director
Key Executives*
Mr. Paul Whiley
Executive Director Global Subsea
Mr. Neil Howie
Regional Director Subsea Western
Hemisphere
Mr. Jeff Breal
Director Global Drilling
Mr. Katarat Suksawang
Chief Financial Officer
* In addition to Mr. Prasert Bunsumpun & Mr. Chalermchai Mahagitsiri
CEO Office
27
Mr. Peter Reichlmeier
Regional Director Subsea Eastern
Hemisphere
Company Strategy & Outlook
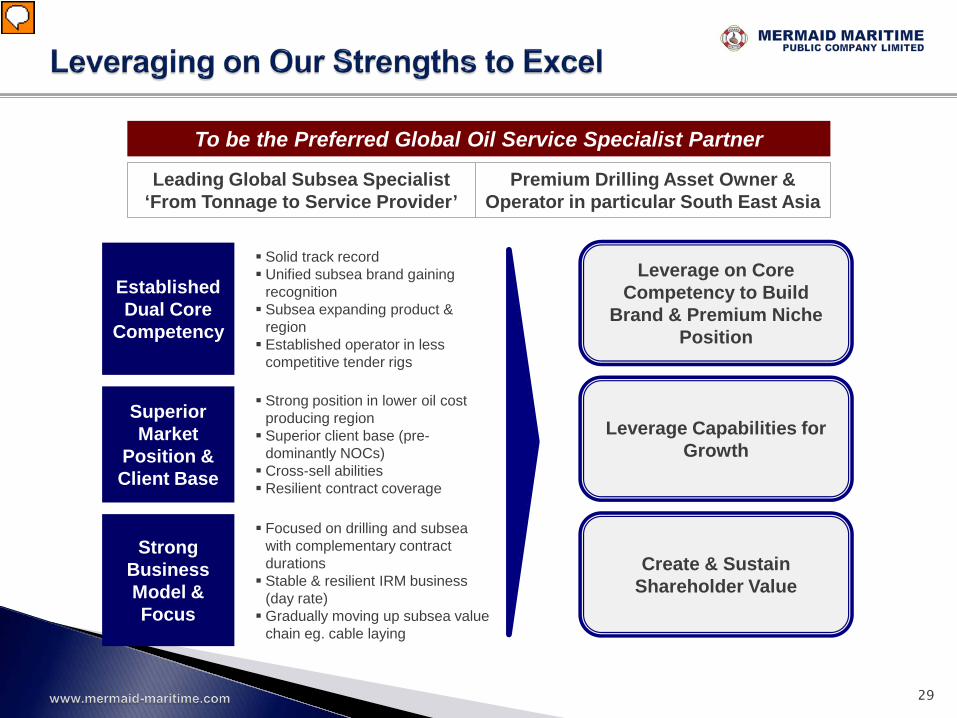
To be the Preferred Global Oil Service Specialist Partner
Leading Global Subsea Specialist ‘From Tonnage to Service Provider’
Premium Drilling Asset Owner & Operator in particular South East Asia
Established Dual Core
Competency
Strong Business Model & Focus
Superior Market
Position & Client Base
Solid track record Unified subsea brand gaining
recognition Subsea expanding product &
region Established operator in less
competitive tender rigs
Focused on drilling and subsea with complementary contract durations Stable & resilient IRM business
(day rate) Gradually moving up subsea value
chain eg. cable laying
Strong position in lower oil cost producing region Superior client base (pre-
dominantly NOCs) Cross-sell abilities Resilient contract coverage
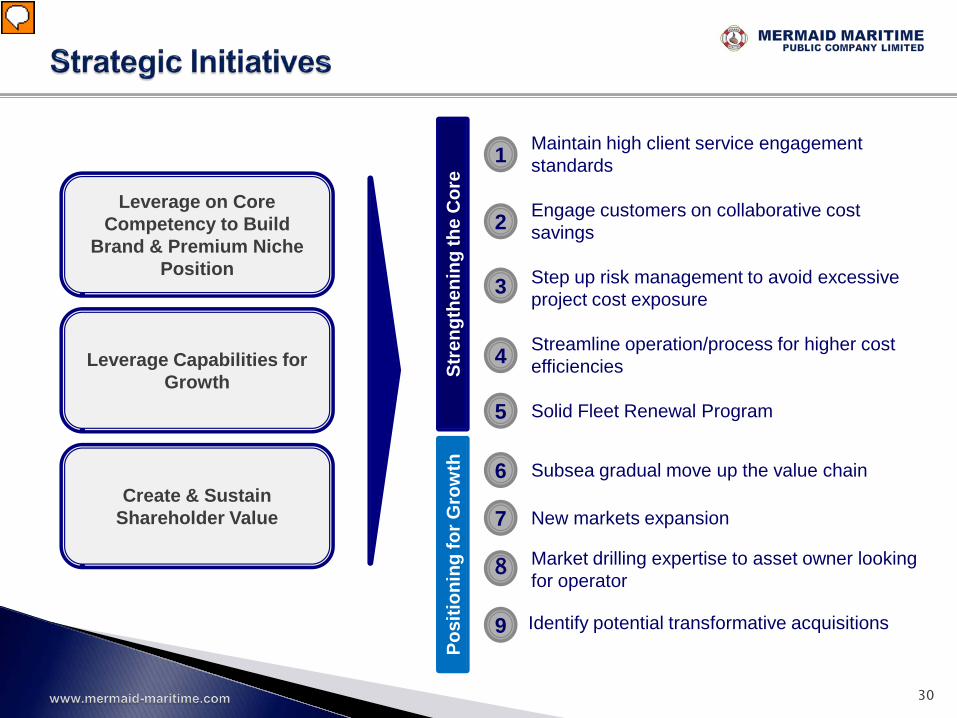
Leverage on Core Competency to Build
Brand & Premium Niche Position
Create & Sustain Shareholder Value
Leverage Capabilities for Growth
29
Posi
tioni
ng fo
r Gro
wth
St
reng
then
ing
the
Cor
e
1 Maintain high client service engagement standards
2 Engage customers on collaborative cost savings
3 Step up risk management to avoid excessive project cost exposure
4 Streamline operation/process for higher cost efficiencies
5 Solid Fleet Renewal Program
6 Subsea gradual move up the value chain
7 New markets expansion
8 Market drilling expertise to asset owner looking for operator
9 Identify potential transformative acquisitions
Leverage on Core Competency to Build
Brand & Premium Niche Position
Create & Sustain Shareholder Value
Leverage Capabilities for Growth
30
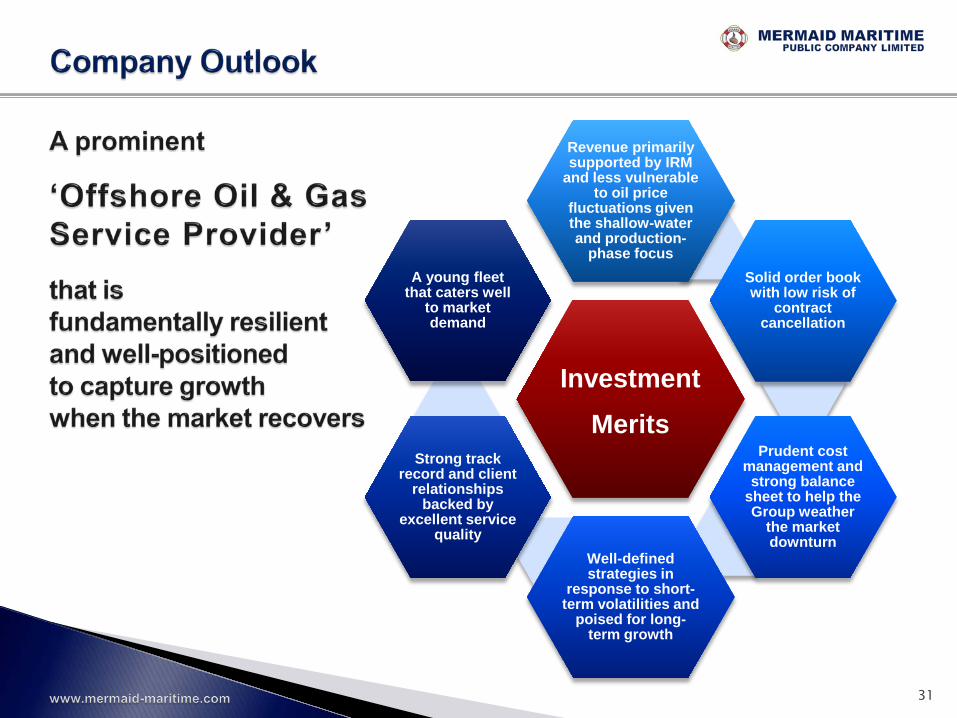
31
Investment Merits
Revenue primarily supported by IRM
and less vulnerable to oil price
fluctuations given the shallow-water and production-
phase focus Solid order book with low risk of
contract cancellation
Prudent cost management and strong balance
sheet to help the Group weather
the market downturn
Well-defined strategies in
response to short- term volatilities and
poised for long-term growth
Strong track record and client
relationships backed by
excellent service quality
A young fleet that caters well
to market demand
Investor Roadshow
July 2015
Mermaid Maritime Plc
Industry Development
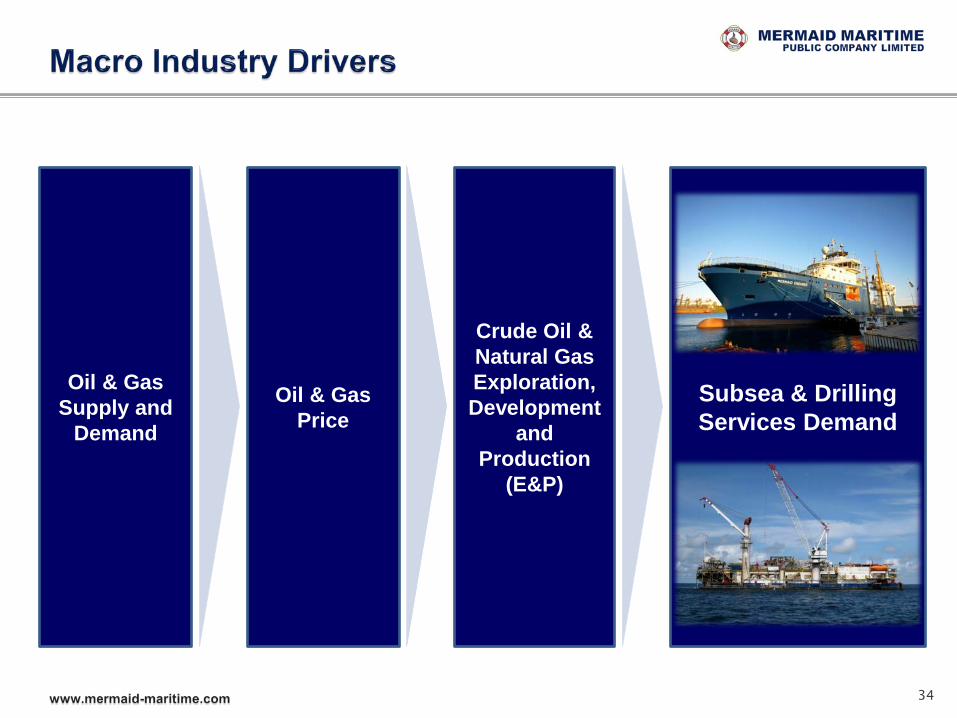
Subsea & Drilling Services Demand
Oil & Gas Price
Crude Oil & Natural Gas Exploration, Development
and Production
(E&P)
Oil & Gas Supply and
Demand
34
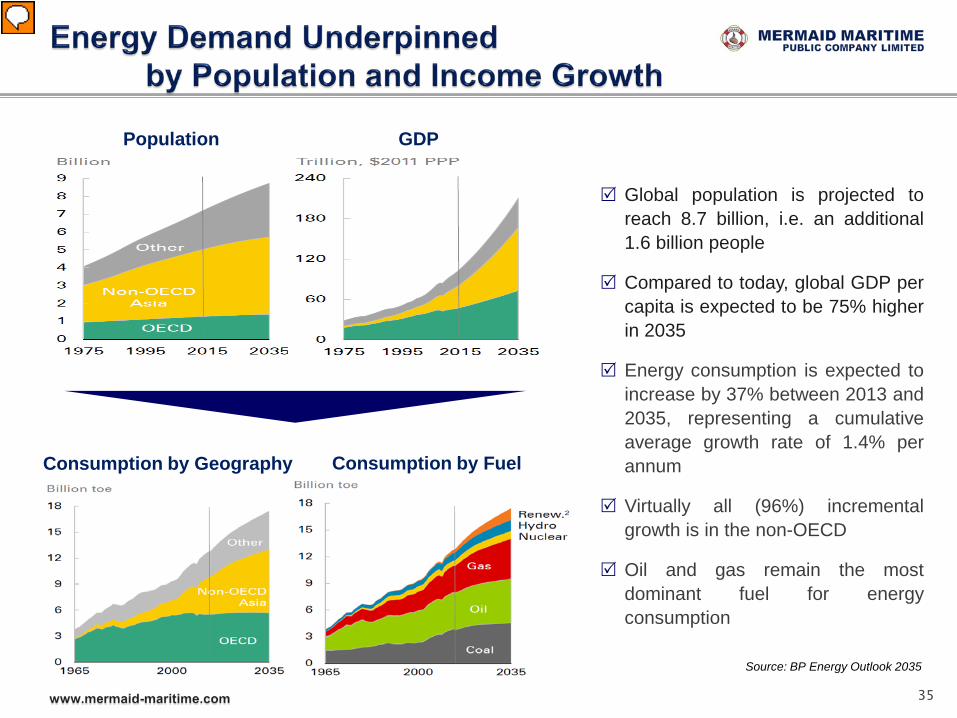
Source: BP Energy Outlook 2035
GDP Population
35
Consumption by Geography Consumption by Fuel
Global population is projected to reach 8.7 billion, i.e. an additional 1.6 billion people
Compared to today, global GDP per capita is expected to be 75% higher in 2035
Energy consumption is expected to increase by 37% between 2013 and 2035, representing a cumulative average growth rate of 1.4% per annum
Virtually all (96%) incremental growth is in the non-OECD
Oil and gas remain the most dominant fuel for energy consumption
36
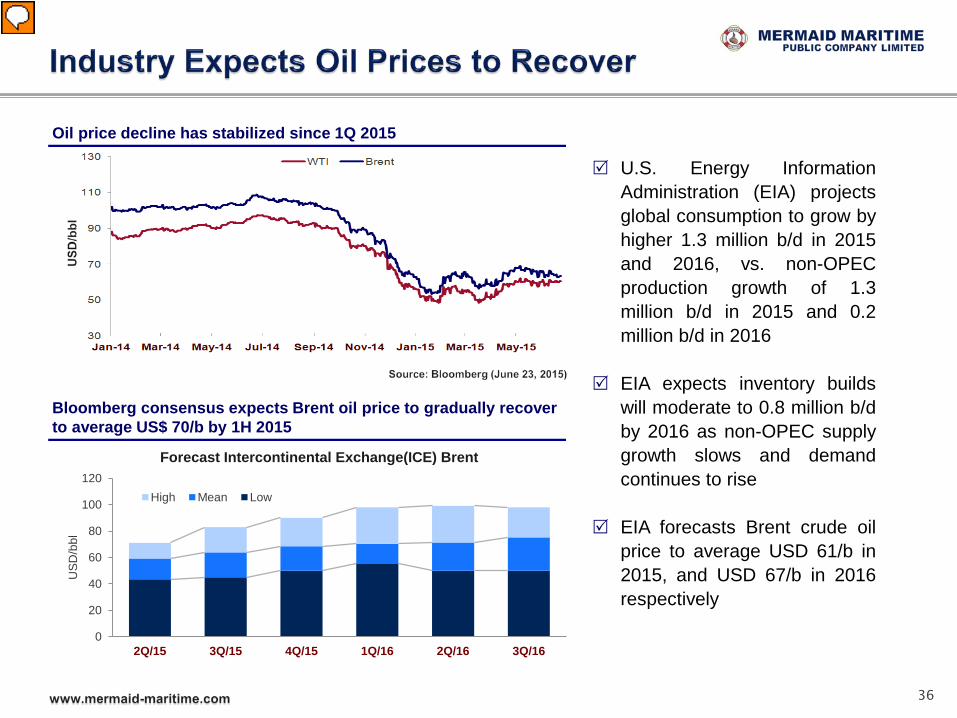
U.S. Energy Information Administration (EIA) projects global consumption to grow by higher 1.3 million b/d in 2015 and 2016, vs. non-OPEC production growth of 1.3 million b/d in 2015 and 0.2 million b/d in 2016
EIA expects inventory builds will moderate to 0.8 million b/d by 2016 as non-OPEC supply growth slows and demand continues to rise
EIA forecasts Brent crude oil price to average USD 61/b in 2015, and USD 67/b in 2016 respectively
Oil price decline has stabilized since 1Q 2015
0
20
40
60
80
100
120
2Q/15 3Q/15 4Q/15 1Q/16 2Q/16 3Q/16
US
D/b
bl
Forecast Intercontinental Exchange(ICE) Brent
High Mean Low
Bloomberg consensus expects Brent oil price to gradually recover to average US$ 70/b by 1H 2015
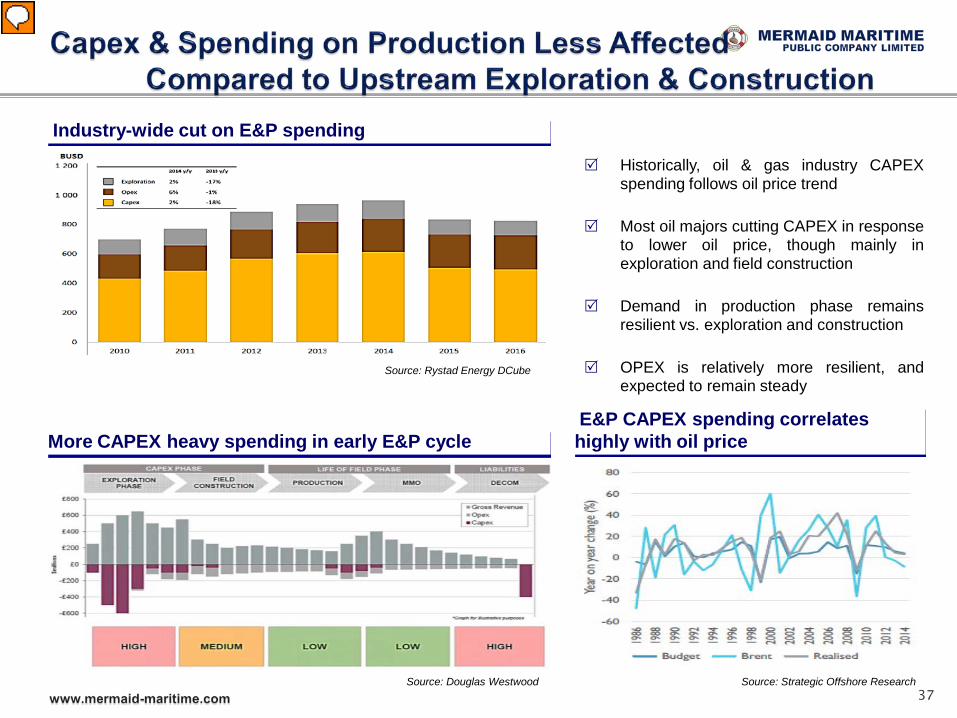
Historically, oil & gas industry CAPEX spending follows oil price trend
Most oil majors cutting CAPEX in response to lower oil price, though mainly in exploration and field construction
Demand in production phase remains resilient vs. exploration and construction
OPEX is relatively more resilient, and expected to remain steady
Source: Strategic Offshore Research
More CAPEX heavy spending in early E&P cycle
37
Source: Rystad Energy DCube
Source: Douglas Westwood
E&P CAPEX spending correlates highly with oil price
Industry-wide cut on E&P spending
38
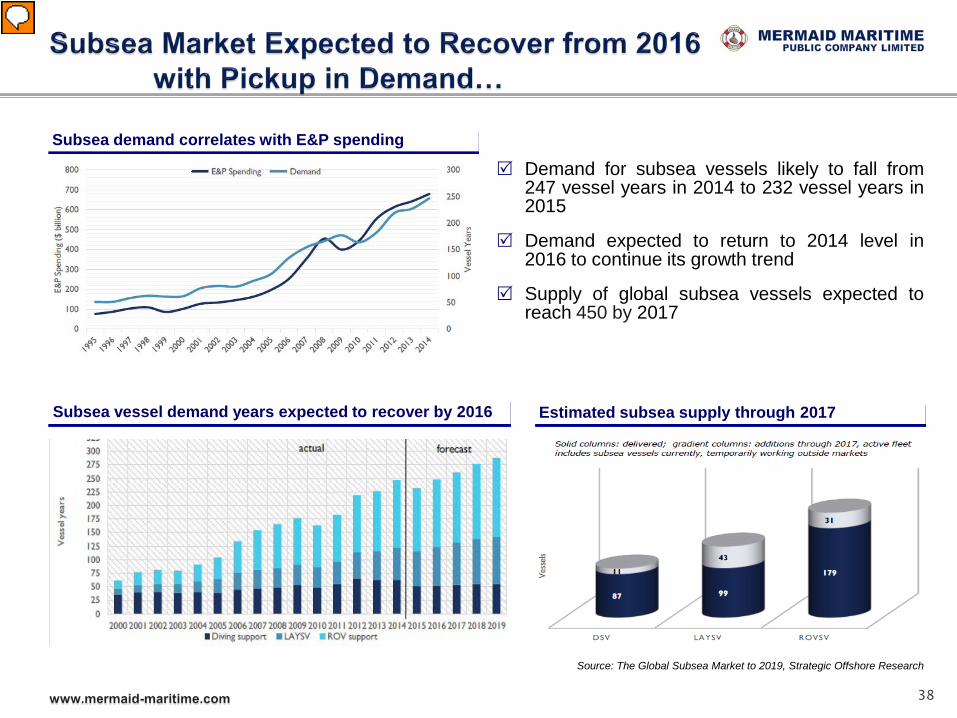
Demand for subsea vessels likely to fall from 247 vessel years in 2014 to 232 vessel years in 2015
Demand expected to return to 2014 level in 2016 to continue its growth trend
Supply of global subsea vessels expected to reach 450 by 2017
Subsea demand correlates with E&P spending
Subsea vessel demand years expected to recover by 2016 Estimated subsea supply through 2017
Source: The Global Subsea Market to 2019, Strategic Offshore Research

Approximately 1/5 of the global subsea vessel fleet is over 20 years old
International contractors and operators are demanding for younger vessels to achieve higher operational efficiency and safety standards
Also, growing demand for higher-end vessels capable of coping with increasingly harsh operating conditions
Older vessels face lower utilization rate...
...with industry demanding for younger vessels
39
Global subsea vessels by age class
Source: The Global Subsea Market to 2019, Strategic Offshore Research
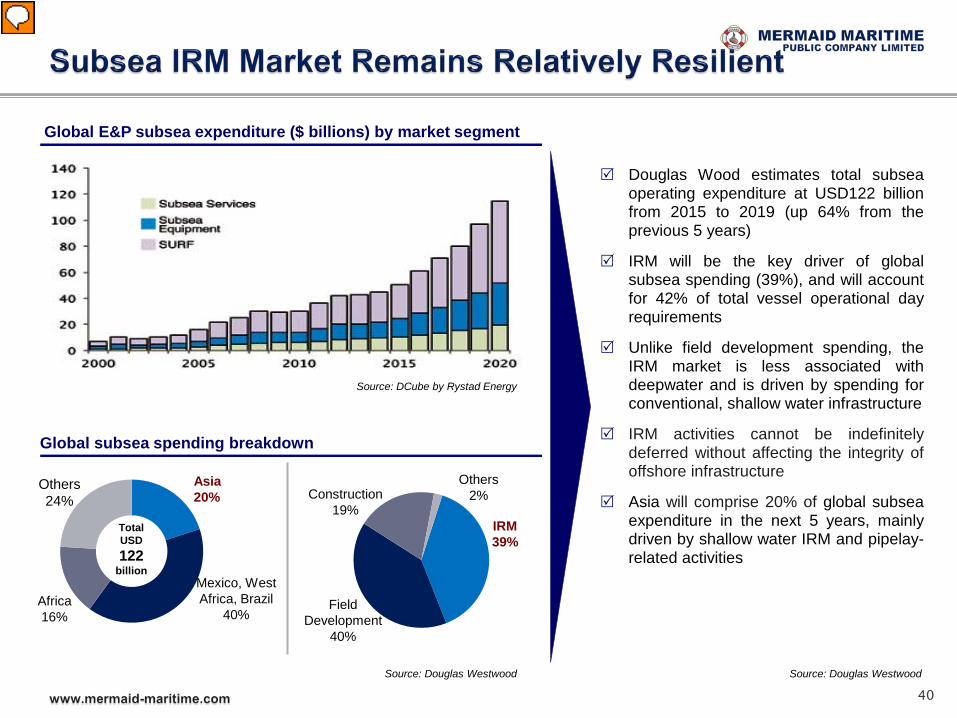
Douglas Wood estimates total subsea operating expenditure at USD122 billion from 2015 to 2019 (up 64% from the previous 5 years)
IRM will be the key driver of global subsea spending (39%), and will account for 42% of total vessel operational day requirements
Unlike field development spending, the IRM market is less associated with deepwater and is driven by spending for conventional, shallow water infrastructure
IRM activities cannot be indefinitely deferred without affecting the integrity of offshore infrastructure
Asia will comprise 20% of global subsea expenditure in the next 5 years, mainly driven by shallow water IRM and pipelay-related activities
Total USD 122
billion
Global subsea spending breakdown
Source: Douglas Westwood
Asia 20%
Mexico, West Africa, Brazil
40% Africa 16%
Others 24%
IRM 39%
Others 2%
Field Development
40%
Construction 19%
40
Global E&P subsea expenditure ($ billions) by market segment
Source: DCube by Rystad Energy
Source: Douglas Westwood
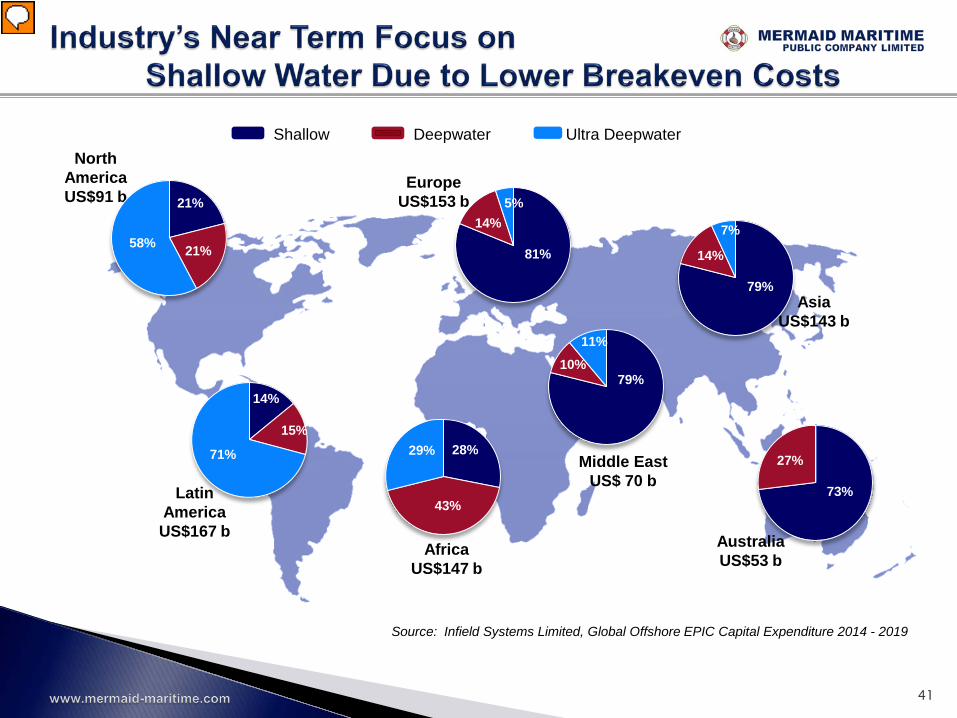
Middle East US$ 70 b
Africa US$147 b
North America US$91 b
Latin America US$167 b
Europe US$153 b
Australia US$53 b
Asia US$143 b
21%
21%
58% 81%
5%
14%
15%
14%
71%
79%
7%
14%
73%
27%
79%
11%
10%
28% 29%
43%
Source: Infield Systems Limited, Global Offshore EPIC Capital Expenditure 2014 - 2019
Shallow Deepwater Ultra Deepwater
41
42
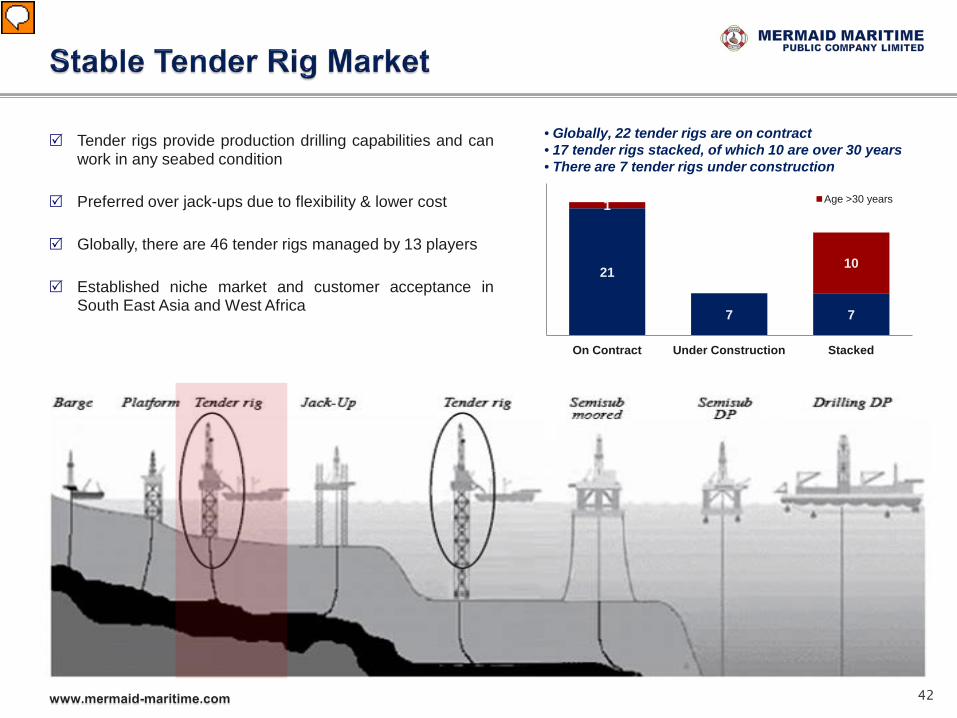
Tender rigs provide production drilling capabilities and can work in any seabed condition
Preferred over jack-ups due to flexibility & lower cost
Globally, there are 46 tender rigs managed by 13 players
Established niche market and customer acceptance in South East Asia and West Africa
21
7 7
1
10
On Contract Under Construction Stacked
Age >30 years
• Globally, 22 tender rigs are on contract • 17 tender rigs stacked, of which 10 are over 30 years • There are 7 tender rigs under construction
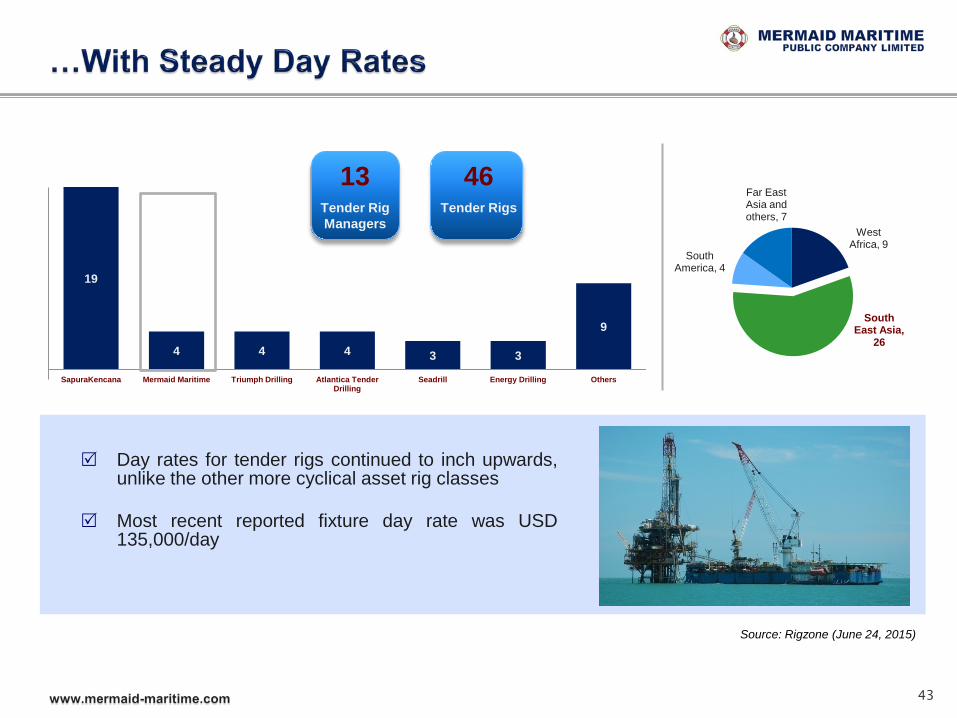
19
4 4 4 3 3
9
SapuraKencana Mermaid Maritime Triumph Drilling Atlantica Tender Drilling
Seadrill Energy Drilling Others
43
West Africa, 9
South East Asia,
26
South America, 4
Far East Asia and others, 7
Source: Rigzone (June 24, 2015)
Day rates for tender rigs continued to inch upwards, unlike the other more cyclical asset rig classes
Most recent reported fixture day rate was USD 135,000/day
46
Tender Rigs
13
Tender Rig Managers
44
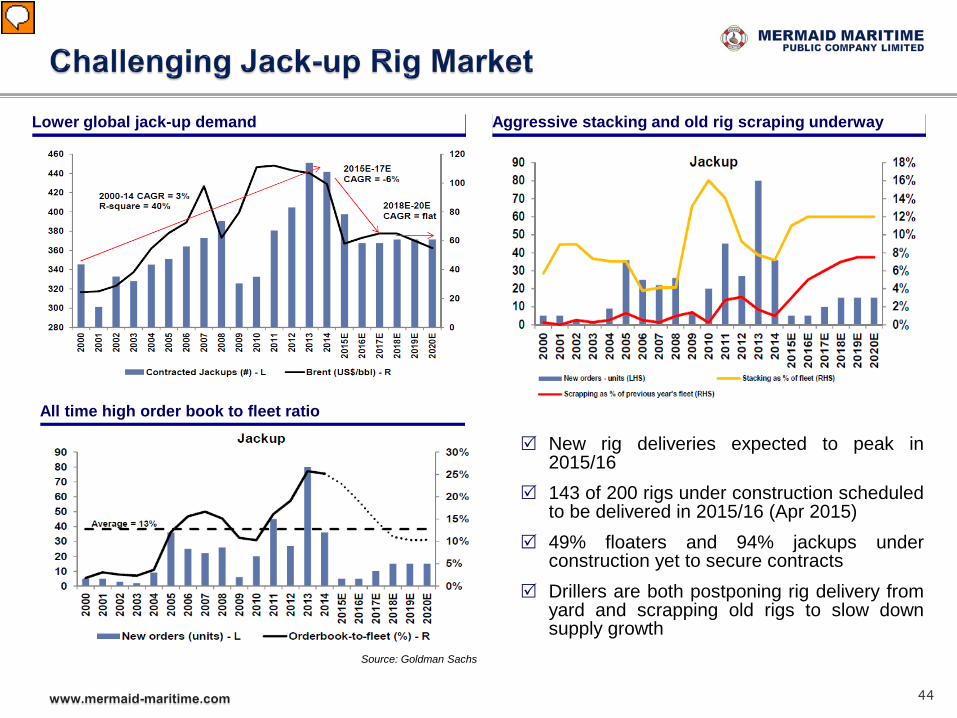
New rig deliveries expected to peak in
2015/16 143 of 200 rigs under construction scheduled
to be delivered in 2015/16 (Apr 2015) 49% floaters and 94% jackups under
construction yet to secure contracts Drillers are both postponing rig delivery from
yard and scrapping old rigs to slow down supply growth
Lower global jack-up demand
Source: Goldman Sachs
All time high order book to fleet ratio
Aggressive stacking and old rig scraping underway
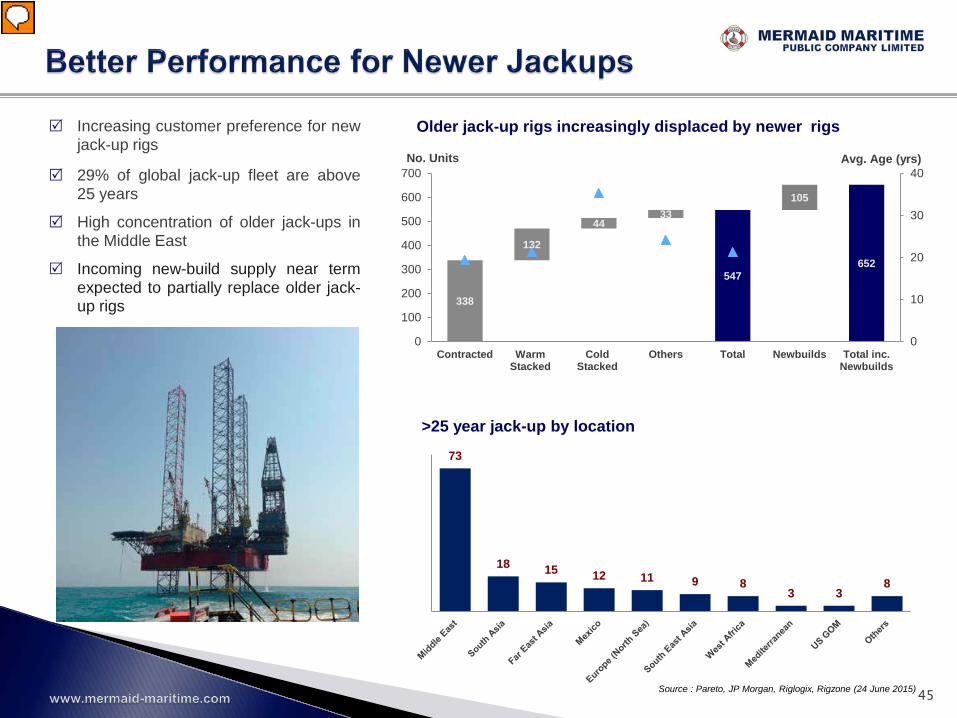
338
132
44 33
547
105
652
0
10
20
30
40
0
100
200
300
400
500
600
700
Contracted Warm Stacked
Cold Stacked
Others Total Newbuilds Total inc. Newbuilds
Avg. Age (yrs) No. Units
73
18 15 12 11 9 8 3 3
8
>25 year jack-up by location
Increasing customer preference for new jack-up rigs
29% of global jack-up fleet are above 25 years
High concentration of older jack-ups in the Middle East
Incoming new-build supply near term expected to partially replace older jack-up rigs
Older jack-up rigs increasingly displaced by newer rigs
45 Source : Pareto, JP Morgan, Riglogix, Rigzone (24 June 2015)


![PM 2014 investor day 2014-06-26-LAC Region Investor Day Slides [WEBSITE FINAL]](https://img.pdfslide.us/doc/110x75/577cbc651a28aba7118da312/pm-2014-investor-day-2014-06-26-lac-region-investor-day-slides-website-final.jpg)