Embed Size (px)
Citation preview

INVESTOR RELATIONS
presentation
Q1’2017

Disclaimer By attending the meeting where this presentation is made or distributed, or by reading the presentation slides, you agree with the following limitations:
• The information in this presentation may contain future projections and forward‐looking
statements that reflect the bank’s current views with respect to future events and financial
performance. These views are based on current assumptions which are subject to various risks
and thus, may change over time
• No assurance can be given that projections will be achieved, future events will occur, or that the
Bank’s assumptions are correct. Actual results may differ materially from those projected
• This document is provided for informational purposes only. It is not an offer to buy or sell CIB
shares. Readers should take into account factors of uncertainty and risk when basing their
investment decisions on information provided in this document
• Past performance cannot be relied on as a guide to future performance
• CIB relies on information obtained from sources believed to be reliable, but does not guarantee
its accuracy or completeness
2
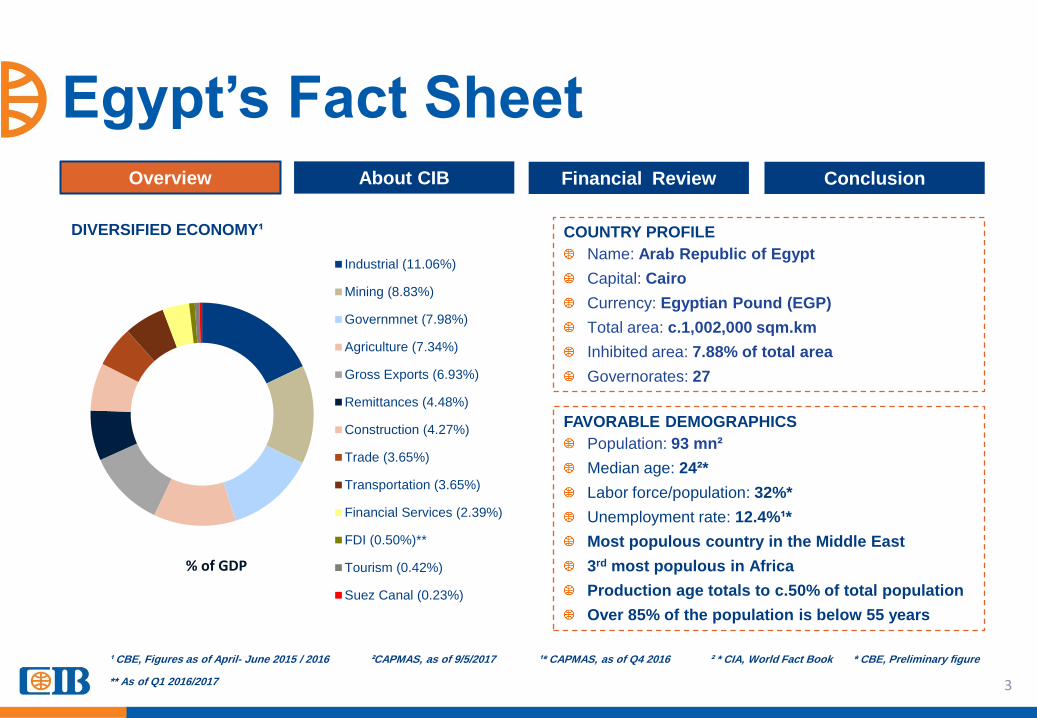
Egypt’s Fact Sheet
3
Overview About CIB Financial Review Conclusion
COUNTRY PROFILE
Name: Arab Republic of Egypt
Capital: Cairo
Currency: Egyptian Pound (EGP)
Total area: c.1,002,000 sqm.km
Inhibited area: 7.88% of total area
Governorates: 27
FAVORABLE DEMOGRAPHICS
Population: 93 mn²
Median age: 24²*
Labor force/population: 32%*
Unemployment rate: 12.4%¹*
Most populous country in the Middle East
3rd most populous in Africa
Production age totals to c.50% of total population
Over 85% of the population is below 55 years
Industrial (11.06%)
Mining (8.83%)
Governmnet (7.98%)
Agriculture (7.34%)
Gross Exports (6.93%)
Remittances (4.48%)
Construction (4.27%)
Trade (3.65%)
Transportation (3.65%)
Financial Services (2.39%)
FDI (0.50%)**
Tourism (0.42%)
Suez Canal (0.23%)
DIVERSIFIED ECONOMY¹
% of GDP
¹ CBE, Figures as of April- June 2015 / 2016 ²CAPMAS, as of 9/5/2017 ¹* CAPMAS, as of Q4 2016 ² * CIA, World Fact Book * CBE, Preliminary figure
** As of Q1 2016/2017

Macro-Environment
4
Overview About CIB Financial Review Conclusion
MANAGEABLE DEBT
Net International Reserve: $26.4 bn (Jan’17)
Current A/C balance: $-4,983.3 mn***
LT external debt: $55.4 bn¹
ST external debt: $11.9 bn¹
c.80% of debt in LCY, held by public sector
GROWTH OPPORTUNITIES
Total GDP : EGP 808,617.9 mn****
GDP/Capita: $12,137³
CONSUMPTION
Private consumption/GDP: 85.75%**
Public consumption/GDP: 9.74%**
*GDP at Factor Cost ** Figures as of July/September 2016/2017 *** Figure as of Q1 2016/2017 # Figures as of 1H 2016/2017
Annualized
¹ Figures as of Q2 2016/2017 **** GDP at Factor cost by economic activity (current prices) as of Jul/2016/2017 ³ IMF, WEO Database, 2016
7.1% 7.2%
4.7% 5.1%
1.9% 2.2% 2.1% 2.2%
3.4%
2.3% 1.7%
0.0%
1.0%
2.0%
3.0%
4.0%
5.0%
6.0%
7.0%
8.0%
06/07 07/08 08/09 09/10 10/11 11/12 12/13 13/14 14/15 15/16 Q1 16/17
Real GDP Growth* (%)
Reform-led boom
Global financial crisis
Post-uprising turmoil
9.3%
21.5%
11.4% 11.0% 8.2% 6.20%
11.66% 10.13% 11.06%
23.27%
30.25%
0%
10%
20%
30%
40%
06/07 07/08 08/09 09/10 10/11 11/12 12/13 13/14 14/15 15/16 Feb-17
Inflation (%) 11,053
13,237
8,113 6,758
2,189 3,982
5,184
4,119
6,371
6,933 8,574#
0
4,000
8,000
12,000
16,000
06/07 07/08 08/09 09/10 10/11 11/12 12/13 13/14 14/15 15/16 H116/17
FDI (USD mn)

Egypt’s Banking Sector
5
Overview About CIB Financial Review Conclusion
965 1,027 1,191
1,433
1,740
2,123
2,761
10/11 11/12 12/13 13/14 14/15 15/16 Dec-16
Total deposits (EGP bn)
49% 49% 46%
41% 41% 44%
10/11 11/12 12/13 13/14 14/15 15/16
LDR (%)
1.51%
6.79% 8.35% 7.16%
22.26%
31.23%
10/11 11/12 12/13 13/14 14/15 15/16
Loan growth (%)
7.22% 6.42%
15.97%
20.32% 21.42% 22.01%
10/11 11/12 12/13 13/14 14/15 15/16
Deposit growth (%)
UNDERLEVERAGED
Total # of banks: 39*
Total bank lending facilities/GDP:
38.62%**
Corporate loans/GDP: 31.74%**
Household debt/GDP: 6.88%**
Loans/Deposits: 47.09%***
* After Arab African International Bank Acquired Bank of Nova Scotia in Egypt **GDP by expenditure at market price ***Loans/Deposits as of December2016
471 503 545 584 714
937
1,293
10/11 11/12 12/13 13/14 14/15 15/16 Dec-16
Total loans (EGP bn)

Egypt’s Banking Sector (Cont’d)
6
Overview About CIB Financial Review Conclusion
32,911
40,046
45,716
51,384
55,876
64,349
62,764
10/11
11/12
12/13
13/14
14/15
15/16
Dec-16
Total # of POS
4,953
5,489
6,283
6,810
7,855
9,031
9,832
10/11
11/12
12/13
13/14
14/15
15/16
Dec-16
Total # of ATMs
3,573
3,610
3,651
3,712
3,766
3,882
3,950
10/11
11/12
12/13
13/14
14/15
15/16
Dec-16
1,738
1,790
2,100
2,334
2,575
3,825
3,860
10/11
11/12
12/13
13/14
14/15
15/16
Dec-16
Total # of credit cards (‘000)
10,636
11,193
12,677
13,910
16,243
13,201
12,082
10/11
11/12
12/13
13/14
14/15
15/16
Dec-16
Total # of debit cards (‘000)*
BANKING REFORMS
Phase I (2005-2008): completed
Phase II (2009- 2011): improving regulatory
environment, adopting Basel II, increased
focus on corporate governance, limit
concentrated risk exposure and proprietary
investment
Phase III (2011-2012): finalized fine-tuning of
regulations
Phase IV (Ongoing): parallel run of existing
regulations on capital adequacy and Basel II,
finalizing data warehousing framework, final
regulations on leverage ratio, 2nd discussion
paper on LCR and NSFR, final regulations
on ICAAP, Capital conservation buffer
Total # of branches
* Including the number of prepaid debit cards from June 2013 until June 2015

The Challenges
7
Overview About CIB Financial Review Conclusion
Budget deficit1
12.5% of GDP in FY 15/16 and a budgeted deficit of 9.8% for FY 16/17
High Inflation2 Headline CPI reached 30.9% in March 2017
Competitiveness index3
Ranked 115/138 in 2016-2017 Global Competitiveness Index
Ease of doing business index4
Ranked 122/190 in 2017 Doing Business
Low quality health care services and education Egypt health and primary education3 ranked 89/138 with score of 5.5 (out of 7) in the global competitiveness
index 2016-17. Moreover, literacy rate for population aged 15 and older was only 75.84%5 in 2015
1 Ministry of Finance - March 2017 Financial Monthly Bulletin (Note: overall deficit for FY 15/16 is still preliminary) 2 Central Bank of Egypt – Data Release April 10, 2017 3 World Economic Forum – Global Competitiveness Index 2016-2017 4 World Bank Group 5 United Nations Educational, Scientific and Cultural Organization (UNESCO)

Why Egypt?
8
Overview About CIB Financial Review Conclusion
MEGA PROJECTS
New Suez Canal
New Cairo Administrative Capital
Development Passage in Western Desert
Golden Triangle in the South
North Coast development plan
1.5 million feddan reclamation project in New Valley
ECONOMIC ENVIRONMENT Among the most diverse in the MENA region
Unveiling opportunities within SMEs
Initiative to pay government employees via debit cards
Integration of grey economy
Attracting retail into banks
(over 80% of adult population unbanked)
FINANCIAL
INCLUSION
POLITICAL STABILITY Building new political structure
General optimism about the political future in
Egypt
Moving to a more open political system
ATTRACTS INVESTMENTS
Approved IMF Loan signaling a tremendous
confidence boost in Egypt's ability to release
its economic potential in a sustainable way
Proximity to international markets
Broad and increasing local consumer base
Low labor costs
POLICY ADJUSTMENT Liberalization of foreign exchange system to eliminate forex exchange shortages and encourage investment and exports
Monetary policy aimed at containing inflation
Strong fiscal consolidation to ensure public debt sustainability
Strengthening social safety nets by increasing spending on food subsidies and cash transfers
Far-reaching structural reforms to promote higher and inclusive growth, increasing employment opportunities for youth and women
Fresh external financing to close the financing gaps

CIB at a Glance
9
Overview About CIB Financial Review Conclusion
Chase National
Bank established
Chase Divestiture:
Renamed CIB
IPO raising US$
115mn; 150%
oversubscribed
GDR US$ 120mn 22.2% of
share capital
International
Rating by S&P
and Fitch:
BBB-
Consortium led by
Ripplewood; acquired NBE
19% Stake
Strategic
subsidiaries
established to
complement our core
business
RW sold its
remaining stake
in CIB, marking
transition of
strategic
partnership to
Actis
RW led
consortium
divested half its
holdings
in to Actis
Actis Sold
remaining 6.5%
to Fairfax
Financial
Holdings Ltd
“Fairfax” in May
Actis Sold
2.6% in open
market in
March
1975 1987 1993 1996 1998 2006 2009 2014

CIB’s Key Milestones
10
Overview About CIB Financial Review Conclusion
1975 First joint venture
bank in Egypt;
Chase National
Bank
1977 First private sector
bank to create a
dedicated division
providing 24/7
banking services to
shipping clients, with
primary focus on
business in Suez
Canal
1987 Following Chase
Manhattan divesture
due to a shift in their
strategy, the Bank’s
name was changed to
Commercial
International Bank (CIB)
1989 CIB has been selected
by the IATA to act as the
BSP agent in Egypt, and
remains the sole bank
that offers this service to
airline passengers 1993 Egypt’s largest
local bank IPO,
oversubscription
of 150% , 1.5 mn
shares sold
generating EGP
390 mn in
proceeds
1994 First bank to connect
with the international
SWIFT network
1996 First Egyptian bank to
have a GDR program on
LSE
1997 CIB concludes first &
largest Euro syndicated
loan (USD 200 mn)
1997 First private sector bank with investment rating
‘BBB -‘ by Fitch IBCA
1998 First private sector bank with investment rating ‘BBB -‘ by
S&P

CIB’s Key Milestones (Cont’d)
11
Overview About CIB Financial Review Conclusion
2005 Only bank in Egypt
to be awarded JP
Morgan Quality
Recognition Award
(2005-2012)
2006 First bank in Egypt
to execute EGP 200
mn R’epo
transaction in the
local market
2009 Only Egyptian bank
recognized as ‘Best Bank in
Egypt’ by 4 publications in
the same year; Euromoney,
Global Finance, EMEA
Finance, & The Banker
2001 First Egyptian bank to
register on NYSE;
ADR Level 1
First bank to introduce
FX services for 5
currencies on ATM
2010 First Egyptian bank to establish a GTS department
First and only local bank in Egypt to begin enforcing Business Continuity
Standards
CIB Foundation becomes the first in Egypt to have its annual budget
institutionalized as part of its founding institution’s by-laws, as CIB
shareholders unanimously agreed to dedicate 1% of Bank’s net annual profit
to the Foundation
2012 First Egyptian bank to
establish a Sustainable
Development Department
2013 First Egyptian bank to receive JP
Morgan Elite STP Award
First Egyptian bank to upgrade its ADR
to be traded on OTCQX platform US
2014 First Egyptian bank to sign
agreement with MCDR to
issue debit cards for
investors to collect cash
dividends
First co-branded credit card;
Mileseverywhere, with
EgyptAir
First block trading
transaction on the EGX,
when Actis sols its 6.5%
stake in CIB to Fairfax

CIB’s Associates
12
Overview About CIB Financial Review Conclusion
Ownership: 35%
Profile: Offers a full suite of security services;
o Private security,
o Premises protection,
o Cash-in-Transit (CIT),
o Electronic security system solutions,
o General and facility management services,
o Touristic and governmental concierge services
Ownership: 25.24%*
Profile: Full-fledged Investment Bank;
o Securities Brokerage
o Asset Management
o Investment Banking
o Equities Research
o Leasing
*CIB sold 74.75% of its shares in CI Capital Holding (“CI Capital”) to a group of non-related Egyptian and Gulf investors on March 20th, 2017

Lines of Business
13
Overview About CIB Financial Review Conclusion
INSTITUTIONAL BANKING
Profile Market leader
Prime contributor to profitability
The take-off for a world class consumer
banking franchise
Focus
• Large and medium-size corporates (MNCs,
institutions and banks)
• Project finance and syndicated loans
• Treasury and capital Markets Services
• Transactional banking services
• Retail customers
(with special focus on Wealth and Plus)
• Business Banking (SMEs)
Contribution to loans 81.10% 18.90%
Contribution to deposits 21.63% 78.37%
# of customers 11,461 1,004,470
CONSUMER BANKING

• Formal
Launch
“General
Approach”
Business Banking
14
Overview About CIB Financial Review Conclusion
• Expanding sales
team to 40 RM
• Offering Industry
based packages
• Offering Unsecured
Lending Product
• Expanding
coverage area
• Penetrating the
SME market by
offering industry
based asset
products
• Fine-tuning offered
products and
processes
• Building strong
advisory distribution
team
• Pilot
launch
Caters to SMEs, covering all sectors and industries through more than 100 well-trained Relationship Managers
across the country
CUSTOMER SEGMENTATION
Below EGP 50mn
EGP 50mn-200mn
Above EGP 200mn
FULL RANGE OF FINANCIAL SOLUTIONS
Deposit Products
Tailored Products
Pre-approved loans and product bundles
2010 2011 2012 2013 2014 2015
• Distribution
transformation
• Digital strategy
• New products
& bundles
2016
Large Business
Medium Business
Small Business
SEGMENT DEFINITION (Client Revenue)

15
Overview About CIB Financial Review Conclusion
Our Stock in a Nutshell
STOCK EXCHANGES TICKER
Listed Egyptian Stock Exchange (EGX) COMI
Listed London Stock Exchange (LSE) CBKD
Traded New York Stock Exchange (NYSE) CIBEY
SHARE INFORMATION
Shares outstanding 1,153,866,000
Par value EGP 10.00
GDR convertibility 1:1
52 WEEKS*
PERFORMANCE
High EGP 82.29
Low EGP 39.31
2010 2011 2012 2013 2014 2015 YTD 2017**
Market Cap. (EGP) 27,176mn 11,096mn 20,646mn 29,329mn 44,673mn 43,691mn 88,270mn
Avg. Daily Volume 1.51mn 0.86mn 1.58mn 0.90mn 2.20mn 1.59mn 0.98mn
Avg. Daily Price (EGP) 38.02 24.04 18.85 24.26 41.30 42.30 76.1
0
100
200
300
400
500
Mar-14 Jun-14 Sep-14 Dec-14 Mar-15 Jun-15 Sep-15 Dec-15 Mar-16 Jun-16 Sep-16 Dec-16 Mar-17
CIB Index EGX30 Index
STOCK ACTIVITY*: COMI vs. EGX30
* Normalized after stock dividend as of 24/3/2016 **As of 9/5/2017 Source: Bloomberg

16
Overview About CIB Financial Review Conclusion
Shareholding Structure
* Several wholly owned subsidiaries of Fairfax Financial Holdings Ltd (“Fairfax”)
North America (57.41%)
Africa (13.39%)
GCC (12.66%)
UK & Ireland (7.26%)
Continental Europe (4.76%)
Rest of the World (4.52%)
FREE FLOAT BY REGION
Institutions (91.97%)
Individuals (8.03%)
FREE FLOAT BY CATEGORY
Free Float (93.3%)
Fairfax (6.7%)*

17
Overview About CIB Financial Review Conclusion
Our Presence in Egypt
194 Total Branches and Units
112 Cairo
26 Alexandria
23 Sinai and Canal
17 Delta
16 Upper Egypt and Red Sea
4,109,919 Website visits
246,034 Internet Banking users
740,254 Call Center Calls
256,033 IVR calls
11,369 POS
798 ATMs
DISTRIBUTION NETWORK
DIGITAL BANKING DIGITAL BANKING INITIATIVES
CIB’s footprint
Assign Masary as a new
agent network for Smart
Wallet.
Sign Egypt Post Office
partnership

18
Overview About CIB Financial Review Conclusion
Corporate Governance
COMMITMENT TO SOUND CORPORATE GOVERNANCE PRACTICES CONTINUES TO DEFINE CIB
This commitment is supported by several mandates:
Internal policies, risk controls, and manuals have been put in place to ensure that all business aspects are not only
covered, but well-governed (including risk management, compliance, audit, remuneration, evaluation, succession
planning, code of conduct, and budgeting)
Segregation of the role of Executive Management and Board of Directors
Dedicated Corporate Governance team
Highly skilled Investor Relations team
The Board’s main responsibilities include:
Setting the Bank’s overall strategy and overseeing its execution
Establishing internal control mechanisms
Setting the Bank’s risk appetite and regularly monitoring performance
indicators against approved, defined appetite
Approving IT Group strategy and review it periodically, especially with
regards to the confidentiality of the Bank’s information
Ensuring that shareholders’ interests are being catered to
We take pride in our strong
corporate governance structures
which include:
Experienced team of professional
executive directors and senior
management
Distinguished group of non-
executive directors
Competent board committees
The Board carries on with its mandate to continuously improve the overall corporate governance framework by
regularly reviewing and supervising the Bank’s practices

19
Overview About CIB Financial Review Conclusion
Board of Directors
CIB’s Board consists of 7 members, 5 are
non-executive*
HISHAM EZZ Al-ARAB
Chairman and Managing Director
HUSSEIN ABAZA
Chief Executive Officer and Board Member
JAWAID MIRZA
Non-executive Board member
YASSER HASHEM
Managing Partner of Zaki Hashem and Partners
attorneys at law
MARK RICHARDS
Head of Financial Services of Actis
SHERIF KAMEL
Dean of School of Business Administration (AUC)
BIJAN KHOSROWSHAHI
President and CEO Fairfax International
AUDIT COMMITTEE
CORPORATE GOVERNANCE & COMPENSATION
COMMITTEE
RISK COMMITTEE
OPERATIONS & IT COMMITTEE
SUSTAINABILITY ADVISORY BOARD
HIGH LENDING & INVESTMENT COMMITTEE
MANAGEMENT COMMIITEE
AFFILIATES COMMITTEE
The Board and its committees are governed by well-defined
charters that sets out its responsibilities and composition
requirements
The Board is supported by internal and external auditors
Non
-exe
cu
tive
E
xe
cu
tive
8 committees assist in fulfilling the Board’s responsibilities;
*Board composition for new term 2017-2019

20
Overview About CIB Financial Review Conclusion
Our Strategy
Financial
Performance
Drivers
Customer
Centricity
Operational
Efficiency
Organizational
Development
Quality loan growth,
with focus on
increasing product
penetration and SoW
Transactional
banking services
Adopting a customer
relationship model
Undertaking several
service quality initiatives
to improve customer
satisfaction
Centralization
of Operations
Automation and
process re-
engineering
Core system
stabilization
Performance
driven culture
Focus on
learning and
development
• Deepen understanding of customer behavior
through data analytics
• Adding granularity to customer segments for a
behavioral and lifestyle approach
• Development of need-based bundled value
propositions
• Focus on operational efficiency and
productivity gains
• Digitize banking experience and work towards
straight through processing
• Enforcing a social and environmental
management system
• Become Egypt’s number 1 “Green Bank”
• Development in human capital and alignment
to accommodate with the digital transformation
Adoption of corporate
governance best
practices and solid CSR
strategy
Started offering
bundled financial
solutions
TODAY TOMORROW
Deposit growth,
specially from
households
• Positioned as trade finance hub for Egypt
• Focus on SMEs & underpenetrated retail
banking segment
• Capture the pent-up CAPEX and investments
inflow

21
Overview About CIB Financial Review Conclusion
Business Continuity Management & Information Security
INITIATIVES
CIB continues to invest in further
improving its business continuity and
recovery capabilities to ensure it
provides sustainable and uninterrupted
services to our customers
Progressive Disaster Recovery
Planning
Continuous Alternate Sites
Enhancement
Moving towards ISO22301
Certification
Critical Suppliers Management
Automation and Performance
Metrics Management
Pioneer in implementing international standards and best practices;
established in 2010; ahead of all major players in the market
Set a unique model within the Egyptian financial sector in Business
Continuity industry; since 2014, CIB was shortlisted for 12 global and
regional Business Continuity excellence awards from 3 of the most
reputed organizations in the BCM industry worldwide
Award winner of “Middle East Most Effective Recovery 2016” by
Business Continuity Institute-UK (BCI) & “Business Continuity
Team of the Year 2015” from Disaster Recovery Institute
International-USA (DRII)
Security is a major area of focus for CIB. The bank launched its Cyber
Security Operational Center (SOC), which is considered the first SOC in
the financial sector in Egypt. This emphasizes CIB’s commitment towards
a safer operational and business environment that supports the
organization and customers’ benefits and well-being.

22

23
Overview About CIB Financial Review Conclusion
Performance Snapshot: 31 March 2017
EGP 272,675 mn
Dec.’16: EGP 267,544 mn;
1.92% YtD
EGP 86,740 mn
Dec.’16: EGP 85,384 mn;
1.59% YtD
EGP 239,731 mn
Dec.’16: EGP 231,741 mn;
3.45 % YtD
EGP 22,044 mn Dec.’16: EGP 21,374 mn;
3.12% YtD
TOTAL ASSETS NET LOANS CUSTOMER DEPOSITS SHAREHOLDERS’ EQUITY
EGP 3,322 mn
Mar.’16: EGP 2,584 mn;
28.56% YoY
REVENUES
EGP 1,733 mn
Mar. ‘16: EGP 1,292 mn;
34.21% YoY
NPAT
7.02%
Mar.’16: 4.68%;
49.90% YoY
NPLs/GROSS LOANS*
14.49%
Mar.’16: 12.72%;
13.92% YoY
CAR
31.94%
Mar.’16: 33.23%;
-8.01% YoY
ROAE
2.57%
Mar.’16: 2.77%;
-5.79% YoY
ROAA
21.90%
Mar.’16: 23.37%;
-10.91% YoY
COST/INCOME
4.62%
Mar.’16: 5.81%;
-20.46% YoY
NIM*
*Ratios on a standalone basis
This slide shows CIB’s Q1’2017 performance, figures on a consolidated basis unless otherwise stated

24
Overview About CIB Financial Review Conclusion
Funding Overview
Due to Customers (95.65%)
Other Liabilities (3.25%)
Due to Banks (1.04%)
Long-Term Loans (0.06%)
FUNDING STRUCTURE
Demand (25.51%)
TDs (24.39%)
CDs (29.60%)
Savings (18.08%)
Other (2.43%)
CUSTOMER DEPOSIT MIX
CIB’s funding structure has no wholesale funds

25
Overview About CIB Financial Review Conclusion
10-Year Performance Summary
Branches and Units 131 152 155 153 154 156 152 160 187 192
Headcount 3,508 4,014 4,426 4,750 4,845 5,181 5,490 5,697 5,983 6,714
Years 2007 2008 2009 2010 2011 2012 2013 2014 2015 2016
Starting 2009, CIB used IFRS * Figure on a standalone basis ** Ratio after appropriation Figures on a consolidated basis unless otherwise stated
20.5 26.3 27.4 35.2 41.1 41.9 41.8 48.8 56.8 85.4 39.5 48.9 54.8 63.4 71.5 78.7
96.8 122.0
155.2 231.7
52% 53.8% 50.0%
55.5% 57.0% 53.2%
43.2% 40.0% 36.6%
36.9%
2007 2008 2009 2010 2011 2012 2013 2014 2015 2016Net Loans (EGP bn) Deposits (EGP bn) Net Loans/Deposits
1,286 1,370 1,744 2,020 1,615 2,226 3,006
3,741 4,729
6,009
35.5%
29.0% 29.9% 28.7%
20.9%
25.5% 29.5% 31.3%
33.4% 34.2%
2007 2008 2009 2010 2011 2012 2013 2014 2015 2016
Net Income (EGP mn) ROAE%**
47,906 57,462 64,255 75,425 85,506 93,957 113,752 143,813
179,500
267,544
3.03%
2.62% 2.89% 2.92%
2.03%
2.51%
2.93% 2.94% 2.95% 2.71%
2007 2008 2009 2010 2011 2012 2013 2014 2015 2016
Total Assets (EGP mn) ROAA%**
14.7% 15.0% 16.5% 16.9% 15.4% 15.7% 16.3% 16.8% 16.1% 14.0%
2.94% 2.97% 2.97% 2.88% 2.82% 3.63% 3.96% 4.66% 3.98% 6.70%
27.1% 29.9%
32.3% 33.1% 35.3% 28.0%
22.9% 22.9%
20.5% 21.3%
2007 2008 2009 2010 2011 2012 2013 2014 2015 2016
CAR** NPLs/Gross Loans* Cost:income*

26
Overview About CIB Financial Review Conclusion
Position Among Peers
246
188
88
77
63
46
0 50 100 150 200 250 300
CIB
QNBA
HSBC
AAIB
Alex
CAE
TOTAL ASSETS (EGP bn)
5,951
4,034
3,478
1,945
1,514
1,367
- 1,000 2,000 3,000 4,000 5,000 6,000 7,000
CIB
QNBA
HSBC
AAIB
Alex
CAE
NET INCOME (EGP mn)
64.1%
61.4%
54.7%
49.0%
44.7%
42.3%
0.0% 10.0% 20.0% 30.0% 40.0% 50.0% 60.0% 70.0%
Alex
QNBA
AAIB
CAE
HSBC
CIB
GROSS LOANS/DEPOSITS
43.4%
36.2%
31.5%
25.8%
25.3%
17.7%
0.0% 10.0% 20.0% 30.0% 40.0% 50.0%
HSBC
CAE
CIB
QNBA
Alex
AAIB
ROAE
4.60%
3.50%
2.74%
2.69%
2.53%
2.15%
0.00% 1.00% 2.00% 3.00% 4.00% 5.00%
HSBC
CAE
Alex
CIB
QNBA
AAIB
ROAA
12.5%
12.2%
11.6%
10.9%
10.7%
9.0% 10.0% 11.0% 12.0% 13.0%
Alex
HSBC
CAE
QNBA
CIB
CAR
46.4%
30.1%
21.8%
21.4%
20.9%
19.9%
0.0% 10.0% 20.0% 30.0% 40.0% 50.0%
Alex
CAE
HSBC
CIB
QNBA
AAIB
COST/INCOME
Peer Analysis figures as of December 2016 AAIB figures excluding the devaluation effect
7.2% 7.4%
7.8% 8.1% 8.4%
4.9% 5.1%
5.5% 5.7% 5.8%
4.3% 3.7% 3.5%
2.7% 2.6% 3.5%
3.5% 4.1% 4.3%
2.4% 3.1% 2.6% 2.3%
2.0% 1.9% 2.1% 1.9%
1.7% 1.4% 1.4%
0%
2%
4%
6%
8%
10%
Dec-12 Dec-13 Dec-14 Dec-15 Dec-16
Deposits Market Share
CIB QNBA HSBC AAIB Alex CAE
8.6% 8.3% 8.5% 8.0%
7.6% 7.4% 7.7% 8.0% 8.1% 7.5%
4.4% 4.6% 5.1%
4.9%
3.0% 4.3% 4.1% 3.7%
3.4%
2.5%
3.9% 3.6% 3.3%
2.8% 2.4%
2.6% 2.3% 2.1% 1.9% 1.5%
0%
2%
4%
6%
8%
10%
Dec-12 Dec-13 Dec-14 Dec-15 Dec-16
Loans Market Share
CIB QNBA AAIB ALEX HSBC CAE

27
Overview About CIB Financial Review Conclusion
Market Share
8.45% 8.52% 8.58% 8.52% 8.32% 8.25% 8.28% 8.27%
8.43% 8.45% 8.54% 8.57% 8.35%
8.18% 7.95% 7.90%
7.20% 7.03%
7.56%
7.48% 7.48% 7.23%
7.51% 7.67% 7.65%
7.37% 7.56%
7.75% 7.91% 7.84%
8.18% 8.22% 8.37%
8.12% 8.45%
7.99%
8.09% 8.40%
5.00%
6.00%
7.00%
8.00%
9.00%
10.00%
Jun-12 Sep-12 Dec-12 Mar-13 Jun-13 Sep-13 Dec-13 Mar-14 Jun-14 Sep-14 Dec-14 Mar-15 Jun-15 Sep-15 Dec-15 Mar-16 Jun-16 Sep-16 Dec-16
Total Loans Total Deposits
MARKET SHARE AS OF DEC-16
Total Loans 7.56%
LCY Loans 5.86%
FCY Loans 9.75%
Household Loans 6.89%
Institutional Loans 7.70%
MARKET SHARE AS OF DEC-16
Total Deposits 8.40%
LCY Deposits 6.92%
FCY Deposits 11.68%
Household Loans 7.96%
Institutional 9.10%
Latest available published ratios

28
Overview About CIB Financial Review Conclusion
Why CIB?
PROFITABILITY
NPAT EGP 2bn
Total revenues EGP 3bn
Asset Quality
NPL/Gross loans 7%*
Direct Coverage Ratio 147%*
LIQUIDITY
High liquidity
Gross LDR 41.5%
KPIs
ROAA 2.57%
ROAE 31.94%
Cost/income 21.90%
LARGEST IN
Total Assets EGP 273bn
Deposits EGP 240bn
Market Cap EGP 88.3bn in
private banks**
* Ratio on a standalone basis **Market cap as of 9/5/2017 Figures on a consolidated basis unless otherwise stated
Extremely skilled and experienced Management Team
Highly qualified Board of Directors
Strong brand equity in the market
Conservative provisioning policies
Prudent credit policies
Among the best Investor Relations teams

29
Overview About CIB Financial Review Conclusion
Thank You!
For more information, please visit our website; www.cibeg.com
To read about the projects that the CIB Foundation has helped support, and to know ways in which you can donate, please visit www.cibfoundationegypt.org
Investor Relations contacts:
Sherif Khalil Yasmine Hemeda Nelly El Zeneiny
Head of IR IR Officer IR Officer
[email protected] [email protected] [email protected]
Headquarters:
Nile Tower Building
21/23 Charles De Gaulle St., Giza
P.O Box 2430 Cairo
Egypt
Customer Service Hotline: 19666
24/7 dedicated customer service short number