Embed Size (px)
Citation preview


UNITED STATES
SECURITIES AND EXCHANGE COMMISSION
Washington, D.C. 20549
FORM 10-K (Mark One) [X] Annual Report pursuant to Section 13 or 15(d) of the Securities Exchange Act of 1934
For the fiscal year ended December 26, 2010
or
[ ] Transition report pursuant to Section 13 or 15(d) of the Securities Exchange Act of 1934
For the transition period from _____________________ to _______________________
Commission File Number: 0-21660
PAPA JOHN’S INTERNATIONAL, INC. (Exact name of registrant as specified in its charter)
Delaware 61-1203323
(State or other jurisdiction of (I.R.S. Employer incorporation or organization) Identification No.)
2002 Papa Johns Boulevard
Louisville, Kentucky 40299-2367
(Address of principal executive offices) (Zip Code)
(502) 261-7272
(Registrant's telephone number, including area code)
Securities registered pursuant to Section 12(b) of the Act: (Title of Each Class) (Name of each exchange on which registered)
Common Stock, $.01 par value The NASDAQ Stock Market LLC
Securities registered pursuant to Section 12(g) of the Act: None
Indicate by check mark if the registrant is a well-known seasoned issuer, as defined in Rule 405 of the
Securities Act. Yes [X] No [ ] Indicate by check mark if the registrant is not required to file reports pursuant to Section 13 or Section 15(d) of
the Act. Yes [ ] No [X]
Indicate by check mark whether the Registrant (1) has filed all reports required to be filed by Section 13 or 15(d) of the Securities Exchange Act of 1934 during the preceding 12 months (or for such shorter period that the registrant was required to file such reports), and (2) has been subject to such filing requirements for the past 90 days. Yes [X] No [ ]
Indicate by check mark whether the registrant has submitted electronically and posted on its corporate Website, if any, every Interactive Data File required to be submitted and posted pursuant to Rule 405 of Regulation S-T (§232.405 of this chapter) during the preceding 12 months (or for such shorter period that the registrant was required to submit and post such files). Yes [X] No [ ]
Indicate by check mark if disclosure of delinquent filers pursuant to Item 405 of Regulation S-K (§229.405 of this chapter) is not contained herein, and will not be contained, to the best of registrant’s knowledge, in definitive proxy or information statements incorporated by reference in Part III of this Form 10-K or any amendment to this Form 10-K. [X]
Indicate by check mark whether the registrant is a large accelerated filer, an accelerated filer, a non-accelerated filer or a smaller reporting company. See the definitions of “large accelerated filer,” “accelerated filer” and “smaller reporting company” in Rule 12b-2 of the Exchange Act.
Large accelerated filer [X] Accelerated filer [ ] Non-accelerated filer [ ] Smaller reporting company [ ]
Indicate by check mark whether the registrant is a shell company (as defined in Rule 12b-2 of the Act). Yes [ ] No [X]
The aggregate market value of the common stock held by non-affiliates of the Registrant, computed by reference to the closing sale price on The NASDAQ Stock Market as of the last business day of the Registrant’s most recently completed second fiscal quarter, June 27, 2010, was approximately $500,242,651.
As of February 15, 2011, there were 25,664,898 shares of the Registrant’s Common Stock outstanding.
DOCUMENTS INCORPORATED BY REFERENCE
Portions of Part III are incorporated by reference to the Registrant’s Proxy Statement for the Annual Meeting of Stockholders to be held April 28, 2011.
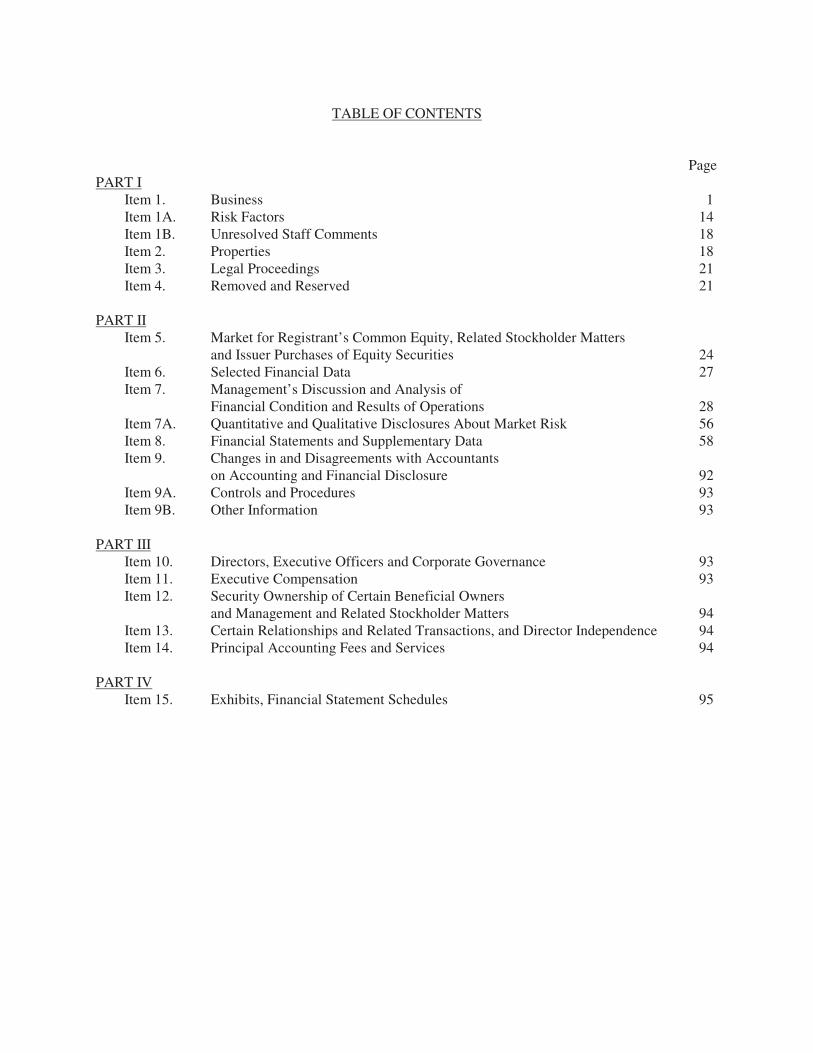
TABLE OF CONTENTS Page PART I Item 1. Business 1 Item 1A. Risk Factors 14 Item 1B. Unresolved Staff Comments 18 Item 2. Properties 18 Item 3. Legal Proceedings 21 Item 4. Removed and Reserved 21 PART II Item 5. Market for Registrant’s Common Equity, Related Stockholder Matters and Issuer Purchases of Equity Securities 24 Item 6. Selected Financial Data 27 Item 7. Management’s Discussion and Analysis of Financial Condition and Results of Operations 28 Item 7A. Quantitative and Qualitative Disclosures About Market Risk 56 Item 8. Financial Statements and Supplementary Data 58 Item 9. Changes in and Disagreements with Accountants
on Accounting and Financial Disclosure 92 Item 9A. Controls and Procedures 93 Item 9B. Other Information 93
PART III Item 10. Directors, Executive Officers and Corporate Governance 93 Item 11. Executive Compensation 93 Item 12. Security Ownership of Certain Beneficial Owners and Management and Related Stockholder Matters 94 Item 13. Certain Relationships and Related Transactions, and Director Independence 94 Item 14. Principal Accounting Fees and Services 94 PART IV Item 15. Exhibits, Financial Statement Schedules 95
1
PART I
Item 1. Business
General
Papa John’s International, Inc. (referred to as the “Company”, “Papa John’s” or in the first person notations of “we”, “us” and “our”) operates and franchises pizza delivery and carryout restaurants and, in certain international markets, dine-in and restaurant-based delivery restaurants under the trademark “Papa John’s”. The first Company-owned Papa John’s restaurant opened in 1985 and the first franchised restaurant opened in 1986. At December 26, 2010, there were 3,646 Papa John’s restaurants in operation, consisting of 612 Company-owned and 3,034 franchised restaurants operating domestically in all 50 states, the District of Columbia and Puerto Rico and in 32 countries. Papa John’s has defined six reportable segments: domestic restaurants, domestic commissaries (Quality Control Centers), domestic franchising, international operations, variable interest entities and “all other” business units. See “Management’s Discussion and Analysis of Financial Condition and Results of Operations” and “Note 19” of “Notes to Consolidated Financial Statements” for financial information about these segments for the fiscal years ended December 26, 2010, December 27, 2009 and December 28, 2008. All of our periodic and current reports filed with the Securities and Exchange Commission (“SEC”) pursuant to Section 13(a) or 15(d) of the Securities and Exchange Act of 1934, as amended, are available, free of charge, through our website located at www.papajohns.com, including our Annual Report on Form 10-K, quarterly reports on Form 10-Q, current reports on Form 8-K and any amendments to those reports. Those documents are available through our website as soon as reasonably practicable after we electronically file them with the SEC. We also make available free of charge on our website our Corporate Governance Guidelines; Board Committee Charters; and our Code of Ethics, which applies to Papa John's directors, officers and employees. Printed copies of such documents are also available free of charge upon written request to Investor Relations, Papa John’s International, Inc., P.O. Box 99900, Louisville, KY 40269-0900. You may read and copy any materials filed with the SEC at the SEC’s Public Reference Room at 100 F Street, NE, Washington, DC 20549. You may obtain information on the operation of the Public Reference Room by calling the SEC at 1-800-SEC-0330. This information is also available at www.sec.gov. The references to these website addresses do not constitute incorporation by reference of the information contained on the websites, which should not be considered part of this document.
Strategy Our goal is to build the strongest brand loyalty of all pizza restaurants. The key elements of our strategy include: Menu. Domestic Papa John’s restaurants offer a menu of high-quality pizza along with side items, including breadsticks, cheesesticks, chicken strips and wings, dessert items and canned or bottled beverages. Papa John’s traditional crust pizza is prepared using fresh dough (never frozen). Papa John’s pizzas are made from a proprietary blend of wheat flour, cheese made from 100% real mozzarella, fresh-packed pizza sauce made from vine-ripened tomatoes (not from concentrate) and a proprietary mix of savory spices, and a choice of high-quality meat (100% beef, pork and chicken with no fillers) and vegetable toppings. Domestically, all ingredients and toppings can be purchased from our Quality Control Center (“QC Center”) system, which delivers to individual restaurants twice weekly.
2
Internationally, the menu may be more diverse than in our domestic operations to meet local tastes and customs. In addition to our fresh dough traditional crust pizza, we offer a thin crust pizza, which is a par-baked product produced by a third-party vendor. Our traditional crust pizza offers a container of our special garlic sauce and a pepperoncini pepper. Each thin crust pizza is served with a packet of special seasonings and a pepperoncini pepper. We continue to test new product offerings both domestically and internationally. The new products can become a part of the permanent menu if they meet certain established guidelines.
Efficient Operating System. We believe our operating and distribution systems, restaurant layout and designated delivery areas result in lower restaurant operating costs and improved food quality, and promote superior customer service. Our QC Center system takes advantage of volume purchasing of food and supplies, and provides consistency and efficiencies of scale in fresh dough production. This eliminates the need for each restaurant to order food from multiple vendors and commit substantial labor and other resources to dough preparation.
Commitment to Team Member Training and Development. We are committed to the development and motivation of our team members through training programs, incentive compensation and opportunities for advancement. Team member training programs are conducted for corporate team members, and offered to our franchisees at training locations across the United States and internationally. We offer performance-based financial incentives to corporate and restaurant team members at various levels. Marketing. Our marketing strategy consists of both national and local components. Our domestic national strategy includes national advertising on television, through print, direct mail and online. Ten national television campaigns aired in 2010. Our online marketing activities have increased significantly over the past few years in response to increasing consumer use of online and mobile web technology. Our local restaurant-level marketing programs target consumers within the delivery area of each restaurant through the use of local TV, print materials, targeted direct mail, store-to-door flyers, email marketing, text messages and local social media. Local marketing efforts also include a variety of community-oriented activities within schools, sports venues and other organizations supported with some of the same advertising vehicles mentioned above. In international markets, we target customers who live or work within a small radius of a Papa John’s restaurant. Certain markets can effectively use television and radio as part of their marketing strategies. The majority of the marketing efforts include using print materials such as flyers, newspaper inserts and in-store marketing materials. Local marketing efforts, such as sponsoring or participating in community events, sporting events and school programs, are also used to build customer awareness. Franchise System. We are committed to maintaining and developing a strong franchise system by attracting experienced operators, supporting them to expand and grow their business and monitoring their compliance with our high standards. We seek to attract franchisees with experience in restaurant or retail operations and with the financial resources and management capability to open single or multiple locations. To ensure consistent food quality, each domestic franchisee is required to purchase dough and tomato sauce from our QC Centers and to purchase all other supplies from our QC Centers or approved suppliers. QC Centers outside the U.S. may be operated by franchisees pursuant to license agreements or by other third parties. We devote significant resources to provide Papa John’s franchisees with assistance in restaurant operations, management training, team member training, marketing, site selection and

3
restaurant design. We also provide significant assistance to licensed international QC Centers in sourcing approved high-quality suppliers located in-country or approved regional suppliers to the extent possible. International Operations. As of December 26, 2010, we had 775 Papa John's restaurants operating in 32 countries, Puerto Rico, Hawaii, and Alaska (Hawaii and Alaska units were included in our international operations for reporting purposes through December 26, 2010. See below for our realignment beginning in 2011). Substantially all of the Papa John's international units are franchised operations (we own and operate 21 restaurants in Beijing/North China). During 2010 and 2009 we opened 87 and 100 international net new units (new unit openings less unit closings), respectively. We plan to continue to grow our international franchise units during the next several years. Our total international development pipeline as of December 26, 2010 included approximately 1,200 restaurants with approximately 40% scheduled to open in the next three years. Beginning in our fiscal 2011, we realigned management responsibility for Hawaii, Alaska and Canada from international to domestic operations in order to better leverage existing infrastructure and systems. Hawaii, Alaska and Canada consist solely of franchise operations, and the realigned reporting segment will be referred to as North America Franchising. This realignment will initially be reflected in our financial information beginning in the first quarter 2011 earnings release and Form 10-Q. Prior year financial results, including segment reporting, will be reclassified at that time to be presented consistently with the new alignment. The realignment will shift $1.3 million of operating income from the International reporting segment to the North America Franchising reporting segment for 2010 and 2009 and approximately $1.0 million for 2008.
Unit Sales and Investment Costs In 2010, the 578 domestic Company-owned restaurants included in the full year’s comparable restaurant base generated average sales of $863,000. Domestic franchise sales on average are lower than Company-owned restaurants as a higher percentage of our Company-owned restaurants are located in more heavily penetrated markets. The average cash investment for the five domestic Company-owned restaurants opened during the 2010 fiscal year, exclusive of land, was approximately $250,000 per unit, excluding tenant allowances that we received. We expect the average cash investment for the eight domestic Company-owned restaurants expected to open in 2011 to approximate $240,000 per unit. Substantially all domestic restaurants do not offer dine-in areas, which reduces our restaurant capital investment.
Development
A total of 325 Papa John’s restaurants were opened during 2010, consisting of 13 Company-owned (five domestic and eight international) and 312 franchised restaurants (169 domestic and 143 international), while 148 Papa John’s restaurants closed during 2010, consisting of four Company-owned restaurants (two domestic and two international) and 144 franchised restaurants (82 domestic and 62 international). The 82 domestic franchise closings included the closure of 13 non-traditional event-based units, which had a minimal net financial impact to the Company, in connection with the termination of a sponsorship agreement. The international franchise closings included the closure of all 25 units in Saudi Arabia in connection with a franchisee restructuring. The closing of these units also had minimal net financial impact to the Company due to their low sales volumes. A 75-unit development agreement was signed as part of the restructuring in Saudi Arabia, and new unit development is expected to begin in 2011. During 2011, we expect net unit growth of approximately 190 to 220 units. We expect to open 13 to 15 Company-owned restaurants (seven to eight domestic and six to seven international) and 297 to 325

4
franchised restaurants (154 to 168 domestic and 143 to 157 international). We also expect approximately 120 restaurants to close during 2011, the majority of which are expected to be domestic franchised units. Domestic and international franchised unit expansion is expected to continue with an emphasis on markets in the Americas, the United Kingdom, the Middle East and Asia. We expect our expansion in Asia to include a significant focus in China. Our Company-owned expansion strategy is to continue to open domestic restaurants in existing markets as appropriate, although most of our Company-owned markets are well penetrated, thereby increasing consumer awareness and enabling us to take advantage of operational and marketing efficiencies. Our experience in developing markets indicates that market penetration through the opening of multiple restaurants in a particular market results in increased average restaurant sales in that market over time. We have co-developed domestic markets with some franchisees or divided markets among franchisees, and will continue to utilize market co-development in the future, where appropriate. Of the total 2,871 domestic units open as of December 26, 2010, 591 or 21% were Company-owned (including 127 units owned in joint venture arrangements with franchisees in which the Company has a majority ownership position). The Company expects the percentage of domestic Company-owned units to decline over the next several years, because future net openings will be more heavily weighted toward franchise units.
Restaurant Design and Site Selection Backlit awnings, neon window designs and other visible signage characterize the exterior of most Papa John’s restaurants. A typical inline or endcap domestic Papa John’s restaurant averages 1,100 to 1,500 square feet. Papa John’s restaurants are designed to facilitate a smooth flow of food orders through the restaurant. The layout includes specific areas for order taking, pizza preparation and routing, resulting in simplified operations, lower training and labor costs, increased efficiency and improved consistency and quality of food products. The typical interior of a Papa John’s restaurant has a vibrant color scheme, and includes a bright menu board, custom counters and a customer carryout area. The counters are designed to allow customers to watch the team members slap out the dough and put sauce and toppings on pizzas. A substantial majority of domestic restaurants are required to have an approved lobby enhancement re-design package installed by the end of 2011. The estimated cost of the new package ranges from $15,000 to $20,000 for each restaurant. Approximately 400 Company-owned units will be required to install the new design package during 2011. Most of our international Papa John’s restaurants are between 900 and 1,400 square feet; however, in order to meet certain local customer preferences, many international restaurants have been opened in larger spaces to accommodate both dine-in and restaurant-based delivery service, typically with 35 to 100 seats. We expect the substantial majority of our future international openings to focus on delivery and carryout units with limited seating. We define a “traditional” domestic Papa John’s restaurant as a delivery and carryout unit that services a defined trade area. We consider the location of a traditional restaurant to be important and therefore devote significant resources to the investigation and evaluation of potential sites. The site selection process includes a review of trade area demographics, target population density and competitive factors. A member of our development team inspects each potential domestic Company-owned restaurant location and substantially all franchised restaurant locations and the surrounding market before a site is approved. Our restaurants are typically located in strip shopping centers or freestanding buildings that provide visibility, curb appeal and accessibility. Our restaurant design can be configured to fit a wide variety of building shapes and sizes, which increases the number of suitable locations for our restaurants.
5
“Non-traditional” Papa John’s restaurants do not generally provide delivery to a defined trade area but rather serve a captive customer group on a continuous operation or an event-driven service (e.g., university food service, stadiums, entertainment venues, military bases, airports, etc.). Non-traditional units are designed to fit the unique requirements of the venue. We provide layout and design services and recommendations for subcontractors, signage installers and telephone systems to Papa John’s franchisees. Our franchisees can purchase complete new store equipment packages through an approved third-party supplier. In addition, we sell replacement smallwares and related items to our franchisees.
QC Center System; Strategic Supply Chain Management
Our domestic QC Centers, comprised of nine full-service regional production and distribution centers and one distribution-only center, supply pizza dough, food products, paper products, smallwares and cleaning supplies twice weekly to each restaurant. This system enables us to monitor and control product quality and consistency, while lowering food and other costs. Our full-service QC Centers are located in Louisville, Kentucky; Dallas, Texas; Pittsburgh, Pennsylvania; Orlando, Florida; Raleigh, North Carolina; Denver, Colorado; Portland, Oregon; Des Moines, Iowa; and Phoenix, Arizona. We also operate a distribution-only center in Cranbury, New Jersey. The primary difference between a full-service QC Center and a distribution-only center is that full-service QC Centers produce fresh pizza dough in addition to providing other food and paper products used in our restaurants. The QC Center system capacity is continually evaluated in relation to planned restaurant growth, and facilities are developed or upgraded as operational or economic conditions warrant. We consider the current domestic QC Center system capacity sufficient to accommodate domestic restaurant development for the next several years without significant additional capital requirements. We own full-service QC Centers in the United Kingdom; Mexico City, Mexico; and Beijing, China. Other international full-service QC Centers are licensed to franchisees and non-franchisee third parties, and are generally located in the markets where our franchisees have restaurants. We expect future international QC Centers to be licensed to franchisees or non-franchisee third parties; however, we may open Company-owned QC Centers at our discretion. We also have the right to acquire licensed QC Centers from our international licensees in certain circumstances. We set quality standards for all products used in our restaurants and designate approved outside suppliers of food and paper products that meet our quality standards. In order to ensure product quality and consistency, all domestic Papa John’s restaurants are required to purchase tomato sauce and dough from our QC Centers. Franchisees may purchase other goods directly from our QC Centers or approved suppliers. National purchasing agreements with most of our suppliers generally result in volume discounts to us, allowing us to sell products to our restaurants at prices we believe are below those generally available in the marketplace. Within our domestic QC Center system, products are distributed to restaurants by refrigerated trucks leased and operated by us or transported by a dedicated logistics company. PJ Food Service, Inc. (“PJFS”), our wholly-owned subsidiary that operates our domestic Company-owned QC Centers, had a purchasing agreement with BIBP Commodities, Inc. (“BIBP”), a third-party entity formed by franchisees for the sole purpose of reducing cheese price volatility to domestic system-wide restaurants through fiscal 2010. Under this agreement, PJFS purchased cheese from BIBP on a monthly basis at the projected spot market price, plus a certain adjustment based on BIBP’s cumulative financial position. Gains and losses incurred by BIBP were passed on to PJFS and therefore to Company-owned and franchised restaurants through adjustments to the selling price. Over time, PJFS purchased cheese at a price approximating the actual average market price, but with more short-term predictability.
6
See “Franchise Program – Franchise Support Initiatives” for the change in our purchasing agreement for cheese beginning in fiscal 2011. See also “Management’s Discussion and Analysis of Financial Condition and Results of Operations – Consolidation of BIBP Commodities, Inc. (“BIBP”) as a Variable Interest Entity” and “Note 3” of “Notes to Consolidated Financial Statements” for additional information concerning BIBP and the related financial statement treatment of BIBP’s results.
Marketing Programs
All domestic Company-owned and franchised Papa John’s restaurants within a defined market are required to join an area advertising cooperative (“Co-op”). Each member restaurant contributes a percentage of sales to the Co-op for market-wide programs, such as radio, television and print advertising. The rate of contribution and uses of the monies collected are determined by a majority vote of the Co-op’s members. Prior to 2011, the contribution rate could not be below 2.0% without approval from Papa John’s. For the period 2011 to 2013, the contribution rate cannot be below 1.5% without approval from Papa John’s. The restaurant-level and Co-op marketing efforts are supported by print, digital and electronic advertising materials that are produced by Papa John’s Marketing Fund, Inc., a non-profit corporation (the “Marketing Fund”). The Marketing Fund produces and buys air time for Papa John’s national television commercials, buys digital media such as banner advertising, paid search-engine advertising and email, in addition to other brand-building activities, such as consumer research and public relations activities. All domestic Company-owned and franchised Papa John’s restaurants are required to contribute a certain minimum percentage of sales to the Marketing Fund. The contribution rate to the Marketing Fund can be increased above the required minimum contribution rate if approved by the governing board of the Marketing Fund up to certain levels, and beyond those levels if approved by a supermajority of domestic restaurants. The contribution percentage averaged 3.05% in 2010. The rate was 2.82% for the last nine months of 2009, which increased from 2.7% effective for the first quarter of 2009 and for full-year 2008. The contribution percentage to the Marketing Fund is currently set at 4.0% for 2011. Restaurant-level marketing programs target the delivery area of each restaurant, making extensive use of targeted print materials including direct mail and store-to-door coupons. The local marketing efforts also include a variety of community-oriented activities with schools, sports teams and other organizations. In markets in which Papa John’s has a significant presence, local marketing efforts are supplemented with local radio and television advertising. We provide both Company-owned and franchised restaurants with pre-approved marketing materials and with catalogs for the purchase of uniforms and promotional items. We also provide direct marketing services to Company-owned and franchised restaurants using customer information gathered by our proprietary point-of-sale technology (see “Company Operations – Point of Sale Technology”). In addition, we provide database tools and automated training that allows operators to set their own local email marketing, text messaging and social media. During the fourth quarter of 2010 we launched a redesigned website and digital ordering platform. Our domestic online ordering sales currently exceed 28% of our total sales and we expect to increase our online sales with the redesigned platform, which includes “plan ahead ordering” and Spanish-language ordering capability. In addition, the new platform enhances mobile web ordering for our customers, as well as allowing ordering from a new Papa John's iPhone® application. We receive a percentage-based fee from domestic franchisees for online sales, in addition to royalties, to cover the cost of this service, although the aggregate fees collected in 2010 were not sufficient to cover these costs due primarily to incremental costs associated with the development of this new platform. We have agreed to reduce the fee in 2011 and cap the fee in 2012 and 2013, which is expected to result in additional losses related to

7
the online/digital ordering platform. While the Company has the right to recoup these losses over time, there is no assurance that such losses will be recouped. During 2010, we also implemented an online loyalty point program that we believe will increase consumer use of our online/digital ordering platform. We offer our customers the opportunity to purchase a reloadable gift card marketed as the “Papa Card,” in any denomination from $10 to $100. We also offer Papa Cards for sale to consumers through third-party outlets and continue to explore other Papa Card distribution opportunities. The Papa Card may be redeemed for delivery, carryout, online and mobile web orders and is accepted at substantially all Papa John’s traditional domestic restaurants.
Company Operations
Restaurant Personnel. A typical Papa John’s Company-owned domestic restaurant employs a restaurant manager and approximately 20 to 25 hourly team members, most of whom work part-time. The manager is responsible for the day-to-day operation of the restaurant and maintaining Company-established operating standards. We seek to hire experienced restaurant managers and staff, provide comprehensive training on operations and managerial skills, and motivate and retain personnel by providing opportunities for advancement and performance-based financial incentives. We also employ directors of operations who are responsible for overseeing an average of seven Company-owned restaurants. The directors of operations report to operations vice presidents, who are each responsible for the management of approximately 100 Company-owned restaurants in specific geographic regions. Effective in late 2010, the operations vice presidents began reporting directly to the Senior Vice President, Operations and Global Operations Support and Training. These team members are eligible to earn performance-based financial incentives. Training and Education. The Operations Support and Training (“OST”) department is responsible for creating tools and materials for the training and development of both corporate and franchise team members. With these tools and materials, our field-based trainers train and certify training general managers in all markets. Operations personnel complete our management training program and ongoing development programs, including multi-unit training, in which instruction is given on all aspects of our systems and operations. The program includes hands-on training at an operating Papa John’s restaurant by a Company-certified training general manager. Our training includes new team member orientation, in-store and delivery training, core management skills training and new product or program implementation. Our ongoing developmental workshops include operating partner training, advanced operator training and senior operator training. We provide on-site training and operating support before, during and after the opening of all Company-owned restaurants and for the first two restaurants per franchise group, with additional support available upon request. Point of Sale Technology. Point of sale technology (“POS”), our proprietary PROFIT SystemTM, is in place in all domestic traditional Papa John’s restaurants. We believe this technology facilitates faster and more accurate order-taking and pricing, reduces paperwork and allows the restaurant manager to better monitor and control food and labor costs, including facilitation of managing food inventory and placing orders from the domestic QC Centers. We believe the PROFIT System enhances restaurant-level marketing capabilities through the development of a database containing information on customers and their buying habits with respect to our products. Polling capabilities allow us to obtain restaurant operating information, thereby improving the speed, accuracy and efficiency of restaurant-level reporting. The PROFIT System is also closely integrated with our online ordering system in all domestic
8
traditional Papa John’s restaurants, enabling Papa John’s to offer nationwide online and mobile web ordering to our customers. Joint Ventures. We operate 127 Company-owned restaurants under two joint venture arrangements. Under the first arrangement, we own 70% of an entity operating 52 Papa John’s restaurants located in Virginia and Maryland. Under the second arrangement, we own 51% of an entity operating 75 Papa John’s restaurants located in Texas. We will continue to evaluate further joint venture arrangements on an individual basis as opportunities arise.
Hours of Operation. Our domestic restaurants are open seven days a week, typically from 11:00 a.m. to 12:30 a.m. Monday through Thursday, 11:00 a.m. to 1:30 a.m. on Friday and Saturday and 12:00 noon to 11:30 p.m. on Sunday. Carryout hours are generally more limited for late night, for security purposes.
International Operations
The international reporting segment operations structure consists of international business managers responsible for supporting one or more franchisees. The international business managers report to one of three regional vice presidents who report to the Senior Vice President, International. Various support functions for the International business such as marketing, supply chain, research and development and quality assurance, are managed centrally as global functions, with regional field support personnel as appropriate. The Company owns and operates restaurants in Beijing/North China (21 units at December 26, 2010) and has a local management structure in place to support those operations.
Franchise Program
General. We continue to attract franchisees with significant restaurant and retail experience. We consider our franchisees to be a vital part of our system’s continued growth and believe our relationship with our franchisees is good. As of December 26, 2010, there were 3,034 franchised Papa John’s restaurants operating in all 50 states, the District of Columbia, Puerto Rico and 32 countries. As of December 26, 2010, we have development agreements with our franchisees for more than 300 additional domestic franchised restaurants, the majority of which are committed to open over the next five years, and agreements for approximately 1,200 additional international franchised restaurants, the majority of which are scheduled to open over the next eight years. There can be no assurance that all of these restaurants will be opened or that the development schedule set forth in the development agreements will be achieved. During 2010, 312 (169 domestic and 143 international) franchised Papa John’s restaurants were opened. Approval. Franchisees are approved on the basis of the applicant’s business background, restaurant operating experience and financial resources. We seek franchisees to enter into development agreements for single or multiple restaurants. We require each franchisee to complete our training program or to hire a full-time operator who completes the training and has either an equity interest or the right to acquire an equity interest in the franchise operation. Outside the United States, we will allow an approved bonus plan to substitute for the equity interest. Domestic Development and Franchise Agreements. We enter into development agreements with our domestic franchisees for the opening of a specified number of restaurants within a defined period of time and specified geographic area. Substantially all existing franchise agreements have an initial 10-year term with a 10-year renewal option. We have the right to terminate a franchise agreement for a variety of reasons, including a franchisee’s failure to make payments when due or failure to adhere to our policies and standards. Many state franchise laws limit the ability of a franchisor to terminate or refuse to renew a franchise.
9
Under our standard domestic development agreement, the franchisee is required to pay, at the time of signing the agreement, a non-refundable fee of $25,000 for the first restaurant and $5,000 for any additional restaurants. The non-refundable fee is credited against the standard $25,000 franchise fee payable to us upon signing the franchise agreement for a specific location. Generally, a franchise agreement is executed when a franchisee secures a location. Our current standard development agreement requires the franchisee to pay a royalty fee of 5% of sales and the majority of our existing franchised restaurants also have a 5% royalty rate effective December 27, 2010. Domestic Franchise Development Incentives. In 2009 and 2010 we provided development incentives to domestic restaurants. Such incentives included the waiver of the $25,000 franchise fee and reduced royalties for 12 months following the opening date (2009 included a waiver of 100% of the standard royalty rate and 2010 included a waiver of 40% to 100% of the standard royalty rate depending on the opening date). Additionally, under the 2009 program, a $10,000 cash incentive was paid to franchisees opening a restaurant on or before the scheduled opening date. The program was expanded in 2010 to offer either the $10,000 cash incentive or a 24-month no-payment lease on two ovens with the option to purchase the ovens for $50 per oven at the end of the 24-month lease. The 2011 incentive program for traditional unit openings includes: (1) no franchise fee, (2) the waiver of the 5% royalty fee - waived for twelve months from opening if opened January through June, for nine months from opening if opened July through September and for six months from opening if opened October through December, (3) a 24-month no-payment lease on two ovens with the option to purchase the ovens for $50 per oven at the end of the 24-month lease, and (3) a $3,300 credit to be applied toward a future POS purchase, under certain circumstances. We believe the development incentive programs have increased unit openings in 2009 and 2010, and expect they will continue to do so in 2011. See Franchise Support Initiatives for additional information. Franchise Support Initiatives. During 2009 and 2010, the Company provided domestic franchise system support initiatives in response to the difficult economic environment. The initiatives included:
• Providing cheese cost relief by modifying the cheese pricing formula used by BIBP beginning in 2009;
• Providing food cost relief by lowering the commissary margin on certain commodities sold by PJFS to the franchise system and by providing incentive rebate opportunities in 2010 to the franchise system;
• Providing additional system-wide national marketing contributions that amounted to $6.0 million in 2010 and $7.7 million in 2009;
• Providing additional system-wide local print marketing contributions and certain system-wide incentives totaling $500,000 in 2010 and $1.9 million in 2009;
• Providing targeted royalty relief and local marketing support to assist certain identified franchisees or markets, which amounted to $5.1 million in 2010 and $4.7 million in 2009;
• Providing restaurant opening incentives of $1.0 million in 2010 and $400,000 in 2009; and
• Providing financing on a selected basis to assist new or existing franchisees with the acquisition of troubled franchise restaurants.
For 2011, we plan to continue certain domestic franchise support initiatives such as offering incentive programs to franchisees to increase comparable sales, comparable transactions and online sales, make certain re-image improvements to their restaurants and provide targeted royalty relief and local marketing support to assist certain identified franchisees or markets, although our expectation is that the amount of such support initiatives will be reduced from 2010 levels.
10
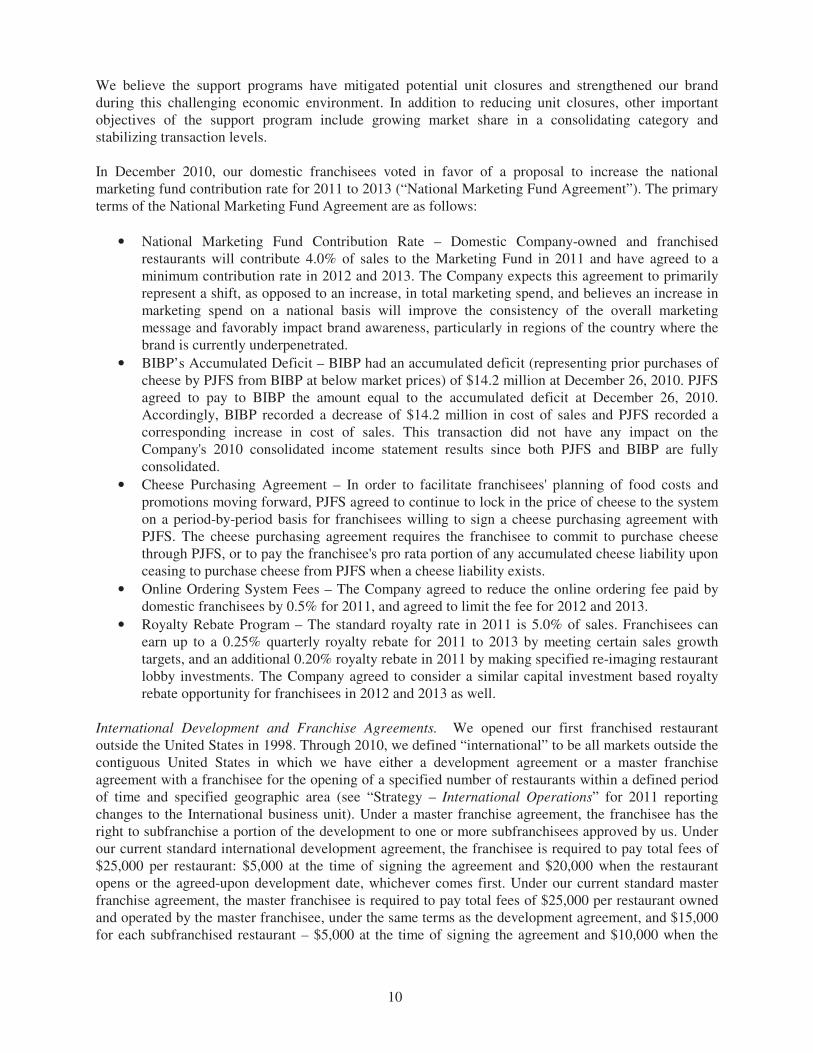
We believe the support programs have mitigated potential unit closures and strengthened our brand during this challenging economic environment. In addition to reducing unit closures, other important objectives of the support program include growing market share in a consolidating category and stabilizing transaction levels. In December 2010, our domestic franchisees voted in favor of a proposal to increase the national marketing fund contribution rate for 2011 to 2013 (“National Marketing Fund Agreement”). The primary terms of the National Marketing Fund Agreement are as follows:
• National Marketing Fund Contribution Rate – Domestic Company-owned and franchised restaurants will contribute 4.0% of sales to the Marketing Fund in 2011 and have agreed to a minimum contribution rate in 2012 and 2013. The Company expects this agreement to primarily represent a shift, as opposed to an increase, in total marketing spend, and believes an increase in marketing spend on a national basis will improve the consistency of the overall marketing message and favorably impact brand awareness, particularly in regions of the country where the brand is currently underpenetrated.
• BIBP’s Accumulated Deficit – BIBP had an accumulated deficit (representing prior purchases of cheese by PJFS from BIBP at below market prices) of $14.2 million at December 26, 2010. PJFS agreed to pay to BIBP the amount equal to the accumulated deficit at December 26, 2010. Accordingly, BIBP recorded a decrease of $14.2 million in cost of sales and PJFS recorded a corresponding increase in cost of sales. This transaction did not have any impact on the Company's 2010 consolidated income statement results since both PJFS and BIBP are fully consolidated.
• Cheese Purchasing Agreement – In order to facilitate franchisees' planning of food costs and promotions moving forward, PJFS agreed to continue to lock in the price of cheese to the system on a period-by-period basis for franchisees willing to sign a cheese purchasing agreement with PJFS. The cheese purchasing agreement requires the franchisee to commit to purchase cheese through PJFS, or to pay the franchisee's pro rata portion of any accumulated cheese liability upon ceasing to purchase cheese from PJFS when a cheese liability exists.
• Online Ordering System Fees – The Company agreed to reduce the online ordering fee paid by domestic franchisees by 0.5% for 2011, and agreed to limit the fee for 2012 and 2013.
• Royalty Rebate Program – The standard royalty rate in 2011 is 5.0% of sales. Franchisees can earn up to a 0.25% quarterly royalty rebate for 2011 to 2013 by meeting certain sales growth targets, and an additional 0.20% royalty rebate in 2011 by making specified re-imaging restaurant lobby investments. The Company agreed to consider a similar capital investment based royalty rebate opportunity for franchisees in 2012 and 2013 as well.
International Development and Franchise Agreements. We opened our first franchised restaurant outside the United States in 1998. Through 2010, we defined “international” to be all markets outside the contiguous United States in which we have either a development agreement or a master franchise agreement with a franchisee for the opening of a specified number of restaurants within a defined period of time and specified geographic area (see “Strategy – International Operations” for 2011 reporting changes to the International business unit). Under a master franchise agreement, the franchisee has the right to subfranchise a portion of the development to one or more subfranchisees approved by us. Under our current standard international development agreement, the franchisee is required to pay total fees of $25,000 per restaurant: $5,000 at the time of signing the agreement and $20,000 when the restaurant opens or the agreed-upon development date, whichever comes first. Under our current standard master franchise agreement, the master franchisee is required to pay total fees of $25,000 per restaurant owned and operated by the master franchisee, under the same terms as the development agreement, and $15,000 for each subfranchised restaurant – $5,000 at the time of signing the agreement and $10,000 when the

11
restaurant opens or the agreed-upon development date, whichever comes first. We expect that future development agreements may limit the amount of potential subfranchising. Our current standard international master franchise and development agreement provides for payment to us of a royalty fee of 5% of sales, with no provision for increase during the initial term. The remaining terms applicable to the operation of individual restaurants are substantially equivalent to the terms of our domestic franchise agreement. From time to time, development agreements will be negotiated at other-than-standard terms for fees and royalties. Non-traditional Restaurant Development. We have entered into a limited number of development and franchise agreements for non-traditional restaurants. These agreements generally cover venues or areas not originally targeted for traditional unit development and have terms differing from the standard agreement. While we expect to have a significant increase in the number of non-traditional units in the future, to date, these agreements have not had a significant, direct impact on our pre-tax earnings.
Franchise Restaurant Development. We provide assistance to Papa John’s franchisees in selecting sites, developing restaurants and evaluating the physical specifications for typical restaurants. Each franchisee is responsible for selecting the location for its restaurants but must obtain our approval of restaurant design and location based on accessibility and visibility of the site and targeted demographic factors, including population density, income, age and traffic. Our domestic and international franchisees may purchase complete new store equipment packages through an approved third-party supplier. Franchisee Loans. Selected franchisees have borrowed funds from our wholly-owned subsidiary, Capital Delivery, Ltd., principally for the purchase of restaurants from us or other franchisees or for use in the construction and development of new restaurants. Loans made to franchisees typically bear interest at fixed or floating rates and in most cases are secured by the fixtures, equipment and signage of the restaurant and/or are guaranteed by the franchisees’ owners. At December 26, 2010, net loans outstanding totaled $17.4 million, which were composed of loans to franchisees. See “Note 9” of “Notes to Consolidated Financial Statements” for additional information. Franchise Insurance Program. Our franchisees have the opportunity to purchase various insurance policies, such as health insurance, non-owned automobile and workers’ compensation, through our wholly-owned insurance agency, Risk Services Corp. (“Risk Services”). A third-party commercial insurance company provides fully-insured coverage to franchisees participating in the franchise insurance program offered by Risk Services. As of December 26, 2010, approximately 46% of domestic franchised restaurants had obtained insurance coverage through Risk Services. Franchise Training and Support. Our domestic field support structure consists of franchise business directors, each of whom is responsible for serving an average of approximately 100 franchised units. Our franchise business directors maintain open communication with the franchise community, relaying operating and marketing information and new initiatives between franchisees and us. Franchise business directors report to one of three regional division vice presidents, who report to the Senior Vice President, North American Operations. Every franchisee is required to have a principal operator approved by us who satisfactorily completes our required training program. Principal operators are required to devote his or her full business time and efforts to the operation of the franchisee’s restaurants. The full business time requirement is not mandatory for certain franchisees that operate only non-traditional restaurants; for example, a food service operator that operates a Papa John’s as part of a food court at a college or university. Each franchised restaurant manager is also required to complete our Company-certified management training program. Domestically, we provide an on-site training team three days before and three days after the
12
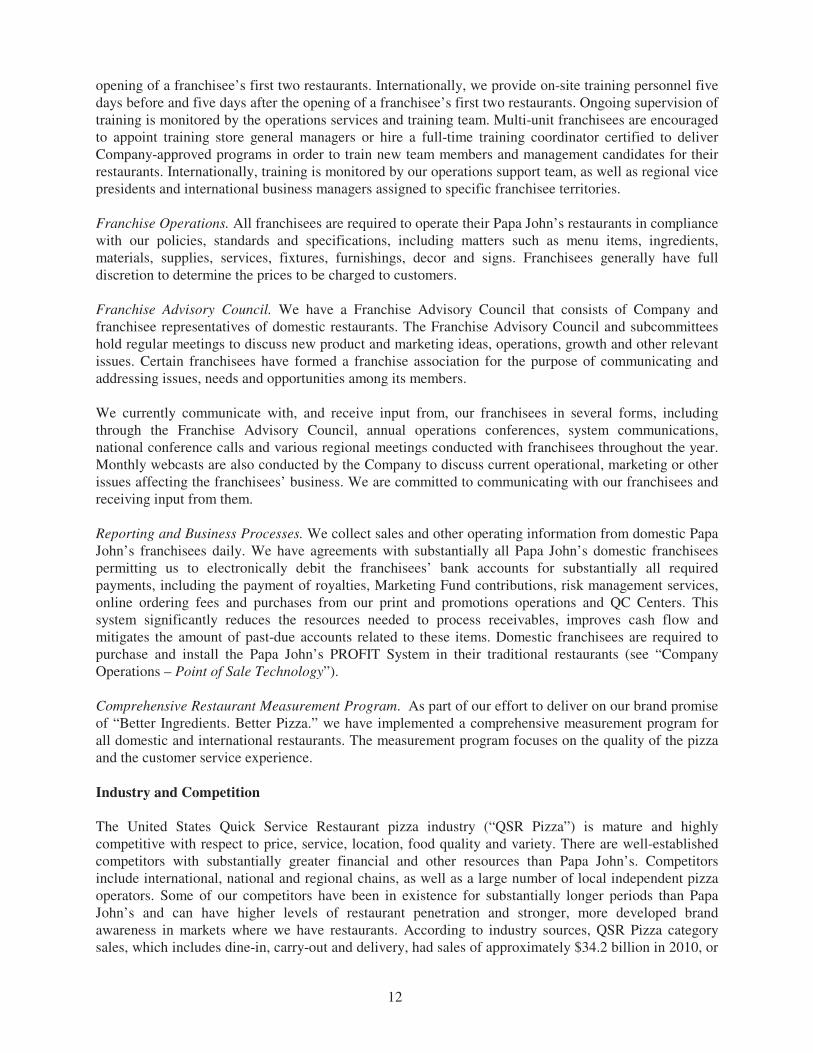
opening of a franchisee’s first two restaurants. Internationally, we provide on-site training personnel five days before and five days after the opening of a franchisee’s first two restaurants. Ongoing supervision of training is monitored by the operations services and training team. Multi-unit franchisees are encouraged to appoint training store general managers or hire a full-time training coordinator certified to deliver Company-approved programs in order to train new team members and management candidates for their restaurants. Internationally, training is monitored by our operations support team, as well as regional vice presidents and international business managers assigned to specific franchisee territories. Franchise Operations. All franchisees are required to operate their Papa John’s restaurants in compliance with our policies, standards and specifications, including matters such as menu items, ingredients, materials, supplies, services, fixtures, furnishings, decor and signs. Franchisees generally have full discretion to determine the prices to be charged to customers. Franchise Advisory Council. We have a Franchise Advisory Council that consists of Company and franchisee representatives of domestic restaurants. The Franchise Advisory Council and subcommittees hold regular meetings to discuss new product and marketing ideas, operations, growth and other relevant issues. Certain franchisees have formed a franchise association for the purpose of communicating and addressing issues, needs and opportunities among its members. We currently communicate with, and receive input from, our franchisees in several forms, including through the Franchise Advisory Council, annual operations conferences, system communications, national conference calls and various regional meetings conducted with franchisees throughout the year. Monthly webcasts are also conducted by the Company to discuss current operational, marketing or other issues affecting the franchisees’ business. We are committed to communicating with our franchisees and receiving input from them. Reporting and Business Processes. We collect sales and other operating information from domestic Papa John’s franchisees daily. We have agreements with substantially all Papa John’s domestic franchisees permitting us to electronically debit the franchisees’ bank accounts for substantially all required payments, including the payment of royalties, Marketing Fund contributions, risk management services, online ordering fees and purchases from our print and promotions operations and QC Centers. This system significantly reduces the resources needed to process receivables, improves cash flow and mitigates the amount of past-due accounts related to these items. Domestic franchisees are required to purchase and install the Papa John’s PROFIT System in their traditional restaurants (see “Company Operations – Point of Sale Technology”). Comprehensive Restaurant Measurement Program. As part of our effort to deliver on our brand promise of “Better Ingredients. Better Pizza.” we have implemented a comprehensive measurement program for all domestic and international restaurants. The measurement program focuses on the quality of the pizza and the customer service experience.
Industry and Competition
The United States Quick Service Restaurant pizza industry (“QSR Pizza”) is mature and highly competitive with respect to price, service, location, food quality and variety. There are well-established competitors with substantially greater financial and other resources than Papa John’s. Competitors include international, national and regional chains, as well as a large number of local independent pizza operators. Some of our competitors have been in existence for substantially longer periods than Papa John’s and can have higher levels of restaurant penetration and stronger, more developed brand awareness in markets where we have restaurants. According to industry sources, QSR Pizza category sales, which includes dine-in, carry-out and delivery, had sales of approximately $34.2 billion in 2010, or
13
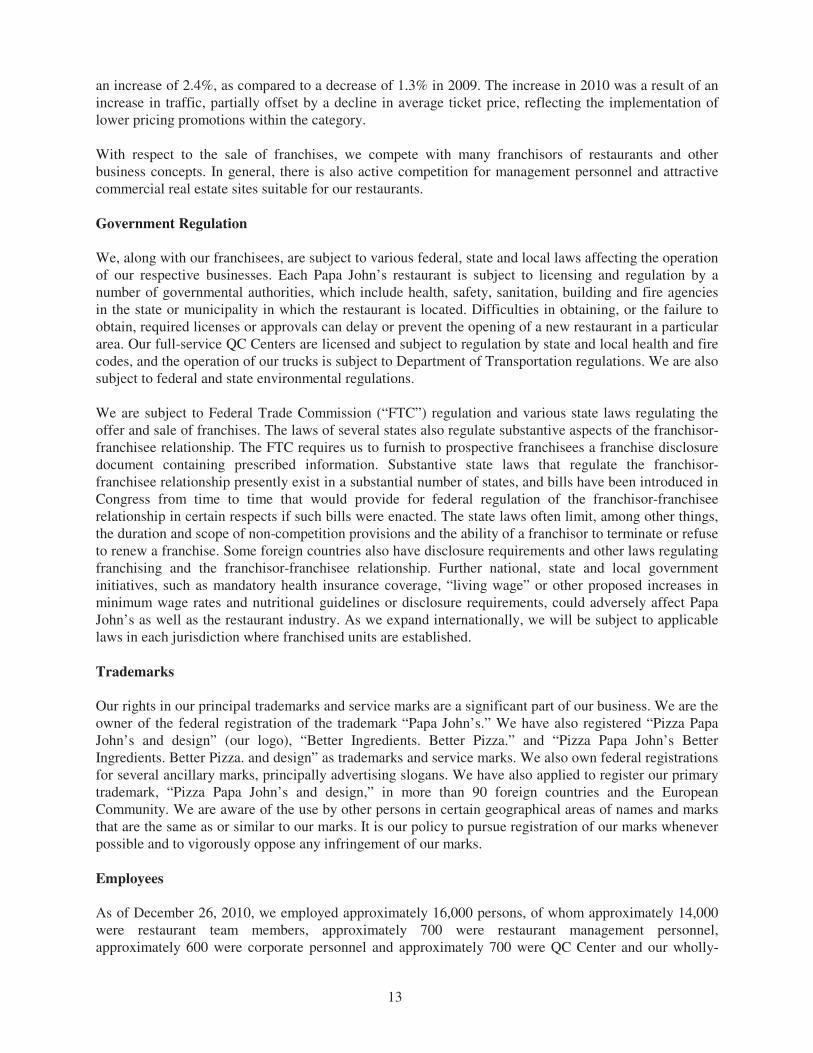
an increase of 2.4%, as compared to a decrease of 1.3% in 2009. The increase in 2010 was a result of an increase in traffic, partially offset by a decline in average ticket price, reflecting the implementation of lower pricing promotions within the category. With respect to the sale of franchises, we compete with many franchisors of restaurants and other business concepts. In general, there is also active competition for management personnel and attractive commercial real estate sites suitable for our restaurants.
Government Regulation We, along with our franchisees, are subject to various federal, state and local laws affecting the operation of our respective businesses. Each Papa John’s restaurant is subject to licensing and regulation by a number of governmental authorities, which include health, safety, sanitation, building and fire agencies in the state or municipality in which the restaurant is located. Difficulties in obtaining, or the failure to obtain, required licenses or approvals can delay or prevent the opening of a new restaurant in a particular area. Our full-service QC Centers are licensed and subject to regulation by state and local health and fire codes, and the operation of our trucks is subject to Department of Transportation regulations. We are also subject to federal and state environmental regulations. We are subject to Federal Trade Commission (“FTC”) regulation and various state laws regulating the offer and sale of franchises. The laws of several states also regulate substantive aspects of the franchisor-franchisee relationship. The FTC requires us to furnish to prospective franchisees a franchise disclosure document containing prescribed information. Substantive state laws that regulate the franchisor-franchisee relationship presently exist in a substantial number of states, and bills have been introduced in Congress from time to time that would provide for federal regulation of the franchisor-franchisee relationship in certain respects if such bills were enacted. The state laws often limit, among other things, the duration and scope of non-competition provisions and the ability of a franchisor to terminate or refuse to renew a franchise. Some foreign countries also have disclosure requirements and other laws regulating franchising and the franchisor-franchisee relationship. Further national, state and local government initiatives, such as mandatory health insurance coverage, “living wage” or other proposed increases in minimum wage rates and nutritional guidelines or disclosure requirements, could adversely affect Papa John’s as well as the restaurant industry. As we expand internationally, we will be subject to applicable laws in each jurisdiction where franchised units are established.
Trademarks Our rights in our principal trademarks and service marks are a significant part of our business. We are the owner of the federal registration of the trademark “Papa John’s.” We have also registered “Pizza Papa John’s and design” (our logo), “Better Ingredients. Better Pizza.” and “Pizza Papa John’s Better Ingredients. Better Pizza. and design” as trademarks and service marks. We also own federal registrations for several ancillary marks, principally advertising slogans. We have also applied to register our primary trademark, “Pizza Papa John’s and design,” in more than 90 foreign countries and the European Community. We are aware of the use by other persons in certain geographical areas of names and marks that are the same as or similar to our marks. It is our policy to pursue registration of our marks whenever possible and to vigorously oppose any infringement of our marks.
Employees
As of December 26, 2010, we employed approximately 16,000 persons, of whom approximately 14,000 were restaurant team members, approximately 700 were restaurant management personnel, approximately 600 were corporate personnel and approximately 700 were QC Center and our wholly-

14
owned print and promotions subsidiary, Preferred Marketing Solutions, Inc. (“Preferred”) personnel. Most restaurant team members work part-time and are paid on an hourly basis. None of our team members is covered by a collective bargaining agreement. We consider our team member relations to be excellent.
Item 1A. Risk Factors We are subject to various risks that could have a negative effect on our business, financial condition and results of operations. These risks could cause actual operating results to differ from those expressed in certain “forward looking statements” contained in this Form 10-K as well as in other Company communications. Although we believe that our expectations are based on reasonable assumptions, actual results may differ materially from those in the forward-looking statements as a result of various factors, including but not limited to, the following: Our growth strategy requires the opening of new Papa John’s restaurants. We may not be able to
achieve our planned growth targets due to factors outside of our control, including the current economic
environment. Our growth strategy depends on our and our franchisees’ ability to open new restaurants and to operate them on a profitable basis. Planned growth targets and the ability to operate new and existing restaurants profitably are affected by economic and competitive conditions and the resulting impact on consumer buying habits. Our business is susceptible to adverse changes in domestic and global economic conditions, which could make it difficult and uncertain for us to forecast operating results. If the economy recovers more slowly than expected, we could experience difficulty meeting our growth targets. Decreased consumer confidence, volatility in commodity and fuel costs, difficulties in the financial sector and other factors affecting consumer spending, such as continued higher levels of unemployment, could make it difficult for us to execute our strategy. Insolvency of key suppliers could also negatively impact our business. The ability of the Papa John’s system to continue to open and operate new restaurants is affected by a number of factors, many of which are beyond our control. These factors include, among other things, the availability of financing, the selection and availability of suitable restaurant locations, increases in the cost of or sustained high levels of cost of food ingredients and other commodities, paper, utilities, fuel, employee compensation and benefits, insurance and similar costs, availability and negotiation of suitable lease or financing terms, constraints on permitting and construction of restaurants, higher than anticipated construction costs, and the hiring, training and retention of management and other personnel. Accordingly, there can be no assurance that, system-wide, Papa John’s will be able to meet planned growth targets for net unit openings, open restaurants in markets now targeted for expansion or continue to operate in existing markets profitably. We face substantial competition from other food industry competitors, and our results of operations can
be negatively impacted by the actions of one or more of our competitors.
The QSR Pizza category and the restaurant industry in general are intensely competitive with respect to price, service, location and food quality, and there are many well-established competitors with substantially greater financial and other resources than the Papa John’s system. Some of these competitors have been in existence for a substantially longer period than Papa John’s and may be better established in the markets where restaurants operated by us or our franchisees are, or may be, located. Experience has shown that a change in pricing or other marketing or promotional strategies, including new product and concept developments, by one or more of our major competitors can have an adverse impact on our sales and earnings and our system-wide restaurant operations.
15
Our results of operations and the operating results of our franchisees may be adversely impacted by
increases in the cost of food ingredients and other commodities.
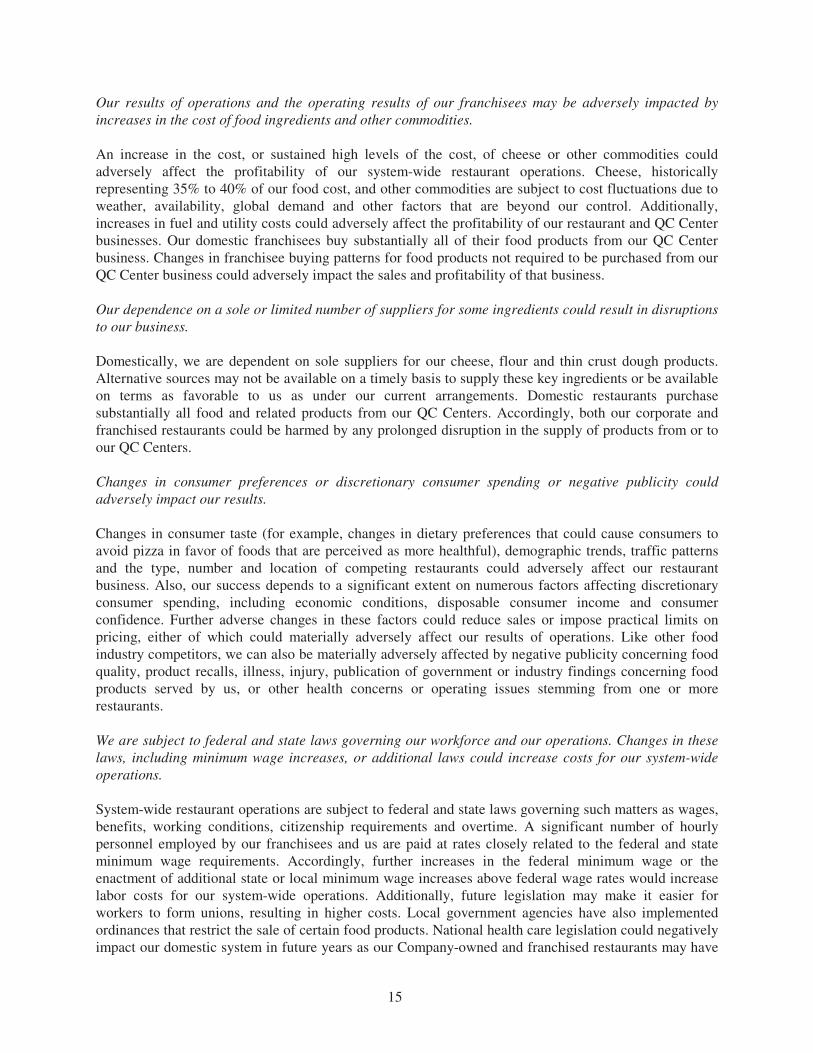
An increase in the cost, or sustained high levels of the cost, of cheese or other commodities could adversely affect the profitability of our system-wide restaurant operations. Cheese, historically representing 35% to 40% of our food cost, and other commodities are subject to cost fluctuations due to weather, availability, global demand and other factors that are beyond our control. Additionally, increases in fuel and utility costs could adversely affect the profitability of our restaurant and QC Center businesses. Our domestic franchisees buy substantially all of their food products from our QC Center business. Changes in franchisee buying patterns for food products not required to be purchased from our QC Center business could adversely impact the sales and profitability of that business. Our dependence on a sole or limited number of suppliers for some ingredients could result in disruptions
to our business.
Domestically, we are dependent on sole suppliers for our cheese, flour and thin crust dough products. Alternative sources may not be available on a timely basis to supply these key ingredients or be available on terms as favorable to us as under our current arrangements. Domestic restaurants purchase substantially all food and related products from our QC Centers. Accordingly, both our corporate and franchised restaurants could be harmed by any prolonged disruption in the supply of products from or to our QC Centers. Changes in consumer preferences or discretionary consumer spending or negative publicity could
adversely impact our results.
Changes in consumer taste (for example, changes in dietary preferences that could cause consumers to avoid pizza in favor of foods that are perceived as more healthful), demographic trends, traffic patterns and the type, number and location of competing restaurants could adversely affect our restaurant business. Also, our success depends to a significant extent on numerous factors affecting discretionary consumer spending, including economic conditions, disposable consumer income and consumer confidence. Further adverse changes in these factors could reduce sales or impose practical limits on pricing, either of which could materially adversely affect our results of operations. Like other food industry competitors, we can also be materially adversely affected by negative publicity concerning food quality, product recalls, illness, injury, publication of government or industry findings concerning food products served by us, or other health concerns or operating issues stemming from one or more restaurants. We are subject to federal and state laws governing our workforce and our operations. Changes in these
laws, including minimum wage increases, or additional laws could increase costs for our system-wide
operations.
System-wide restaurant operations are subject to federal and state laws governing such matters as wages, benefits, working conditions, citizenship requirements and overtime. A significant number of hourly personnel employed by our franchisees and us are paid at rates closely related to the federal and state minimum wage requirements. Accordingly, further increases in the federal minimum wage or the enactment of additional state or local minimum wage increases above federal wage rates would increase labor costs for our system-wide operations. Additionally, future legislation may make it easier for workers to form unions, resulting in higher costs. Local government agencies have also implemented ordinances that restrict the sale of certain food products. National health care legislation could negatively impact our domestic system in future years as our Company-owned and franchised restaurants may have
16
to provide health care coverage that was not previously offered to certain part-time team members. Additional compliance with government mandates, including nutritional content and menu labeling legislation, could increase costs and be harmful to system-wide restaurant sales.
Current credit markets may adversely impact the ability of our franchisees to obtain financing, which
may hinder our ability to achieve our planned growth in restaurant openings. Our growth strategy depends in large part on our ability and the ability of our franchisees to expand or open new restaurants and to operate those restaurants on a profitable basis. Delays or failures in opening new restaurants could materially and adversely affect our planned growth. While the credit markets have improved over the last year, our franchisees remain dependent on the availability of financing to expand existing locations or construct and open new restaurants. If our franchisees experience difficulty in obtaining adequate financing for these purposes, our growth strategy and franchise revenues may be adversely affected. The reduced availability of credit has required, and may continue to require, the Company to provide financing to certain franchisees and prospective franchisees in order to mitigate store closings or allow new units to open. If we are unable or unwilling to provide such financing, our results of operations may be adversely impacted. Our expansion into emerging or under-penetrated domestic and international markets may present
increased risks.
Any or all of the risks listed above potentially adversely impacting restaurant sales or costs could be especially harmful to the financial viability of franchisees in under-penetrated or emerging markets or international markets with unstable political climates. A decline in or failure to improve financial performance for this group of franchisees could lead to unit closings at greater than anticipated levels and therefore impact contributions to marketing funds, our royalty stream, PJFS and support services efficiencies and other system-wide results. We may be subject to impairment charges.
Impairment charges for Company-owned operations are possible if PJUK or previously acquired domestic restaurants perform below our expectations. This would result in a decrease in our reported assets value and reduction in our net income. Our business and brand may be harmed should the services of our Founder, John Schnatter, as Co-Chief
Executive Officer, Chairman or brand spokesman terminate for any reason.
John H. Schnatter, our Founder, Chairman and Co-Chief Executive Officer (Co-CEO), does not serve under an employment agreement and we do not maintain key man life insurance on Mr. Schnatter. We also depend on Mr. Schnatter’s image and his services as spokesman in our advertising and promotion materials. While we have entered into a license agreement with Mr. Schnatter related to the use of certain intellectual property, our business and brand may be harmed if Mr. Schnatter’s services as Co-CEO, Chairman or brand spokesman were not available for any reason. Changes in purchasing practices by our domestic franchisees could harm our commissary business. Although our domestic franchisees currently purchase substantially all food products from our QC Centers, they are required to purchase only tomato sauce and dough from our QC Centers. Any changes in purchasing practices by domestic franchisees, such as seeking alternative suppliers of food products, including cheese, could adversely affect the financial results of our QC Centers.
17
We may be required to resort to litigation to protect our intellectual property rights, which could
negatively affect our results of operations.
We depend on our Papa John’s brand name and we rely on a combination of trademarks, copyrights, service marks and similar intellectual property rights to protect our brand. We believe that the success of our business depends on our continued ability to use our existing trademarks and service marks to increase brand awareness and further develop our brand, both domestically and abroad. We may not be able to adequately protect our intellectual property rights and we may be required to resort to litigation to enforce such rights. Litigation could result in high costs and diversion of resources, which could negatively affect our results of operations, regardless of the outcome. Our international operations are subject to increased risks and other factors that may make it more
difficult to achieve or maintain profitability or meet planned growth rates.
Our international operations could be negatively impacted by changes in international economic, political and health conditions in the countries in which the Company or its franchisees operate. In addition, our international operations are subject to additional factors, including compliance with foreign laws, currency regulations and fluctuations, differing business and social cultures and consumer preferences, diverse government regulations and structures, availability and cost of land and construction, ability to source high-quality ingredients and other commodities in a cost-effective manner, and differing interpretation of the obligations established in franchise agreements with international franchisees. Accordingly, there can be no assurance that our international operations will achieve or maintain profitability or meet planned growth rates. Disruptions of our critical business or information technology systems could harm our ability to conduct
normal business.
Domestically and internationally, we are dependent on our technology systems operating correctly, including our enhanced online ordering system launched in 2010 through which more than 28% of our domestic business originates. Our systems could be damaged or interrupted by power loss, telecommunication failures, acts of God, computer viruses, physical or electronic break-ins or similar attacks. We may not have or be able to obtain adequate insurance to mitigate the risks of these events, which could damage our business and reputation and be expensive and difficult to remedy or repair. Although we have systems in place to prevent security breaches and theft of consumer and Company information, failure to prevent fraud or security breaches could have a material adverse effect on our business. We have been and will continue to be subject to various types of litigation, which could subject us to
significant damages or other remedies.
We are party to various legal proceedings, including employment and tort claims. We evaluate these claims and proceedings to assess the expected outcome and where possible to estimate the amount of potential losses to us. These assessments are based on the information available to us at the time the estimates are made and require the use of a significant amount of judgment, and actual outcomes or losses may materially differ from our estimates. Even if claims against us do not have merit, the costs of defending or settling any such existing or future claims, or costs related to damages should such claims be upheld in court, could significantly impact the Company’s earnings and financial condition.
18
Item 1B. Unresolved Staff Comments
None.
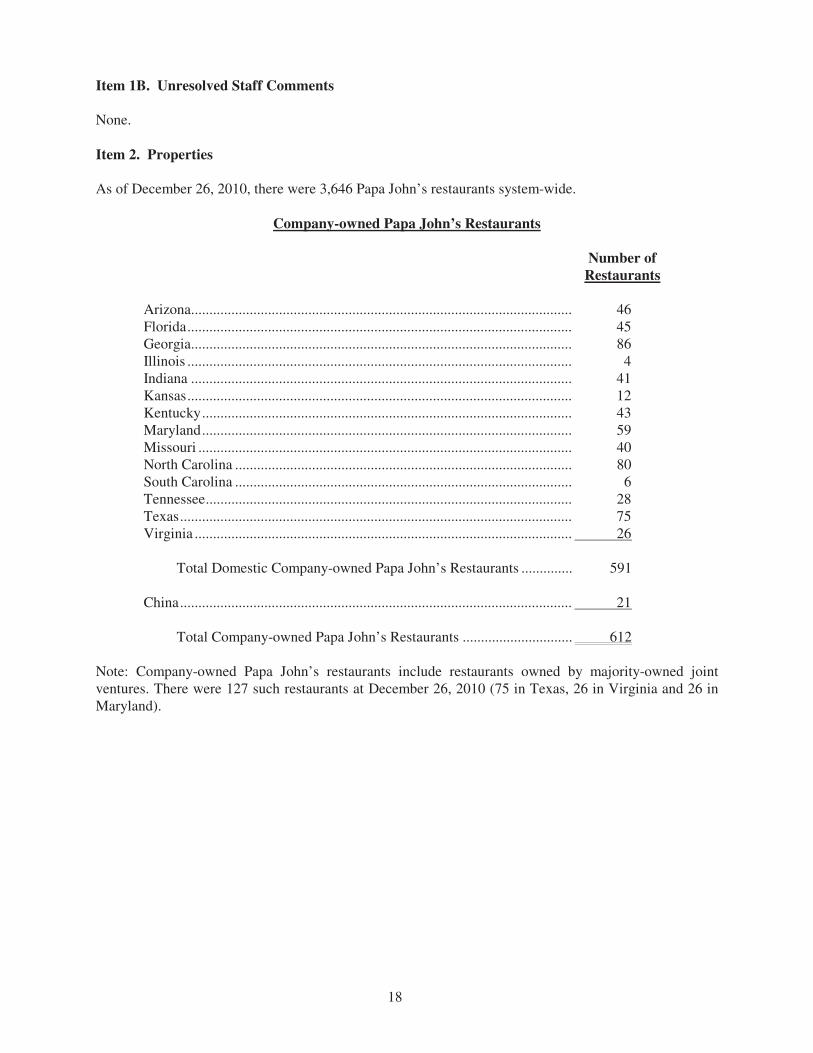
Item 2. Properties As of December 26, 2010, there were 3,646 Papa John’s restaurants system-wide.
Company-owned Papa John’s Restaurants
Number of
Restaurants Arizona........................................................................................................ 46 Florida......................................................................................................... 45 Georgia........................................................................................................ 86 Illinois ......................................................................................................... 4 Indiana ........................................................................................................ 41 Kansas......................................................................................................... 12 Kentucky..................................................................................................... 43 Maryland..................................................................................................... 59 Missouri ...................................................................................................... 40 North Carolina ............................................................................................ 80 South Carolina ............................................................................................ 6 Tennessee.................................................................................................... 28 Texas........................................................................................................... 75 Virginia ....................................................................................................... 26 Total Domestic Company-owned Papa John’s Restaurants .............. 591 China........................................................................................................... 21 Total Company-owned Papa John’s Restaurants .............................. 612 Note: Company-owned Papa John’s restaurants include restaurants owned by majority-owned joint ventures. There were 127 such restaurants at December 26, 2010 (75 in Texas, 26 in Virginia and 26 in Maryland).
19
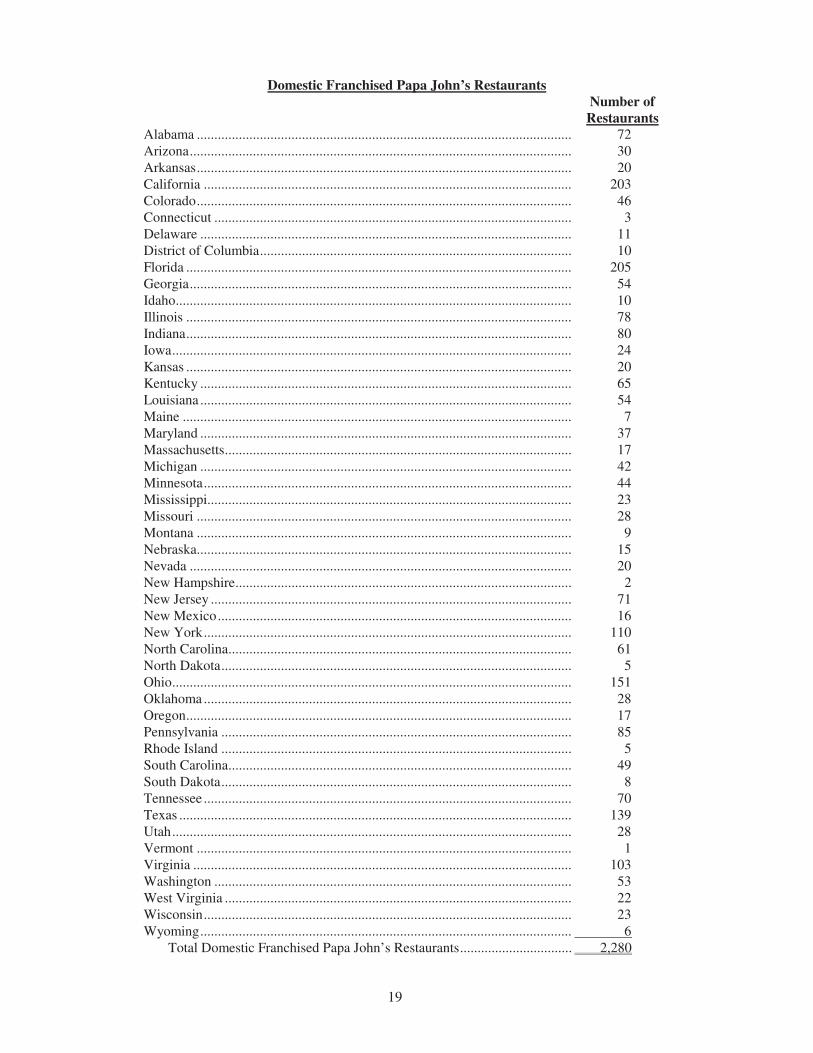
Domestic Franchised Papa John’s Restaurants
Number of
Restaurants Alabama ........................................................................................................... 72
Arizona............................................................................................................. 30
Arkansas........................................................................................................... 20
California ......................................................................................................... 203
Colorado........................................................................................................... 46
Connecticut ...................................................................................................... 3
Delaware .......................................................................................................... 11
District of Columbia......................................................................................... 10
Florida .............................................................................................................. 205
Georgia............................................................................................................. 54
Idaho................................................................................................................. 10
Illinois .............................................................................................................. 78
Indiana.............................................................................................................. 80
Iowa.................................................................................................................. 24
Kansas .............................................................................................................. 20
Kentucky .......................................................................................................... 65
Louisiana .......................................................................................................... 54
Maine ............................................................................................................... 7
Maryland .......................................................................................................... 37
Massachusetts................................................................................................... 17
Michigan .......................................................................................................... 42
Minnesota......................................................................................................... 44
Mississippi........................................................................................................ 23
Missouri ........................................................................................................... 28
Montana ........................................................................................................... 9
Nebraska........................................................................................................... 15
Nevada ............................................................................................................. 20
New Hampshire................................................................................................ 2
New Jersey ....................................................................................................... 71
New Mexico..................................................................................................... 16
New York......................................................................................................... 110
North Carolina.................................................................................................. 61
North Dakota.................................................................................................... 5
Ohio.................................................................................................................. 151
Oklahoma ......................................................................................................... 28
Oregon.............................................................................................................. 17
Pennsylvania .................................................................................................... 85
Rhode Island .................................................................................................... 5
South Carolina.................................................................................................. 49
South Dakota.................................................................................................... 8
Tennessee ......................................................................................................... 70
Texas ................................................................................................................ 139
Utah.................................................................................................................. 28
Vermont ........................................................................................................... 1
Virginia ............................................................................................................ 103
Washington ...................................................................................................... 53
West Virginia ................................................................................................... 22
Wisconsin......................................................................................................... 23
Wyoming.......................................................................................................... 6
Total Domestic Franchised Papa John’s Restaurants................................ 2,280

20
International Franchised Papa John’s Restaurants
Number of
Restaurants
Alaska (a) ......................................................................................................... 5
Bahrain ............................................................................................................. 16
Canada (a) ........................................................................................................ 46
Cayman Islands ................................................................................................ 1
Chile ................................................................................................................. 4
China ................................................................................................................ 136
Colombia .......................................................................................................... 4
Costa Rica ........................................................................................................ 15
Cyprus .............................................................................................................. 5
Dominican Republic......................................................................................... 7
Ecuador ............................................................................................................ 9
Egypt ................................................................................................................ 13
El Salvador ....................................................................................................... 6
Hawaii (a)......................................................................................................... 15
India ................................................................................................................. 24
Ireland .............................................................................................................. 31
Jordan............................................................................................................... 4
Korea................................................................................................................ 69
Kuwait .............................................................................................................. 20
Malaysia ........................................................................................................... 7
Mexico ............................................................................................................. 47
Morocco ........................................................................................................... 1
Nicaragua ......................................................................................................... 2
Oman................................................................................................................ 8
Panama............................................................................................................. 1
Peru .................................................................................................................. 16
Philippines........................................................................................................ 1
Puerto Rico....................................................................................................... 12
Qatar................................................................................................................. 7
Russia ............................................................................................................... 21
Trinidad............................................................................................................ 5
Turkey .............................................................................................................. 6
United Arab Emirates....................................................................................... 15
United Kingdom............................................................................................... 151
Venezuela......................................................................................................... 24
Total International Franchised Papa John’s Restaurants........................... 754
(a) We define “domestic” operations as units located in the contiguous United States and “international” operations as units located outside the contiguous United States. Beginning in fiscal 2011, we realigned management responsibility for Hawaii, Alaska and Canada from international to domestic operations in order to better leverage existing infrastructure and systems. In our reported financial information beginning in first quarter of 2011, Hawaii, Alaska and Canada will be shown with total domestic franchised Papa John’s restaurants, which will be renamed North America franchised restaurants.
21
Most Papa John’s restaurants are located in leased space. The initial term of most domestic restaurant leases is generally five years with most leases providing for one or more options to renew for at least one additional term. Virtually all of our leases specify a fixed annual rent. Generally, the leases are triple net leases, which require us to pay all or a portion of the cost of insurance, taxes and utilities. Certain leases further provide that the lease payments may be increased annually, with a small number of escalations based on changes in the Consumer Price Index. We have 43 Company-owned restaurants that are located in buildings we own on land either owned or leased by us. These restaurants range from 1,000 to 3,000 square feet. Three of these restaurants are located in multi-bay facilities. These multi-bay facilities contain from 2,800 to 5,000 square feet, and the space not utilized by the Papa John’s restaurant in each facility is leased or held for lease to third-party tenants. At December 26, 2010, we had 151 Papa John’s franchised restaurants located in the United Kingdom. We leased and subleased to franchisees 102 of the 151 franchised Papa John’s restaurant sites in the United Kingdom. The initial lease terms on the Company and franchised sites are generally 10 to 15 years. The initial lease terms of the franchisee subleases are generally five to ten years. Additionally, we leased 21 Company-owned restaurant sites in Beijing, China as of December 26, 2010.
Information with respect to our leased domestic QC Centers as of December 26, 2010 is set forth below:
Facility Square Footage Raleigh, NC 61,000 Denver, CO 32,000 Phoenix, AZ 57,000 Des Moines, IA 43,000 Portland, OR 37,000 Pittsburgh, PA 52,000 Cranbury, NJ 59,000 We own land in Orlando, Florida on which our 63,000 square foot full-service QC Center is located. We also own land and a 175,000 square foot facility in Dallas, Texas, of which 77,500 square feet is used by our full-service QC Center and the remaining space is leased to a third-party tenant. In addition, we own land in Louisville, Kentucky, on a portion of which is located a 42,000 square foot building housing our printing operations and a 247,000 square foot building, approximately 30% to 40% of which accommodates the Louisville QC Center operation and promotions division. The remainder of the larger building houses our corporate offices. We own a 49,000 square foot full-service QC Center in the United Kingdom. The Papa John’s UK management team is located in a leased office near London with a remaining lease term of six years. The Papa John’s China management team leases an office and a QC Center in Beijing, China. The Papa John’s Mexico management team and QC Center lease a facility in Mexico City, Mexico.
Item 3. Legal Proceedings
We are subject to claims and legal actions in the ordinary course of our business. We believe that none of the claims and actions currently pending against us would have a material adverse effect on us if decided in a manner unfavorable to us.
Item 4. Removed and Reserved
22
EXECUTIVE OFFICERS OF THE REGISTRANT Set forth below are the current executive officers of Papa John’s:
Name
Age (a)
Position
First Elected Executive Officer
John H. Schnatter
49 Founder, Chairman and Co-Chief Executive Officer
1985
J. Jude Thompson 48 President and Co-Chief Executive Officer
2009
Annette W. Calhoun 48 Senior Vice President, Human Resources
2011
J. David Flanery 53 Senior Vice President, Chief Financial Officer and Treasurer
1994
Timothy C. O’Hern 47 Senior Vice President, Development
2005
Christopher J. Sternberg 45 Senior Vice President, Corporate Communications and General Counsel
2008
Thomas V. Sterrett 50 Senior Vice President, International
2010
Anthony N. Thompson 44 Executive Vice President, North American Operations and President, PJ Food Service
2009
Lance F. Tucker 41 Chief of Staff and Senior Vice President, Strategic Planning
2011
Andrew M. Varga 45 Senior Vice President and Chief Marketing Officer
2009
(a) Ages are as of January 1, 2011. John H. Schnatter created the Papa John’s concept in 1984 and the first Papa John’s restaurant opened in 1985. He currently serves as Founder, Chairman and Co-Chief Executive Officer. He previously served as Interim Chief Executive Officer from December 2008 to April 2009, Executive Chairman of the Company from 2005 until May 2007, as Chairman of the Board and Chief Executive Officer from 1990 until 2005, and as President from 1985 to 1990 and from 2001 until 2005. J. Jude Thompson was appointed President and Co-Chief Executive Officer in April 2010 and previously served as President and Chief Operating Officer of Papa John’s since April 2009. He also serves as a member of our Board of Directors, which he joined in February 2008. From 2006 to 2008, Mr. Thompson served as Senior Vice President of WellPoint, Inc., and President, Individual Business of Anthem Blue Cross and Blue Shield. Mr. Thompson previously held positions of increasing
23
responsibility with Anthem Blue Cross and Blue Shield, a division of WellPoint, or its affiliates since 1989. Annette W. Calhoun was promoted to Senior Vice President, Human Resources in November 2010, after serving as Vice President, Human Resources since 2009. Ms. Calhoun has held several human resource positions since joining Papa John’s in 1999. Prior to joining Papa John’s, Ms. Calhoun served as the head of human resources for a regional law firm. J. David Flanery has served as Senior Vice President, Chief Financial Officer and Treasurer since 2004. He previously served as Senior Vice President of Finance since August 2002. He served as Vice President of Finance from 1995 through August 2002, after having joined Papa John’s in 1994 as Corporate Controller. From 1979 to 1994, Mr. Flanery was with Ernst & Young LLP in a variety of positions, most recently as Audit Senior Manager. Mr. Flanery is a licensed Certified Public Accountant. Timothy C. O’Hern has served as Senior Vice President, Development since June 2009, a position he previously held from 2005 until 2007. From 2002 until 2005 and from 2007 until 2009, he managed the operations of a Papa John’s franchisee in which he has an ownership interest. Prior to his departure from Papa John’s in 2002, Mr. O’Hern held various positions, including Vice President of Global Development from February 2001 to 2002, Vice President of U.S. Development from March 1997 to February 2001, Director of Franchise Development from December 1996 to March 1997 and Construction Manager from November 1995 to December 1996. He has been a franchisee since 1993. Christopher J. Sternberg was named General Counsel in June 2009, having previously served as Interim General Counsel from December 2008. Mr. Sternberg has served as Senior Vice President, Corporate Communications, since 2005, after serving as Vice President and Assistant to the Chairman from 2000 to 2005. Mr. Sternberg served as Vice President, Corporate Communications from 1997 to 2000. Mr. Sternberg joined the Company in 1994 as Assistant Counsel in our Legal Department. From 1990 to 1994, he was an attorney with Greenebaum, Doll & McDonald PLLC. Thomas V. Sterrett was named Senior Vice President, International in August 2010. Mr. Sterrett has served as Division Vice President from 2007 to 2010 (Midwest and South Divisions), Operations Vice President for the Company’s Midwest Division from 2005 to 2007, Director of Operations in the Nashville, Tennessee market from 2003 to 2005 and District Manager of the South Florida market from 1995 to 2003. Prior to joining Papa John’s, Mr. Sterrett spent eleven years with Dominos both as an employee and a franchisee. Anthony N. Thompson was promoted to Executive Vice President, North American Operations in December 2010 and continues to serve as President, PJ Food Service, a position in which he was appointed in May 2010. In his new role, Mr. Thompson is responsible for overseeing Papa John’s North American operations, including Company-owned and franchised restaurants. Mr. Thompson joined Papa John’s in 2006 and has held the positions of Senior Vice President, PJ Food Service from 2009 to May 2010 and Vice President, QCC Operations from 2006 to 2009. Prior to joining Papa John’s, Mr. Thompson worked for the Scotts Company for six years as Plant Manager, Director of Marysville Operations and Director of Lawn and Controls Operations. Before joining the Scotts Company, Mr. Thompson spent four years with Conagra Grocery Products Company where he held positions as Operations Leader, Manufacturing Manager and Plant Manager. He also spent seven years in various roles with Gulf Coast Coca Cola. Lance F. Tucker was promoted to Chief of Staff and Senior Vice President, Strategic Planning in June 2010, after serving as Chief of Staff and Vice President, Strategic Planning since June 2009. Mr. Tucker was previously employed by the Company from 1994 to 1999 working in its finance department. From
24
2003 to 2009, Mr. Tucker served as Chief Financial Officer of Evergreen Real Estate, a company owned by John Schnatter. Mr. Tucker is a licensed Certified Public Accountant. Andrew M. Varga was appointed Senior Vice President and Chief Marketing Officer in August 2009. Mr. Varga joined Papa John’s after 21 years with Brown-Forman Corporation. Mr. Varga served as Senior Vice President/Director of Marketing for Brown-Forman from 2007 until 2009, responsible for the company’s Wines and Spirits portfolio in the North American Region. From 2004 to 2007, Mr. Varga was Senior Vice President/Managing Director, Wines Marketing, with global responsibility for the wine portfolio. There are no family relationships among our executive officers and other key personnel.
PART II
Item 5. Market for Registrant’s Common Equity, Related Stockholder Matters and Issuer
Purchases of Equity Securities
Our common stock trades on The NASDAQ Global Select Market tier of The NASDAQ Stock Market under the symbol PZZA. As of February 15, 2011, there were 782 record holders of common stock. However, there are significantly more beneficial owners of our common stock than there are record holders. The following table sets forth, for the quarters indicated, the high and low closing sales prices of our common stock, as reported by The NASDAQ Stock Market.
2010 High Low
First Quarter 25.82$ 21.77$
Second Quarter 28.76 23.43
Third Quarter 26.30 22.78
Fourth Quarter 27.74 25.49
2009 High Low
First Quarter 25.72$ 15.59$
Second Quarter 28.47 22.77
Third Quarter 27.34 22.90
Fourth Quarter 24.70 21.47
Since our initial public offering of common stock in 1993, we have not paid cash dividends on our common stock, and have no current plans to do so. Papa John’s Board of Directors has authorized the repurchase of up to $825.0 million of common stock under a share repurchase program that began December 9, 1999, and expires December 31, 2011. Through December 26, 2010, a total of 45.4 million shares with an aggregate cost of $788.1 million and an average price of $17.36 per share have been repurchased under this program. Subsequent to year-end (through February 15, 2011), we acquired an additional 66,000 shares at an aggregate cost of $1.8 million. As of February 15, 2011, approximately $35.0 million remained available for repurchase of common stock under this authorization.

25
The following table summarizes our repurchase activity by fiscal period during 2010 (in thousands, except per share amounts):
Total Number Maximum Dollar
Total Average of Shares Purchased Value of Shares
Number Price as Part of Publicly that May Yet Be
of Shares Paid per Announced Plans Purchased Under the
Fiscal Period Purchased Share or Programs Plans or Programs
12/28/2009 - 01/24/2010 - - * 43,508 $83,798
01/25/2010 - 02/21/2010 55 $22.51 43,563 $82,553
02/22/2010 - 03/28/2010 160 $25.14 43,723 $78,529
03/29/2010 - 04/25/2010 93 $25.64 43,816 $76,159
04/26/2010 - 05/23/2010 257 $25.50 44,073 $69,600
05/24/2010 - 06/27/2010 410 $24.93 44,483 $59,381
06/28/2010 - 07/25/2010 238 $24.22 44,721 $53,616
07/26/2010 - 08/22/2010 242 $24.78 44,963 $47,604
08/23/2010 - 09/26/2010 283 $24.83 45,246 $40,583
09/27/2010 - 10/24/2010 43 $25.99 45,289 $39,455
10/25/2010 - 11/21/2010 100 $25.78 45,389 $36,862
11/22/2010 - 12/26/2010 - - * 45,389 $36,862
*There were no share repurchases during this period.
The Company utilizes a written trading plan under Rule 10b5-1 under the Securities Exchange Act of 1934, as amended, from time to time to facilitate the repurchase of shares of our common stock under this share repurchase program. There can be no assurance that we will repurchase shares of our common stock either through a Rule 10b5-1 trading plan or otherwise. During fiscal 2010, 2,496 shares of the Company’s common stock were acquired from employees to satisfy tax withholding obligations that arose upon (i) vesting of restricted stock granted pursuant to approved plans and (ii) distribution of shares of common stock issued pursuant to deferred compensation obligations.
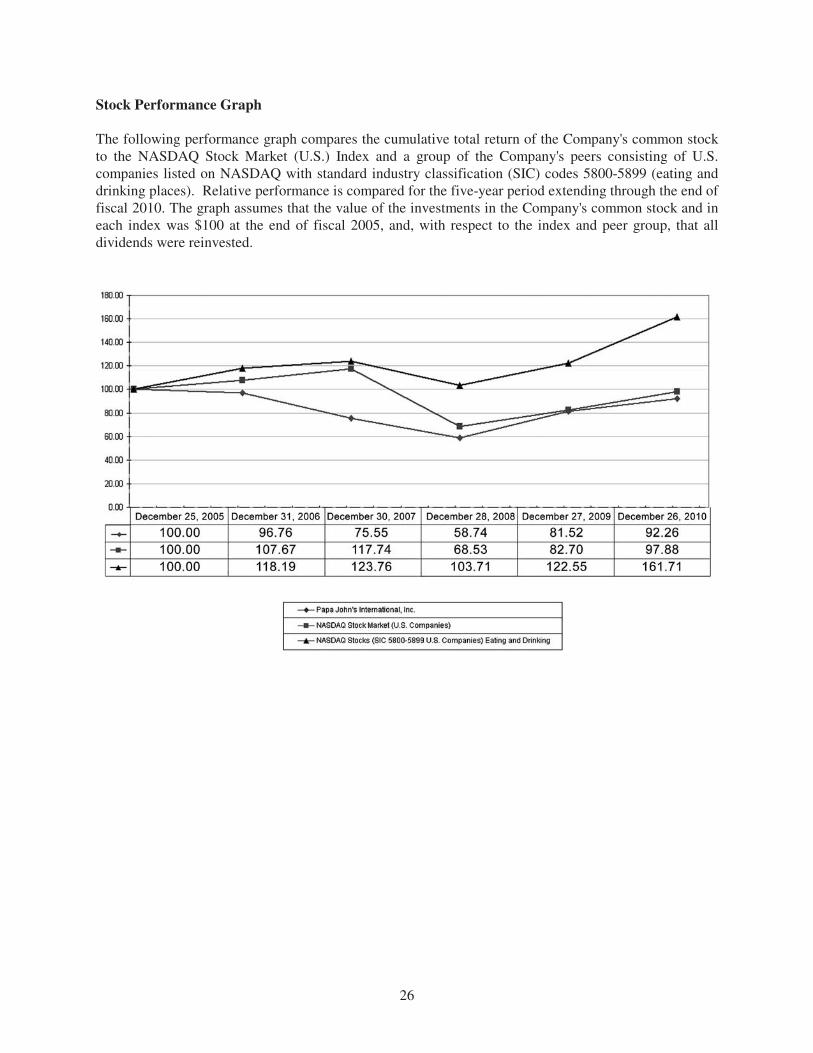
26
Stock Performance Graph The following performance graph compares the cumulative total return of the Company's common stock to the NASDAQ Stock Market (U.S.) Index and a group of the Company's peers consisting of U.S. companies listed on NASDAQ with standard industry classification (SIC) codes 5800-5899 (eating and drinking places). Relative performance is compared for the five-year period extending through the end of fiscal 2010. The graph assumes that the value of the investments in the Company's common stock and in each index was $100 at the end of fiscal 2005, and, with respect to the index and peer group, that all dividends were reinvested.

27
Item 6. Selected Financial Data The selected financial data presented for each of the fiscal years in the five-year period ended December 26, 2010, was derived from our audited consolidated financial statements. The selected financial data should be read in conjunction with “Management’s Discussion and Analysis of Financial Condition and Results of Operations” and the “Consolidated Financial Statements” and Notes thereto included in Item 7 and Item 8, respectively, of this Form 10-K. (In thousands, except per share data)
Dec. 26, Dec. 27, Dec. 28, Dec. 30, Dec. 31,
2010 2009 2008 2007 2006
Income Statement Data 52 weeks 52 weeks 52 weeks 52 weeks 53 weeks
Domestic revenues (2):
Company-owned restaurant sales 503,272$ 503,818$ 533,255$ 504,330$ 447,938$
Franchise royalties (3) 68,358 61,012 59,704 55,283 56,374
Franchise and development fees 340 519 1,600 4,758 2,597
Commissary sales (2) 454,506 417,689 431,650 401,081 415,392
Other sales 51,951 54,045 61,415 61,820 50,505
International revenues:
Royalties and franchise and development fees (4) 14,808 13,244 12,868 10,314 7,551
Restaurant and commissary sales (5) 33,162 28,223 25,849 20,860 15,658
Total revenues (2) 1,126,397 1,078,550 1,126,341 1,058,446 996,015
Operating income (2), (6) 86,744 95,218 65,486 53,072 99,446
Investment income 875 629 848 1,446 1,682
Interest expense (2) (5,338) (5,653) (7,536) (7,465) (3,480)
Income from continuing operations before income taxes 82,281 90,194 58,798 47,053 97,648
Income tax expense 26,856 28,985 19,980 13,293 33,171
Income from continuing operations, including
noncontrolling interests 55,425 61,209 38,818 33,760 64,477
Income attributable to noncontrolling interests (7) (3,485) (3,756) (2,022) (1,025) (1,491)
Income from continuing operations, net of
noncontrolling interests 51,940 57,453 36,796 32,735 62,986
Income from discontinued operations, net of tax (8) - - - - 389
Net income 51,940$ 57,453$ 36,796$ 32,735$ 63,375$
Basic earnings per common share:
Income from continuing operations, net of
noncontrolling interests 1.97$ 2.07$ 1.31$ 1.10$ 1.95$
Income from discontinued operations, net of tax (8) - - - - 0.01
Basic earnings per common share 1.97$ 2.07$ 1.31$ 1.10$ 1.96$
Earnings per common share - assuming dilution:
Income from continuing operations, net of
noncontrolling interests 1.96$ 2.06$ 1.30$ 1.09$ 1.91$
Income from discontinued operations, net of tax (8) - - - - 0.01
Earnings per common share - assuming dilution 1.96$ 2.06$ 1.30$ 1.09$ 1.92$
Basic weighted average shares outstanding 26,328 27,738 28,124 29,666 32,312
Diluted weighted average shares outstanding 26,468 27,909 28,264 30,017 33,046
Balance Sheet Data
Total assets (2) 415,941$ 393,726$ 385,464$ 400,885$ 379,056$
Total debt 99,017 99,050 130,654 142,706 97,036
Total stockholders’ equity 207,200 185,037 138,238 134,938 152,395
Year Ended (1)

28
(1) We operate on a 52-53 week fiscal year ending on the last Sunday of December of each year. The 2010, 2009, 2008 and 2007 fiscal years consisted of 52 weeks, and the 2006 fiscal year consisted of 53 weeks. The additional week in 2006 resulted in additional revenues of approximately $20.0 million and additional pre-tax income of approximately $3.5 million, or $0.07 per diluted share for 2006.
(2) Prior years’ financial data has been adjusted for the retrospective application of consolidation principles associated with variable interest entities (“VIEs”) accounting. See “Note 2” of “Notes to Consolidated Financial Statements” for additional information.
(3) Domestic Franchise royalties were derived from franchised restaurant sales of $1.58 billion in 2010, $1.55 billion in 2009, $1.50 billion in 2008, $1.46 billion in 2007 and $1.51 billion in 2006.
(4) International Royalties were derived from franchised restaurant sales of $295.9 million in 2010, $251.8 million in 2009, $221.0 million in 2008, $176.2 million in 2007 and $139.3 million in 2006.
(5) Restaurant sales for International Company-owned restaurants were $11.0 million in 2010, $10.3 million in 2009, $8.1 million in 2008, $4.0 million in 2007 and $1.7 million in 2006.
(6) The operating results include the consolidation of BIBP, which increased operating income approximately $21.4 million in 2010 (including a reduction in BIBP’s cost of sales of $14.2 million associated with PJFS’s agreement to pay to BIBP for past cheese purchases an amount equal to its accumulated deficit), $23.3 million in 2009 and $19.7 million in 2006 and reduced operating income by $8.6 million in 2008 and $31.0 million in 2007. The 2006 operating results include the benefit of the 53rd week, which increased operating income approximately $3.5 million. Operating income includes domestic and international restaurant closure, impairment and disposition losses of $253,000 in 2010, $657,000 in 2009, $8.8 million in 2008 and $1.8 million in 2007, and a gain of $260,000 in 2006. See “Notes 3 and 6” of “Notes to Consolidated Financial Statements” for additional information.
(7) Represents the noncontrolling interests’ ownership in two joint venture arrangements. (8) The Perfect Pizza operations, which were sold in March 2006, are classified as “discontinued
operations.”
Item 7. Management’s Discussion and Analysis of Financial Condition and Results of Operations
Introduction Papa John’s International, Inc. (referred to as the “Company,” “Papa John’s” or in the first person notations of “we,” “us” and “our”) began operations in 1985 with the opening of the first Papa John’s restaurant in Jeffersonville, Indiana. At December 26, 2010, there were 3,646 Papa John’s restaurants in operation, consisting of 612 Company-owned and 3,034 franchised restaurants. Our revenues are principally derived from retail sales of pizza and other food and beverage products to the general public by Company-owned restaurants, franchise royalties, sales of franchise and development rights, sales to franchisees of food and paper products, printing and promotional items, risk management services, and information systems and related services used in their operations.
New unit openings in 2010 were 325 as compared to 216 in 2009 and 267 in 2008 and unit closings in 2010 were 148 as compared to 127 in 2009 and 95 in 2008. We expect net unit growth of approximately 190 to 220 units during 2011. We have continued to produce strong average sales from our domestic Company-owned restaurants even in a very competitive market environment. Our expansion strategy is to cluster restaurants in targeted markets, thereby increasing consumer awareness and enabling us to take advantage of operational, distribution and advertising efficiencies. Average annual Company-owned sales for our most recent comparable restaurant base were $863,000 for 2010, compared to $869,000 for 2009 and $867,000 for

29
2008. Average sales volumes in new markets are generally lower than in those markets in which we have established a significant market position. The comparable sales for domestic Company-owned restaurants decreased 0.6% in 2010, decreased 0.5% in 2009 and increased 1.7% in 2008. The comparable sales for domestic franchised units increased 0.3% in 2010, 0.1% in 2009 and 0.6% in 2008. We continually strive to obtain high-quality restaurant sites with good access and visibility, and to enhance the appearance and quality of our restaurants. We believe that these factors improve our image and brand awareness. The average property and equipment investment cost for the 578 Company-owned restaurants included in our most recent comparable sales base was $281,000. The average cash investment for the five domestic Company-owned restaurants opened during 2010 was approximately $250,000, compared to the $240,000 investment for the five units opened in 2009, exclusive of land and any tenant improvement allowances that we received in both years. Approximately 45% of our revenues for 2010, compared to 40% of our revenues for 2009 and 41% of our revenues for 2008, were derived from the sale to our domestic and international franchisees of food and paper products, printing and promotional items, risk management services and information systems equipment and software and related services by us. We expect the percentage of revenues in 2011 to be consistent with 2010. We believe that, in addition to supporting both Company and franchised growth, these activities contribute to product quality and consistency and restaurant profitability throughout the Papa John’s system.
Results of Operations and Critical Accounting Policies and Estimates
The results of operations are based on our consolidated financial statements, which were prepared in conformity with accounting principles generally accepted in the United States. The preparation of consolidated financial statements requires management to select accounting policies for critical accounting areas as well as estimates and assumptions that affect the amounts reported in the consolidated financial statements. The Company’s significant accounting policies are more fully described in “Note 2” of “Notes to Consolidated Financial Statements.” Significant changes in assumptions and/or conditions in our critical accounting policies could materially impact the operating results. We have identified the following accounting policies and related judgments as critical to understanding the results of our operations. Allowance for Doubtful Accounts and Notes Receivable We establish reserves for uncollectible accounts and notes receivable based on overall receivable aging levels and a specific evaluation of accounts and notes for franchisees and other customers with known financial difficulties. These reserves and corresponding write-offs could significantly increase if the identified franchisees and other customers begin to or continue to experience deteriorating financial results. Long-lived and Intangible Assets The recoverability of long-lived assets is evaluated if impairment indicators exist. Indicators of impairment include historical financial performance, operating trends and our future operating plans. If impairment indicators exist, we evaluate the recoverability of long-lived assets on an operating unit basis (e.g., an individual restaurant) based on undiscounted expected future cash flows before interest for the expected remaining useful life of the operating unit. Recorded values for long-lived assets that are not expected to be recovered through undiscounted future cash flows are written down to current fair value, which is generally determined from estimated discounted future net cash flows for assets held for use or estimated net realizable value for assets held for sale.
30
The recoverability of indefinite-lived intangible assets (i.e., goodwill) is evaluated annually or more frequently if impairment indicators exist, on a reporting unit basis by comparing the estimated fair value to its carrying value. Our estimated fair value for Company-owned restaurants is comprised of two components. The first component is the estimated cash sales price that would be received at the time of the sale and the second component is an investment in the continuing franchise agreement, representing the discounted value of future royalties less any incremental direct operating costs, that would be collected under the ten-year franchise agreement. During 2008, we sold to domestic franchisees a total of 62 Company-owned restaurants located primarily in three markets. As part of the sales of these restaurants, we recorded a $3.6 million intangible asset for the investment in the continuing franchise agreement, representing the discounted value of the royalties we will receive over the next ten years from the purchaser/franchisee. The intangible asset is being amortized over the ten-year franchise agreement as a reduction in royalty income of $360,000 annually. The intangible asset is recorded in other assets in the accompanying consolidated balance sheet at December 26, 2010 with a remaining value of approximately $2.8 million. At December 26, 2010, we had a net investment of approximately $20.4 million associated with PJUK. During 2008, we recorded a goodwill impairment charge of $2.3 million associated with our PJUK operations (none in 2010 or 2009). We updated our evaluation of the fair value of our PJUK subsidiary in 2010. Our analysis indicated the fair value exceeded the carrying value by approximately 10%. The goodwill allocated to this entity approximated $14.7 million at December 26, 2010. We have plans for PJUK to continue to improve its operating results, including efforts to increase Papa John’s brand awareness in the United Kingdom, improve sales and profitability for individual restaurants and increase net PJUK franchised unit openings over the next several years. We are currently on target to achieve these plans.
We updated our evaluation of the fair value of our investment in our domestic Company-owned restaurants during 2010. We test for goodwill impairment at the region level, which is one step below the reporting segment level. The fair value of each reporting unit was substantially in excess of its carrying value as of the annual test date. Insurance Reserves Our insurance programs for workers’ compensation, general liability, owned and non-owned automobiles and health insurance coverage provided to our employees are self-insured up to certain individual and aggregate reinsurance levels. Losses are accrued based upon undiscounted estimates of the aggregate retained liability for claims incurred using certain third-party actuarial projections and our claims loss experience. The estimated insurance claims losses could be significantly affected should the frequency or ultimate cost of claims significantly differ from historical trends used to estimate the insurance reserves recorded by the Company.
Deferred Income Tax Accounts and Tax Reserves Papa John’s is subject to income taxes in the United States and several foreign jurisdictions. Significant judgment is required in determining Papa John’s provision for income taxes and the related assets and liabilities. The provision for income taxes includes income taxes paid, currently payable or receivable and those deferred. Deferred tax assets and liabilities are determined based on differences between financial reporting and tax basis of assets and liabilities, and are measured using enacted tax rates and laws that are expected to be in effect when the differences reverse. Deferred tax assets are also
31
recognized for the estimated future effects of tax loss carryforwards. The effect on deferred taxes of changes in tax rates is recognized in the period in which the enactment date changes. As a result, our effective tax rate may fluctuate. Valuation allowances are established when necessary on a jurisdictional basis to reduce deferred tax assets to the amounts we expect to realize. As of December 26, 2010, we had a net deferred income tax asset balance of $9.3 million. We have not provided a valuation allowance for the deferred income tax assets associated with our domestic operations since we believe it is more likely than not that future earnings will be sufficient to ensure the realization of the net deferred income tax assets for federal and state purposes. Certain tax authorities periodically audit the Company. We provide reserves for potential exposures. We evaluate these issues on a quarterly basis to adjust for events, such as court rulings or audit settlements, which may impact our ultimate payment for such exposures. We recognized reductions of $550,000, $1.2 million and $1.7 million in our customary income tax expense associated with the finalization of certain income tax issues in 2010, 2009 and 2008, respectively (see “Note 13” of “Notes to Consolidated Financial Statements”). Consolidation of BIBP Commodities, Inc. (“BIBP”) as a Variable Interest Entity BIBP is a franchisee-owned corporation that conducts a cheese-purchasing program on behalf of domestic Company-owned and franchised restaurants. We consolidate the financial results of BIBP, since we are deemed the primary beneficiary, as defined, of BIBP. We recognized pre-tax income of approximately $21.0 million during 2010 (including a reduction in BIBP’s cost of sales of $14.2 million as discussed below), $22.5 million during 2009 and a pre-tax loss of $10.5 million during 2008 from the consolidation of BIBP. BIBP had an accumulated deficit (representing prior purchases of cheese by PJ Food Service, Inc. (“PJFS”) from BIBP at below market prices) of $14.2 million at December 26, 2010. PJFS agreed to pay to BIBP the amount equal to the accumulated deficit at December 26, 2010. Accordingly, BIBP recorded a decrease of $14.2 million in cost of sales and PJFS recorded a corresponding increase in cost of sales. This transaction did not have any impact on the Company’s 2010 consolidated income statement results since both PJFS and BIBP are fully consolidated. As of February 15, 2011, substantially all of our domestic franchisees have entered into a cheese purchasing agreement with the Company. The cheese purchasing agreement requires participating domestic franchisees to commit to purchase cheese through PJFS, or to pay the franchisee’s portion of any accumulated cheese liability upon ceasing to purchase cheese from PJFS when a liability exists. Accordingly, beginning in 2011, the consolidation of BIBP, or a similarly structured program, will no longer have a significant impact on our consolidated statements of income. Fair Value Measurements and Disclosures The Fair Value Measurements and Disclosures topic of the Accounting Standards Codification (“ASC”) requires companies to determine fair value based on the price that would be received to sell the asset or paid to transfer the liability to a market participant. The Fair Value Measurements and Disclosures topic emphasizes that fair value is a market-based measurement, not an entity-specific measurement. The new guideline required a phase-in approach: (1) phase one was effective for financial assets and liabilities in our first quarter of 2008 and (2) phase two was effective for non-financial assets and liabilities in our first quarter of fiscal 2009. The new provisions did not have a significant impact on our 2008 or 2009 financial statements.
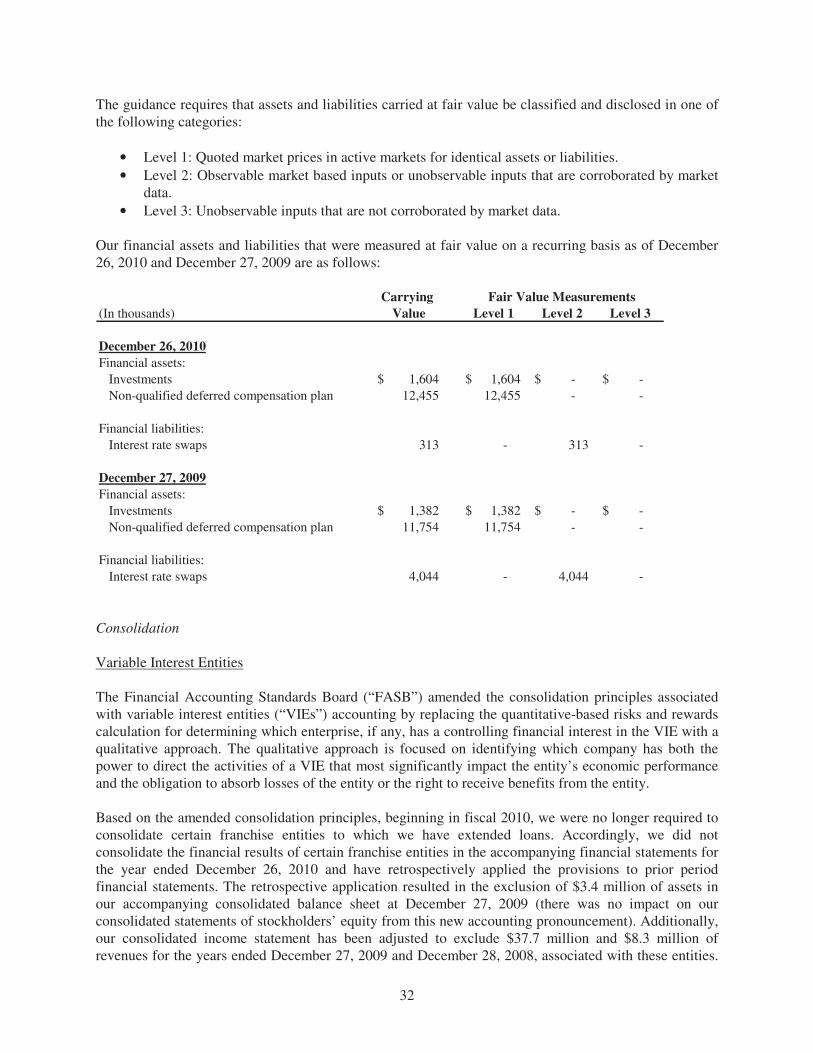
32
The guidance requires that assets and liabilities carried at fair value be classified and disclosed in one of the following categories:
• Level 1: Quoted market prices in active markets for identical assets or liabilities.
• Level 2: Observable market based inputs or unobservable inputs that are corroborated by market data.
• Level 3: Unobservable inputs that are not corroborated by market data.
Our financial assets and liabilities that were measured at fair value on a recurring basis as of December 26, 2010 and December 27, 2009 are as follows:
Carrying
(In thousands) Value Level 1 Level 2 Level 3
December 26, 2010
Financial assets:
Investments 1,604$ 1,604$ -$ -$
Non-qualified deferred compensation plan 12,455 12,455 - -
Financial liabilities:
Interest rate swaps 313 - 313 -
December 27, 2009
Financial assets:
Investments 1,382$ 1,382$ -$ -$
Non-qualified deferred compensation plan 11,754 11,754 - -
Financial liabilities:
Interest rate swaps 4,044 - 4,044 -
Fair Value Measurements
Consolidation
Variable Interest Entities The Financial Accounting Standards Board (“FASB”) amended the consolidation principles associated with variable interest entities (“VIEs”) accounting by replacing the quantitative-based risks and rewards calculation for determining which enterprise, if any, has a controlling financial interest in the VIE with a qualitative approach. The qualitative approach is focused on identifying which company has both the power to direct the activities of a VIE that most significantly impact the entity’s economic performance and the obligation to absorb losses of the entity or the right to receive benefits from the entity. Based on the amended consolidation principles, beginning in fiscal 2010, we were no longer required to consolidate certain franchise entities to which we have extended loans. Accordingly, we did not consolidate the financial results of certain franchise entities in the accompanying financial statements for the year ended December 26, 2010 and have retrospectively applied the provisions to prior period financial statements. The retrospective application resulted in the exclusion of $3.4 million of assets in our accompanying consolidated balance sheet at December 27, 2009 (there was no impact on our consolidated statements of stockholders’ equity from this new accounting pronouncement). Additionally, our consolidated income statement has been adjusted to exclude $37.7 million and $8.3 million of revenues for the years ended December 27, 2009 and December 28, 2008, associated with these entities.
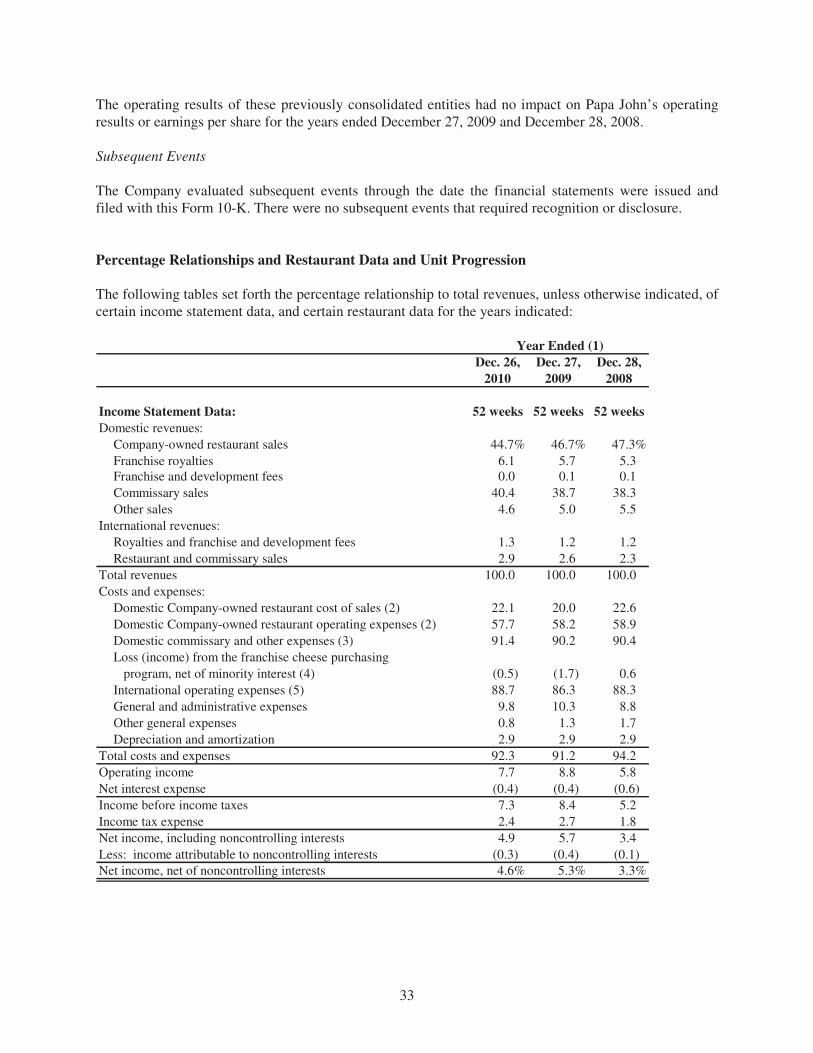
33
The operating results of these previously consolidated entities had no impact on Papa John’s operating results or earnings per share for the years ended December 27, 2009 and December 28, 2008.
Subsequent Events
The Company evaluated subsequent events through the date the financial statements were issued and filed with this Form 10-K. There were no subsequent events that required recognition or disclosure.
Percentage Relationships and Restaurant Data and Unit Progression The following tables set forth the percentage relationship to total revenues, unless otherwise indicated, of certain income statement data, and certain restaurant data for the years indicated:
Year Ended (1)
Dec. 26, Dec. 27, Dec. 28,
2010 2009 2008
Income Statement Data: 52 weeks 52 weeks 52 weeks
Domestic revenues:
Company-owned restaurant sales 44.7% 46.7% 47.3%
Franchise royalties 6.1 5.7 5.3 Franchise and development fees 0.0 0.1 0.1
Commissary sales 40.4 38.7 38.3
Other sales 4.6 5.0 5.5
International revenues:
Royalties and franchise and development fees 1.3 1.2 1.2
Restaurant and commissary sales 2.9 2.6 2.3
Total revenues 100.0 100.0 100.0
Costs and expenses:
Domestic Company-owned restaurant cost of sales (2) 22.1 20.0 22.6
Domestic Company-owned restaurant operating expenses (2) 57.7 58.2 58.9
Domestic commissary and other expenses (3) 91.4 90.2 90.4
Loss (income) from the franchise cheese purchasing
program, net of minority interest (4) (0.5) (1.7) 0.6
International operating expenses (5) 88.7 86.3 88.3
General and administrative expenses 9.8 10.3 8.8
Other general expenses 0.8 1.3 1.7
Depreciation and amortization 2.9 2.9 2.9
Total costs and expenses 92.3 91.2 94.2
Operating income 7.7 8.8 5.8
Net interest expense (0.4) (0.4) (0.6)
Income before income taxes 7.3 8.4 5.2
Income tax expense 2.4 2.7 1.8
Net income, including noncontrolling interests 4.9 5.7 3.4
Less: income attributable to noncontrolling interests (0.3) (0.4) (0.1)
Net income, net of noncontrolling interests 4.6% 5.3% 3.3%

34
Year Ended (1)
Dec. 26, Dec. 27, Dec. 28,
2010 2009 2008
Restaurant Data: 52 weeks 52 weeks 52 weeks
Percentage increase (decrease) in comparable domestic
Company-owned restaurant sales (6) -0.6% -0.5% 1.7%
Number of Company-owned restaurants included in the
most recent full year's comparable restaurant base 578 559 566
Average sales for Company-owned restaurants included
in the most recent comparable restaurant base $863,000 $869,000 $867,000
Papa John's Restaurant Progression:
U.S. Company-owned:
Beginning of period 588 592 648
Opened 5 5 14
Closed (2) (8) (9)
Acquired from franchisees - 11 1
Sold to franchisees - (12) (62)
End of period 591 588 592
International Company-owned:
Beginning of period 26 23 14
Opened 8 4 10
Closed (2) (1) (2)
Acquired from franchisees 1 - 1
Sold to franchisees (12) - -
End of period 21 26 23
U.S. franchised:
Beginning of period 2,193 2,200 2,112
Opened 169 79 98
Closed (82) (87) (71)
Acquired from Company - 12 62
Sold to Company - (11) (1)
End of period (7) 2,280 2,193 2,200
International franchised:
Beginning of period 662 565 434
Opened 143 128 145
Closed (62) (31) (13)
Acquired from Company 12 - -
Sold to Company (1) - (1)
End of period (7) 754 662 565
Total Papa John's restaurants - end of period 3,646 3,469 3,380
(1) We operate on a fiscal year ending on the last Sunday of December of each year. (2) As a percentage of domestic Company-owned restaurant sales. (3) As a percentage of domestic commissary sales and other sales on a combined basis. (4) As a percentage of total Company revenues; the loss (income) is a result of the consolidation of
BIBP, a VIE. The sales reported by BIBP are eliminated in consolidation. (5) As a percentage of international restaurant and commissary sales. (6) Includes only Company-owned restaurants open throughout the periods being compared. (7) Beginning in 2011, we realigned our Hawaii, Alaska and Canadian operations from International to
Domestic franchising (North America Franchising). This realignment will result in an increase of units for domestic franchised restaurants and a corresponding decrease in International franchised restaurants (66 units will be reclassified as of December 27, 2010).
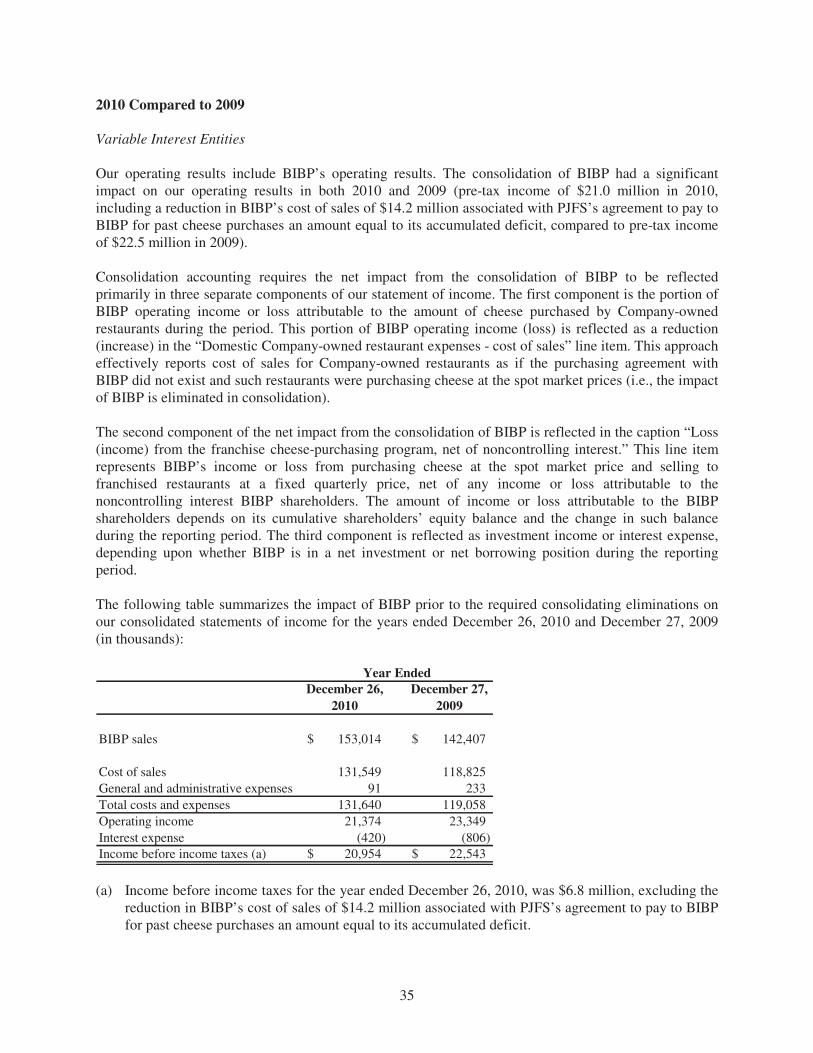
35
2010 Compared to 2009
Variable Interest Entities
Our operating results include BIBP’s operating results. The consolidation of BIBP had a significant impact on our operating results in both 2010 and 2009 (pre-tax income of $21.0 million in 2010, including a reduction in BIBP’s cost of sales of $14.2 million associated with PJFS’s agreement to pay to BIBP for past cheese purchases an amount equal to its accumulated deficit, compared to pre-tax income of $22.5 million in 2009). Consolidation accounting requires the net impact from the consolidation of BIBP to be reflected primarily in three separate components of our statement of income. The first component is the portion of BIBP operating income or loss attributable to the amount of cheese purchased by Company-owned restaurants during the period. This portion of BIBP operating income (loss) is reflected as a reduction (increase) in the “Domestic Company-owned restaurant expenses - cost of sales” line item. This approach effectively reports cost of sales for Company-owned restaurants as if the purchasing agreement with BIBP did not exist and such restaurants were purchasing cheese at the spot market prices (i.e., the impact of BIBP is eliminated in consolidation). The second component of the net impact from the consolidation of BIBP is reflected in the caption “Loss (income) from the franchise cheese-purchasing program, net of noncontrolling interest.” This line item represents BIBP’s income or loss from purchasing cheese at the spot market price and selling to franchised restaurants at a fixed quarterly price, net of any income or loss attributable to the noncontrolling interest BIBP shareholders. The amount of income or loss attributable to the BIBP shareholders depends on its cumulative shareholders’ equity balance and the change in such balance during the reporting period. The third component is reflected as investment income or interest expense, depending upon whether BIBP is in a net investment or net borrowing position during the reporting period. The following table summarizes the impact of BIBP prior to the required consolidating eliminations on our consolidated statements of income for the years ended December 26, 2010 and December 27, 2009 (in thousands):
Year Ended
December 26,
2010
December 27,
2009
BIBP sales 153,014$ 142,407$
Cost of sales 131,549 118,825
General and administrative expenses 91 233
Total costs and expenses 131,640 119,058
Operating income 21,374 23,349
Interest expense (420) (806)
Income before income taxes (a) 20,954$ 22,543$
(a) Income before income taxes for the year ended December 26, 2010, was $6.8 million, excluding the
reduction in BIBP’s cost of sales of $14.2 million associated with PJFS’s agreement to pay to BIBP for past cheese purchases an amount equal to its accumulated deficit.
36
Non-GAAP Measures
The financial measures we present in this report excluding the impact of the consolidation of BIBP are not measures defined within accounting principles generally accepted in the United States (“GAAP”). These non-GAAP measures should not be construed as a substitute for or a better indicator of the Company’s performance than the Company’s GAAP measures. We believe the financial information excluding the impact of the consolidation of BIBP is important for purposes of comparison to prior periods and development of future projections and earnings growth prospects. We analyze our business performance and trends excluding the impact of the consolidation of BIBP because the results of BIBP are not indicative of the principal operating activities of the Company. In addition, annual cash bonuses, and certain long-term incentive programs for various levels of management, are based on financial measures that exclude BIBP. The presentation of the non-GAAP measures in this report is made alongside the most directly comparable GAAP measures.
Summary of Operating Results
The Company follows a fiscal year ending on the last Sunday of December, generally consisting of 52 weeks made up of four 13-week quarters. The 13-week quarters consist of two four-week periods followed by one five-week period. Discussion of Revenues
Total revenues, which increased 4.4% to $1.13 billion in 2010 compared to $1.08 billion in 2009, primarily consisted of the following:
• Franchise royalties revenue increased $7.3 million primarily due to an increase in the royalty rate (the standard royalty rate for the majority of domestic franchise restaurants increased from 4.25% at the beginning of 2009 to 4.50% in September 2009 and increased to 4.75% in the first quarter of 2010).
• Domestic commissary sales increased $36.8 million primarily due to an increase in sales volumes.
• International revenues increased $6.5 million primarily due to an increase in the number of our franchised international restaurants.
The increases noted above were partially offset by a $2.1 million decline in domestic other sales primarily due to a decline in sales at our wholly-owned print and promotions subsidiary, Preferred Marketing Solutions, Inc. (“Preferred”). Additionally, domestic Company-owned restaurant sales decreased approximately $550,000 primarily due to a decrease of 0.6% in comparable sales for domestic Company-owned restaurants for the year. “Comparable sales” represents sales generated by restaurants open for the entire twelve-month period reported.
Discussion of Operating Results
Franchise Support Initiatives The Company provided domestic franchise system support initiatives in response to the difficult economic environment in both 2009 and 2010. The initiatives included:
• Providing cheese cost relief by modifying the cheese pricing formula used by BIBP beginning in 2009;

37
• Providing food cost relief by lowering the commissary margin on certain commodities sold by PJFS to the franchise system and by providing incentive rebate opportunities in 2010 to the franchise system;
• Providing additional system-wide national marketing contributions that amounted to $6.0 million in 2010 and $7.7 million in 2009;
• Providing additional system-wide local print marketing contributions and certain system-wide incentives totaling $500,000 in 2010 and $1.9 million in 2009;
• Providing targeted royalty relief and local marketing support to assist certain identified franchisees or markets, which amounted to $5.1 million in 2010 and $4.7 million in 2009;
• Providing restaurant opening incentives of $1.0 million in 2010 and $400,000 in 2009; and
• Providing financing on a selected basis to assist new or existing franchisees with the acquisition of troubled franchise restaurants.
For 2011, we plan to continue certain domestic franchise support initiatives such as offering incentive programs to franchisees to increase comparable sales, comparable transactions and online sales, make certain re-image improvements to their restaurants and provide targeted royalty relief and local marketing support to assist certain identified franchisees or markets, although our expectation is that the amount of such support initiatives will be reduced from 2010 levels. We believe the support program will mitigate potential unit closures and strengthen our brand during this challenging economic environment. In addition to reducing unit closures, other important objectives of the support program include growing market share in a consolidating category and stabilizing transaction levels. Our income before income taxes, net of noncontrolling interests, totaled $78.8 million in 2010, as compared to $86.4 million in 2009 as summarized in the following table on an operating segment basis (in thousands):
Increase
2010 2009 (Decrease)
Domestic Company-owned restaurants 31,619$ 34,894$ (3,275)$
Domestic commissaries* 14,188 29,393 (15,205)
Domestic franchising 60,908 53,690 7,218
International (3,450) (3,050) (400)
All others 1,847 2,697 (850)
Unallocated corporate expenses (43,266) (49,755) 6,489
Elimination of intersegment profits (519) (218) (301)
Income before income taxes, excluding variable interest entity * 61,327 67,651 (6,324)
BIBP, a variable interest entity * 20,954 22,543 (1,589)
Total income before income taxes 82,281 90,194 (7,913)
Income attributable to noncontrolling interests (3,485) (3,756) 271
Total income before income taxes, net of noncontrolling interests 78,796$ 86,438$ (7,642)$
*The full-year 2010 results for domestic commissaries were reduced by $14.2 million and the full-year 2010 results for BIBP were increased by $14.2 million associated with PJFS’s agreement to pay to BIBP for past cheese purchases an amount equal to its accumulated deficit at December 26, 2010. There was no impact on the consolidated results of operations since PJFS and BIBP are fully consolidated into the Company’s results.

38
Excluding the impact of the consolidation of BIBP (pre-tax income of $6.8 million, excluding the reduction in BIBP’s cost of sales of $14.2 million associated with PJFS’s agreement to pay to BIBP for past cheese purchases an amount equal to its accumulated deficit, or $0.16 per diluted share in 2010, and pre-tax income of $22.5 million or $0.52 per diluted share in 2009), 2010 income before income taxes, net of noncontrolling interests, was $72.0 million (6.4% of total revenues), compared to $63.9 million (5.9% of total revenues) in 2009. The $8.1 million increase in income before income taxes, net of noncontrolling interests (excluding the consolidation of BIBP), was principally due to the following:
• Domestic Company-owned Restaurant Segment. Domestic Company-owned restaurants’ operating income decreased $3.3 million from the prior comparable period. The decrease was primarily due to a decline in operating margin from lower average ticket prices due to increased levels of discounting, partially offset by increased customer traffic and reductions in labor costs as a result of labor efficiencies from implemented initiatives. The 2009 period included restaurant closure costs of approximately $700,000. There were no significant closure costs in 2010. Restaurant operating margin as externally reported was 20.2% in 2010 compared to 21.8% in 2009. Excluding the impact of the consolidation of BIBP, restaurant operating margin was 19.9% in 2010 compared to 20.7% in 2009. The decline in operating margin was due to increased levels of discounting.
• Domestic Commissary Segment. Domestic commissaries’ operating income decreased $15.2 million in 2010 over the prior year, comprised of the following (in thousands):
Year Ended
December 26,
2010
Year Ended
December 27,
2009 Decrease
Operating income before the increase in cost of sales -
BIBP agreement 28,338$ 29,393$ (1,055)$
Increase in costs of sales - BIBP agreement (14,150) - (14,150)
Total segment operating income 14,188$ 29,393$ (15,205)$
Domestic commissaries’ operating income, excluding the increase in cost of sales of $14.2 million associated with the agreement to pay BIBP for past cheese purchases in an amount equal to its accumulated deficit, was $28.3 million in 2010, as compared to $29.4 million in 2009. The decrease of $1.1 million in operating income was primarily due to increased fuel costs, partially offset by an increase in sales volumes, although at a lower gross margin percentage. The full-year 2010 gross margin percentage included the impact of commodities cost increases we absorbed for certain vegetable products resulting from harsh Florida winter weather and various rebate programs available to restaurants for achieving certain sales improvement targets. Full-year 2009 included approximately $800,000 of management transition costs and $400,000 of costs associated with the closure of one of our commissaries.
• Domestic Franchising Segment. Domestic franchising operating income increased approximately $7.2 million to $60.9 million in 2010, from $53.7 million in 2009. The increase was primarily due to an increase in franchise royalties (the standard royalty rate increased from 4.25% to 4.50% in September 2009, and increased to 4.75% in the first quarter of 2010). The impact of the royalty rate increase was partially offset by the impact of development incentive programs offered by the Company in 2009 and 2010. Franchise and development fees were
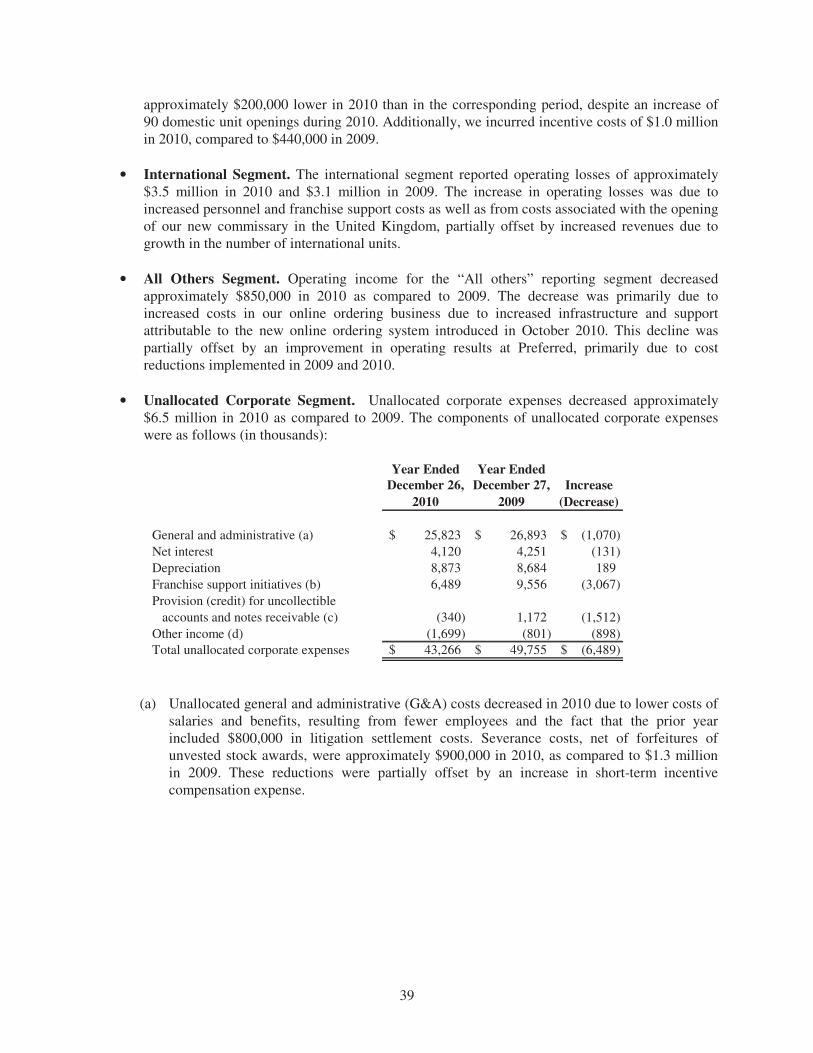
39
approximately $200,000 lower in 2010 than in the corresponding period, despite an increase of 90 domestic unit openings during 2010. Additionally, we incurred incentive costs of $1.0 million in 2010, compared to $440,000 in 2009.
• International Segment. The international segment reported operating losses of approximately $3.5 million in 2010 and $3.1 million in 2009. The increase in operating losses was due to increased personnel and franchise support costs as well as from costs associated with the opening of our new commissary in the United Kingdom, partially offset by increased revenues due to growth in the number of international units.
• All Others Segment. Operating income for the “All others” reporting segment decreased approximately $850,000 in 2010 as compared to 2009. The decrease was primarily due to increased costs in our online ordering business due to increased infrastructure and support attributable to the new online ordering system introduced in October 2010. This decline was partially offset by an improvement in operating results at Preferred, primarily due to cost reductions implemented in 2009 and 2010.
• Unallocated Corporate Segment. Unallocated corporate expenses decreased approximately $6.5 million in 2010 as compared to 2009. The components of unallocated corporate expenses were as follows (in thousands):
Year Ended Year Ended
December 26,
2010
December 27,
2009
Increase
(Decrease)
General and administrative (a) 25,823$ 26,893$ (1,070)$
Net interest 4,120 4,251 (131)
Depreciation 8,873 8,684 189
Franchise support initiatives (b) 6,489 9,556 (3,067)
Provision (credit) for uncollectible
accounts and notes receivable (c) (340) 1,172 (1,512)
Other income (d) (1,699) (801) (898)
Total unallocated corporate expenses 43,266$ 49,755$ (6,489)$
(a) Unallocated general and administrative (G&A) costs decreased in 2010 due to lower costs of
salaries and benefits, resulting from fewer employees and the fact that the prior year included $800,000 in litigation settlement costs. Severance costs, net of forfeitures of unvested stock awards, were approximately $900,000 in 2010, as compared to $1.3 million in 2009. These reductions were partially offset by an increase in short-term incentive compensation expense.
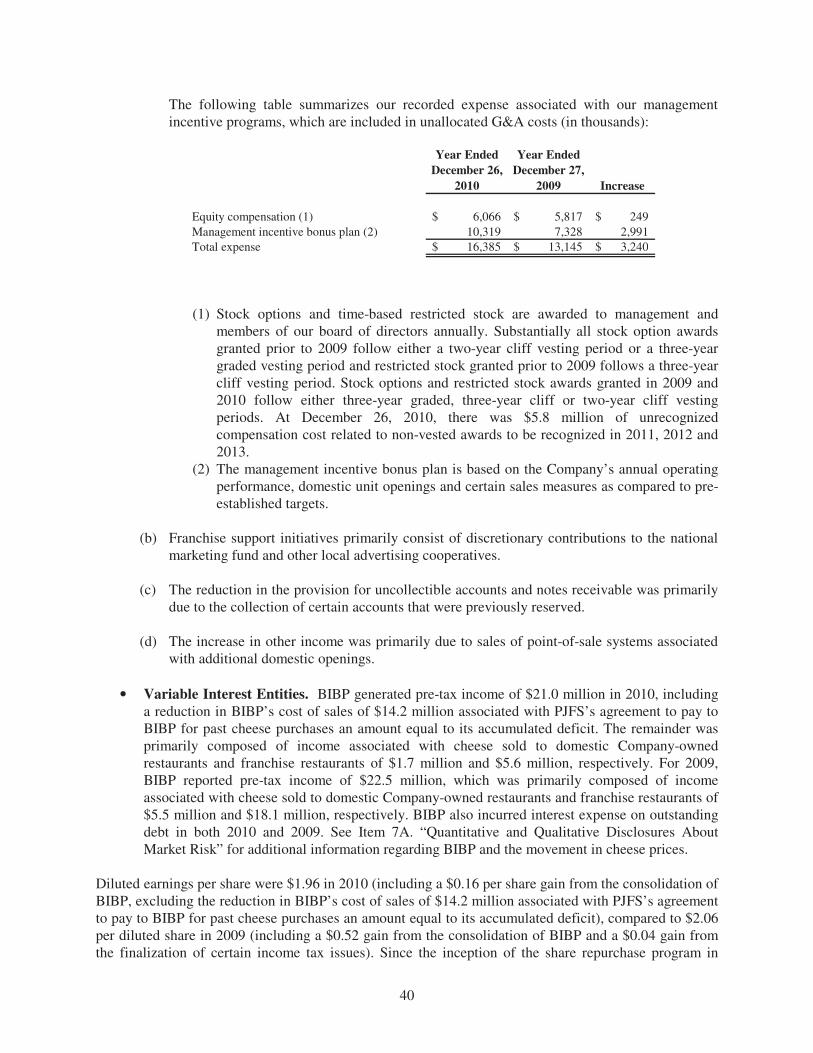
40
The following table summarizes our recorded expense associated with our management incentive programs, which are included in unallocated G&A costs (in thousands):
Year Ended
December 26,
2010
Year Ended
December 27,
2009 Increase
Equity compensation (1) 6,066$ 5,817$ 249$
Management incentive bonus plan (2) 10,319 7,328 2,991
Total expense 16,385$ 13,145$ 3,240$
(1) Stock options and time-based restricted stock are awarded to management and
members of our board of directors annually. Substantially all stock option awards granted prior to 2009 follow either a two-year cliff vesting period or a three-year graded vesting period and restricted stock granted prior to 2009 follows a three-year cliff vesting period. Stock options and restricted stock awards granted in 2009 and 2010 follow either three-year graded, three-year cliff or two-year cliff vesting periods. At December 26, 2010, there was $5.8 million of unrecognized compensation cost related to non-vested awards to be recognized in 2011, 2012 and 2013.
(2) The management incentive bonus plan is based on the Company’s annual operating performance, domestic unit openings and certain sales measures as compared to pre-established targets.
(b) Franchise support initiatives primarily consist of discretionary contributions to the national
marketing fund and other local advertising cooperatives. (c) The reduction in the provision for uncollectible accounts and notes receivable was primarily
due to the collection of certain accounts that were previously reserved.
(d) The increase in other income was primarily due to sales of point-of-sale systems associated with additional domestic openings.
• Variable Interest Entities. BIBP generated pre-tax income of $21.0 million in 2010, including a reduction in BIBP’s cost of sales of $14.2 million associated with PJFS’s agreement to pay to BIBP for past cheese purchases an amount equal to its accumulated deficit. The remainder was primarily composed of income associated with cheese sold to domestic Company-owned restaurants and franchise restaurants of $1.7 million and $5.6 million, respectively. For 2009, BIBP reported pre-tax income of $22.5 million, which was primarily composed of income associated with cheese sold to domestic Company-owned restaurants and franchise restaurants of $5.5 million and $18.1 million, respectively. BIBP also incurred interest expense on outstanding debt in both 2010 and 2009. See Item 7A. “Quantitative and Qualitative Disclosures About Market Risk” for additional information regarding BIBP and the movement in cheese prices.
Diluted earnings per share were $1.96 in 2010 (including a $0.16 per share gain from the consolidation of BIBP, excluding the reduction in BIBP’s cost of sales of $14.2 million associated with PJFS’s agreement to pay to BIBP for past cheese purchases an amount equal to its accumulated deficit), compared to $2.06 per diluted share in 2009 (including a $0.52 gain from the consolidation of BIBP and a $0.04 gain from the finalization of certain income tax issues). Since the inception of the share repurchase program in
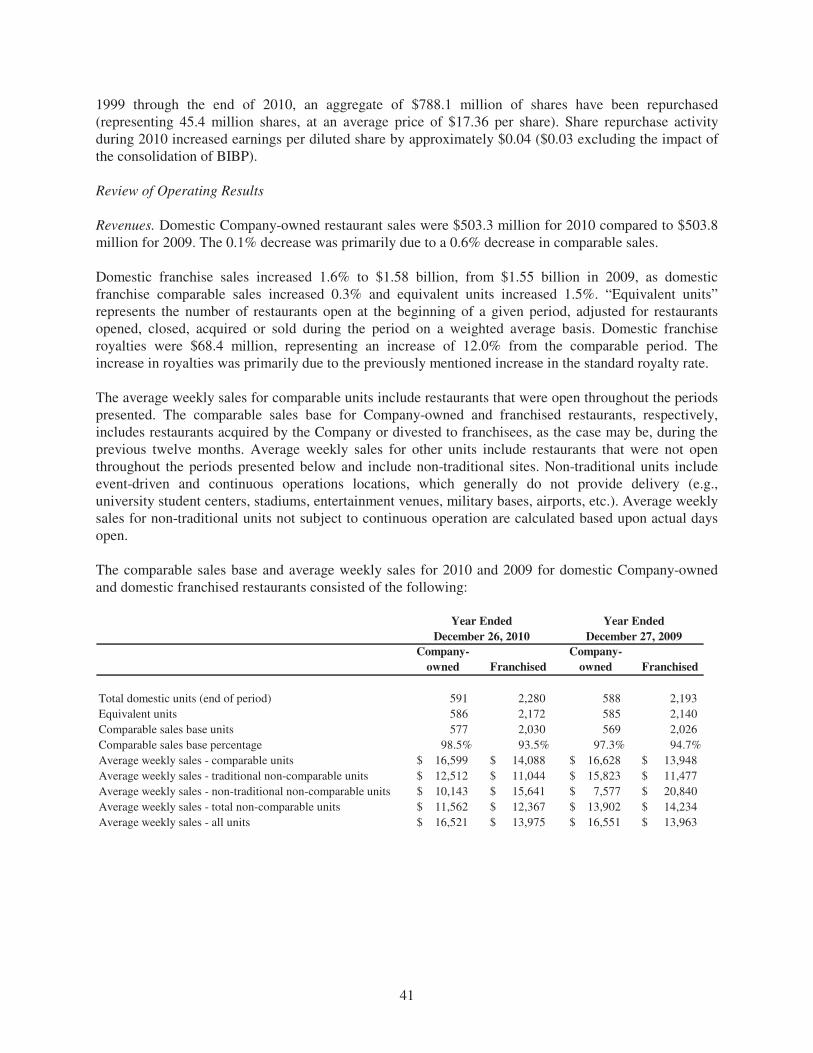
41
1999 through the end of 2010, an aggregate of $788.1 million of shares have been repurchased (representing 45.4 million shares, at an average price of $17.36 per share). Share repurchase activity during 2010 increased earnings per diluted share by approximately $0.04 ($0.03 excluding the impact of the consolidation of BIBP). Review of Operating Results
Revenues. Domestic Company-owned restaurant sales were $503.3 million for 2010 compared to $503.8 million for 2009. The 0.1% decrease was primarily due to a 0.6% decrease in comparable sales. Domestic franchise sales increased 1.6% to $1.58 billion, from $1.55 billion in 2009, as domestic franchise comparable sales increased 0.3% and equivalent units increased 1.5%. “Equivalent units” represents the number of restaurants open at the beginning of a given period, adjusted for restaurants opened, closed, acquired or sold during the period on a weighted average basis. Domestic franchise royalties were $68.4 million, representing an increase of 12.0% from the comparable period. The increase in royalties was primarily due to the previously mentioned increase in the standard royalty rate. The average weekly sales for comparable units include restaurants that were open throughout the periods presented. The comparable sales base for Company-owned and franchised restaurants, respectively, includes restaurants acquired by the Company or divested to franchisees, as the case may be, during the previous twelve months. Average weekly sales for other units include restaurants that were not open throughout the periods presented below and include non-traditional sites. Non-traditional units include event-driven and continuous operations locations, which generally do not provide delivery (e.g., university student centers, stadiums, entertainment venues, military bases, airports, etc.). Average weekly sales for non-traditional units not subject to continuous operation are calculated based upon actual days open. The comparable sales base and average weekly sales for 2010 and 2009 for domestic Company-owned and domestic franchised restaurants consisted of the following:
Company-
owned Franchised
Company-
owned Franchised
Total domestic units (end of period) 591 2,280 588 2,193
Equivalent units 586 2,172 585 2,140
Comparable sales base units 577 2,030 569 2,026
Comparable sales base percentage 98.5% 93.5% 97.3% 94.7%
Average weekly sales - comparable units 16,599$ 14,088$ 16,628$ 13,948$
Average weekly sales - traditional non-comparable units 12,512$ 11,044$ 15,823$ 11,477$
Average weekly sales - non-traditional non-comparable units 10,143$ 15,641$ 7,577$ 20,840$
Average weekly sales - total non-comparable units 11,562$ 12,367$ 13,902$ 14,234$
Average weekly sales - all units 16,521$ 13,975$ 16,551$ 13,963$
Year Ended Year Ended
December 26, 2010 December 27, 2009
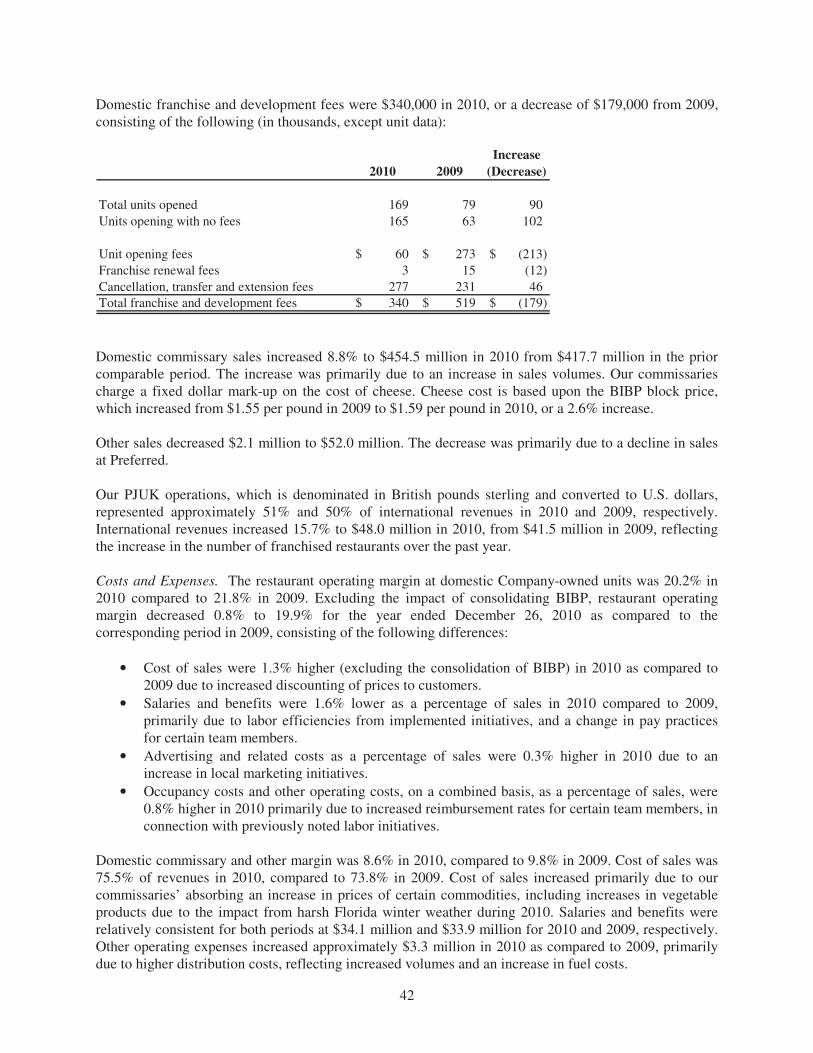
42
Domestic franchise and development fees were $340,000 in 2010, or a decrease of $179,000 from 2009, consisting of the following (in thousands, except unit data):
2010 2009
Increase
(Decrease)
Total units opened 169 79 90
Units opening with no fees 165 63 102
Unit opening fees 60$ 273$ (213)$
Franchise renewal fees 3 15 (12)
Cancellation, transfer and extension fees 277 231 46
Total franchise and development fees 340$ 519$ (179)$
Domestic commissary sales increased 8.8% to $454.5 million in 2010 from $417.7 million in the prior comparable period. The increase was primarily due to an increase in sales volumes. Our commissaries charge a fixed dollar mark-up on the cost of cheese. Cheese cost is based upon the BIBP block price, which increased from $1.55 per pound in 2009 to $1.59 per pound in 2010, or a 2.6% increase. Other sales decreased $2.1 million to $52.0 million. The decrease was primarily due to a decline in sales at Preferred. Our PJUK operations, which is denominated in British pounds sterling and converted to U.S. dollars, represented approximately 51% and 50% of international revenues in 2010 and 2009, respectively. International revenues increased 15.7% to $48.0 million in 2010, from $41.5 million in 2009, reflecting the increase in the number of franchised restaurants over the past year. Costs and Expenses. The restaurant operating margin at domestic Company-owned units was 20.2% in 2010 compared to 21.8% in 2009. Excluding the impact of consolidating BIBP, restaurant operating margin decreased 0.8% to 19.9% for the year ended December 26, 2010 as compared to the corresponding period in 2009, consisting of the following differences:
• Cost of sales were 1.3% higher (excluding the consolidation of BIBP) in 2010 as compared to 2009 due to increased discounting of prices to customers.
• Salaries and benefits were 1.6% lower as a percentage of sales in 2010 compared to 2009, primarily due to labor efficiencies from implemented initiatives, and a change in pay practices for certain team members.
• Advertising and related costs as a percentage of sales were 0.3% higher in 2010 due to an increase in local marketing initiatives.
• Occupancy costs and other operating costs, on a combined basis, as a percentage of sales, were 0.8% higher in 2010 primarily due to increased reimbursement rates for certain team members, in connection with previously noted labor initiatives.
Domestic commissary and other margin was 8.6% in 2010, compared to 9.8% in 2009. Cost of sales was 75.5% of revenues in 2010, compared to 73.8% in 2009. Cost of sales increased primarily due to our commissaries’ absorbing an increase in prices of certain commodities, including increases in vegetable products due to the impact from harsh Florida winter weather during 2010. Salaries and benefits were relatively consistent for both periods at $34.1 million and $33.9 million for 2010 and 2009, respectively. Other operating expenses increased approximately $3.3 million in 2010 as compared to 2009, primarily due to higher distribution costs, reflecting increased volumes and an increase in fuel costs.
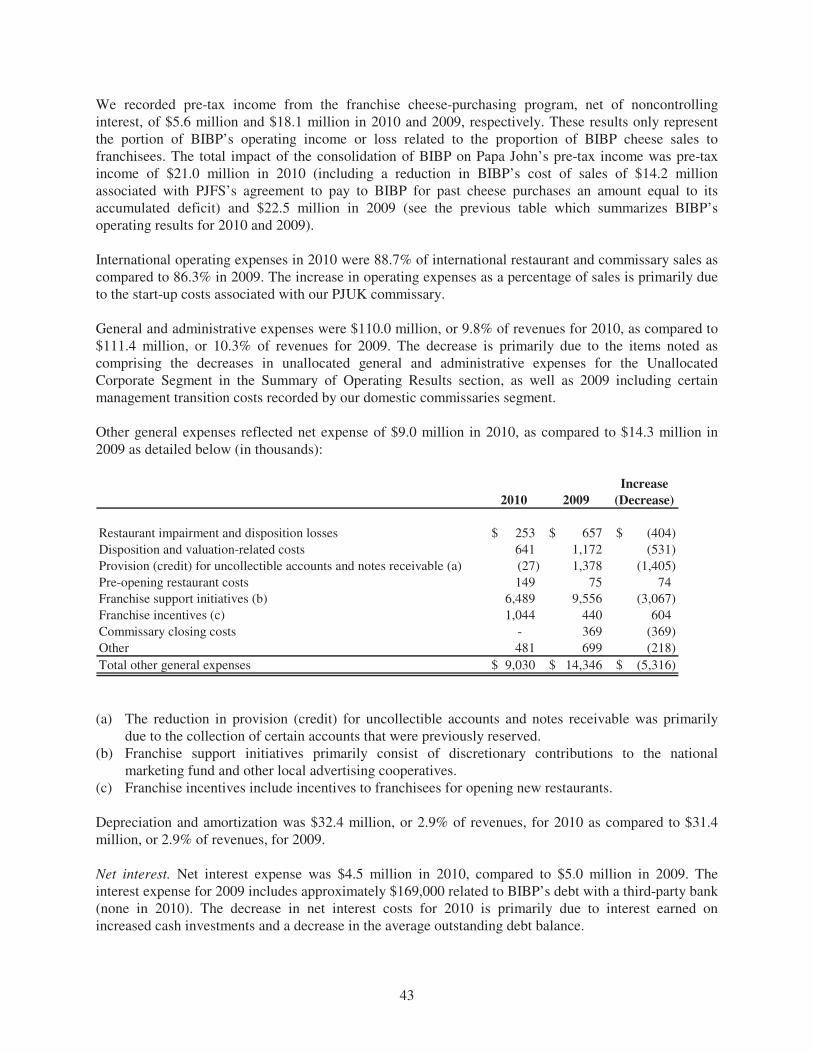
43
We recorded pre-tax income from the franchise cheese-purchasing program, net of noncontrolling interest, of $5.6 million and $18.1 million in 2010 and 2009, respectively. These results only represent the portion of BIBP’s operating income or loss related to the proportion of BIBP cheese sales to franchisees. The total impact of the consolidation of BIBP on Papa John’s pre-tax income was pre-tax income of $21.0 million in 2010 (including a reduction in BIBP’s cost of sales of $14.2 million associated with PJFS’s agreement to pay to BIBP for past cheese purchases an amount equal to its accumulated deficit) and $22.5 million in 2009 (see the previous table which summarizes BIBP’s operating results for 2010 and 2009). International operating expenses in 2010 were 88.7% of international restaurant and commissary sales as compared to 86.3% in 2009. The increase in operating expenses as a percentage of sales is primarily due to the start-up costs associated with our PJUK commissary. General and administrative expenses were $110.0 million, or 9.8% of revenues for 2010, as compared to $111.4 million, or 10.3% of revenues for 2009. The decrease is primarily due to the items noted as comprising the decreases in unallocated general and administrative expenses for the Unallocated Corporate Segment in the Summary of Operating Results section, as well as 2009 including certain management transition costs recorded by our domestic commissaries segment. Other general expenses reflected net expense of $9.0 million in 2010, as compared to $14.3 million in 2009 as detailed below (in thousands):
Increase
2010 2009 (Decrease)
Restaurant impairment and disposition losses 253$ 657$ (404)$
Disposition and valuation-related costs 641 1,172 (531)
Provision (credit) for uncollectible accounts and notes receivable (a) (27) 1,378 (1,405)
Pre-opening restaurant costs 149 75 74
Franchise support initiatives (b) 6,489 9,556 (3,067)
Franchise incentives (c) 1,044 440 604
Commissary closing costs - 369 (369)
Other 481 699 (218)
Total other general expenses 9,030$ 14,346$ (5,316)$
(a) The reduction in provision (credit) for uncollectible accounts and notes receivable was primarily
due to the collection of certain accounts that were previously reserved. (b) Franchise support initiatives primarily consist of discretionary contributions to the national
marketing fund and other local advertising cooperatives. (c) Franchise incentives include incentives to franchisees for opening new restaurants. Depreciation and amortization was $32.4 million, or 2.9% of revenues, for 2010 as compared to $31.4 million, or 2.9% of revenues, for 2009. Net interest. Net interest expense was $4.5 million in 2010, compared to $5.0 million in 2009. The interest expense for 2009 includes approximately $169,000 related to BIBP’s debt with a third-party bank (none in 2010). The decrease in net interest costs for 2010 is primarily due to interest earned on increased cash investments and a decrease in the average outstanding debt balance.
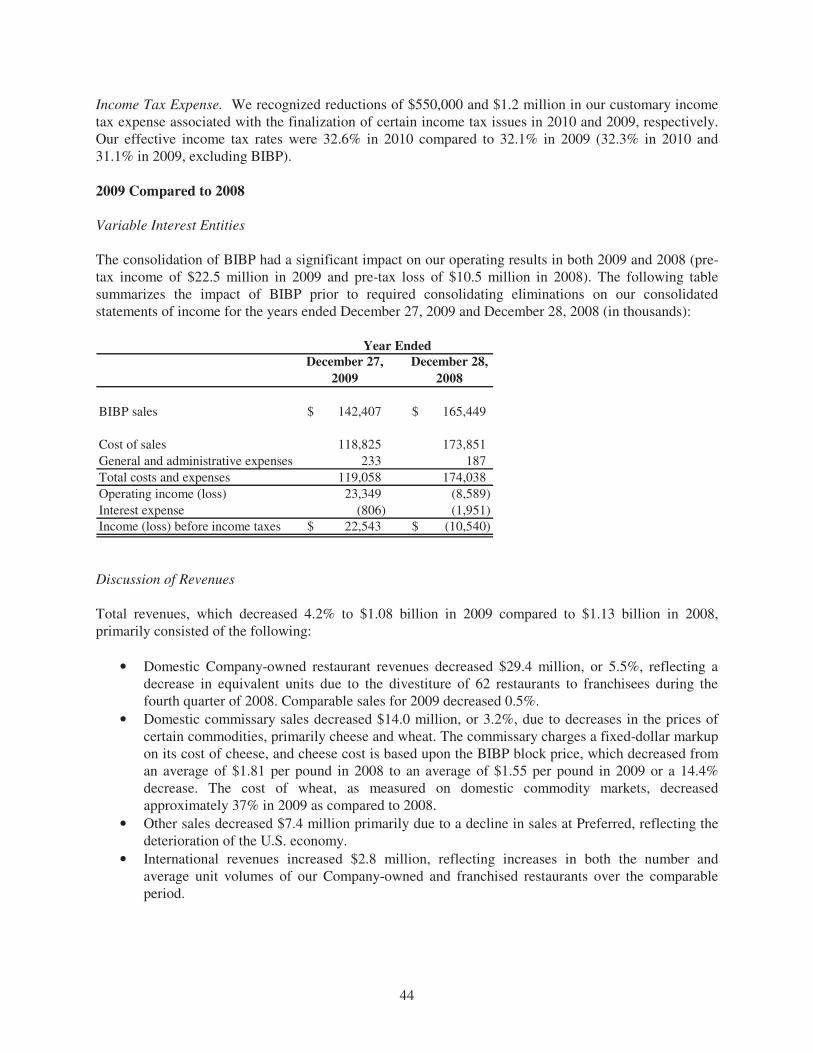
44
Income Tax Expense. We recognized reductions of $550,000 and $1.2 million in our customary income tax expense associated with the finalization of certain income tax issues in 2010 and 2009, respectively. Our effective income tax rates were 32.6% in 2010 compared to 32.1% in 2009 (32.3% in 2010 and 31.1% in 2009, excluding BIBP).
2009 Compared to 2008
Variable Interest Entities
The consolidation of BIBP had a significant impact on our operating results in both 2009 and 2008 (pre-tax income of $22.5 million in 2009 and pre-tax loss of $10.5 million in 2008). The following table summarizes the impact of BIBP prior to required consolidating eliminations on our consolidated statements of income for the years ended December 27, 2009 and December 28, 2008 (in thousands):
Year Ended
December 27,
2009
December 28,
2008
BIBP sales 142,407$ 165,449$
Cost of sales 118,825 173,851
General and administrative expenses 233 187
Total costs and expenses 119,058 174,038
Operating income (loss) 23,349 (8,589)
Interest expense (806) (1,951)
Income (loss) before income taxes 22,543$ (10,540)$
Discussion of Revenues
Total revenues, which decreased 4.2% to $1.08 billion in 2009 compared to $1.13 billion in 2008, primarily consisted of the following:
• Domestic Company-owned restaurant revenues decreased $29.4 million, or 5.5%, reflecting a decrease in equivalent units due to the divestiture of 62 restaurants to franchisees during the fourth quarter of 2008. Comparable sales for 2009 decreased 0.5%.
• Domestic commissary sales decreased $14.0 million, or 3.2%, due to decreases in the prices of certain commodities, primarily cheese and wheat. The commissary charges a fixed-dollar markup on its cost of cheese, and cheese cost is based upon the BIBP block price, which decreased from an average of $1.81 per pound in 2008 to an average of $1.55 per pound in 2009 or a 14.4% decrease. The cost of wheat, as measured on domestic commodity markets, decreased approximately 37% in 2009 as compared to 2008.
• Other sales decreased $7.4 million primarily due to a decline in sales at Preferred, reflecting the deterioration of the U.S. economy.
• International revenues increased $2.8 million, reflecting increases in both the number and average unit volumes of our Company-owned and franchised restaurants over the comparable period.
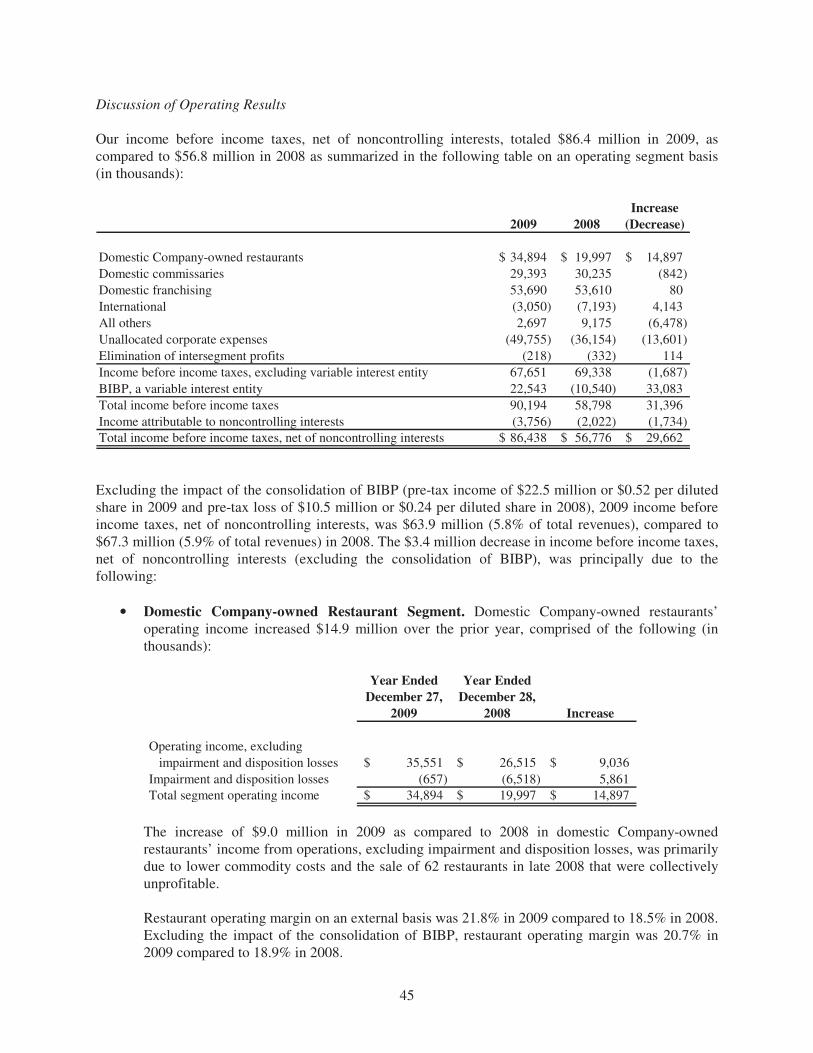
45
Discussion of Operating Results
Our income before income taxes, net of noncontrolling interests, totaled $86.4 million in 2009, as compared to $56.8 million in 2008 as summarized in the following table on an operating segment basis (in thousands):
Increase
2009 2008 (Decrease)
Domestic Company-owned restaurants 34,894$ 19,997$ 14,897$
Domestic commissaries 29,393 30,235 (842)
Domestic franchising 53,690 53,610 80
International (3,050) (7,193) 4,143
All others 2,697 9,175 (6,478)
Unallocated corporate expenses (49,755) (36,154) (13,601)
Elimination of intersegment profits (218) (332) 114
Income before income taxes, excluding variable interest entity 67,651 69,338 (1,687)
BIBP, a variable interest entity 22,543 (10,540) 33,083
Total income before income taxes 90,194 58,798 31,396
Income attributable to noncontrolling interests (3,756) (2,022) (1,734)
Total income before income taxes, net of noncontrolling interests 86,438$ 56,776$ 29,662$
Excluding the impact of the consolidation of BIBP (pre-tax income of $22.5 million or $0.52 per diluted share in 2009 and pre-tax loss of $10.5 million or $0.24 per diluted share in 2008), 2009 income before income taxes, net of noncontrolling interests, was $63.9 million (5.8% of total revenues), compared to $67.3 million (5.9% of total revenues) in 2008. The $3.4 million decrease in income before income taxes, net of noncontrolling interests (excluding the consolidation of BIBP), was principally due to the following:
• Domestic Company-owned Restaurant Segment. Domestic Company-owned restaurants’ operating income increased $14.9 million over the prior year, comprised of the following (in thousands):
Year Ended Year Ended
December 27, December 28,
2009 2008 Increase
Operating income, excluding
impairment and disposition losses 35,551$ 26,515$ 9,036$
Impairment and disposition losses (657) (6,518) 5,861
Total segment operating income 34,894$ 19,997$ 14,897$
The increase of $9.0 million in 2009 as compared to 2008 in domestic Company-owned restaurants’ income from operations, excluding impairment and disposition losses, was primarily due to lower commodity costs and the sale of 62 restaurants in late 2008 that were collectively unprofitable. Restaurant operating margin on an external basis was 21.8% in 2009 compared to 18.5% in 2008. Excluding the impact of the consolidation of BIBP, restaurant operating margin was 20.7% in 2009 compared to 18.9% in 2008.

46
The restaurant impairment and disposition losses recorded in 2008 primarily relate to the above-mentioned sale of restaurants.
• Domestic Commissary Segment. Domestic commissaries’ operating income decreased approximately $800,000 in 2009 as compared to 2008. The decline in operating income was primarily due to pricing reductions, $800,000 of management transition costs and $400,000 of costs associated with the closing of one of our commissaries. The decline in our operating income due to these factors was substantially offset by a decline in fuel costs for 2009.
• Domestic Franchising Segment. Domestic franchising operating income increased approximately $100,000 to $53.7 million for the year ended December 27, 2009, from $53.6 million in the prior comparable period. The increase was primarily due to an increase in franchise royalties resulting from a 0.25% increase in the royalty rate effective in the last four months of 2009.
The increase associated with royalties was substantially offset by lower franchise and development fees due to fewer unit openings in 2009 and $500,000 in franchise renewal fees collected in 2008 in connection with the domestic franchise renewal program that were not replicated in 2009. The impact of the increased royalty rate for 2009 was also offset partially by additional development incentive programs offered by the Company in 2009. During 2009, incentive payments of $440,000 were made to certain franchisees under our 25th Anniversary development incentive program for opening new units in advance of previously scheduled dates.
• International Segment. The international segment reported an operating loss of $3.1 million in 2009 as compared to a loss of $7.2 million in 2008, comprised of the following (in thousands):
Year Ended Year Ended
December 27, December 28, Increase
2009 2008 (Decrease)
Operating income, excluding goodwill
impairment and other charges (2,586)$ (4,893)$ 2,307$
Goodwill impairment (a) - (2,300) 2,300
Other (b) (464) - (464)
Total segment operating loss (3,050)$ (7,193)$ 4,143$
(a) The goodwill impairment charge was associated with our United Kingdom
operations.
(b) Included pre-opening costs in 2009 associated with our commissary in the
United Kingdom that was under construction and costs associated with the
closure of a Company-owned restaurant in China.
The improvement in operating losses, excluding goodwill impairment and other charges, reflects increased revenues due to growth in number of units and unit volumes.
• All Others Segment. Operating income for the “All others” reporting segment decreased approximately $6.5 million for the year ended December 27, 2009, as compared to the corresponding 2008 period. The decrease was primarily due to a $3.9 million decline in profitability in our online ordering system business, a $1.3 million decline at Preferred, and due to the 2008 period including more favorable adjustments in claims loss reserves associated with
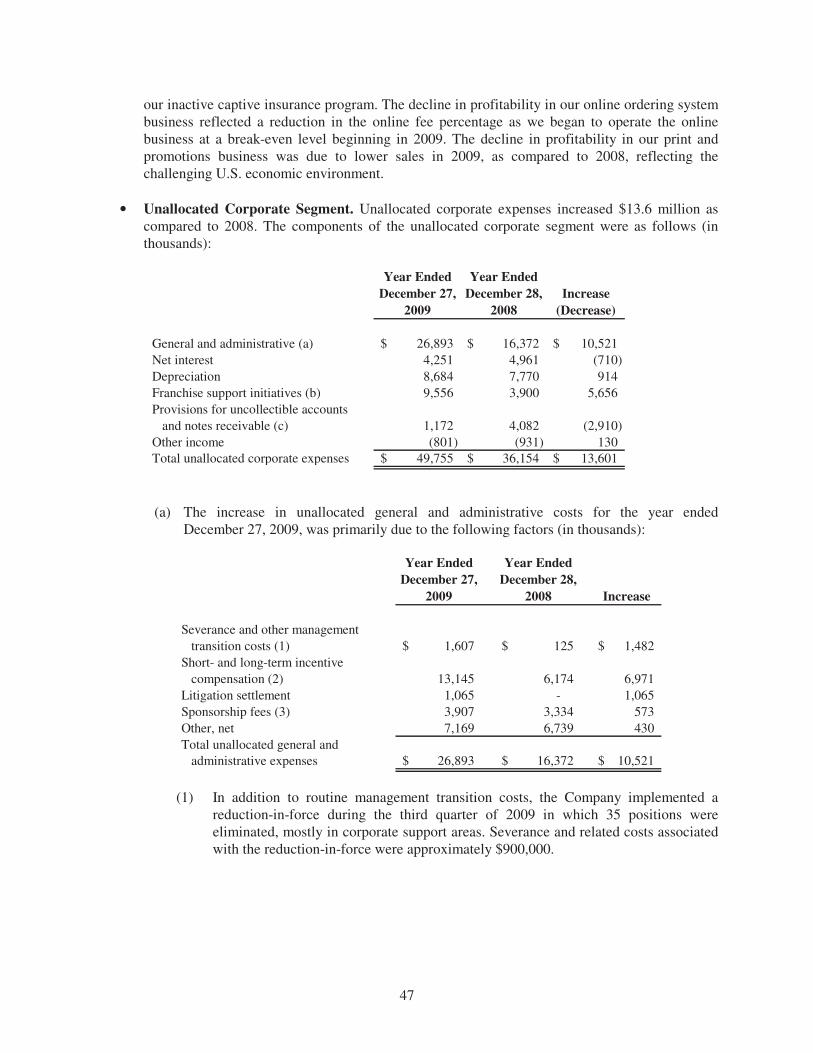
47
our inactive captive insurance program. The decline in profitability in our online ordering system business reflected a reduction in the online fee percentage as we began to operate the online business at a break-even level beginning in 2009. The decline in profitability in our print and promotions business was due to lower sales in 2009, as compared to 2008, reflecting the challenging U.S. economic environment.
• Unallocated Corporate Segment. Unallocated corporate expenses increased $13.6 million as compared to 2008. The components of the unallocated corporate segment were as follows (in thousands):
Year Ended
December 27,
2009
Year Ended
December 28,
2008
Increase
(Decrease)
General and administrative (a) 26,893$ 16,372$ 10,521$
Net interest 4,251 4,961 (710)
Depreciation 8,684 7,770 914
Franchise support initiatives (b) 9,556 3,900 5,656
Provisions for uncollectible accounts
and notes receivable (c) 1,172 4,082 (2,910)
Other income (801) (931) 130
Total unallocated corporate expenses 49,755$ 36,154$ 13,601$
(a) The increase in unallocated general and administrative costs for the year ended December 27, 2009, was primarily due to the following factors (in thousands):
Year Ended
December 27,
2009
Year Ended
December 28,
2008 Increase
Severance and other management
transition costs (1) 1,607$ 125$ 1,482$
Short- and long-term incentive
compensation (2) 13,145 6,174 6,971
Litigation settlement 1,065 - 1,065
Sponsorship fees (3) 3,907 3,334 573
Other, net 7,169 6,739 430
Total unallocated general and
administrative expenses 26,893$ 16,372$ 10,521$
(1) In addition to routine management transition costs, the Company implemented a
reduction-in-force during the third quarter of 2009 in which 35 positions were eliminated, mostly in corporate support areas. Severance and related costs associated with the reduction-in-force were approximately $900,000.
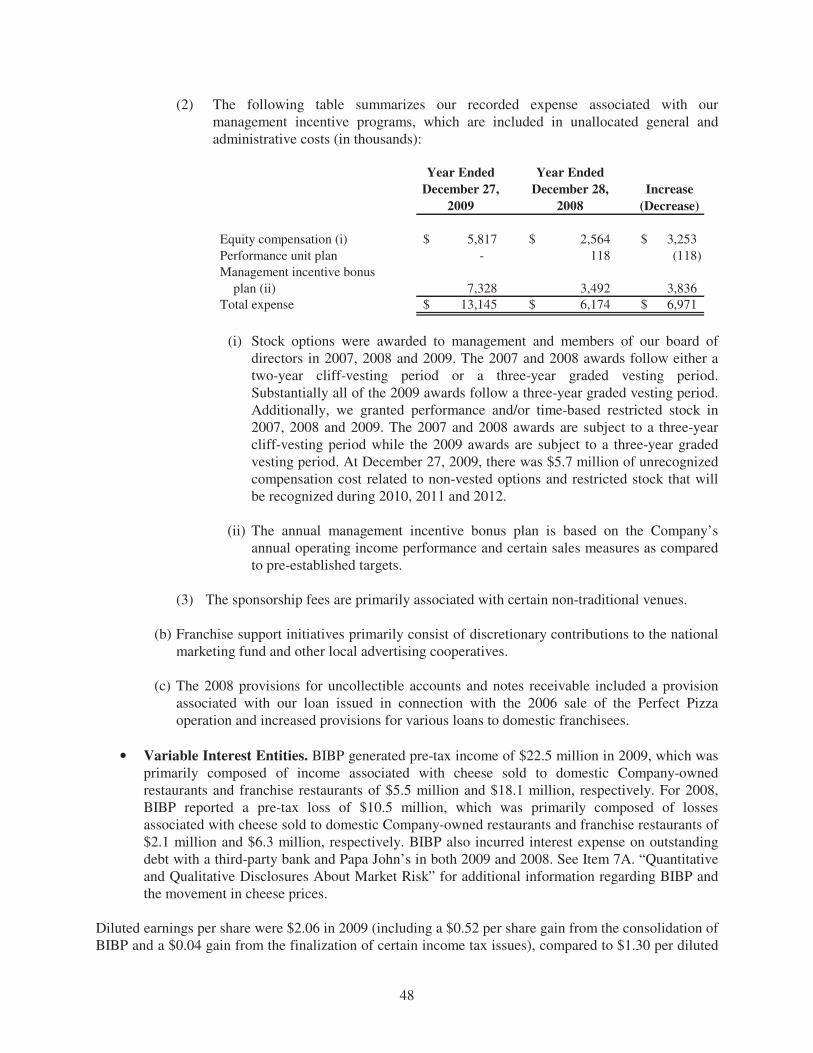
48
(2) The following table summarizes our recorded expense associated with our management incentive programs, which are included in unallocated general and administrative costs (in thousands):
Year Ended
December 27,
2009
Year Ended
December 28,
2008
Increase
(Decrease)
Equity compensation (i) 5,817$ 2,564$ 3,253$
Performance unit plan - 118 (118)
Management incentive bonus
plan (ii) 7,328 3,492 3,836
Total expense 13,145$ 6,174$ 6,971$
(i) Stock options were awarded to management and members of our board of
directors in 2007, 2008 and 2009. The 2007 and 2008 awards follow either a two-year cliff-vesting period or a three-year graded vesting period. Substantially all of the 2009 awards follow a three-year graded vesting period. Additionally, we granted performance and/or time-based restricted stock in 2007, 2008 and 2009. The 2007 and 2008 awards are subject to a three-year cliff-vesting period while the 2009 awards are subject to a three-year graded vesting period. At December 27, 2009, there was $5.7 million of unrecognized compensation cost related to non-vested options and restricted stock that will be recognized during 2010, 2011 and 2012.
(ii) The annual management incentive bonus plan is based on the Company’s
annual operating income performance and certain sales measures as compared to pre-established targets.
(3) The sponsorship fees are primarily associated with certain non-traditional venues.
(b) Franchise support initiatives primarily consist of discretionary contributions to the national marketing fund and other local advertising cooperatives.
(c) The 2008 provisions for uncollectible accounts and notes receivable included a provision
associated with our loan issued in connection with the 2006 sale of the Perfect Pizza operation and increased provisions for various loans to domestic franchisees.
• Variable Interest Entities. BIBP generated pre-tax income of $22.5 million in 2009, which was primarily composed of income associated with cheese sold to domestic Company-owned restaurants and franchise restaurants of $5.5 million and $18.1 million, respectively. For 2008, BIBP reported a pre-tax loss of $10.5 million, which was primarily composed of losses associated with cheese sold to domestic Company-owned restaurants and franchise restaurants of $2.1 million and $6.3 million, respectively. BIBP also incurred interest expense on outstanding debt with a third-party bank and Papa John’s in both 2009 and 2008. See Item 7A. “Quantitative and Qualitative Disclosures About Market Risk” for additional information regarding BIBP and the movement in cheese prices.
Diluted earnings per share were $2.06 in 2009 (including a $0.52 per share gain from the consolidation of BIBP and a $0.04 gain from the finalization of certain income tax issues), compared to $1.30 per diluted
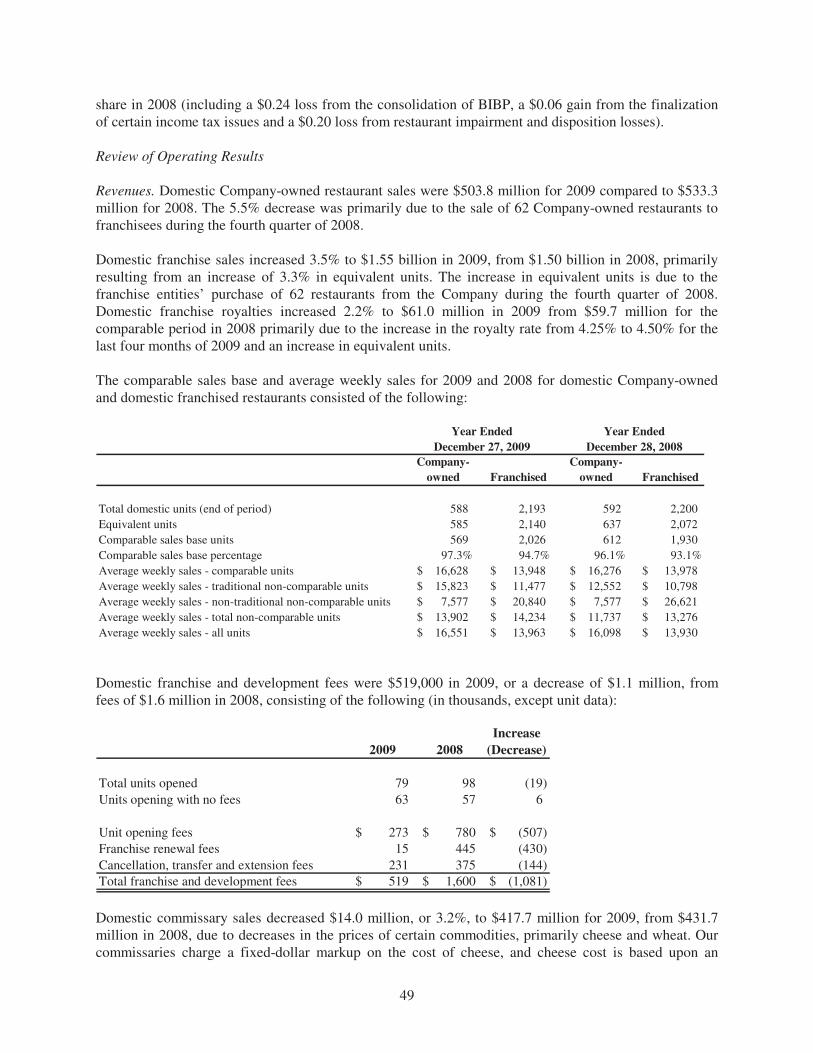
49
share in 2008 (including a $0.24 loss from the consolidation of BIBP, a $0.06 gain from the finalization of certain income tax issues and a $0.20 loss from restaurant impairment and disposition losses). Review of Operating Results
Revenues. Domestic Company-owned restaurant sales were $503.8 million for 2009 compared to $533.3 million for 2008. The 5.5% decrease was primarily due to the sale of 62 Company-owned restaurants to franchisees during the fourth quarter of 2008. Domestic franchise sales increased 3.5% to $1.55 billion in 2009, from $1.50 billion in 2008, primarily resulting from an increase of 3.3% in equivalent units. The increase in equivalent units is due to the franchise entities’ purchase of 62 restaurants from the Company during the fourth quarter of 2008. Domestic franchise royalties increased 2.2% to $61.0 million in 2009 from $59.7 million for the comparable period in 2008 primarily due to the increase in the royalty rate from 4.25% to 4.50% for the last four months of 2009 and an increase in equivalent units. The comparable sales base and average weekly sales for 2009 and 2008 for domestic Company-owned and domestic franchised restaurants consisted of the following:
Company-
owned Franchised
Company-
owned Franchised
Total domestic units (end of period) 588 2,193 592 2,200
Equivalent units 585 2,140 637 2,072
Comparable sales base units 569 2,026 612 1,930
Comparable sales base percentage 97.3% 94.7% 96.1% 93.1%
Average weekly sales - comparable units 16,628$ 13,948$ 16,276$ 13,978$
Average weekly sales - traditional non-comparable units 15,823$ 11,477$ 12,552$ 10,798$
Average weekly sales - non-traditional non-comparable units 7,577$ 20,840$ 7,577$ 26,621$
Average weekly sales - total non-comparable units 13,902$ 14,234$ 11,737$ 13,276$
Average weekly sales - all units 16,551$ 13,963$ 16,098$ 13,930$
Year Ended Year Ended
December 27, 2009 December 28, 2008
Domestic franchise and development fees were $519,000 in 2009, or a decrease of $1.1 million, from fees of $1.6 million in 2008, consisting of the following (in thousands, except unit data):
2009 2008
Increase
(Decrease)
Total units opened 79 98 (19)
Units opening with no fees 63 57 6
Unit opening fees 273$ 780$ (507)$
Franchise renewal fees 15 445 (430)
Cancellation, transfer and extension fees 231 375 (144)
Total franchise and development fees 519$ 1,600$ (1,081)$
Domestic commissary sales decreased $14.0 million, or 3.2%, to $417.7 million for 2009, from $431.7 million in 2008, due to decreases in the prices of certain commodities, primarily cheese and wheat. Our commissaries charge a fixed-dollar markup on the cost of cheese, and cheese cost is based upon an
50
adjusted 40 lb. cheddar block price, which decreased from an average of $1.81 per pound in 2008 to an average of $1.55 per pound in 2009, a 14.4% decrease. The cost of wheat, as measured on domestic commodity markets, decreased approximately 37% in 2009 as compared to 2008. Other sales, which include our online and print and promotions businesses as well as our insurance agency operations, decreased $7.4 million to $54.0 million from $61.4 million in 2008. The decline was due to a decrease in revenues from our online ordering system business unit, reflecting a reduction in the online fee percentage charged to our franchisees and a decrease in sales at our print and promotions business reflecting the deterioration of the U.S. economic environment. Our PJUK operations, denominated in British pounds sterling and converted to U.S. dollars, represent approximately 50% and 55% of international revenues in 2009 and 2008, respectively. International revenues increased 7.1% to $41.5 million in 2009, from $38.7 million in 2008, reflecting the increase in both the number and average unit volumes of our Company-owned and franchised restaurants over the prior year.
Costs and Expenses. The restaurant operating margin at domestic Company-owned units was 21.8% in 2009 compared to 18.5% in 2008. Excluding the impact of consolidating BIBP, restaurant operating margin increased 1.8% to 20.7% for the year ended December 27, 2009 as compared to the corresponding period in 2008, consisting of the following differences:
• Cost of sales was 1.1% lower (excluding the consolidation of BIBP) in 2009 compared to 2008, primarily due to lower commodities costs.
• Salaries and benefits were 0.7% lower as a percentage of sales in 2009 compared to 2008, primarily due to the divestiture in late 2008 of 62 restaurants that had a higher labor cost as a percentage of sales.
• Advertising and related costs as a percentage of sales were relatively consistent with the 2008 period.
• Occupancy and other operating costs, on a combined basis, as a percentage of sales were relatively consistent with the 2008 period.
Domestic commissary and other margin was 9.8% in 2009, compared to 9.6% in 2008. Cost of sales was 73.8% of revenues in 2009, compared to 74.0% for the same period in 2008. Salaries and benefits were 7.2% of revenues in 2009, which was relatively consistent with the prior comparable year. Other operating expenses decreased approximately $2.1 million in 2009 as compared to 2008, reflecting a decrease in distribution costs from lower fuel prices. The favorable impact that a lower cheese cost would be expected to have on gross margin percentage (given a fixed-dollar markup per pound) was offset by additional margin reductions on non-cheese products at the commissary during the year. We recorded pre-tax income from the franchise cheese-purchasing program, net of noncontrolling interest, of $18.1 million and a pre-tax loss of $6.3 million in 2009 and 2008, respectively. These results only represent the portion of BIBP’s operating income or loss related to the proportion of BIBP cheese sales to franchisees. The total impact of the consolidation of BIBP on Papa John’s pre-tax income was pre-tax income of $22.5 million in 2009 and a pre-tax loss of $10.5 million in 2008. General and administrative expenses were $111.4 million, or 10.3% of revenues for 2009, as compared to $99.3 million or 8.8% of revenues for 2008. The increase is primarily due to the items noted as comprising the increases in unallocated general and administrative expenses for the Unallocated Corporate Segment in the Summary of Operating Results section, as well as certain management transition costs recorded by our domestic commissaries segment.
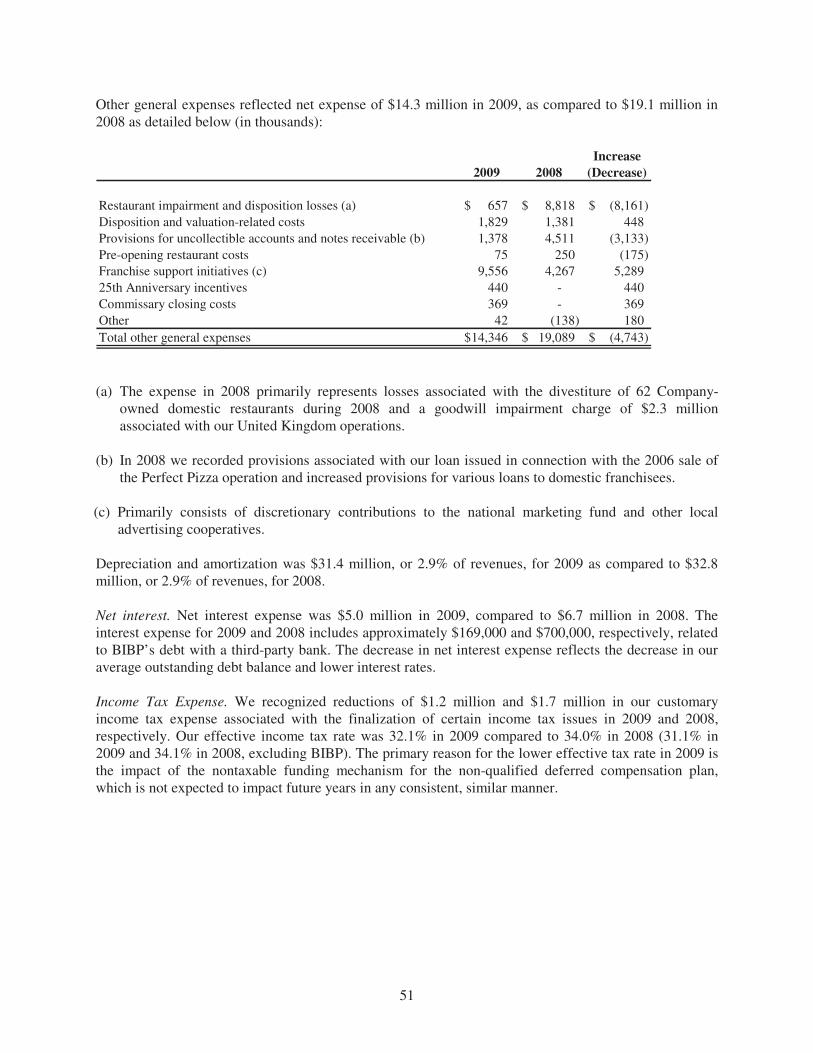
51
Other general expenses reflected net expense of $14.3 million in 2009, as compared to $19.1 million in 2008 as detailed below (in thousands):
Increase
2009 2008 (Decrease)
Restaurant impairment and disposition losses (a) 657$ 8,818$ (8,161)$
Disposition and valuation-related costs 1,829 1,381 448
Provisions for uncollectible accounts and notes receivable (b) 1,378 4,511 (3,133)
Pre-opening restaurant costs 75 250 (175)
Franchise support initiatives (c) 9,556 4,267 5,289
25th Anniversary incentives 440 - 440
Commissary closing costs 369 - 369
Other 42 (138) 180
Total other general expenses 14,346$ 19,089$ (4,743)$
(a) The expense in 2008 primarily represents losses associated with the divestiture of 62 Company-
owned domestic restaurants during 2008 and a goodwill impairment charge of $2.3 million associated with our United Kingdom operations.
(b) In 2008 we recorded provisions associated with our loan issued in connection with the 2006 sale of
the Perfect Pizza operation and increased provisions for various loans to domestic franchisees. (c) Primarily consists of discretionary contributions to the national marketing fund and other local
advertising cooperatives. Depreciation and amortization was $31.4 million, or 2.9% of revenues, for 2009 as compared to $32.8 million, or 2.9% of revenues, for 2008. Net interest. Net interest expense was $5.0 million in 2009, compared to $6.7 million in 2008. The interest expense for 2009 and 2008 includes approximately $169,000 and $700,000, respectively, related to BIBP’s debt with a third-party bank. The decrease in net interest expense reflects the decrease in our average outstanding debt balance and lower interest rates. Income Tax Expense. We recognized reductions of $1.2 million and $1.7 million in our customary income tax expense associated with the finalization of certain income tax issues in 2009 and 2008, respectively. Our effective income tax rate was 32.1% in 2009 compared to 34.0% in 2008 (31.1% in 2009 and 34.1% in 2008, excluding BIBP). The primary reason for the lower effective tax rate in 2009 is the impact of the nontaxable funding mechanism for the non-qualified deferred compensation plan, which is not expected to impact future years in any consistent, similar manner.

52
Liquidity and Capital Resources
Debt and credit arrangements consist of the following (in thousands):
2010 2009
Revolving line of credit 99,000$ 99,000$
Other 17 50
Total long-term debt 99,017$ 99,050$
In September 2010, we entered into a five-year, unsecured Revolving Credit Facility (“New Credit Facility”) totaling $175.0 million that replaced a $175.0 million unsecured Revolving Credit Facility (“Old Credit Facility”). Under the New Credit Facility, outstanding balances accrue interest at 100.0 to 175.0 basis points over the London Interbank Offered Rate (LIBOR) or other bank-developed rates, at our option. The commitment fee on the unused balance ranges from 17.5 to 25.0 basis points. The increment over LIBOR and the commitment fee are determined quarterly based upon the ratio of total indebtedness to earnings before interest, taxes, depreciation and amortization (EBITDA), as defined by the New Credit Facility. Outstanding balances under the Old Credit Facility accrued interest at 50.0 to 100.0 basis points over LIBOR or other bank developed rates, at our option. The commitment fee on the unused balance ranged from 12.5 to 20.0 basis points. Our New Credit Facility contains customary affirmative and negative covenants, including the following financial covenants, as defined by the New Credit Facility (the covenants exclude the impact of consolidating BIBP’s operations):
Permitted Ratio
Actual Ratio for the
Year Ended
December 26, 2010
Leverage Ratio Not to exceed 2.5 to 1.0 1.0 to 1.0
Interest Coverage Ratio Not less than 3.5 to 1.0 4.5 to 1.0
Our leverage ratio is defined as outstanding debt divided by consolidated EBITDA for the most recent four fiscal quarters. Our interest coverage ratio is defined as the sum of consolidated EBITDA and consolidated rental expense for the most recent four fiscal quarters divided by the sum of consolidated interest expense and consolidated rental expense for the most recent four fiscal quarters. We were in compliance with all covenants at December 26, 2010 and December 27, 2009. Cash flow provided by operating activities was $89.1 million for the full-year 2010 as compared to $100.1 million in 2009. The consolidation of BIBP increased cash flow from operations by approximately $6.8 million in 2010 and $22.5 million in 2009 (as reflected in the net income and deferred income taxes captions in the accompanying “Consolidated Statements of Cash Flows”). Excluding the impact of the consolidation of BIBP, cash flow was $82.3 million in 2010, as compared to $77.5 million in 2009, primarily due to higher net income. Cash flow provided by operating activities increased to $100.1 million in 2009 from $73.2 million in 2008. The consolidation of BIBP increased cash flow from operations by approximately $22.5 million in 2009 and decreased cash flow from operations by approximately $10.5 million in 2008. Excluding the
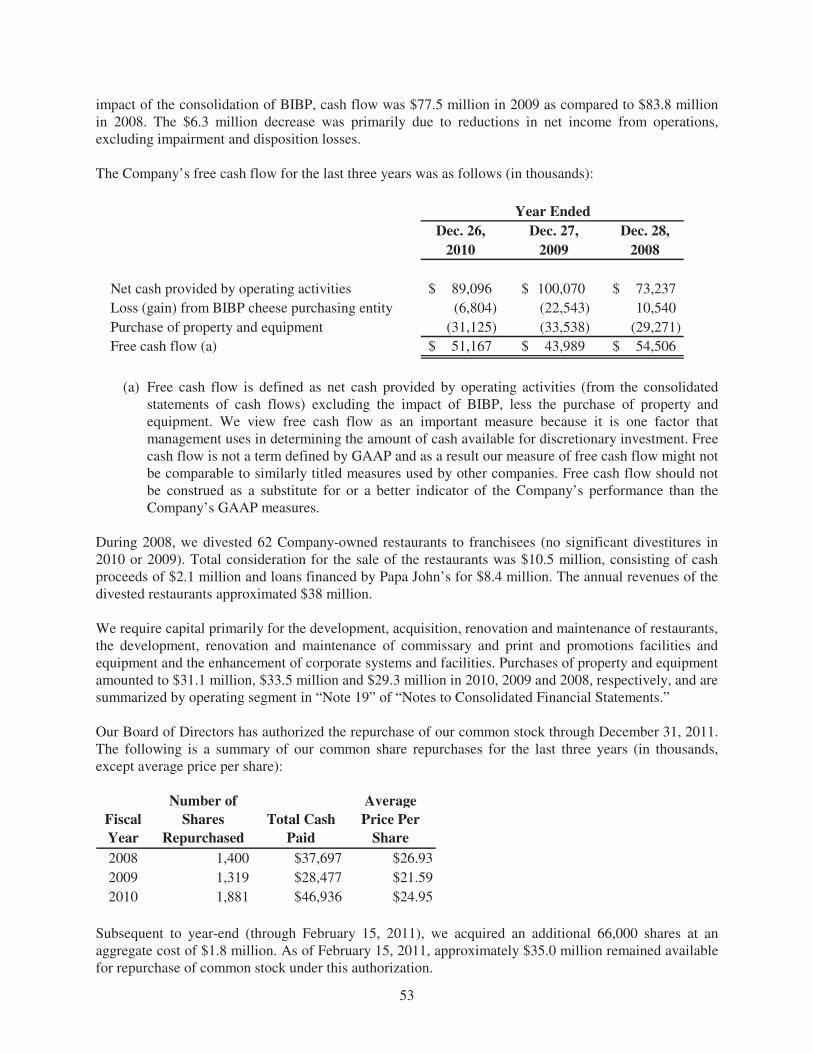
53
impact of the consolidation of BIBP, cash flow was $77.5 million in 2009 as compared to $83.8 million in 2008. The $6.3 million decrease was primarily due to reductions in net income from operations, excluding impairment and disposition losses. The Company’s free cash flow for the last three years was as follows (in thousands):
Dec. 26, Dec. 27, Dec. 28,
2010 2009 2008
Net cash provided by operating activities 89,096$ 100,070$ 73,237$
Loss (gain) from BIBP cheese purchasing entity (6,804) (22,543) 10,540
Purchase of property and equipment (31,125) (33,538) (29,271)
Free cash flow (a) 51,167$ 43,989$ 54,506$
Year Ended
(a) Free cash flow is defined as net cash provided by operating activities (from the consolidated
statements of cash flows) excluding the impact of BIBP, less the purchase of property and equipment. We view free cash flow as an important measure because it is one factor that management uses in determining the amount of cash available for discretionary investment. Free cash flow is not a term defined by GAAP and as a result our measure of free cash flow might not be comparable to similarly titled measures used by other companies. Free cash flow should not be construed as a substitute for or a better indicator of the Company’s performance than the Company’s GAAP measures.
During 2008, we divested 62 Company-owned restaurants to franchisees (no significant divestitures in 2010 or 2009). Total consideration for the sale of the restaurants was $10.5 million, consisting of cash proceeds of $2.1 million and loans financed by Papa John’s for $8.4 million. The annual revenues of the divested restaurants approximated $38 million. We require capital primarily for the development, acquisition, renovation and maintenance of restaurants, the development, renovation and maintenance of commissary and print and promotions facilities and equipment and the enhancement of corporate systems and facilities. Purchases of property and equipment amounted to $31.1 million, $33.5 million and $29.3 million in 2010, 2009 and 2008, respectively, and are summarized by operating segment in “Note 19” of “Notes to Consolidated Financial Statements.” Our Board of Directors has authorized the repurchase of our common stock through December 31, 2011. The following is a summary of our common share repurchases for the last three years (in thousands, except average price per share):
Fiscal
Year
Number of
Shares
Repurchased
Total Cash
Paid
Average
Price Per
Share
2008 1,400 $37,697 $26.93
2009 1,319 $28,477 $21.59
2010 1,881 $46,936 $24.95 Subsequent to year-end (through February 15, 2011), we acquired an additional 66,000 shares at an aggregate cost of $1.8 million. As of February 15, 2011, approximately $35.0 million remained available for repurchase of common stock under this authorization.
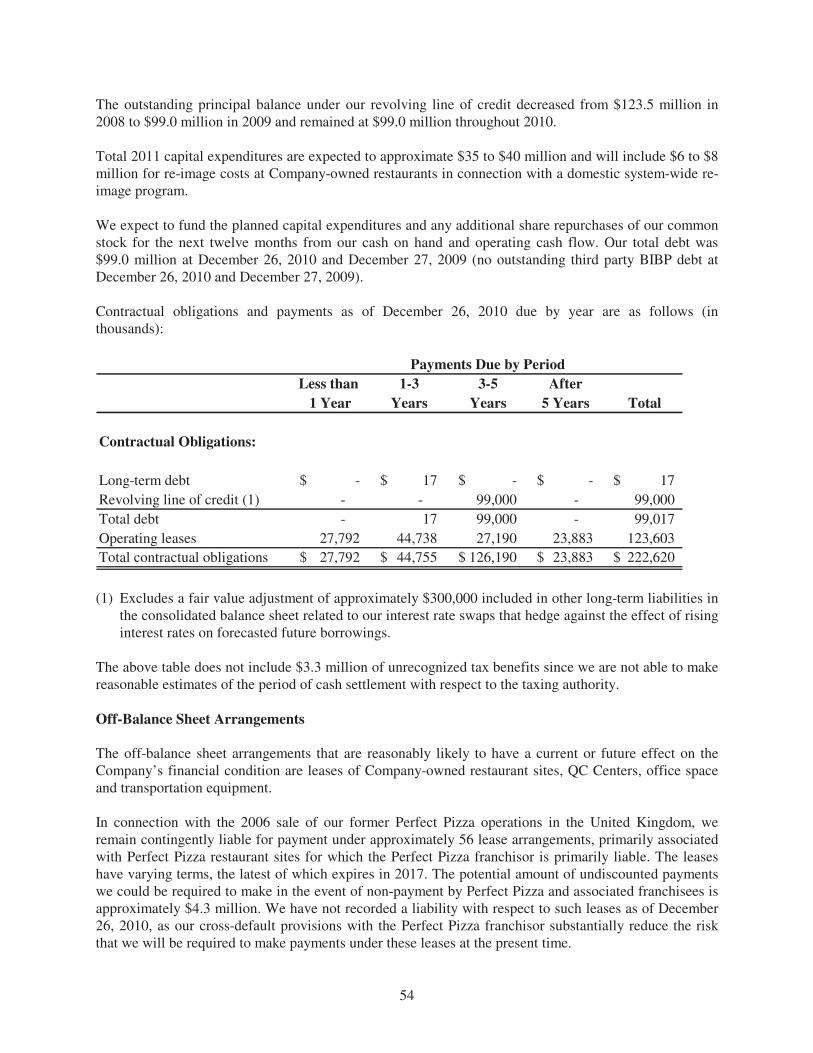
54
The outstanding principal balance under our revolving line of credit decreased from $123.5 million in 2008 to $99.0 million in 2009 and remained at $99.0 million throughout 2010. Total 2011 capital expenditures are expected to approximate $35 to $40 million and will include $6 to $8 million for re-image costs at Company-owned restaurants in connection with a domestic system-wide re-image program. We expect to fund the planned capital expenditures and any additional share repurchases of our common stock for the next twelve months from our cash on hand and operating cash flow. Our total debt was $99.0 million at December 26, 2010 and December 27, 2009 (no outstanding third party BIBP debt at December 26, 2010 and December 27, 2009). Contractual obligations and payments as of December 26, 2010 due by year are as follows (in thousands):
Less than 1-3 3-5 After
1 Year Years Years 5 Years Total
Contractual Obligations:
Long-term debt -$ 17$ -$ -$ 17$
Revolving line of credit (1) - - 99,000 - 99,000
Total debt - 17 99,000 - 99,017
Operating leases 27,792 44,738 27,190 23,883 123,603
Total contractual obligations 27,792$ 44,755$ 126,190$ 23,883$ 222,620$
Payments Due by Period
(1) Excludes a fair value adjustment of approximately $300,000 included in other long-term liabilities in
the consolidated balance sheet related to our interest rate swaps that hedge against the effect of rising interest rates on forecasted future borrowings.
The above table does not include $3.3 million of unrecognized tax benefits since we are not able to make reasonable estimates of the period of cash settlement with respect to the taxing authority.
Off-Balance Sheet Arrangements The off-balance sheet arrangements that are reasonably likely to have a current or future effect on the Company’s financial condition are leases of Company-owned restaurant sites, QC Centers, office space and transportation equipment. In connection with the 2006 sale of our former Perfect Pizza operations in the United Kingdom, we remain contingently liable for payment under approximately 56 lease arrangements, primarily associated with Perfect Pizza restaurant sites for which the Perfect Pizza franchisor is primarily liable. The leases have varying terms, the latest of which expires in 2017. The potential amount of undiscounted payments we could be required to make in the event of non-payment by Perfect Pizza and associated franchisees is approximately $4.3 million. We have not recorded a liability with respect to such leases as of December 26, 2010, as our cross-default provisions with the Perfect Pizza franchisor substantially reduce the risk that we will be required to make payments under these leases at the present time.

55
We have certain other commercial commitments where payment is contingent upon the occurrence of certain events. Such commitments include the following by year (in thousands):
Less than 1-3 3-5 After
1 Year Years Years 5 Years Total
Other Commercial Commitments:
Standby letters of credit 14,012$ 4,155$ -$ -$ 18,167$
Amount of Commitment Expiration Per Period
See “Notes 7, 10 and 15” of “Notes to Consolidated Financial Statements” for additional information related to contractual and other commitments.
Forward-Looking Statements
Certain matters discussed in this report, including information within Management’s Discussion and Analysis of Financial Condition and Results of Operations, and other Company communications constitute forward-looking statements within the meaning of the federal securities laws. Generally, the use of words such as “expect,” “estimate,” “believe,” “anticipate,” “will,” “forecast,” “plan,” “project,” or similar words identify forward-looking statements that we intend to be included within the safe harbor protections provided by the federal securities laws. Such statements may relate to projections concerning revenue, earnings, margins, unit growth and other financial and operational measures. Such statements are not guarantees of future performance and involve certain risks, uncertainties and assumptions, which are difficult to predict and many of which are beyond our control. Therefore, actual outcomes and results may differ materially from those matters expressed or implied in such forward-looking statements. The risks, uncertainties and assumptions that are involved in our forward-looking statements include, but are not limited to: changes in pricing or other marketing or promotional strategies by competitors which may adversely affect sales, including an increase in or continuation of the aggressive pricing and promotional environment; new product and concept developments by food industry competitors; the ability of the Company and its franchisees to meet planned growth targets and operate new and existing restaurants profitably; general economic conditions and resulting impact on consumer buying habits; changes in consumer preferences; increases in or sustained high costs of food ingredients and other commodities, paper, utilities, fuel, employee compensation and benefits, insurance and similar costs (including the impact of the recently passed federal health care legislation); the ability of the Company to pass along such increases in or sustained high costs to franchisees or consumers; the impact of current or future legal claims and current or proposed legislation impacting our business; the impact that product recalls, food quality or safety issues, and general public health concerns could have on our restaurants; currency exchange and interest rates; and increased risks associated with our international operations, including economic and political conditions in our international markets and difficulty in meeting planned sales targets for our international operations. These and other risk factors are discussed in detail in “Part I. Item 1A. – Risk Factors” of this report. We undertake no obligation to update publicly any forward-looking statements, whether as a result of future events, new information or otherwise, except as required by law.
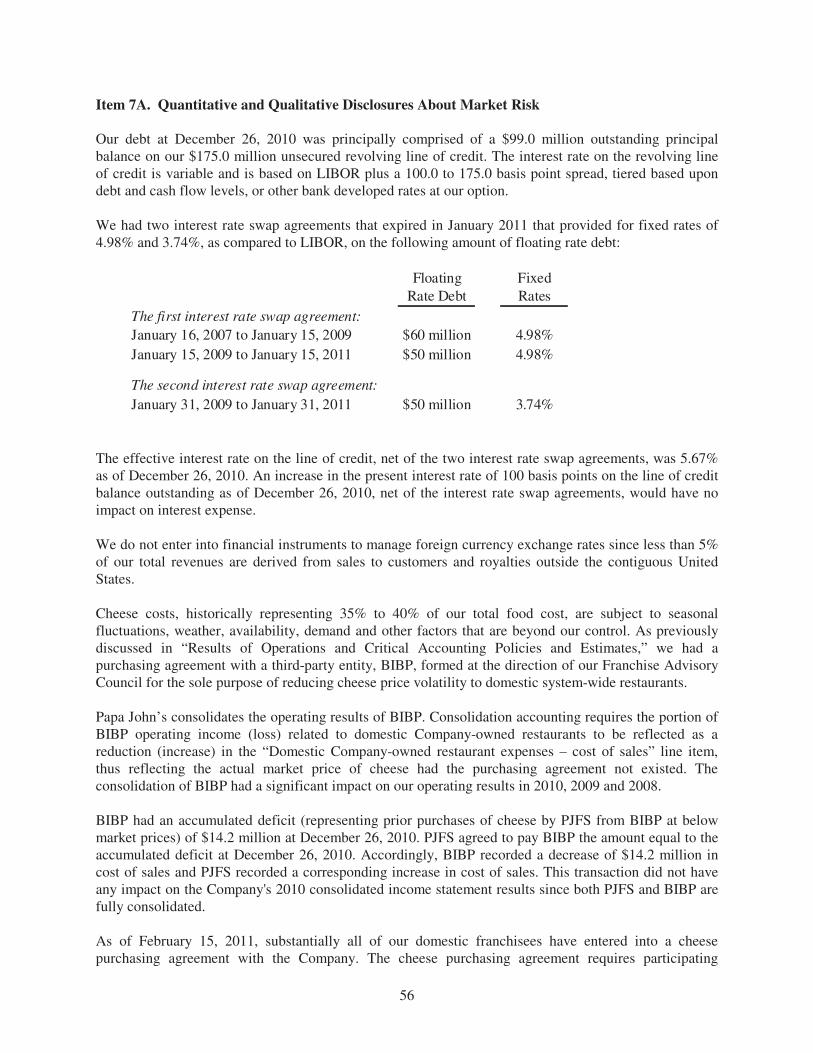
56
Item 7A. Quantitative and Qualitative Disclosures About Market Risk
Our debt at December 26, 2010 was principally comprised of a $99.0 million outstanding principal balance on our $175.0 million unsecured revolving line of credit. The interest rate on the revolving line of credit is variable and is based on LIBOR plus a 100.0 to 175.0 basis point spread, tiered based upon debt and cash flow levels, or other bank developed rates at our option. We had two interest rate swap agreements that expired in January 2011 that provided for fixed rates of 4.98% and 3.74%, as compared to LIBOR, on the following amount of floating rate debt:
Floating
Rate Debt
Fixed
Rates
The first interest rate swap agreement:
January 16, 2007 to January 15, 2009 $60 million 4.98%
January 15, 2009 to January 15, 2011 $50 million 4.98%
The second interest rate swap agreement:
January 31, 2009 to January 31, 2011 $50 million 3.74% The effective interest rate on the line of credit, net of the two interest rate swap agreements, was 5.67% as of December 26, 2010. An increase in the present interest rate of 100 basis points on the line of credit balance outstanding as of December 26, 2010, net of the interest rate swap agreements, would have no impact on interest expense. We do not enter into financial instruments to manage foreign currency exchange rates since less than 5% of our total revenues are derived from sales to customers and royalties outside the contiguous United States. Cheese costs, historically representing 35% to 40% of our total food cost, are subject to seasonal fluctuations, weather, availability, demand and other factors that are beyond our control. As previously discussed in “Results of Operations and Critical Accounting Policies and Estimates,” we had a purchasing agreement with a third-party entity, BIBP, formed at the direction of our Franchise Advisory Council for the sole purpose of reducing cheese price volatility to domestic system-wide restaurants. Papa John’s consolidates the operating results of BIBP. Consolidation accounting requires the portion of BIBP operating income (loss) related to domestic Company-owned restaurants to be reflected as a reduction (increase) in the “Domestic Company-owned restaurant expenses – cost of sales” line item, thus reflecting the actual market price of cheese had the purchasing agreement not existed. The consolidation of BIBP had a significant impact on our operating results in 2010, 2009 and 2008. BIBP had an accumulated deficit (representing prior purchases of cheese by PJFS from BIBP at below market prices) of $14.2 million at December 26, 2010. PJFS agreed to pay BIBP the amount equal to the accumulated deficit at December 26, 2010. Accordingly, BIBP recorded a decrease of $14.2 million in cost of sales and PJFS recorded a corresponding increase in cost of sales. This transaction did not have any impact on the Company's 2010 consolidated income statement results since both PJFS and BIBP are fully consolidated. As of February 15, 2011, substantially all of our domestic franchisees have entered into a cheese purchasing agreement with the Company. The cheese purchasing agreement requires participating
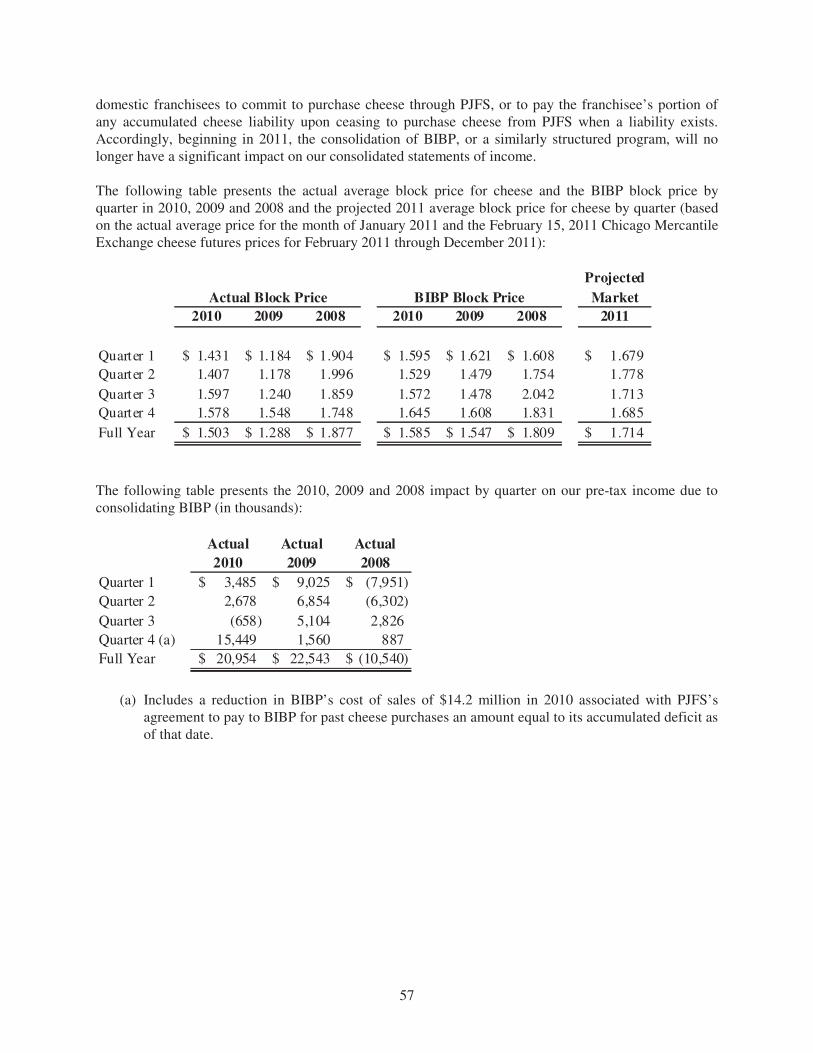
57
domestic franchisees to commit to purchase cheese through PJFS, or to pay the franchisee’s portion of any accumulated cheese liability upon ceasing to purchase cheese from PJFS when a liability exists. Accordingly, beginning in 2011, the consolidation of BIBP, or a similarly structured program, will no longer have a significant impact on our consolidated statements of income. The following table presents the actual average block price for cheese and the BIBP block price by quarter in 2010, 2009 and 2008 and the projected 2011 average block price for cheese by quarter (based on the actual average price for the month of January 2011 and the February 15, 2011 Chicago Mercantile Exchange cheese futures prices for February 2011 through December 2011):
Projected
Market
2010 2009 2008 2010 2009 2008 2011
Quarter 1 1.431$ 1.184$ 1.904$ 1.595$ 1.621$ 1.608$ 1.679$
Quarter 2 1.407 1.178 1.996 1.529 1.479 1.754 1.778
Quarter 3 1.597 1.240 1.859 1.572 1.478 2.042 1.713
Quarter 4 1.578 1.548 1.748 1.645 1.608 1.831 1.685
Full Year 1.503$ 1.288$ 1.877$ 1.585$ 1.547$ 1.809$ 1.714$
BIBP Block PriceActual Block Price
The following table presents the 2010, 2009 and 2008 impact by quarter on our pre-tax income due to
consolidating BIBP (in thousands):
Actual Actual Actual
2010 2009 2008
Quarter 1 3,485$ 9,025$ (7,951)$
Quarter 2 2,678 6,854 (6,302)
Quarter 3 (658) 5,104 2,826
Quarter 4 (a) 15,449 1,560 887
Full Year 20,954$ 22,543$ (10,540)$
(a) Includes a reduction in BIBP’s cost of sales of $14.2 million in 2010 associated with PJFS’s
agreement to pay to BIBP for past cheese purchases an amount equal to its accumulated deficit as
of that date.
58
Item 8. Financial Statements and Supplementary Data
Management’s Report on Internal Control over Financial Reporting
The consolidated financial statements appearing in this Annual Report have been prepared by
management, who is responsible for their preparation, integrity and fair presentation. The statements
have been prepared in accordance with accounting principles generally accepted in the United States,
which requires management to make estimates and assumptions that affect the amounts reported in the
consolidated financial statements and accompanying notes.
Our management is responsible for establishing and maintaining adequate internal control over financial
reporting (as defined in Rules 13a-15(f) and 15d-15(f) of the Securities Exchange Act of 1934, as
amended). Our internal control system was designed to provide reasonable assurance regarding the
reliability of financial reporting and the preparation of financial statements for external purposes in
accordance with generally accepted accounting principles.
All internal control systems, no matter how well designed, have inherent limitations. Therefore, even
those systems determined to be effective can provide only reasonable assurance with respect to financial
statement preparation and presentation. Further, because of changes in conditions, the effectiveness of an
internal control system may vary over time.
Under the supervision and with the participation of our management, including our Co-Chief Executive
Officers (Co-CEOs) and Chief Financial Officer (CFO), we conducted an evaluation of the effectiveness
of our internal control over financial reporting as of December 26, 2010 based on the framework in
Internal Control – Integrated Framework issued by the Committee of Sponsoring Organizations of the
Treadway Commission (COSO). Based on that evaluation, our management concluded our internal
control over financial reporting was effective to provide reasonable assurance regarding the reliability of
financial reporting and the preparation of financial statements for external purposes in accordance with
generally accepted accounting principles as of December 26, 2010.
Ernst & Young LLP, an independent registered public accounting firm, has audited and reported on the
consolidated financial statements of Papa John’s International, Inc. and on the effectiveness of our
internal controls over financial reporting. The reports of Ernst & Young LLP are contained in this
Annual Report.
/s/ John H. Schnatter
John H. Schnatter
Founder, Chairman and Co-Chief Executive Officer
/s/ J. Jude Thompson
J. Jude Thompson
President and Co-Chief Executive Officer
/s/ J. David Flanery
J. David Flanery
Senior Vice President and Chief Financial Officer
February 22, 2011
59
Report of Independent Registered Public Accounting Firm
The Board of Directors and Stockholders of Papa John’s International, Inc.
We have audited the accompanying consolidated balance sheets of Papa John’s International, Inc. as of
December 26, 2010 and December 27, 2009, and the related consolidated statements of income,
stockholders' equity, and cash flows for each of the three years in the period ended December 26, 2010.
Our audits also included the financial statement schedule listed in the Index at Item 15(a)(2). These
financial statements and schedule are the responsibility of the Company's management. Our
responsibility is to express an opinion on these financial statements and schedule based on our audits.
We conducted our audits in accordance with the standards of the Public Company Accounting Oversight
Board (United States). Those standards require that we plan and perform the audit to obtain reasonable
assurance about whether the financial statements are free of material misstatement. An audit includes
examining, on a test basis, evidence supporting the amounts and disclosures in the financial statements.
An audit also includes assessing the accounting principles used and significant estimates made by
management, as well as evaluating the overall financial statement presentation. We believe that our
audits provide a reasonable basis for our opinion.
In our opinion, the financial statements referred to above present fairly, in all material respects, the
consolidated financial position of Papa John’s International, Inc. at December 26, 2010 and December
27, 2009, and the consolidated results of their operations and their cash flows for each of the three years
in the period ended December 26, 2010, in conformity with U.S. generally accepted accounting
principles. Also, in our opinion, the related financial statement schedule, when considered in relation to
the basic financial statements taken as a whole, presents fairly in all material respects the information set
forth therein.
As discussed in Note 2 to the consolidated financial statements, the Company changed its method of
accounting for variable interest entities, effective December 28, 2009, and its method of accounting for
noncontrolling interests, effective December 29, 2008, as a result of the adoption of amendments to the
FASB Accounting Standards Codification (ASC) 810, “Consolidation”.
We also have audited, in accordance with the standards of the Public Company Accounting Oversight
Board (United States), Papa John’s International, Inc. internal control over financial reporting as of
December 26, 2010, based on criteria established in Internal Control-Integrated Framework issued by the
Committee of Sponsoring Organizations of the Treadway Commission and our report dated February 22,
2011, expressed an unqualified opinion thereon.
/s/ Ernst & Young LLP
Louisville, Kentucky
February 22, 2011
60
Report of Independent Registered Public Accounting Firm
The Board of Directors and Stockholders of Papa John’s International, Inc.
We have audited Papa John’s International, Inc. internal control over financial reporting as of December
26, 2010, based on criteria established in Internal Control—Integrated Framework issued by the
Committee of Sponsoring Organizations of the Treadway Commission (the COSO criteria). Papa John’s
International, Inc.’s management is responsible for maintaining effective internal control over financial
reporting, and for its assessment of the effectiveness of internal control over financial reporting included
in the accompanying “Management’s Report on Internal Control Over Financial Reporting.” Our
responsibility is to express an opinion on the company’s internal control over financial reporting based
on our audit.
We conducted our audit in accordance with the standards of the Public Company Accounting Oversight
Board (United States). Those standards require that we plan and perform the audit to obtain reasonable
assurance about whether effective internal control over financial reporting was maintained in all material
respects. Our audit included obtaining an understanding of internal control over financial reporting,
assessing the risk that a material weakness exists, testing and evaluating the design and operating
effectiveness of internal control based on the assessed risk, and performing such other procedures as we
considered necessary in the circumstances. We believe that our audit provides a reasonable basis for our
opinion.
A company’s internal control over financial reporting is a process designed to provide reasonable
assurance regarding the reliability of financial reporting and the preparation of financial statements for
external purposes in accordance with generally accepted accounting principles. A company’s internal
control over financial reporting includes those policies and procedures that (1) pertain to the maintenance
of records that, in reasonable detail, accurately and fairly reflect the transactions and dispositions of the
assets of the company; (2) provide reasonable assurance that transactions are recorded as necessary to
permit preparation of financial statements in accordance with generally accepted accounting principles,
and that receipts and expenditures of the company are being made only in accordance with authorizations
of management and directors of the company; and (3) provide reasonable assurance regarding prevention
or timely detection of unauthorized acquisition, use, or disposition of the company’s assets that could
have a material effect on the financial statements.
Because of its inherent limitations, internal control over financial reporting may not prevent or detect
misstatements. Also, projections of any evaluation of effectiveness to future periods are subject to the
risk that controls may become inadequate because of changes in conditions, or that the degree of
compliance with the policies or procedures may deteriorate.
In our opinion, Papa John’s International, Inc. maintained, in all material respects, effective internal
control over financial reporting as of December 26, 2010, based on the COSO criteria.
We also have audited, in accordance with the standards of the Public Company Accounting Oversight
Board (United States), the consolidated balance sheets of Papa John’s International, Inc. as of December
26, 2010 and December 27, 2009, and the related consolidated statements of income, stockholders’
equity, and cash flows for each of the three years in the period ended December 26, 2010 and our report
dated February 22, 2011, expressed an unqualified opinion thereon.
/s/ Ernst & Young LLP
Louisville, Kentucky
February 22, 2011
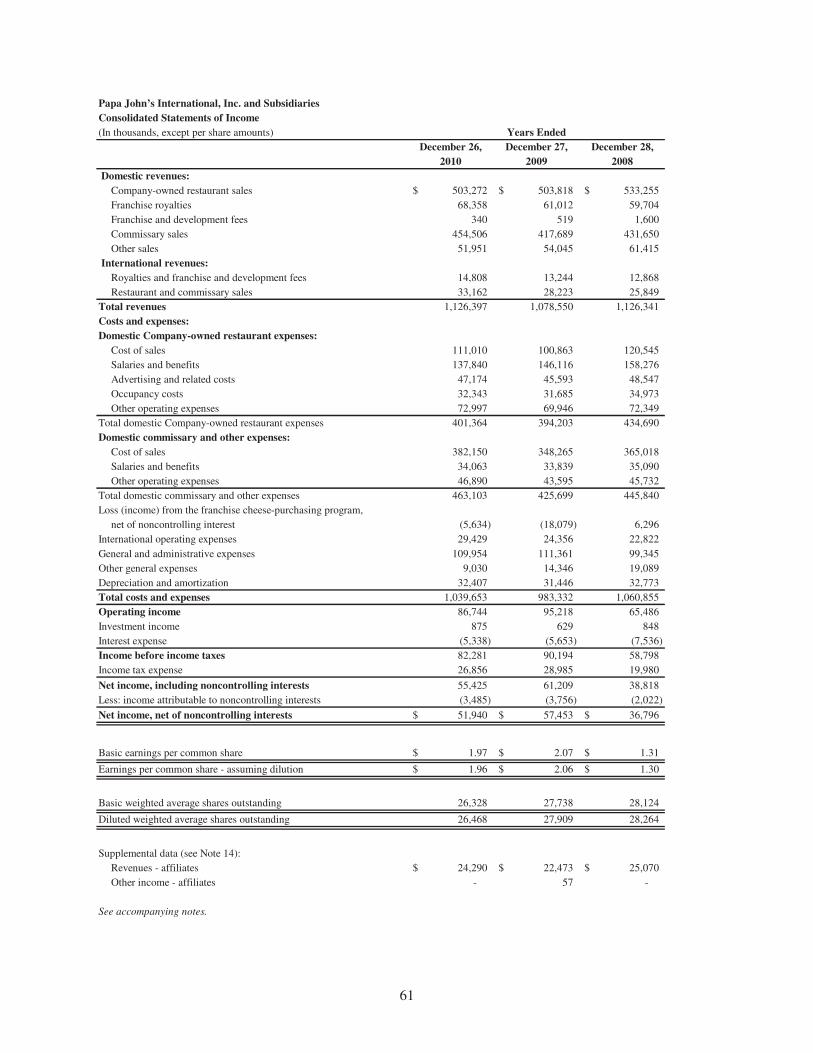
61
Papa John’s International, Inc. and Subsidiaries
Consolidated Statements of Income
(In thousands, except per share amounts) Years Ended
December 26, December 27, December 28,
2010 2009 2008
Domestic revenues:
Company-owned restaurant sales 503,272$ 503,818$ 533,255$
Franchise royalties 68,358 61,012 59,704
Franchise and development fees 340 519 1,600
Commissary sales 454,506 417,689 431,650
Other sales 51,951 54,045 61,415
International revenues:
Royalties and franchise and development fees 14,808 13,244 12,868
Restaurant and commissary sales 33,162 28,223 25,849
Total revenues 1,126,397 1,078,550 1,126,341
Costs and expenses:
Domestic Company-owned restaurant expenses:
Cost of sales 111,010 100,863 120,545
Salaries and benefits 137,840 146,116 158,276
Advertising and related costs 47,174 45,593 48,547
Occupancy costs 32,343 31,685 34,973
Other operating expenses 72,997 69,946 72,349
Total domestic Company-owned restaurant expenses 401,364 394,203 434,690
Domestic commissary and other expenses:
Cost of sales 382,150 348,265 365,018
Salaries and benefits 34,063 33,839 35,090
Other operating expenses 46,890 43,595 45,732
Total domestic commissary and other expenses 463,103 425,699 445,840
Loss (income) from the franchise cheese-purchasing program,
net of noncontrolling interest (5,634) (18,079) 6,296
International operating expenses 29,429 24,356 22,822
General and administrative expenses 109,954 111,361 99,345
Other general expenses 9,030 14,346 19,089
Depreciation and amortization 32,407 31,446 32,773
Total costs and expenses 1,039,653 983,332 1,060,855
Operating income 86,744 95,218 65,486
Investment income 875 629 848
Interest expense (5,338) (5,653) (7,536)
Income before income taxes 82,281 90,194 58,798
Income tax expense 26,856 28,985 19,980
Net income, including noncontrolling interests 55,425 61,209 38,818
Less: income attributable to noncontrolling interests (3,485) (3,756) (2,022)
Net income, net of noncontrolling interests 51,940$ 57,453$ 36,796$
Basic earnings per common share 1.97$ 2.07$ 1.31$
Earnings per common share - assuming dilution 1.96$ 2.06$ 1.30$
Basic weighted average shares outstanding 26,328 27,738 28,124
Diluted weighted average shares outstanding 26,468 27,909 28,264
Supplemental data (see Note 14):
Revenues - affiliates 24,290$ 22,473$ 25,070$
Other income - affiliates - 57 -
See accompanying notes.

62
Papa John’s International, Inc. and Subsidiaries
Consolidated Balance Sheets
December 26, December 27,
(In thousands, except per share amounts) 2010 2009
Assets
Current assets:
Cash and cash equivalents 46,225$ 25,457$
Accounts receivable (less allowance for doubtful
accounts of $2,795 in 2010 and $2,791 in 2009) 24,733 21,471
Accounts receivable - affiliates (no allowance for doubtful
accounts in 2010 and 2009) 624 648
Inventories 17,402 15,576
Prepaid expenses 10,009 8,695
Other current assets 3,732 3,748
Deferred income taxes 9,647 8,408
Total current assets 112,372 84,003
Investments 1,604 1,382
Net property and equipment 186,594 187,971
Notes receivable (less allowance for doubtful
accounts of $9,951 in 2010 and $10,858 in 2009) 17,354 16,359
Deferred income taxes - 6,804
Goodwill 74,697 75,066
Other assets 23,320 22,141
Total assets 415,941$ 393,726$
Liabilities and stockholders’ equity
Current liabilities:
Accounts payable 31,569$ 26,990$
Income and other taxes payable 6,140 5,854
Accrued expenses 52,978 54,241
Total current liabilities 90,687 87,085
Unearned franchise and development fees 6,596 5,668
Long-term debt 99,017 99,050
Other long-term liabilities 12,100 16,886
Deferred income taxes 341 -
Stockholders’ equity:
Preferred stock ($.01 par value per share; authorized 5,000 shares,
no shares issued) - -
Common stock ($.01 par value per share; authorized 50,000 shares,
issued 36,084 in 2010 and 35,738 in 2009) 361 358
Additional paid-in capital 245,380 231,720
Accumulated other comprehensive income (loss) 849 (1,084)
Retained earnings 243,152 191,212
Treasury stock (10,645 shares in 2010 and 8,808 shares in 2009, at cost) (291,048) (245,337)
Total stockholders’ equity, net of noncontrolling interests 198,694 176,869
Noncontrolling interests in subsidiaries 8,506 8,168
Total stockholders' equity 207,200 185,037
Total liabilities and stockholders’ equity 415,941$ 393,726$
See accompanying notes.
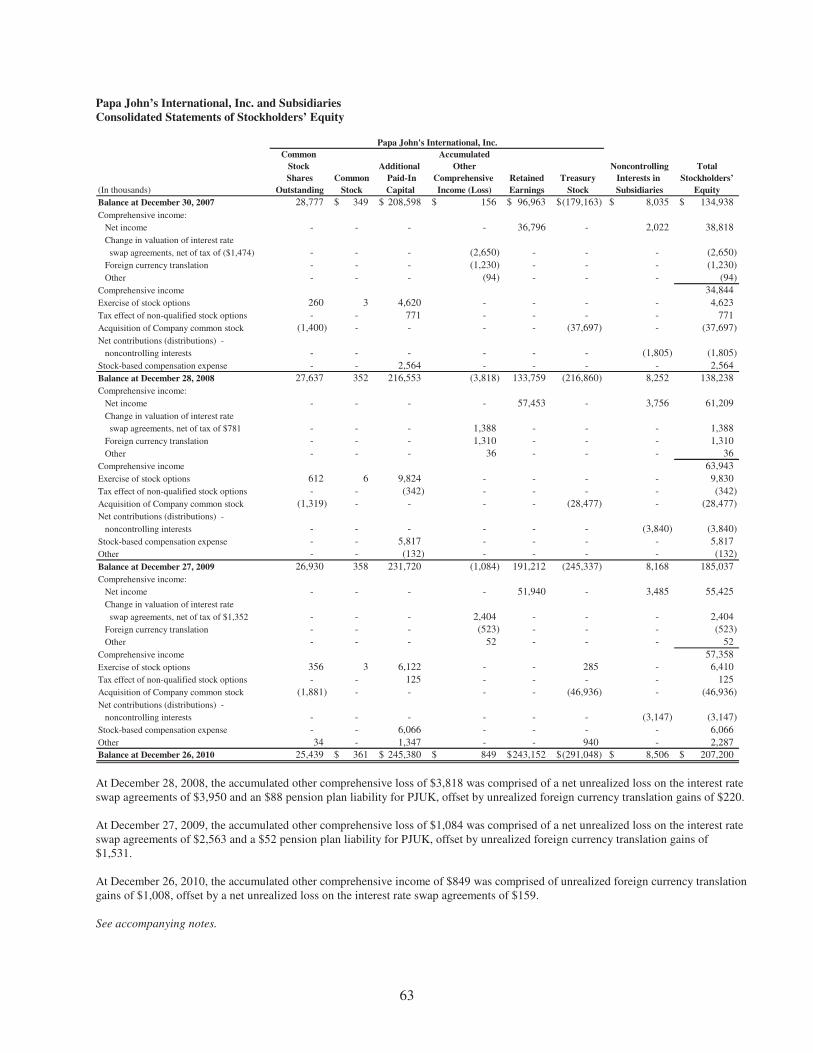
63
Papa John’s International, Inc. and Subsidiaries
Consolidated Statements of Stockholders’ Equity
Common Accumulated
Stock Additional Other Noncontrolling Total
Shares Common Paid-In Comprehensive Retained Treasury Interests in Stockholders’
(In thousands) Outstanding Stock Capital Income (Loss) Earnings Stock Subsidiaries Equity
Balance at December 30, 2007 28,777 349$ 208,598$ 156$ 96,963$ (179,163)$ 8,035$ 134,938$
Comprehensive income:
Net income - - - - 36,796 - 2,022 38,818
Change in valuation of interest rate
swap agreements, net of tax of ($1,474) - - - (2,650) - - - (2,650)
Foreign currency translation - - - (1,230) - - - (1,230)
Other - - - (94) - - - (94)
Comprehensive income 34,844
Exercise of stock options 260 3 4,620 - - - - 4,623
Tax effect of non-qualified stock options - - 771 - - - - 771
Acquisition of Company common stock (1,400) - - - - (37,697) - (37,697)
Net contributions (distributions) -
noncontrolling interests - - - - - - (1,805) (1,805)
Stock-based compensation expense - - 2,564 - - - - 2,564
Balance at December 28, 2008 27,637 352 216,553 (3,818) 133,759 (216,860) 8,252 138,238
Comprehensive income:
Net income - - - - 57,453 - 3,756 61,209
Change in valuation of interest rate
swap agreements, net of tax of $781 - - - 1,388 - - - 1,388
Foreign currency translation - - - 1,310 - - - 1,310
Other - - - 36 - - - 36
Comprehensive income 63,943
Exercise of stock options 612 6 9,824 - - - - 9,830
Tax effect of non-qualified stock options - - (342) - - - - (342)
Acquisition of Company common stock (1,319) - - - - (28,477) - (28,477)
Net contributions (distributions) -
noncontrolling interests - - - - - - (3,840) (3,840)
Stock-based compensation expense - - 5,817 - - - - 5,817
Other - - (132) - - - - (132)
Balance at December 27, 2009 26,930 358 231,720 (1,084) 191,212 (245,337) 8,168 185,037
Comprehensive income:
Net income - - - - 51,940 - 3,485 55,425
Change in valuation of interest rate
swap agreements, net of tax of $1,352 - - - 2,404 - - - 2,404
Foreign currency translation - - - (523) - - - (523)
Other - - - 52 - - - 52
Comprehensive income 57,358
Exercise of stock options 356 3 6,122 - - 285 - 6,410
Tax effect of non-qualified stock options - - 125 - - - - 125
Acquisition of Company common stock (1,881) - - - - (46,936) - (46,936)
Net contributions (distributions) -
noncontrolling interests - - - - - - (3,147) (3,147)
Stock-based compensation expense - - 6,066 - - - - 6,066
Other 34 - 1,347 - - 940 - 2,287
Balance at December 26, 2010 25,439 361$ 245,380$ 849$ 243,152$ (291,048)$ 8,506$ 207,200$
Papa John's International, Inc.
At December 28, 2008, the accumulated other comprehensive loss of $3,818 was comprised of a net unrealized loss on the interest rate swap agreements of $3,950 and an $88 pension plan liability for PJUK, offset by unrealized foreign currency translation gains of $220. At December 27, 2009, the accumulated other comprehensive loss of $1,084 was comprised of a net unrealized loss on the interest rate swap agreements of $2,563 and a $52 pension plan liability for PJUK, offset by unrealized foreign currency translation gains of $1,531. At December 26, 2010, the accumulated other comprehensive income of $849 was comprised of unrealized foreign currency translation gains of $1,008, offset by a net unrealized loss on the interest rate swap agreements of $159. See accompanying notes.
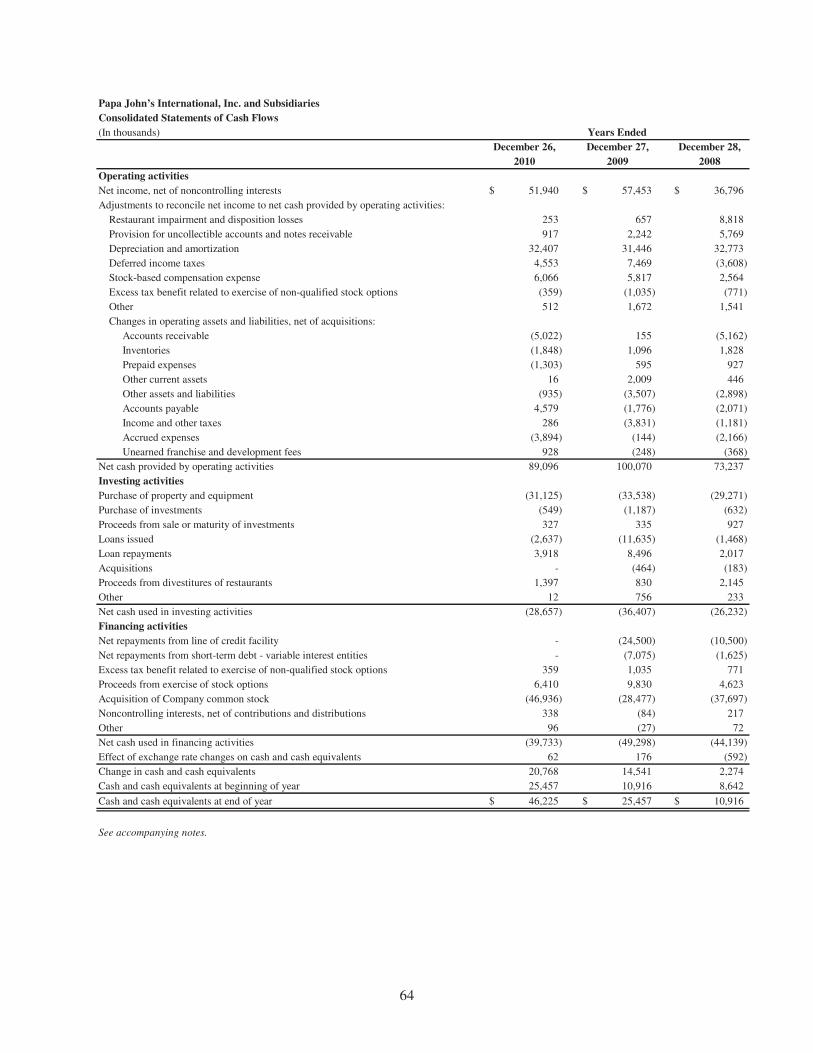
64
Papa John’s International, Inc. and Subsidiaries
Consolidated Statements of Cash Flows
(In thousands) Years Ended
December 26, December 27, December 28,
2010 2009 2008
Operating activities
Net income, net of noncontrolling interests 51,940$ 57,453$ 36,796$
Adjustments to reconcile net income to net cash provided by operating activities:
Restaurant impairment and disposition losses 253 657 8,818
Provision for uncollectible accounts and notes receivable 917 2,242 5,769
Depreciation and amortization 32,407 31,446 32,773
Deferred income taxes 4,553 7,469 (3,608)
Stock-based compensation expense 6,066 5,817 2,564
Excess tax benefit related to exercise of non-qualified stock options (359) (1,035) (771)
Other 512 1,672 1,541
Changes in operating assets and liabilities, net of acquisitions:
Accounts receivable (5,022) 155 (5,162)
Inventories (1,848) 1,096 1,828
Prepaid expenses (1,303) 595 927
Other current assets 16 2,009 446
Other assets and liabilities (935) (3,507) (2,898)
Accounts payable 4,579 (1,776) (2,071)
Income and other taxes 286 (3,831) (1,181)
Accrued expenses (3,894) (144) (2,166)
Unearned franchise and development fees 928 (248) (368)
Net cash provided by operating activities 89,096 100,070 73,237
Investing activities
Purchase of property and equipment (31,125) (33,538) (29,271)
Purchase of investments (549) (1,187) (632)
Proceeds from sale or maturity of investments 327 335 927
Loans issued (2,637) (11,635) (1,468)
Loan repayments 3,918 8,496 2,017
Acquisitions - (464) (183)
Proceeds from divestitures of restaurants 1,397 830 2,145
Other 12 756 233
Net cash used in investing activities (28,657) (36,407) (26,232)
Financing activities
Net repayments from line of credit facility - (24,500) (10,500)
Net repayments from short-term debt - variable interest entities - (7,075) (1,625)
Excess tax benefit related to exercise of non-qualified stock options 359 1,035 771
Proceeds from exercise of stock options 6,410 9,830 4,623
Acquisition of Company common stock (46,936) (28,477) (37,697)
Noncontrolling interests, net of contributions and distributions 338 (84) 217
Other 96 (27) 72
Net cash used in financing activities (39,733) (49,298) (44,139)
Effect of exchange rate changes on cash and cash equivalents 62 176 (592)
Change in cash and cash equivalents 20,768 14,541 2,274
Cash and cash equivalents at beginning of year 25,457 10,916 8,642
Cash and cash equivalents at end of year 46,225$ 25,457$ 10,916$
See accompanying notes.
65
Papa John’s International, Inc. and Subsidiaries
Notes to Consolidated Financial Statements
1. Description of Business
Papa John’s International, Inc. (referred to as the “Company,” “Papa John’s” or in the first person
notations of “we,” “us” and “our”) operates and franchises pizza delivery and carryout restaurants under
the trademark “Papa John’s,” currently in all 50 states, the District of Columbia, Puerto Rico and 32
countries. Substantially all revenues are derived from retail sales of pizza and other food and beverage
products to the general public by Company-owned restaurants, franchise royalties, sales of franchise and
development rights, and sales to franchisees of food and paper products, printing and promotional items,
risk management services, and information systems and related services used in their operations.
2. Significant Accounting Policies
Principles of Consolidation
The accompanying consolidated financial statements include the accounts of Papa John’s and its
subsidiaries. Our financial results include BIBP Commodities, Inc. (“BIBP”), a variable interest entity
(“VIE”) for which we are the primary beneficiary. The results of our Company-owned operations in
Mexico and China are consolidated one month in arrears. The results of our inactive captive insurance
subsidiary, RSC Insurance Services, Ltd. (“RSC”), are consolidated one quarter in arrears. All significant
intercompany balances and transactions have been eliminated.
Fiscal Year
Our fiscal year ends on the last Sunday in December of each year. All fiscal years presented consist of 52
weeks.
Use of Estimates
The preparation of consolidated financial statements in conformity with accounting principles generally
accepted in the United States requires management to make estimates and assumptions that affect the
amounts reported in the consolidated financial statements and accompanying notes. Significant items that
are subject to such estimates and assumptions include allowance for doubtful accounts and notes
receivable, long-lived and intangible assets, insurance reserves and income tax reserves. Although
management bases its estimates on historical experience and assumptions that are believed to be
reasonable under the circumstances, actual results could significantly differ from these estimates.
Revenue Recognition
Franchise fees are recognized when a franchised restaurant begins operations, at which time we have
performed our obligations related to such fees. Fees received pursuant to development agreements that
grant the right to develop franchised restaurants in future periods in specific geographic areas are
deferred and recognized on a pro rata basis as the franchised restaurants subject to the development
agreements begin operations. Both franchise and development fees are nonrefundable. Retail sales from
Company-owned restaurants and franchise royalties, which are based on a percentage of franchise
restaurant sales, are recognized as revenues when the products are delivered to or carried out by
customers.
66
2. Significant Accounting Policies (continued)
Domestic production and distribution revenues are comprised of food, promotional items, and supplies
sales to franchised restaurants located in the United States and are recognized as revenue upon shipment
of the related products to the franchisees. Information services, including software maintenance fees,
help desk fees and online ordering fees are recognized as revenue as the related services are provided.
Insurance commissions are recognized as revenue over the term of the policy period.
International revenues are comprised of restaurant sales, royalties and fees received from foreign
franchisees and the sale and distribution of food to foreign franchisees, and are recognized consistently
with the policies applied for revenues generated in the United States.
Cash Equivalents
Cash equivalents consist of highly liquid investments with maturity of three months or less at date of
purchase. These investments are carried at cost, which approximates fair value.
Investments
We determine the appropriate classification of investment securities at the time of purchase and
reevaluate such designation as of each balance sheet date.
Investments are comprised of cash equivalent or U.S. government securities. Such investments are
designated for the purpose of funding insurance claim payments and are not available for general use.
The investments are classified as available for sale securities and are stated at fair value, which
approximates carrying value, based upon quoted market prices.
Accounts Receivable
Substantially all accounts receivable are due from franchisees for purchases of food, paper products,
restaurant equipment, printing and promotional items, risk management services, information systems
and related services, and for royalties from December sales. Credit is extended based on an evaluation of
the franchisee’s financial condition and, generally, collateral is not required. A reserve for uncollectible
accounts is established as deemed necessary based upon overall accounts receivable aging levels and a
specific review of accounts for franchisees with known financial difficulties.
Inventories
Inventories, which consist of food products, paper goods and supplies, smallwares, and printing and
promotional items, are stated at the lower of cost, determined under the first-in, first-out (FIFO) method,
or market.
Property and Equipment
Property and equipment are stated at cost. Depreciation is provided using the straight-line method over
the estimated useful lives of the assets (generally five to ten years for restaurant, commissary and other
equipment, and 20 to 40 years for buildings and improvements). Leasehold improvements are amortized
over the terms of the respective leases, including the first renewal period (generally five to ten years).
Depreciation expense was $31.4 million in 2010, $30.6 million in 2009 and $31.8 million in 2008.

67
2. Significant Accounting Policies (continued)
Leases
Lease expense is recognized on a straight-line basis over the expected life of the lease term. A lease term
often includes option periods, available at the inception of the lease, when failure to renew the lease
would impose a penalty to us. Such penalty may include the recognition of impairment on our leasehold
improvements should we choose not to continue the use of the leased property.
Long-Lived and Intangible Assets
The recoverability of long-lived assets is evaluated if impairment indicators exist. Indicators of
impairment include historical financial performance, operating trends and our future operating plans. If
impairment indicators exist, we evaluate the recoverability of long-lived assets on an operating unit basis
(e.g., an individual restaurant) based on undiscounted expected future cash flows before interest for the
expected remaining useful life of the operating unit. Recorded values for long-lived assets that are not
expected to be recovered through undiscounted future cash flows are written down to current fair value,
which is generally determined from estimated discounted future net cash flows for assets held for use or
estimated net realizable value for assets held for sale.
The recoverability of indefinite-lived intangible assets (i.e., goodwill) is evaluated annually or more
frequently if impairment indicators exist, on a reporting unit basis by comparing the estimated fair value
to its carrying value. Our estimated fair value for Company-owned restaurants is comprised of two
components. The first component is the cash sales price that would be received at the time of the sale and
the second component is an investment in the continuing franchise agreement, representing the
discounted value of future royalties less any incremental direct operating costs, that would be collected
under the ten-year franchise agreement.
During 2008, we sold to domestic franchisees a total of 62 Company-owned restaurants located primarily
in three markets. As part of the sales of these restaurants, we recorded a $3.6 million intangible asset for
the investment in the continuing franchise agreement, representing the discounted value of the royalties
we will receive over the next ten years from the purchaser/franchisee. The intangible asset will be
amortized over the ten-year franchise agreement as a reduction in royalty income of $360,000 annually.
The intangible asset is recorded in other assets in the accompanying consolidated balance sheet at
December 26, 2010 with a remaining value of $2.8 million.
At December 26, 2010, we had a net investment of approximately $20.4 million associated with our
United Kingdom subsidiary (PJUK). During 2008, we recorded a goodwill impairment charge of $2.3
million associated with our PJUK operations (none in 2010 or 2009). We updated our evaluation of the
fair value of our PJUK subsidiary in 2010. Our analysis indicated the fair value exceeded the carrying
value by approximately 10%. The goodwill allocated to this entity approximated $14.7 million at
December 26, 2010. We have plans for PJUK to continue to improve its operating results, including
efforts to increase Papa John’s brand awareness in the United Kingdom, improve sales and profitability
for individual restaurants and increase net PJUK franchised unit openings over the next several years. We
are currently on target to achieve these plans.
68
2. Significant Accounting Policies (continued)
We updated our evaluation of the fair value of our investment in our domestic Company-owned
restaurants during 2010. We test for goodwill impairment at the region level, which is one step below the
reporting segment level. The fair value of each reporting unit was substantially in excess of its carrying
value as of the annual test date.
See Note 6 for additional information.
Restaurant Closures
We recognize the costs associated with restaurant closures at the time such costs are actually incurred,
generally expected to be at the time the closing occurs.
Deferred Costs
We defer certain systems development and related costs that meet established criteria. Amounts deferred,
which are included in property and equipment, are amortized principally over periods not exceeding five
years beginning in the month subsequent to completion of the related systems project. Total costs
deferred were approximately $2.0 million in 2010, $800,000 in 2009 and $750,000 in 2008.
The unamortized systems development costs approximated $3.6 million and $2.8 million as of December
26, 2010 and December 27, 2009, respectively.
Deferred Income Tax Accounts and Tax Reserves
Papa John’s is subject to income taxes in the United States and several foreign jurisdictions. Significant
judgment is required in determining Papa John’s provision for income taxes and the related assets and
liabilities. The provision for income taxes includes income taxes paid, currently payable or receivable
and those deferred. Deferred tax assets and liabilities are determined based on differences between
financial reporting and tax basis of assets and liabilities, and are measured using enacted tax rates and
laws that are expected to be in effect when the differences reverse. Deferred tax assets are also
recognized for the estimated future effects of tax loss carryforwards. The effect on deferred taxes of
changes in tax rates is recognized in the period in which the enactment date changes. As a result, our
effective tax rate may fluctuate. Valuation allowances are established when necessary on a jurisdictional
basis to reduce deferred tax assets to the amounts we expect to realize.
As of December 26, 2010, we had a net deferred income tax asset balance of $9.3 million. We have not
provided a valuation allowance for the deferred income tax assets associated with our domestic
operations since we believe it is more likely than not that future earnings will be sufficient to ensure the
realization of the net deferred income tax assets for federal and state purposes.
Certain tax authorities periodically audit the Company. We provide reserves for potential exposures. We
evaluate these issues on a quarterly basis to adjust for events, such as court rulings or audit settlements,
which may impact our ultimate payment for such exposures. We recognized reductions of $550,000,
$1.2 million and $1.7 million in our customary income tax expense associated with the finalization of
certain income tax issues in 2010, 2009 and 2008, respectively. See Note 13 for additional information.

69
2. Significant Accounting Policies (continued)
Advertising and Related Costs
Advertising and related costs include the costs of domestic Company-owned restaurant activities such as
mail coupons, door hangers and promotional items and contributions to Papa John’s Marketing Fund, Inc.
(the “Marketing Fund”) and local market cooperative advertising funds (“Co-op Funds”). Contributions
by domestic Company-owned and franchised restaurants to the Marketing Fund and the Co-op Funds are
based on an established percentage of monthly restaurant revenues. The Marketing Fund is responsible
for developing and conducting marketing and advertising for the Papa John’s system. The Co-op Funds
are responsible for developing and conducting advertising activities in a specific market, including the
placement of electronic and print materials developed by the Marketing Fund. We recognize domestic
Company-owned restaurant contributions to the Marketing Fund and the Co-op Funds in which we do not
have a controlling interest in the period in which the contribution accrues.
The assets of the Co-op Funds in which we possess majority voting rights, and thus control the
cooperatives, are consolidated in Other Current Assets in our Consolidated Balance Sheets.
Foreign Currency Translation
The local currency is the functional currency for our foreign subsidiaries, located in the United Kingdom,
Mexico and China. Earnings and losses are translated into U.S. dollars using monthly average exchange
rates, while balance sheet accounts are translated using year-end exchange rates. The resulting translation
adjustments are included as a component of accumulated other comprehensive income (loss).
Stock-Based Compensation
Compensation expense for equity grants is estimated on the grant date, net of projected forfeitures. Stock
options are valued using a Black-Scholes option pricing model. Our specific weighted-average
assumptions for the risk-free interest rate, expected term, expected volatility and expected dividend yield
are included in Note 17. Restricted stock is valued based on the market price of the Company’s shares on
the date of grant.
Fair Value Measurements and Disclosures
The Fair Value Measurements and Disclosures topic of the Accounting Standards Codification (“ASC”)
requires companies to determine fair value based on the price that would be received to sell the asset or
paid to transfer the liability to a market participant. The Fair Value Measurements and Disclosures topic
emphasizes that fair value is a market-based measurement, not an entity-specific measurement. The
guideline required a phase-in approach: (1) phase one was effective for financial assets and liabilities in
our first quarter of 2008 and (2) phase two was effective for non-financial assets and liabilities in our
first quarter of fiscal 2009. The new provisions did not have a significant impact on our financial
statements.
The guidance requires that assets and liabilities carried at fair value be classified and disclosed in one of
the following categories:
• Level 1: Quoted market prices in active markets for identical assets or liabilities.
• Level 2: Observable market based inputs or unobservable inputs that are corroborated by market
data.
• Level 3: Unobservable inputs that are not corroborated by market data.

70
2. Significant Accounting Policies (continued)
Our financial assets and liabilities that were measured at fair value on a recurring basis as of December
26, 2010 and December 27, 2009 are as follows:
Carrying
(In thousands) Value Level 1 Level 2 Level 3
December 26, 2010
Financial assets:
Investments 1,604$ 1,604$ -$ -$
Non-qualified deferred compensation plan 12,455 12,455 - -
Financial liabilities:
Interest rate swaps 313 - 313 -
December 27, 2009
Financial assets:
Investments 1,382$ 1,382$ -$ -$
Non-qualified deferred compensation plan 11,754 11,754 - -
Financial liabilities:
Interest rate swaps 4,044 - 4,044 -
Fair Value Measurements
Derivative Financial Instruments
We recognize all derivatives on the balance sheet at fair value. Derivatives that are not hedges must be
adjusted to fair value through income. At inception and on an ongoing basis, we assess whether each
derivative that qualifies for hedge accounting continues to be highly effective in offsetting changes in
the cash flows of the hedged item. If the derivative meets the hedge criteria as defined by certain
accounting standards, depending on the nature of the hedge, changes in the fair value of the derivative
are either offset against the change in fair value of assets, liabilities or firm commitments through
earnings or recognized in accumulated other comprehensive income (loss) until the hedged item is
recognized in earnings. The ineffective portion of a derivative’s change in fair value, if any, is
immediately recognized in earnings.
We recognized income of $3.8 million ($2.4 million after tax) in accumulated other comprehensive
income (loss) in 2010 and income of $2.2 million ($1.4 million after tax) in 2009 and a loss of $4.1
million ($2.7 million after tax) in 2008 for the net change in fair value of our derivatives associated with
our debt agreements. The ineffective portion of our hedge was $25,000 in 2010 and $40,000 in 2009
(none in 2008). Fair value is based on quoted market prices. See Note 7 for additional information on
our debt and credit arrangements.

71
2. Significant Accounting Policies (continued)
Earnings per Share
The calculations of basic earnings per common share and earnings per common share – assuming dilution
for the years ended December 26, 2010, December 27, 2009 and December 28, 2008 are as follows (in
thousands, except per share data):
2010 2009 2008
Basic earnings per common share:
Net income, net of noncontrolling interests 51,940$ 57,453$ 36,796$
Weighted average shares outstanding 26,328 27,738 28,124
Basic earnings per common share 1.97$ 2.07$ 1.31$
Earnings per common share - assuming dilution:
Net income, net of noncontrolling interests 51,940$ 57,453$ 36,796$
Weighted average shares outstanding 26,328 27,738 28,124
Dilutive effect of outstanding compensation awards 140 171 140
Diluted weighted average shares outstanding 26,468 27,909 28,264
Earnings per common share - assuming dilution 1.96$ 2.06$ 1.30$
Shares subject to options to purchase common stock with an exercise price greater than the average
market price for the year were not included in the computation of the dilutive effect of common stock
options because the effect would have been antidilutive. The weighted average number of shares subject
to antidilutive options was 1.5 million in 2010, 1.4 million in 2009 and 1.5 million in 2008.
Recent Accounting Pronouncements
Consolidation
Noncontrolling interests. The Consolidation topic of the ASC requires all entities to report
noncontrolling (minority) interests in subsidiaries as equity in the consolidated financial statements, but
separate from the equity of the parent company. The Consolidation topic further requires that
consolidated net income be reported at amounts attributable to the parent and the noncontrolling interest,
rather than expensing the income attributable to the noncontrolling interest holder. Additionally,
disclosures are required to clearly identify and distinguish between the interests of the parent company
and the interests of the noncontrolling owners, including a disclosure on the face of the consolidated
statements for income attributable to the noncontrolling interest holder.
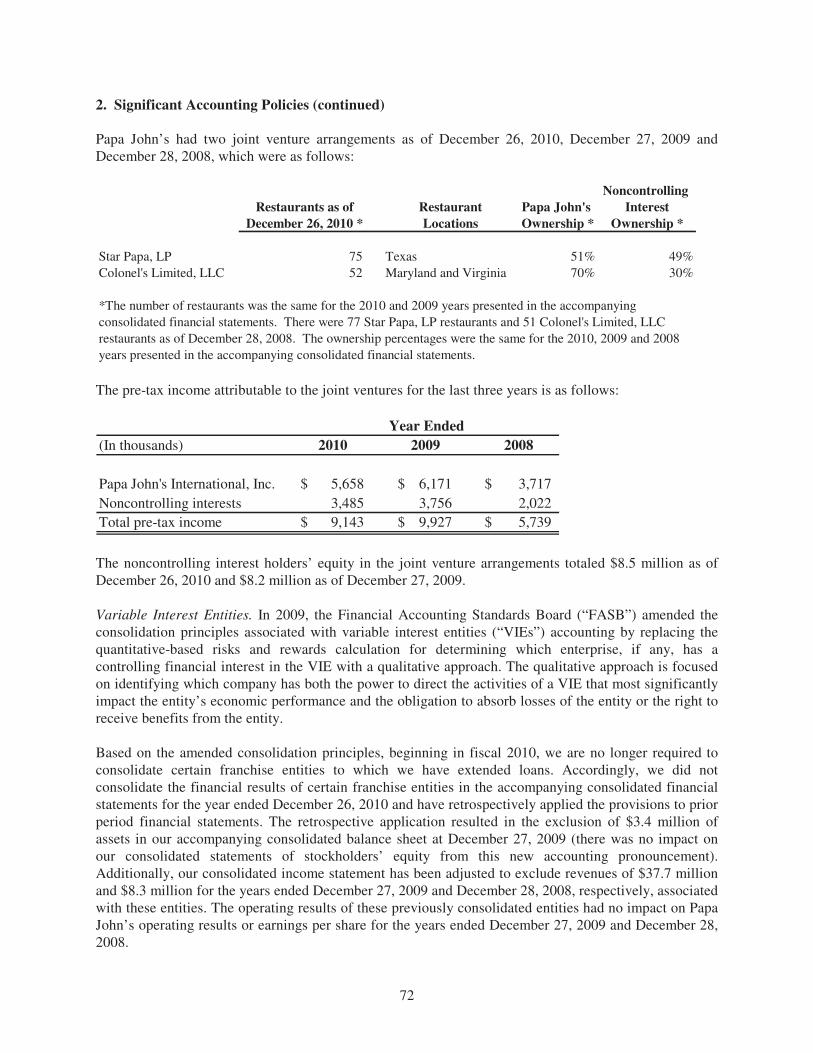
72
2. Significant Accounting Policies (continued)
Papa John’s had two joint venture arrangements as of December 26, 2010, December 27, 2009 and
December 28, 2008, which were as follows:
Noncontrolling
Restaurants as of Restaurant Papa John's Interest
December 26, 2010 * Locations Ownership * Ownership *
Star Papa, LP 75 Texas 51% 49%
Colonel's Limited, LLC 52 Maryland and Virginia 70% 30%
*The number of restaurants was the same for the 2010 and 2009 years presented in the accompanying
consolidated financial statements. There were 77 Star Papa, LP restaurants and 51 Colonel's Limited, LLC
restaurants as of December 28, 2008. The ownership percentages were the same for the 2010, 2009 and 2008
years presented in the accompanying consolidated financial statements.
The pre-tax income attributable to the joint ventures for the last three years is as follows:
(In thousands) 2010 2009 2008
Papa John's International, Inc. 5,658$ 6,171$ 3,717$
Noncontrolling interests 3,485 3,756 2,022
Total pre-tax income 9,143$ 9,927$ 5,739$
Year Ended
The noncontrolling interest holders’ equity in the joint venture arrangements totaled $8.5 million as of
December 26, 2010 and $8.2 million as of December 27, 2009.
Variable Interest Entities. In 2009, the Financial Accounting Standards Board (“FASB”) amended the
consolidation principles associated with variable interest entities (“VIEs”) accounting by replacing the
quantitative-based risks and rewards calculation for determining which enterprise, if any, has a
controlling financial interest in the VIE with a qualitative approach. The qualitative approach is focused
on identifying which company has both the power to direct the activities of a VIE that most significantly
impact the entity’s economic performance and the obligation to absorb losses of the entity or the right to
receive benefits from the entity.
Based on the amended consolidation principles, beginning in fiscal 2010, we are no longer required to
consolidate certain franchise entities to which we have extended loans. Accordingly, we did not
consolidate the financial results of certain franchise entities in the accompanying consolidated financial
statements for the year ended December 26, 2010 and have retrospectively applied the provisions to prior
period financial statements. The retrospective application resulted in the exclusion of $3.4 million of
assets in our accompanying consolidated balance sheet at December 27, 2009 (there was no impact on
our consolidated statements of stockholders’ equity from this new accounting pronouncement).
Additionally, our consolidated income statement has been adjusted to exclude revenues of $37.7 million
and $8.3 million for the years ended December 27, 2009 and December 28, 2008, respectively, associated
with these entities. The operating results of these previously consolidated entities had no impact on Papa
John’s operating results or earnings per share for the years ended December 27, 2009 and December 28,
2008.

73
2. Significant Accounting Policies (continued)
Derivatives and Hedging
In 2009, Papa John’s adopted the latest provisions of the ASC topic, Derivatives and Hedging. The
guidance enhanced the required disclosures regarding derivatives and hedging activities, including
disclosures regarding how and why an entity uses derivative instruments, how derivative instruments and
related hedged items are accounted, and how derivative instruments and related hedged items affect an
entity’s financial position, results of operations and cash flows. See Note 7 for additional information.
Modification of our Non-qualified Deferred Compensation Plan
During 2010, we modified the provisions of our non-qualified deferred compensation plan. Previously,
participants who elected an investment in phantom Papa John’s stock were paid in cash upon settlement
of their investment balance. Effective the first quarter of 2010, we began settling future distributions of
the deemed investment balances in Papa John’s stock through the issuance of Company stock.
Accordingly, during 2010, we reclassified $2.0 million from other long-term liabilities to paid-in capital
in the accompanying consolidated financial statements.
Subsequent Events
We evaluated subsequent events through the date the financial statements were issued and filed with this
Form 10-K. There were no subsequent events that required recognition or disclosure.
3. Accounting for Variable Interest Entities
The Consolidation topic of the ASC provides a framework for identifying VIEs and determining when a
company should include the assets, liabilities, noncontrolling interests and results of activities of a VIE in
its consolidated financial statements.
In general, a VIE is a corporation, partnership, limited liability company, trust, or any other legal
structure used to conduct activities or hold assets that either (1) has an insufficient amount of equity to
carry out its principal activities without additional subordinated financial support, (2) has a group of
equity owners that are unable to make significant decisions about its activities, or (3) has a group of
equity owners that do not have the obligation to absorb losses or the right to receive returns generated by
its operations.
Consolidation of a VIE is required if a party with an ownership, contractual or other financial interest in
the VIE (“a variable interest holder”) is obligated to absorb a majority of the risk of loss from the VIE’s
activities, is entitled to receive a majority of the VIE’s residual returns (if no party absorbs a majority of
the VIE’s losses), or both. A variable interest holder that consolidates the VIE is called the primary
beneficiary. Upon consolidation, the primary beneficiary generally must initially record all of the VIE’s
assets, liabilities and noncontrolling interests at fair value and subsequently account for the VIE as if it
were consolidated based on majority voting interest. Disclosures about VIEs that the variable interest
holder is not required to consolidate but in which it has a significant variable interest is also required.
74
3. Accounting for Variable Interest Entities (continued)
Through December 2010, we had a purchasing agreement with BIBP, a special-purpose entity formed at
the direction of our Franchise Advisory Council, for the sole purpose of reducing cheese price volatility
to domestic system-wide restaurants. BIBP is an independent, franchisee-owned corporation. BIBP
purchases cheese at the market price and sells it to our distribution subsidiary, PJ Food Service, Inc.
(“PJFS”), at a fixed price. PJFS in turn sells cheese to Papa John’s restaurants (both Company-owned
and franchised) at a set price. PJFS purchased $153.0 million, $142.4 million and $165.4 million of
cheese from BIBP during 2010, 2009 and 2008, respectively.
We are deemed the primary beneficiary of BIBP, a VIE, for accounting purposes. We recognize the
operating losses generated by BIBP if BIBP’s shareholders’ equity is in a net deficit position. Further, we
recognize the subsequent operating income generated by BIBP up to the amount of any losses previously
recognized. We recognized pre-tax income of $21.0 million ($13.5 million net of tax, or $0.51 per diluted
share) in 2010, pre-tax income of $22.5 million ($14.6 million net of tax, or $0.52 per diluted share) in
2009 and pre-tax loss of $10.5 million ($6.9 million net of tax, or $0.24 per diluted share) in 2008,
reflecting BIBP’s operating income (losses), net of BIBP’s shareholders’ equity.
BIBP had an accumulated deficit (representing prior purchases of cheese by PJFS from BIBP at below
market prices) of $14.2 million at December 26, 2010. PJFS agreed to pay BIBP the amount equal to the
accumulated deficit at December 26, 2010. Accordingly, BIBP recorded a decrease of $14.2 million in
cost of sales and PJFS recorded a corresponding increase in cost of sales. This transaction did not have
any impact on the Company's 2010 consolidated income statement results since both PJFS and BIBP are
fully consolidated.
As of February 15, 2011, substantially all of our domestic franchisees have entered into a cheese
purchasing agreement with the Company. The cheese purchasing agreement requires participating
domestic franchisees to commit to purchase cheese through PJFS, or to pay the franchisee’s portion of
any accumulated cheese liability upon ceasing to purchase cheese from PJFS when a liability exists.
Accordingly, beginning in 2011, the consolidation of BIBP, or a similarly structured program, will no
longer have a significant impact on our consolidated statements of income.
4. Acquisitions
We acquired 11 restaurants in Florida in 2009 at a purchase price of $2.8 million, which was comprised
of a cash payment of approximately $460,000 and the cancellation of a $2.3 million note due to us. We
recorded goodwill of $1.5 million associated with this acquisition. The business combination was
accounted for by the purchase method of accounting, whereby operating results subsequent to the
acquisition date are included in our consolidated financial statements. The goodwill associated with the
above-mentioned acquisition was eligible for deduction over 15 years under U.S. tax regulations.
There were no significant acquisitions during 2010 and 2008.

75
5. Goodwill and Other Intangible Assets
Our consolidated balance sheets include $74.7 million and $75.1 million of goodwill at December 26,
2010 and December 27, 2009, respectively. The changes in the carrying amount of goodwill by
reportable segment for the years ended December 26, 2010 and December 27, 2009 are as follows:
Domestic All
(in thousands) Restaurants International Others Total
Balance as of December 28, 2008 53,474$ 18,448$ 436$ 72,358$
Acquisitions 1,546 - - 1,546
Other, including foreign currency adjustments 240 922 - 1,162
Balance as of December 27, 2009 55,260 19,370 436 75,066
Other, including foreign currency adjustments - (369) - (369)
Balance as of December 26, 2010 55,260$ 19,001$ 436$ 74,697$
See Notes 4 and 6 for discussions of acquisitions and dispositions of Company-owned restaurants.
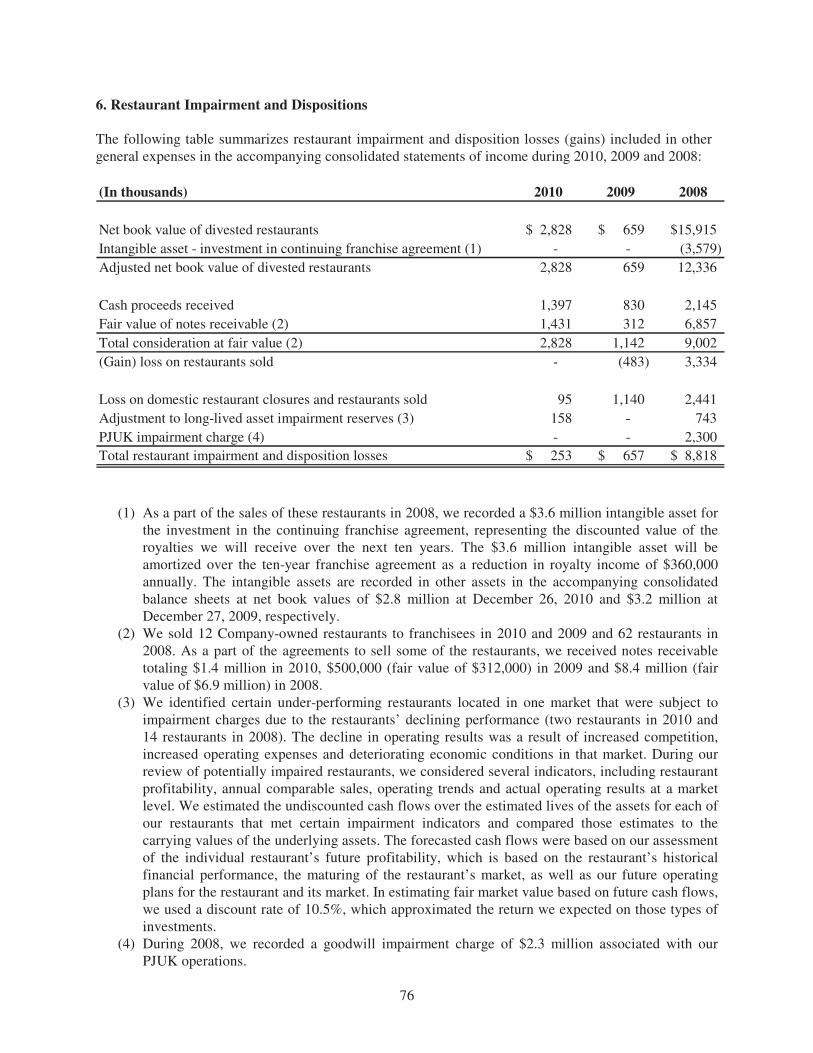
76
6. Restaurant Impairment and Dispositions
The following table summarizes restaurant impairment and disposition losses (gains) included in other
general expenses in the accompanying consolidated statements of income during 2010, 2009 and 2008:
(In thousands) 2010 2009 2008
Net book value of divested restaurants 2,828$ 659$ 15,915$
Intangible asset - investment in continuing franchise agreement (1) - - (3,579)
Adjusted net book value of divested restaurants 2,828 659 12,336
Cash proceeds received 1,397 830 2,145
Fair value of notes receivable (2) 1,431 312 6,857
Total consideration at fair value (2) 2,828 1,142 9,002
(Gain) loss on restaurants sold - (483) 3,334
Loss on domestic restaurant closures and restaurants sold 95 1,140 2,441
Adjustment to long-lived asset impairment reserves (3) 158 - 743
PJUK impairment charge (4) - - 2,300
Total restaurant impairment and disposition losses 253$ 657$ 8,818$
(1) As a part of the sales of these restaurants in 2008, we recorded a $3.6 million intangible asset for
the investment in the continuing franchise agreement, representing the discounted value of the
royalties we will receive over the next ten years. The $3.6 million intangible asset will be
amortized over the ten-year franchise agreement as a reduction in royalty income of $360,000
annually. The intangible assets are recorded in other assets in the accompanying consolidated
balance sheets at net book values of $2.8 million at December 26, 2010 and $3.2 million at
December 27, 2009, respectively.
(2) We sold 12 Company-owned restaurants to franchisees in 2010 and 2009 and 62 restaurants in
2008. As a part of the agreements to sell some of the restaurants, we received notes receivable
totaling $1.4 million in 2010, $500,000 (fair value of $312,000) in 2009 and $8.4 million (fair
value of $6.9 million) in 2008.
(3) We identified certain under-performing restaurants located in one market that were subject to
impairment charges due to the restaurants’ declining performance (two restaurants in 2010 and
14 restaurants in 2008). The decline in operating results was a result of increased competition,
increased operating expenses and deteriorating economic conditions in that market. During our
review of potentially impaired restaurants, we considered several indicators, including restaurant
profitability, annual comparable sales, operating trends and actual operating results at a market
level. We estimated the undiscounted cash flows over the estimated lives of the assets for each of
our restaurants that met certain impairment indicators and compared those estimates to the
carrying values of the underlying assets. The forecasted cash flows were based on our assessment
of the individual restaurant’s future profitability, which is based on the restaurant’s historical
financial performance, the maturing of the restaurant’s market, as well as our future operating
plans for the restaurant and its market. In estimating fair market value based on future cash flows,
we used a discount rate of 10.5%, which approximated the return we expected on those types of
investments.
(4) During 2008, we recorded a goodwill impairment charge of $2.3 million associated with our
PJUK operations.
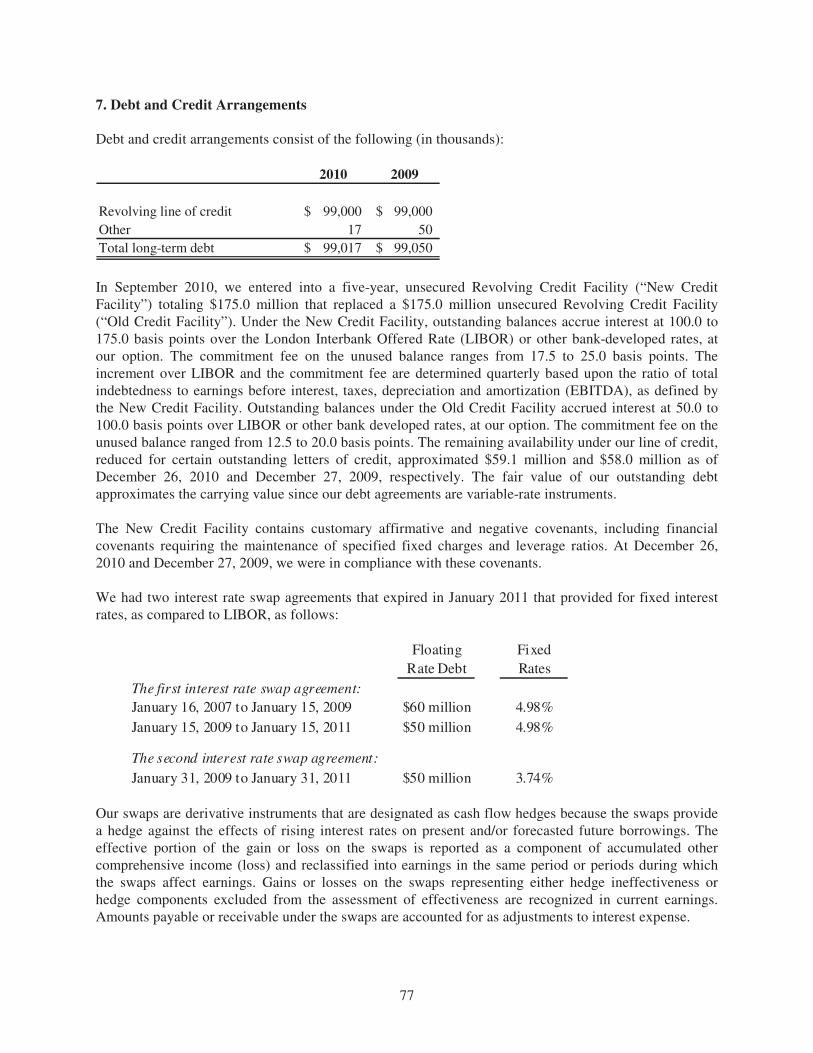
77
7. Debt and Credit Arrangements
Debt and credit arrangements consist of the following (in thousands):
2010 2009
Revolving line of credit 99,000$ 99,000$
Other 17 50
Total long-term debt 99,017$ 99,050$
In September 2010, we entered into a five-year, unsecured Revolving Credit Facility (“New Credit
Facility”) totaling $175.0 million that replaced a $175.0 million unsecured Revolving Credit Facility
(“Old Credit Facility”). Under the New Credit Facility, outstanding balances accrue interest at 100.0 to
175.0 basis points over the London Interbank Offered Rate (LIBOR) or other bank-developed rates, at
our option. The commitment fee on the unused balance ranges from 17.5 to 25.0 basis points. The
increment over LIBOR and the commitment fee are determined quarterly based upon the ratio of total
indebtedness to earnings before interest, taxes, depreciation and amortization (EBITDA), as defined by
the New Credit Facility. Outstanding balances under the Old Credit Facility accrued interest at 50.0 to
100.0 basis points over LIBOR or other bank developed rates, at our option. The commitment fee on the
unused balance ranged from 12.5 to 20.0 basis points. The remaining availability under our line of credit,
reduced for certain outstanding letters of credit, approximated $59.1 million and $58.0 million as of
December 26, 2010 and December 27, 2009, respectively. The fair value of our outstanding debt
approximates the carrying value since our debt agreements are variable-rate instruments.
The New Credit Facility contains customary affirmative and negative covenants, including financial
covenants requiring the maintenance of specified fixed charges and leverage ratios. At December 26,
2010 and December 27, 2009, we were in compliance with these covenants.
We had two interest rate swap agreements that expired in January 2011 that provided for fixed interest
rates, as compared to LIBOR, as follows:
Floating
Rate Debt
Fixed
Rates
The first interest rate swap agreement:
January 16, 2007 to January 15, 2009 $60 million 4.98%
January 15, 2009 to January 15, 2011 $50 million 4.98%
The second interest rate swap agreement:
January 31, 2009 to January 31, 2011 $50 million 3.74%
Our swaps are derivative instruments that are designated as cash flow hedges because the swaps provide
a hedge against the effects of rising interest rates on present and/or forecasted future borrowings. The
effective portion of the gain or loss on the swaps is reported as a component of accumulated other
comprehensive income (loss) and reclassified into earnings in the same period or periods during which
the swaps affect earnings. Gains or losses on the swaps representing either hedge ineffectiveness or
hedge components excluded from the assessment of effectiveness are recognized in current earnings.
Amounts payable or receivable under the swaps are accounted for as adjustments to interest expense.

78
7. Debt and Credit Arrangements (continued)
The following tables provide information on the location and amounts of our swaps in the accompanying
consolidated financial statements (in thousands):
Fair Values of Derivative Instruments
Balance Sheet Location
Fair Value
2010
Fair Value
2009
Derivatives designated as hedging
instruments:
Interest rate swaps Other long-term liabilities 313$ 4,044$
There were no derivatives that were not designated as hedging instruments under the provisions of the ASC topic,
Derivatives and Hedging.
Liability Derivatives
Effect of Derivative Instruments on the Consolidated Financial Statements
Derivatives -
Cash Flow
Hedging
Relationships
Amount of Gain
or (Loss)
Recognized in
Accumulated
OCI on
Derivative
(Effective
Portion)
Location of Gain
or (Loss)
Reclassified
from
Accumulated
OCI into Income
(Effective
Portion)
Amount of Gain
or (Loss)
Reclassified
from
Accumulated
OCI into Income
(Effective
Portion)
Location of Gain
or (Loss)
Recognized in
Income on
Derivative
(Ineffective
Portion and
Amount
Excluded from
Effectiveness
Testing)
Amount of Gain
or (Loss)
Recognized in
Income on
Derivative
(Ineffective
Portion and
Amount
Excluded from
Effectiveness
Testing)*
Interest rate swaps:
2010 2,404$ Interest expense (4,131)$ Interest expense (25)$
2009 1,388$ Interest expense (4,037)$ Interest expense (40)$
2008 (2,650)$ Interest expense (1,964)$ Interest expense -$
*A portion of our second interest rate swap became over-hedged in 2009 since the outstanding debt balance
associated with this swap was $49 million (floating rate debt of the swap is $50 million).
The weighted average interest rates for our Credit Facility, including the impact of the previously
mentioned swap agreements, were 5.2%, 4.8% and 5.0% in fiscal 2010, 2009 and 2008, respectively.
Interest paid, including payments made or received under the swaps, was $5.4 million in 2010, $5.5
million in 2009 and $7.4 million in 2008. The $313,000 liability associated with the interest rate swaps
will be reclassified into earnings during the first quarter of 2011 (both swaps expired in January 2011).
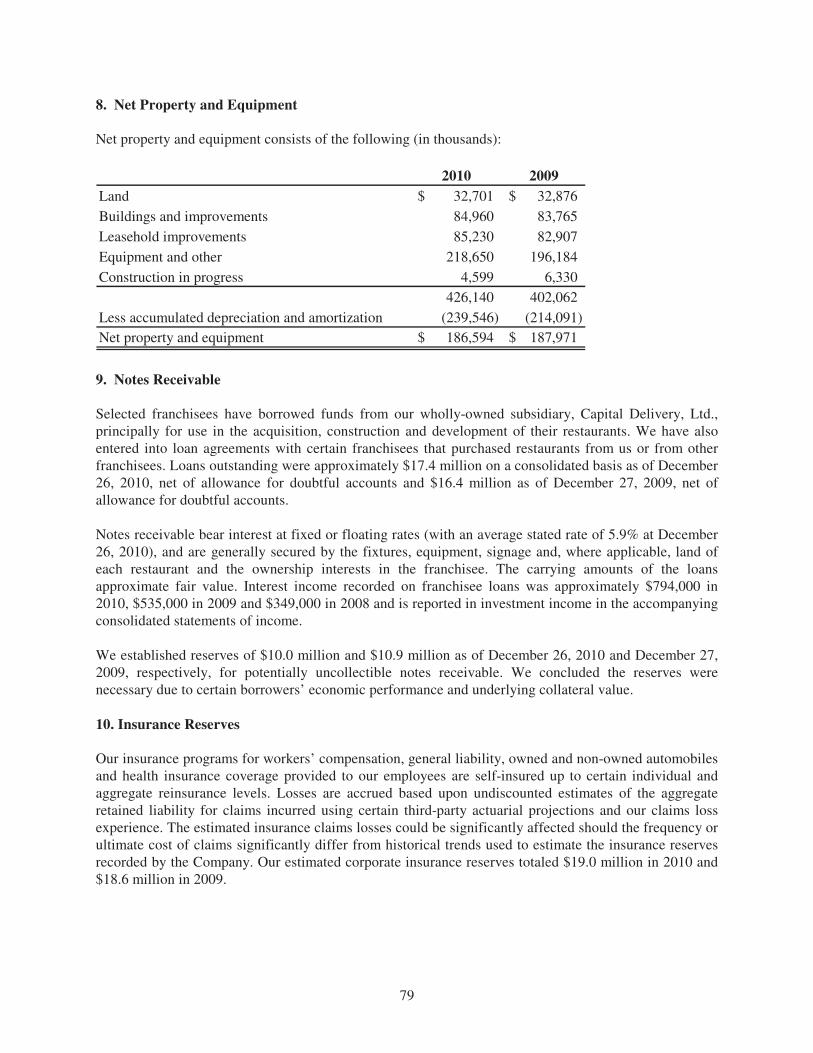
79
8. Net Property and Equipment
Net property and equipment consists of the following (in thousands):
2010 2009
Land 32,701$ 32,876$
Buildings and improvements 84,960 83,765
Leasehold improvements 85,230 82,907
Equipment and other 218,650 196,184
Construction in progress 4,599 6,330
426,140 402,062
Less accumulated depreciation and amortization (239,546) (214,091)
Net property and equipment 186,594$ 187,971$
9. Notes Receivable
Selected franchisees have borrowed funds from our wholly-owned subsidiary, Capital Delivery, Ltd.,
principally for use in the acquisition, construction and development of their restaurants. We have also
entered into loan agreements with certain franchisees that purchased restaurants from us or from other
franchisees. Loans outstanding were approximately $17.4 million on a consolidated basis as of December
26, 2010, net of allowance for doubtful accounts and $16.4 million as of December 27, 2009, net of
allowance for doubtful accounts.
Notes receivable bear interest at fixed or floating rates (with an average stated rate of 5.9% at December
26, 2010), and are generally secured by the fixtures, equipment, signage and, where applicable, land of
each restaurant and the ownership interests in the franchisee. The carrying amounts of the loans
approximate fair value. Interest income recorded on franchisee loans was approximately $794,000 in
2010, $535,000 in 2009 and $349,000 in 2008 and is reported in investment income in the accompanying
consolidated statements of income.
We established reserves of $10.0 million and $10.9 million as of December 26, 2010 and December 27,
2009, respectively, for potentially uncollectible notes receivable. We concluded the reserves were
necessary due to certain borrowers’ economic performance and underlying collateral value.
10. Insurance Reserves
Our insurance programs for workers’ compensation, general liability, owned and non-owned automobiles
and health insurance coverage provided to our employees are self-insured up to certain individual and
aggregate reinsurance levels. Losses are accrued based upon undiscounted estimates of the aggregate
retained liability for claims incurred using certain third-party actuarial projections and our claims loss
experience. The estimated insurance claims losses could be significantly affected should the frequency or
ultimate cost of claims significantly differ from historical trends used to estimate the insurance reserves
recorded by the Company. Our estimated corporate insurance reserves totaled $19.0 million in 2010 and
$18.6 million in 2009.
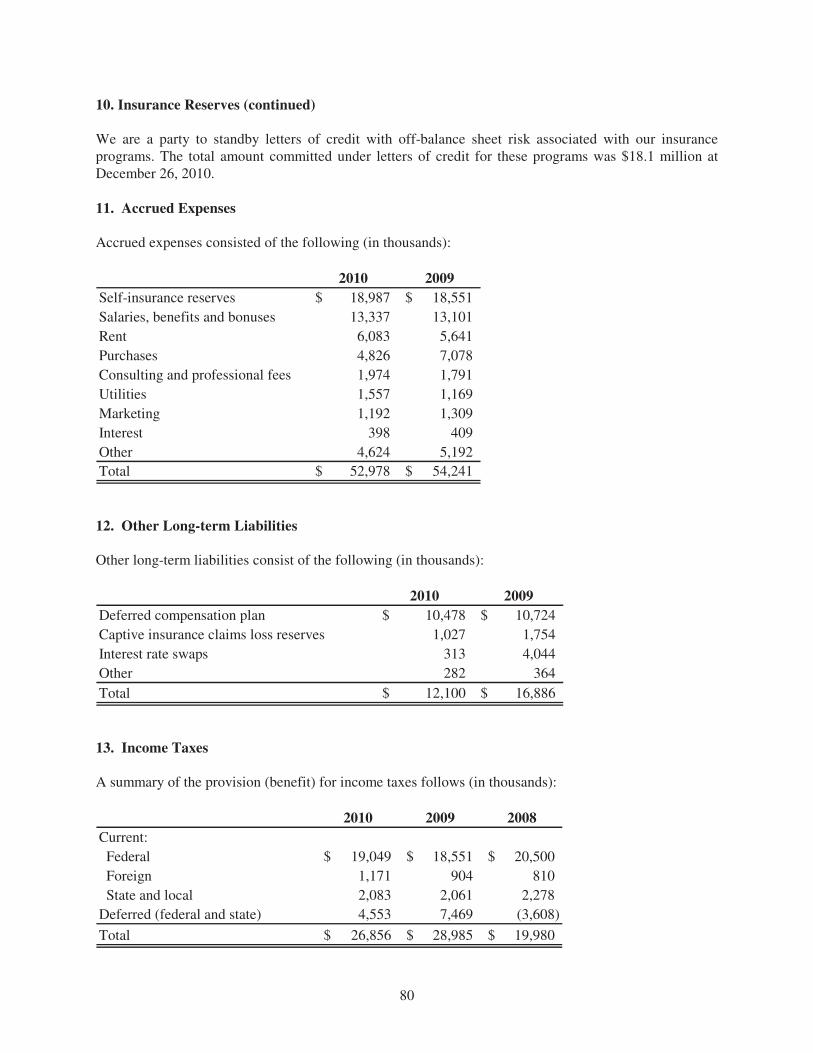
80
10. Insurance Reserves (continued)
We are a party to standby letters of credit with off-balance sheet risk associated with our insurance
programs. The total amount committed under letters of credit for these programs was $18.1 million at
December 26, 2010.
11. Accrued Expenses
Accrued expenses consisted of the following (in thousands):
2010 2009
Self-insurance reserves 18,987$ 18,551$
Salaries, benefits and bonuses 13,337 13,101
Rent 6,083 5,641
Purchases 4,826 7,078
Consulting and professional fees 1,974 1,791
Utilities 1,557 1,169
Marketing 1,192 1,309
Interest 398 409
Other 4,624 5,192
Total 52,978$ 54,241$
12. Other Long-term Liabilities
Other long-term liabilities consist of the following (in thousands):
2010 2009
Deferred compensation plan 10,478$ 10,724$
Captive insurance claims loss reserves 1,027 1,754
Interest rate swaps 313 4,044
Other 282 364
Total 12,100$ 16,886$
13. Income Taxes A summary of the provision (benefit) for income taxes follows (in thousands):
2010 2009 2008
Current:
Federal 19,049$ 18,551$ 20,500$
Foreign 1,171 904 810
State and local 2,083 2,061 2,278
Deferred (federal and state) 4,553 7,469 (3,608)
Total 26,856$ 28,985$ 19,980$
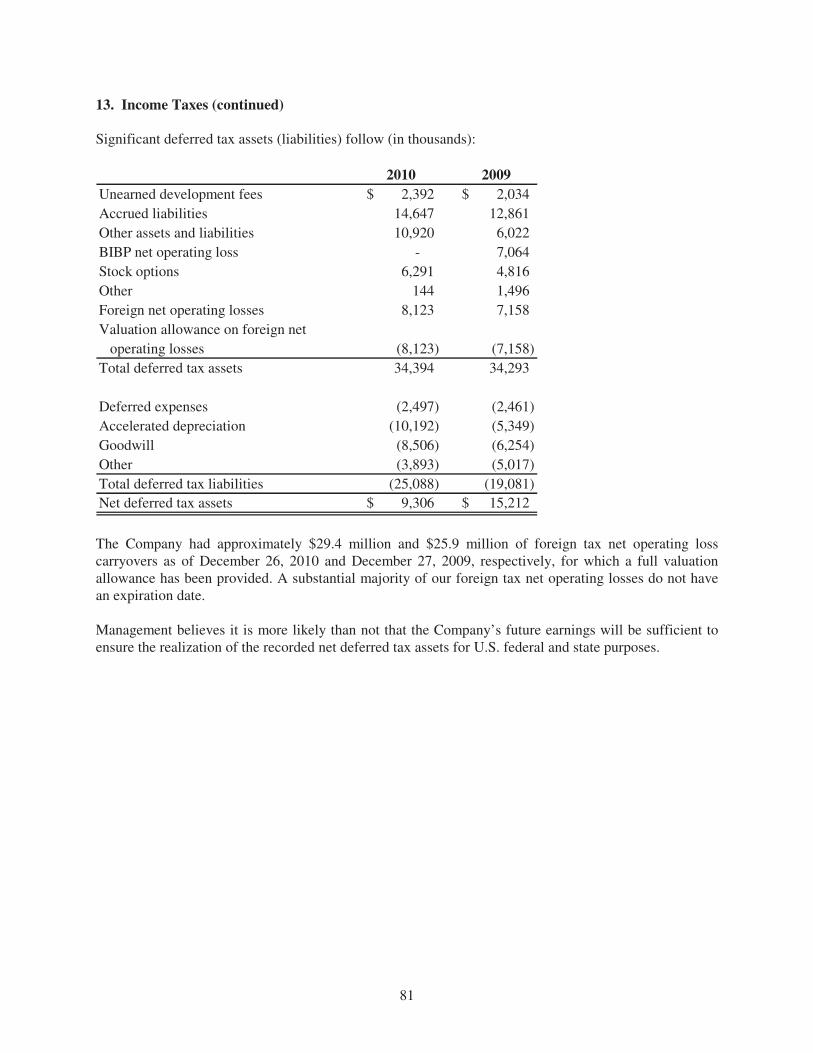
81
13. Income Taxes (continued)
Significant deferred tax assets (liabilities) follow (in thousands):
2010 2009
Unearned development fees 2,392$ 2,034$
Accrued liabilities 14,647 12,861
Other assets and liabilities 10,920 6,022
BIBP net operating loss - 7,064
Stock options 6,291 4,816
Other 144 1,496
Foreign net operating losses 8,123 7,158
Valuation allowance on foreign net
operating losses (8,123) (7,158)
Total deferred tax assets 34,394 34,293
Deferred expenses (2,497) (2,461)
Accelerated depreciation (10,192) (5,349)
Goodwill (8,506) (6,254)
Other (3,893) (5,017)
Total deferred tax liabilities (25,088) (19,081)
Net deferred tax assets 9,306$ 15,212$
The Company had approximately $29.4 million and $25.9 million of foreign tax net operating loss carryovers as of December 26, 2010 and December 27, 2009, respectively, for which a full valuation allowance has been provided. A substantial majority of our foreign tax net operating losses do not have an expiration date. Management believes it is more likely than not that the Company’s future earnings will be sufficient to ensure the realization of the recorded net deferred tax assets for U.S. federal and state purposes.
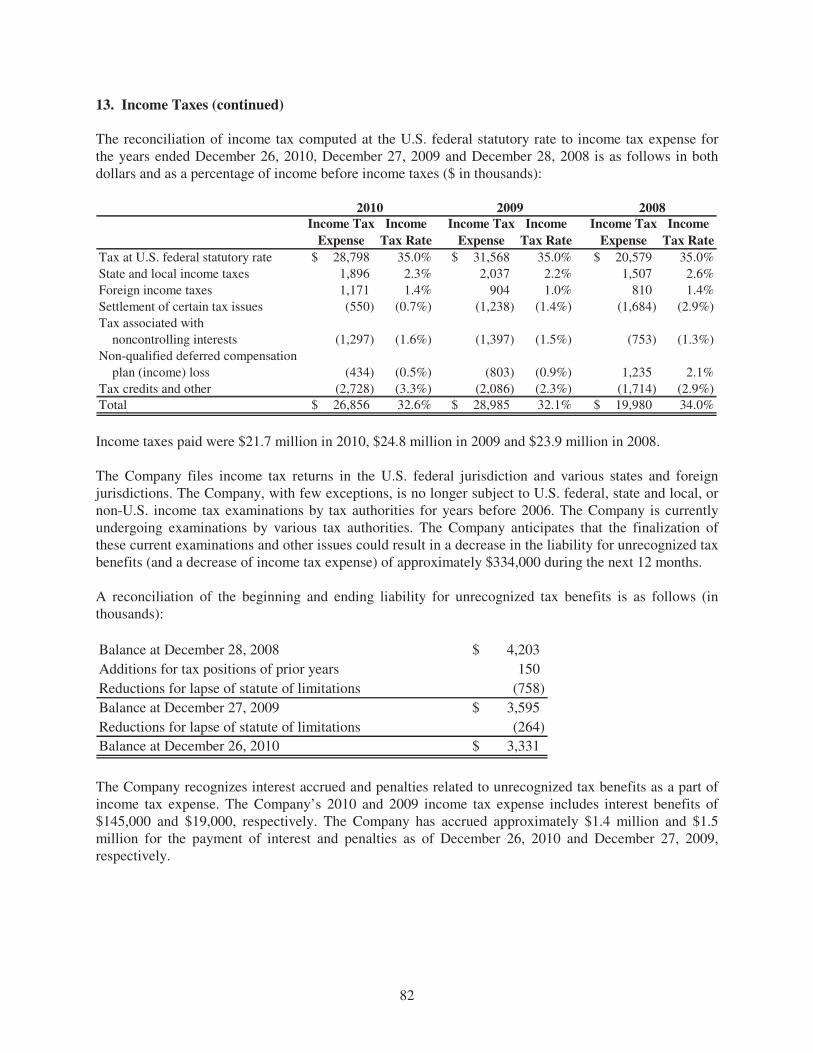
82
13. Income Taxes (continued)
The reconciliation of income tax computed at the U.S. federal statutory rate to income tax expense for the years ended December 26, 2010, December 27, 2009 and December 28, 2008 is as follows in both dollars and as a percentage of income before income taxes ($ in thousands):
Income Tax
Expense
Income
Tax Rate
Income Tax
Expense
Income
Tax Rate
Income Tax
Expense
Income
Tax Rate
Tax at U.S. federal statutory rate 28,798$ 35.0% 31,568$ 35.0% 20,579$ 35.0%
State and local income taxes 1,896 2.3% 2,037 2.2% 1,507 2.6%
Foreign income taxes 1,171 1.4% 904 1.0% 810 1.4%
Settlement of certain tax issues (550) (0.7%) (1,238) (1.4%) (1,684) (2.9%)
Tax associated with
noncontrolling interests (1,297) (1.6%) (1,397) (1.5%) (753) (1.3%)
Non-qualified deferred compensation
plan (income) loss (434) (0.5%) (803) (0.9%) 1,235 2.1%
Tax credits and other (2,728) (3.3%) (2,086) (2.3%) (1,714) (2.9%)
Total 26,856$ 32.6% 28,985$ 32.1% 19,980$ 34.0%
2010 2009 2008
Income taxes paid were $21.7 million in 2010, $24.8 million in 2009 and $23.9 million in 2008.
The Company files income tax returns in the U.S. federal jurisdiction and various states and foreign jurisdictions. The Company, with few exceptions, is no longer subject to U.S. federal, state and local, or non-U.S. income tax examinations by tax authorities for years before 2006. The Company is currently undergoing examinations by various tax authorities. The Company anticipates that the finalization of these current examinations and other issues could result in a decrease in the liability for unrecognized tax benefits (and a decrease of income tax expense) of approximately $334,000 during the next 12 months. A reconciliation of the beginning and ending liability for unrecognized tax benefits is as follows (in thousands):
Balance at December 28, 2008 4,203$
Additions for tax positions of prior years 150
Reductions for lapse of statute of limitations (758)
Balance at December 27, 2009 3,595$
Reductions for lapse of statute of limitations (264)
Balance at December 26, 2010 3,331$
The Company recognizes interest accrued and penalties related to unrecognized tax benefits as a part of income tax expense. The Company’s 2010 and 2009 income tax expense includes interest benefits of $145,000 and $19,000, respectively. The Company has accrued approximately $1.4 million and $1.5 million for the payment of interest and penalties as of December 26, 2010 and December 27, 2009, respectively.
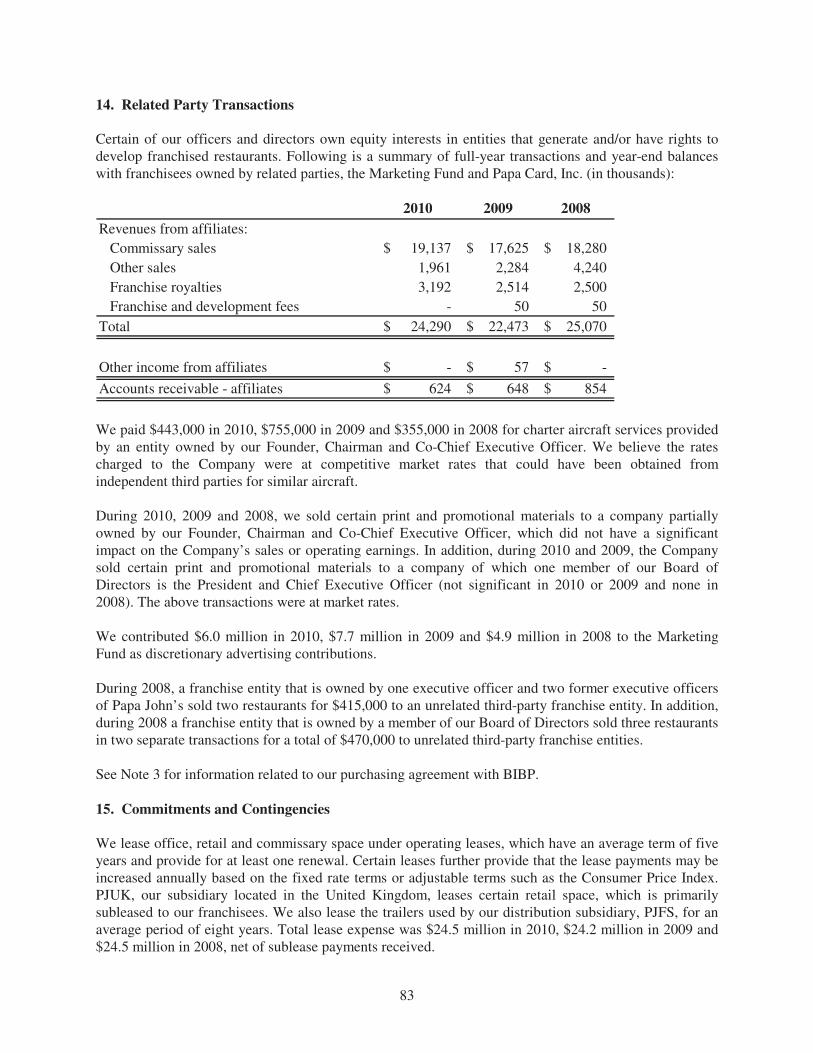
83
14. Related Party Transactions Certain of our officers and directors own equity interests in entities that generate and/or have rights to develop franchised restaurants. Following is a summary of full-year transactions and year-end balances with franchisees owned by related parties, the Marketing Fund and Papa Card, Inc. (in thousands):
2010 2009 2008
Revenues from affiliates:
Commissary sales 19,137$ 17,625$ 18,280$
Other sales 1,961 2,284 4,240
Franchise royalties 3,192 2,514 2,500
Franchise and development fees - 50 50
Total 24,290$ 22,473$ 25,070$
Other income from affiliates -$ 57$ -$
Accounts receivable - affiliates 624$ 648$ 854$
We paid $443,000 in 2010, $755,000 in 2009 and $355,000 in 2008 for charter aircraft services provided by an entity owned by our Founder, Chairman and Co-Chief Executive Officer. We believe the rates charged to the Company were at competitive market rates that could have been obtained from independent third parties for similar aircraft. During 2010, 2009 and 2008, we sold certain print and promotional materials to a company partially owned by our Founder, Chairman and Co-Chief Executive Officer, which did not have a significant impact on the Company’s sales or operating earnings. In addition, during 2010 and 2009, the Company sold certain print and promotional materials to a company of which one member of our Board of Directors is the President and Chief Executive Officer (not significant in 2010 or 2009 and none in 2008). The above transactions were at market rates. We contributed $6.0 million in 2010, $7.7 million in 2009 and $4.9 million in 2008 to the Marketing Fund as discretionary advertising contributions. During 2008, a franchise entity that is owned by one executive officer and two former executive officers of Papa John’s sold two restaurants for $415,000 to an unrelated third-party franchise entity. In addition, during 2008 a franchise entity that is owned by a member of our Board of Directors sold three restaurants in two separate transactions for a total of $470,000 to unrelated third-party franchise entities.
See Note 3 for information related to our purchasing agreement with BIBP.
15. Commitments and Contingencies We lease office, retail and commissary space under operating leases, which have an average term of five years and provide for at least one renewal. Certain leases further provide that the lease payments may be increased annually based on the fixed rate terms or adjustable terms such as the Consumer Price Index. PJUK, our subsidiary located in the United Kingdom, leases certain retail space, which is primarily subleased to our franchisees. We also lease the trailers used by our distribution subsidiary, PJFS, for an average period of eight years. Total lease expense was $24.5 million in 2010, $24.2 million in 2009 and $24.5 million in 2008, net of sublease payments received.
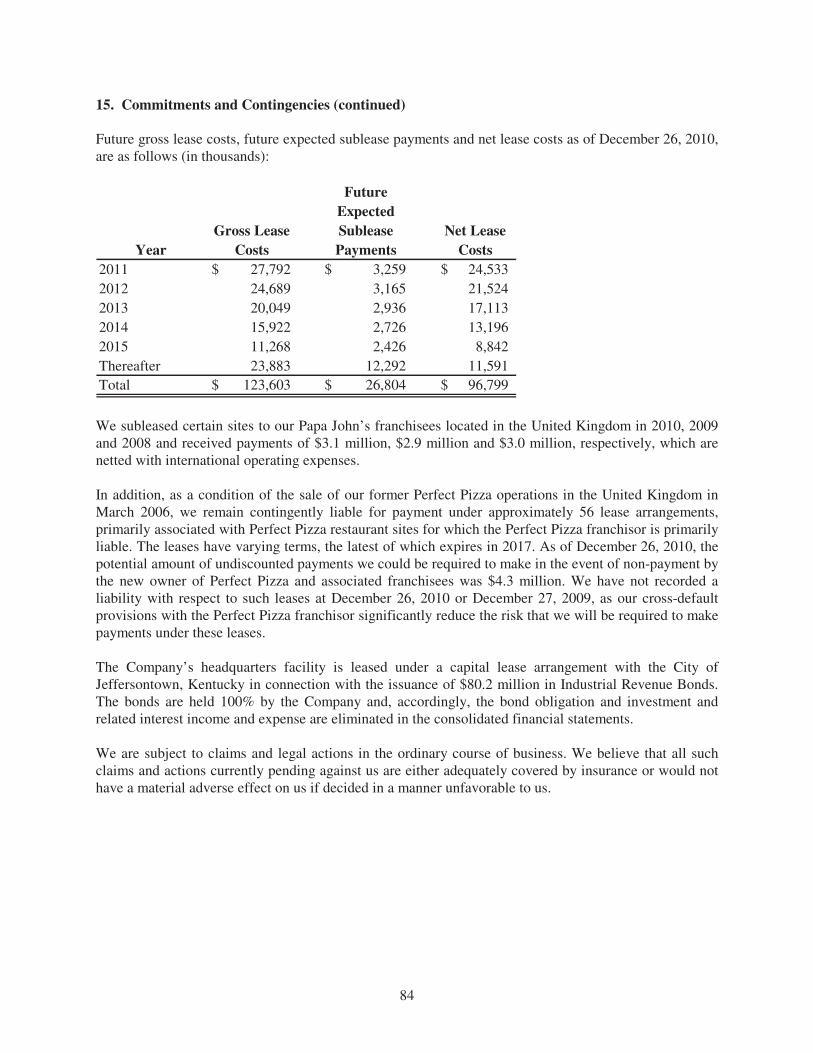
84
15. Commitments and Contingencies (continued) Future gross lease costs, future expected sublease payments and net lease costs as of December 26, 2010, are as follows (in thousands):
Future
Expected
Gross Lease Sublease Net Lease
Year Costs Payments Costs
2011 27,792$ 3,259$ 24,533$
2012 24,689 3,165 21,524
2013 20,049 2,936 17,113
2014 15,922 2,726 13,196
2015 11,268 2,426 8,842
Thereafter 23,883 12,292 11,591
Total 123,603$ 26,804$ 96,799$
We subleased certain sites to our Papa John’s franchisees located in the United Kingdom in 2010, 2009 and 2008 and received payments of $3.1 million, $2.9 million and $3.0 million, respectively, which are netted with international operating expenses. In addition, as a condition of the sale of our former Perfect Pizza operations in the United Kingdom in March 2006, we remain contingently liable for payment under approximately 56 lease arrangements, primarily associated with Perfect Pizza restaurant sites for which the Perfect Pizza franchisor is primarily liable. The leases have varying terms, the latest of which expires in 2017. As of December 26, 2010, the potential amount of undiscounted payments we could be required to make in the event of non-payment by the new owner of Perfect Pizza and associated franchisees was $4.3 million. We have not recorded a liability with respect to such leases at December 26, 2010 or December 27, 2009, as our cross-default provisions with the Perfect Pizza franchisor significantly reduce the risk that we will be required to make payments under these leases. The Company’s headquarters facility is leased under a capital lease arrangement with the City of Jeffersontown, Kentucky in connection with the issuance of $80.2 million in Industrial Revenue Bonds. The bonds are held 100% by the Company and, accordingly, the bond obligation and investment and related interest income and expense are eliminated in the consolidated financial statements. We are subject to claims and legal actions in the ordinary course of business. We believe that all such claims and actions currently pending against us are either adequately covered by insurance or would not have a material adverse effect on us if decided in a manner unfavorable to us.

85
16. Share Repurchase Program
The Company’s Board of Directors authorized the repurchase of up to $825.0 million of common stock through December 31, 2011, of which $36.9 million remained available for repurchase at December 26, 2010. Funding for the share repurchase program has been provided through a credit facility, operating cash flow, stock option exercises and cash and cash equivalents. Subsequent to year-end (through February 15, 2011), we acquired an additional 66,000 shares at an aggregate cost of $1.8 million. As of February 15, 2011, approximately $35.0 million remained available for repurchase of common stock under this authorization.
17. Equity Compensation
We award stock options and restricted stock from time to time under the Papa John’s International, Inc. 2008 Omnibus Incentive Plan (the “Omnibus Plan”) and other such agreements as may arise. Shares of common stock authorized for issuance under the Omnibus Plan are approximately 3.7 million. Approximately 2.4 million shares were available for future issuance under the Omnibus Plan as of December 26, 2010. Option awards are granted with an exercise price equal to the market price of the Company’s stock at the date of grant. Options granted prior to 2003 generally expire ten years from the date of grant and vest over one to five-year periods. Options granted after 2005 generally expire five years from the date of grant and vest over a 24- or 36-month period. We recorded stock-based employee compensation expense of $6.1 million in 2010, $5.8 million in 2009 and $2.6 million in 2008. The total income tax benefit recognized in the income statement for share-based compensation arrangements was $2.2 million in 2010, $2.1 million in 2009 and $930,000 in 2008. At December 26, 2010, there was $5.8 million of unrecognized compensation cost related to nonvested option awards and restricted stock, of which the Company expects to recognize $3.9 million in 2011, $1.6 million in 2012 and $300,000 in 2013. Stock Options
Options exercised included 356,000 shares in 2010, 612,000 shares in 2009 and 260,000 shares in 2008. The total intrinsic value of the options exercised during 2010, 2009 and 2008 was $2.6 million, $4.3 million and $2.8 million, respectively. Cash received upon the exercise of stock options was $6.4 million, $9.8 million and $4.6 million during 2010, 2009 and 2008, respectively, and the related tax benefits realized were approximately $943,000, $1.5 million and $1.0 million during the corresponding periods.
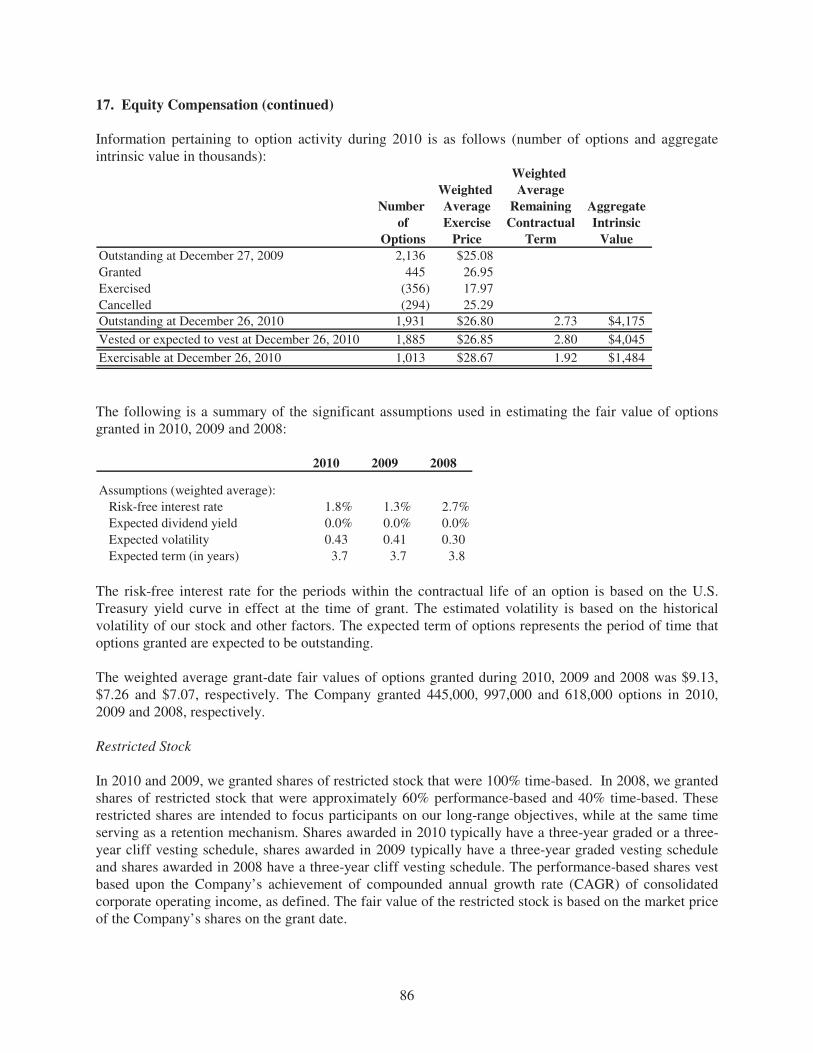
86
17. Equity Compensation (continued)
Information pertaining to option activity during 2010 is as follows (number of options and aggregate intrinsic value in thousands):
Weighted
Weighted Average
Number Average Remaining Aggregate
of Exercise Contractual Intrinsic
Options Price Term Value
Outstanding at December 27, 2009 2,136 $25.08
Granted 445 26.95
Exercised (356) 17.97
Cancelled (294) 25.29
Outstanding at December 26, 2010 1,931 $26.80 2.73 $4,175
Vested or expected to vest at December 26, 2010 1,885 $26.85 2.80 $4,045
Exercisable at December 26, 2010 1,013 $28.67 1.92 $1,484
The following is a summary of the significant assumptions used in estimating the fair value of options granted in 2010, 2009 and 2008:
2010 2009 2008
Assumptions (weighted average):
Risk-free interest rate 1.8% 1.3% 2.7%
Expected dividend yield 0.0% 0.0% 0.0%
Expected volatility 0.43 0.41 0.30
Expected term (in years) 3.7 3.7 3.8 The risk-free interest rate for the periods within the contractual life of an option is based on the U.S. Treasury yield curve in effect at the time of grant. The estimated volatility is based on the historical volatility of our stock and other factors. The expected term of options represents the period of time that options granted are expected to be outstanding. The weighted average grant-date fair values of options granted during 2010, 2009 and 2008 was $9.13, $7.26 and $7.07, respectively. The Company granted 445,000, 997,000 and 618,000 options in 2010, 2009 and 2008, respectively. Restricted Stock
In 2010 and 2009, we granted shares of restricted stock that were 100% time-based. In 2008, we granted shares of restricted stock that were approximately 60% performance-based and 40% time-based. These restricted shares are intended to focus participants on our long-range objectives, while at the same time serving as a retention mechanism. Shares awarded in 2010 typically have a three-year graded or a three-year cliff vesting schedule, shares awarded in 2009 typically have a three-year graded vesting schedule and shares awarded in 2008 have a three-year cliff vesting schedule. The performance-based shares vest based upon the Company’s achievement of compounded annual growth rate (CAGR) of consolidated corporate operating income, as defined. The fair value of the restricted stock is based on the market price of the Company’s shares on the grant date.
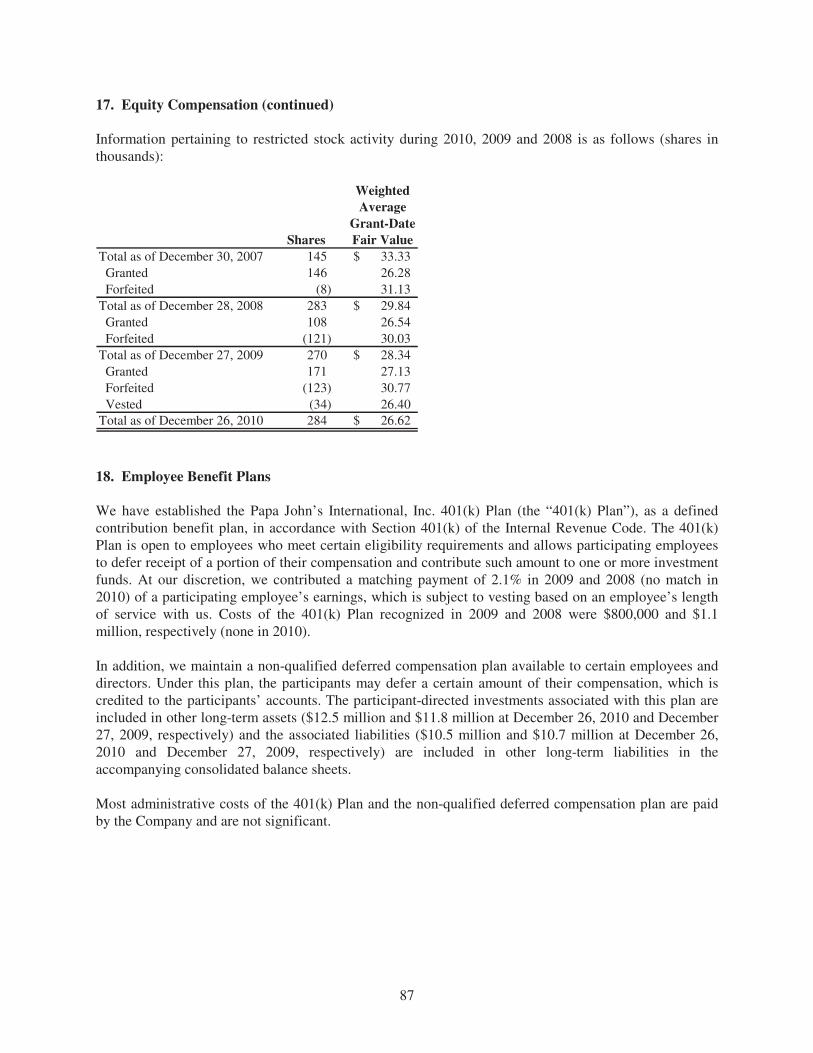
87
17. Equity Compensation (continued)
Information pertaining to restricted stock activity during 2010, 2009 and 2008 is as follows (shares in thousands):
Weighted
Average
Grant-Date
Shares Fair Value
Total as of December 30, 2007 145 33.33$
Granted 146 26.28
Forfeited (8) 31.13
Total as of December 28, 2008 283 29.84$
Granted 108 26.54
Forfeited (121) 30.03
Total as of December 27, 2009 270 28.34$
Granted 171 27.13
Forfeited (123) 30.77
Vested (34) 26.40
Total as of December 26, 2010 284 26.62$
18. Employee Benefit Plans
We have established the Papa John’s International, Inc. 401(k) Plan (the “401(k) Plan”), as a defined contribution benefit plan, in accordance with Section 401(k) of the Internal Revenue Code. The 401(k) Plan is open to employees who meet certain eligibility requirements and allows participating employees to defer receipt of a portion of their compensation and contribute such amount to one or more investment funds. At our discretion, we contributed a matching payment of 2.1% in 2009 and 2008 (no match in 2010) of a participating employee’s earnings, which is subject to vesting based on an employee’s length of service with us. Costs of the 401(k) Plan recognized in 2009 and 2008 were $800,000 and $1.1 million, respectively (none in 2010). In addition, we maintain a non-qualified deferred compensation plan available to certain employees and directors. Under this plan, the participants may defer a certain amount of their compensation, which is credited to the participants’ accounts. The participant-directed investments associated with this plan are included in other long-term assets ($12.5 million and $11.8 million at December 26, 2010 and December 27, 2009, respectively) and the associated liabilities ($10.5 million and $10.7 million at December 26, 2010 and December 27, 2009, respectively) are included in other long-term liabilities in the accompanying consolidated balance sheets. Most administrative costs of the 401(k) Plan and the non-qualified deferred compensation plan are paid by the Company and are not significant.
88
18. Employee Benefit Plans (continued) PJUK, the Company’s United Kingdom subsidiary, provided a pension plan that was frozen in 1999. There are approximately 21 participants in the PJUK pension plan. The Company recorded expense of $258,000, $260,000 and $312,000 associated with the pension plan for the fiscal years ended 2010, 2009 and 2008, respectively. The future annual contributions and expense to the PJUK pension plan are expected to approximate $260,000.
19. Segment Information
We have defined six reportable segments: domestic restaurants, domestic commissaries, domestic franchising, international operations, variable interest entities (VIEs) and “all other” units. The domestic restaurant segment consists of the operations of all domestic (“domestic” is defined as contiguous United States) Company-owned restaurants and derives its revenues principally from retail sales of pizza and side items, such as breadsticks, cheesesticks, chicken strips, chicken wings, dessert pizza and soft drinks to the general public. The domestic commissary segment consists of the operations of our regional dough production and product distribution centers and derives its revenues principally from the sale and distribution of food and paper products to domestic Company-owned and franchised restaurants. The domestic franchising segment consists of our franchise sales and support activities and derives its revenues from sales of franchise and development rights and collection of royalties from our domestic franchisees. The international operations segment principally consists of our Company-owned restaurants and distribution sales to franchised Papa John’s restaurants located in the United Kingdom, Mexico and China and our franchise sales and support activities, which derive revenues from sales of franchise and development rights and the collection of royalties from our international franchisees. VIEs consist of entities in which we are the primary beneficiary, as defined in Note 3, and include BIBP. All other business units that do not meet the quantitative thresholds for determining reportable segments consist of operations that derive revenues from the sale, principally to Company-owned and franchised restaurants, of printing and promotional items, risk management services, and information systems and related services used in restaurant operations and certain partnership development activities. Generally, we evaluate performance and allocate resources based on profit or loss from operations before income taxes and eliminations. Certain administrative and capital costs are allocated to segments based upon predetermined rates or actual estimated resource usage. We account for intercompany sales and transfers as if the sales or transfers were to third parties and eliminate the related profit in consolidation.
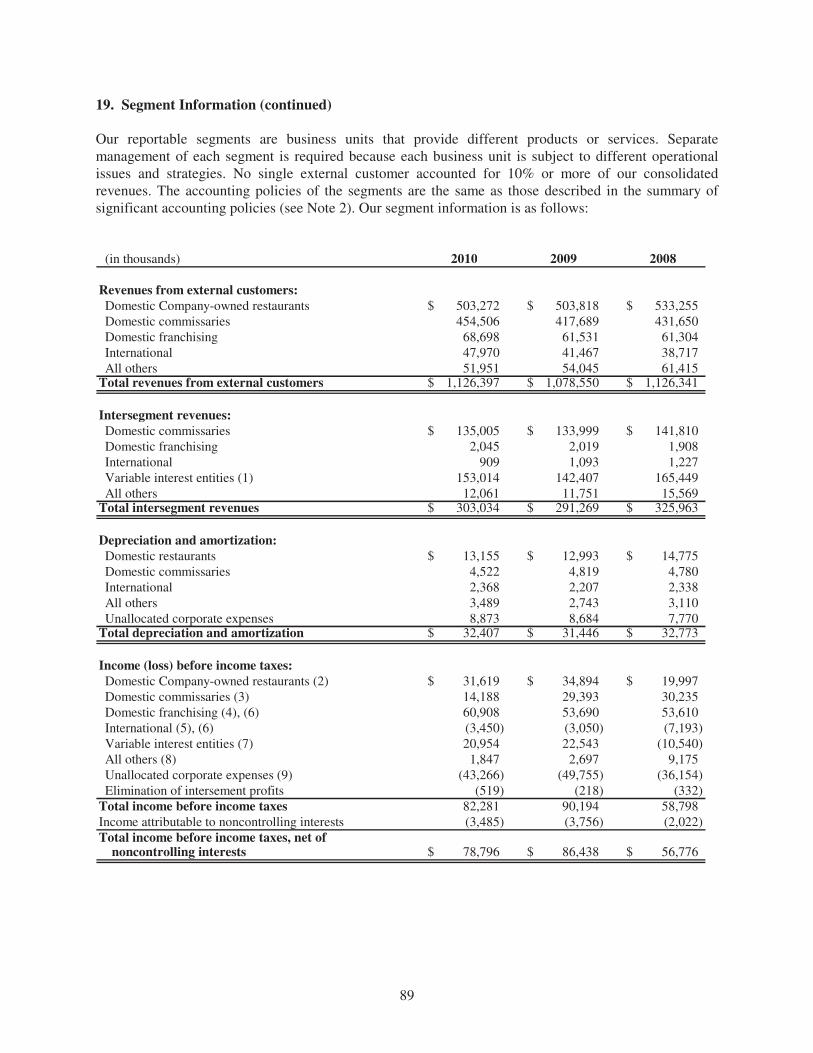
89
19. Segment Information (continued) Our reportable segments are business units that provide different products or services. Separate management of each segment is required because each business unit is subject to different operational issues and strategies. No single external customer accounted for 10% or more of our consolidated revenues. The accounting policies of the segments are the same as those described in the summary of significant accounting policies (see Note 2). Our segment information is as follows:
(in thousands) 2010 2009 2008
Revenues from external customers:
Domestic Company-owned restaurants 503,272$ 503,818$ 533,255$ Domestic commissaries 454,506 417,689 431,650 Domestic franchising 68,698 61,531 61,304 International 47,970 41,467 38,717 All others 51,951 54,045 61,415
Total revenues from external customers 1,126,397$ 1,078,550$ 1,126,341$
Intersegment revenues:
Domestic commissaries 135,005$ 133,999$ 141,810$ Domestic franchising 2,045 2,019 1,908 International 909 1,093 1,227 Variable interest entities (1) 153,014 142,407 165,449 All others 12,061 11,751 15,569
Total intersegment revenues 303,034$ 291,269$ 325,963$
Depreciation and amortization:
Domestic restaurants 13,155$ 12,993$ 14,775$ Domestic commissaries 4,522 4,819 4,780 International 2,368 2,207 2,338 All others 3,489 2,743 3,110 Unallocated corporate expenses 8,873 8,684 7,770
Total depreciation and amortization 32,407$ 31,446$ 32,773$
Income (loss) before income taxes:
Domestic Company-owned restaurants (2) 31,619$ 34,894$ 19,997$ Domestic commissaries (3) 14,188 29,393 30,235 Domestic franchising (4), (6) 60,908 53,690 53,610 International (5), (6) (3,450) (3,050) (7,193) Variable interest entities (7) 20,954 22,543 (10,540) All others (8) 1,847 2,697 9,175 Unallocated corporate expenses (9) (43,266) (49,755) (36,154) Elimination of intersement profits (519) (218) (332)
Total income before income taxes 82,281 90,194 58,798 Income attributable to noncontrolling interests (3,485) (3,756) (2,022) Total income before income taxes, net of noncontrolling interests 78,796$ 86,438$ 56,776$

90
19. Segment Information (continued)
(in thousands) 2010 2009 2008
Property and equipment:
Domestic Company-owned restaurants 165,434$ 158,884$ 156,171$ Domestic commissaries 82,162 80,180 78,808 International 17,574 16,587 10,706 All others 33,786 25,526 22,167 Unallocated corporate assets 127,184 120,885 114,913 Accumulated depreciation and amortization (239,546) (214,091) (197,087)
Net property and equipment 186,594$ 187,971$ 185,678$
Expenditures for property and equipment:
Domestic restaurants 9,124$ 8,300$ 14,669$ Domestic commissaries 2,795 6,029 2,284 International 4,835 7,277 3,490 All others 8,151 313 701 Unallocated corporate 6,220 11,619 8,127
Total expenditures for property and equipment 31,125$ 33,538$ 29,271$
(1) The intersegment revenues for variable interest entities of $153.0 million in 2010, $142.4 million in
2009 and $165.4 million in 2008 are attributable to BIBP. (2) The operating results for domestic Company-owned restaurants decreased approximately $3.3
million in 2010, as compared to 2009. The 2010 decrease was primarily due to a decline in operating margin from lower average ticket prices, partially offset by increased customer traffic and reductions in labor costs. In addition, 2009 included restaurant closure costs of approximately $700,000. There were no significant closure costs in 2010. The increase in the operating results in 2009, as compared to 2008, was principally due to lower commodities and utilities costs and the sale of 62 restaurants in late 2008 that were collectively unprofitable. Additionally, the 2008 results included a $6.5 million charge associated with the divestiture and impairment of certain restaurants.
(3) Domestic commissaries’ operating income decreased approximately $15.2 million in 2010 and $800,000 in 2009 compared to the prior comparable periods. The decrease in 2010 was primarily due to an increase in cost of sales of $14.2 million associated with PJFS’s agreement to pay to BIBP for past cheese purchases an amount equal to its accumulated deficit at December 26, 2010. The remaining decrease was primarily due to increased fuel costs, partially offset by an increase in sales volumes, although at a lower gross margin percentage. The 2010 gross margin percentage included the impact of commodities cost increases we absorbed for certain vegetable products resulting from harsh Florida winter weather and various rebate programs available to restaurants for achieving certain sales improvement targets. In 2009 we recorded approximately $800,000 of management transition costs and $400,000 of costs associated with the closure of one of our commissaries. The $800,000 decrease from 2008 to 2009 was primarily due to $800,000 of management transition costs and $400,000 of costs associated with the closing of one of our commissaries. The decline in our operating margin from our reductions in pricing was offset by a decline in fuel costs for 2009.

91
19. Segment Information (continued)
(4) Domestic franchising operating income increased approximately $7.2 million in 2010 over the prior
comparable period. The increase was primarily due to an increase in the standard franchise royalty rate. The impact of the royalty rate increase was partially offset by the impact of development incentive programs offered by the Company in 2009 and 2010. Domestic franchising operating income increased approximately $100,000 in 2009 as compared to 2008 primarily as a result of the 0.25% increase in our royalty rate in the last 4 months of 2009. The increase in royalties was partially offset by lower franchise and development fees due to fewer unit openings and additional development incentive programs offered by the Company in 2009. In addition, during 2008 we collected approximately $500,000 in franchise renewal fees associated with the domestic franchise renewal program.
(5) The international segment reported operating losses of $3.5 million in 2010, $3.1 million in 2009 and $7.2 million in 2008. The decline in the operating results in 2010, as compared to 2009, was primarily due to increased personnel and franchise support costs. Additionally, the 2010 results included start-up costs associated with our Company-owned commissary in the United Kingdom, which opened in the second quarter of 2010. The increase in costs was partially offset by increased revenues due to growth in the number of international units. The improvement in operating results in 2009, as compared to 2008, reflects leverage on the international organizational structure from increased revenues due to the growth in the number of units and unit volumes. The 2008 results included a goodwill impairment charge of $2.3 million associated with our United Kingdom operations.
(6) Beginning in 2011, we are realigning our Hawaii, Alaska and Canadian operations from International to Domestic franchising (renamed as “North America Franchising”). This alignment will result in an increase in pre-tax income for Domestic franchising of $1.3 million for both 2010 and 2009, and a corresponding decrease in pre-tax income for the International operating segment.
(7) Represents BIBP’s operating income (loss), net of noncontrolling interest income, for each year. The 2010 operating income for BIBP includes a reduction in BIBP’s cost of sales of $14.2 million
associated with PJFS’s agreement to pay to BIBP for past cheese purchases an amount equal to its accumulated deficit.
(8) The “All Others” operating segment reported a decrease in operating results of $850,000 in 2010 as compared to 2009. The decrease was primarily due to an increase in infrastructure and support costs associated with our online ordering business unit. This decline was partially offset by an improvement in operating results at our wholly-owned print and promotions subsidiary, Preferred Marketing Solutions, Inc. The 2009 operating results were $6.5 million lower than the 2008 results primarily due to a $3.9 million decline in our online ordering system business based on an agreement with our franchisees and a $1.3 million decrease in the operating results of our print and promotions subsidiary due to lower commercial sales.
(9) Unallocated corporate expenses decreased approximately $6.5 million in 2010 as compared to 2009 and increased approximately $13.6 million in 2009 as compared to 2008. The decrease in 2010 was primarily due to lower salaries and benefits, lower franchise incentive costs and 2009 included $800,000 in litigation settlement costs. These reductions were partially offset by an increase in short-term incentive compensation expense in 2010 and 2009. The 2009 increase, as compared to 2008, was primarily due to a $5.7 million increase in franchise support initiatives and an increase in general and administrative costs of $10.5 million, partially offset by a $2.9 million decrease in provisions for uncollectible accounts and notes receivable.
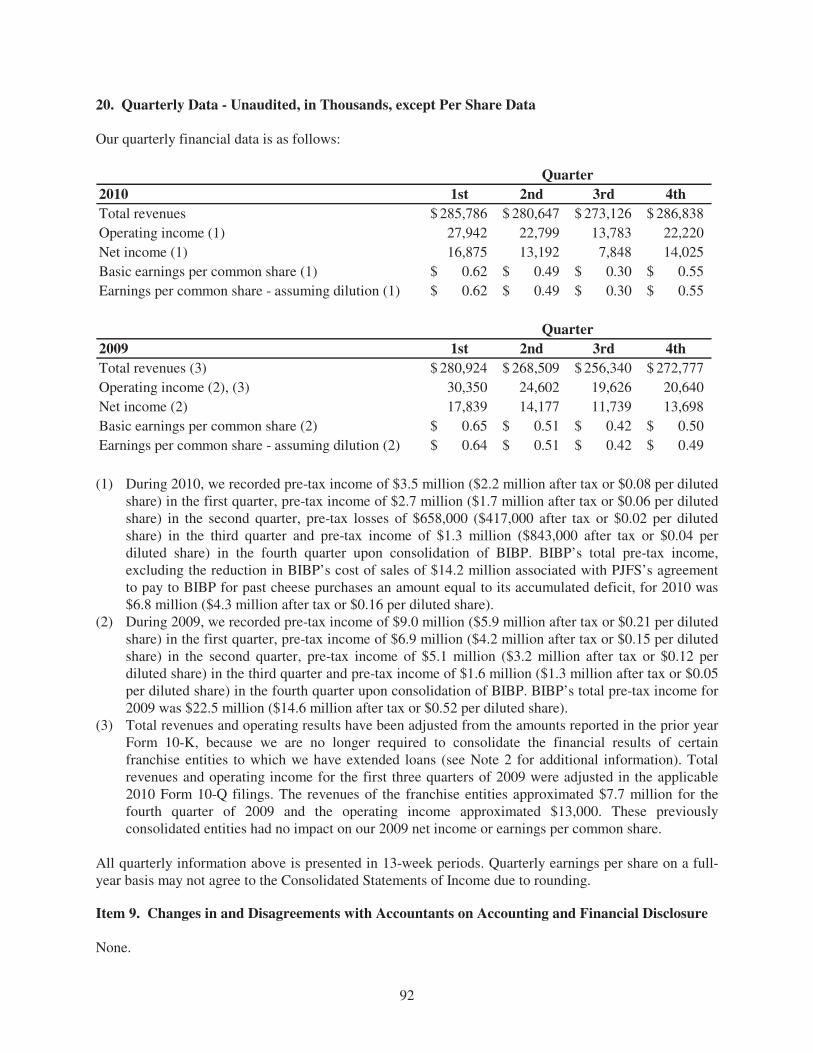
92
20. Quarterly Data - Unaudited, in Thousands, except Per Share Data
Our quarterly financial data is as follows:
2010 1st 2nd 3rd 4th
Total revenues 285,786$ 280,647$ 273,126$ 286,838$
Operating income (1) 27,942 22,799 13,783 22,220
Net income (1) 16,875 13,192 7,848 14,025
Basic earnings per common share (1) 0.62$ 0.49$ 0.30$ 0.55$
Earnings per common share - assuming dilution (1) 0.62$ 0.49$ 0.30$ 0.55$
2009 1st 2nd 3rd 4th
Total revenues (3) 280,924$ 268,509$ 256,340$ 272,777$
Operating income (2), (3) 30,350 24,602 19,626 20,640
Net income (2) 17,839 14,177 11,739 13,698
Basic earnings per common share (2) 0.65$ 0.51$ 0.42$ 0.50$
Earnings per common share - assuming dilution (2) 0.64$ 0.51$ 0.42$ 0.49$
Quarter
Quarter
(1) During 2010, we recorded pre-tax income of $3.5 million ($2.2 million after tax or $0.08 per diluted
share) in the first quarter, pre-tax income of $2.7 million ($1.7 million after tax or $0.06 per diluted share) in the second quarter, pre-tax losses of $658,000 ($417,000 after tax or $0.02 per diluted share) in the third quarter and pre-tax income of $1.3 million ($843,000 after tax or $0.04 per diluted share) in the fourth quarter upon consolidation of BIBP. BIBP’s total pre-tax income, excluding the reduction in BIBP’s cost of sales of $14.2 million associated with PJFS’s agreement to pay to BIBP for past cheese purchases an amount equal to its accumulated deficit, for 2010 was $6.8 million ($4.3 million after tax or $0.16 per diluted share).
(2) During 2009, we recorded pre-tax income of $9.0 million ($5.9 million after tax or $0.21 per diluted share) in the first quarter, pre-tax income of $6.9 million ($4.2 million after tax or $0.15 per diluted share) in the second quarter, pre-tax income of $5.1 million ($3.2 million after tax or $0.12 per diluted share) in the third quarter and pre-tax income of $1.6 million ($1.3 million after tax or $0.05 per diluted share) in the fourth quarter upon consolidation of BIBP. BIBP’s total pre-tax income for 2009 was $22.5 million ($14.6 million after tax or $0.52 per diluted share).
(3) Total revenues and operating results have been adjusted from the amounts reported in the prior year Form 10-K, because we are no longer required to consolidate the financial results of certain franchise entities to which we have extended loans (see Note 2 for additional information). Total revenues and operating income for the first three quarters of 2009 were adjusted in the applicable 2010 Form 10-Q filings. The revenues of the franchise entities approximated $7.7 million for the fourth quarter of 2009 and the operating income approximated $13,000. These previously consolidated entities had no impact on our 2009 net income or earnings per common share.
All quarterly information above is presented in 13-week periods. Quarterly earnings per share on a full-year basis may not agree to the Consolidated Statements of Income due to rounding.
Item 9. Changes in and Disagreements with Accountants on Accounting and Financial Disclosure
None.
93
Item 9A. Controls and Procedures
Evaluation of Disclosure Controls and Procedures As of the end of the period covered by this report, we carried out an evaluation, under the supervision and with the participation of our management, including our Co-CEOs and CFO, of the effectiveness of our disclosure controls and procedures (as defined in Rules 13a-15(e) and 15d-15(e) of the Securities Exchange Act of 1934, as amended). Based upon this evaluation, the Co-CEOs and CFO concluded that the disclosure controls and procedures are effective. Changes in Internal Control Over Financial Reporting There were no changes in our internal control over financial reporting during the quarter ended December 26, 2010 that have materially affected, or are likely to materially affect, the Company’s internal control over financial reporting. See “Management’s Report on Internal Control over Financial Reporting” in Item 8.
Item 9B. Other Information
None.
PART III
Item 10. Directors, Executive Officers and Corporate Governance Information regarding executive officers is included above under the caption “Executive Officers of the Registrant” at the end of Part I of this Report. Other information regarding directors, executive officers and corporate governance appearing under the captions “Corporate Governance,” “Item 1, Election of Directors,” “Section 16(a) Beneficial Ownership Reporting Compliance” and “Executive Compensation / Compensation Discussion and Analysis” is incorporated by reference from the Company’s definitive proxy statement, which will be filed with the Securities and Exchange Commission no later than 120 days after the end of the fiscal year covered by this Report. We have adopted a written code of ethics that applies to our directors, officers and employees. We intend to post all required disclosures concerning any amendments to, or waivers from, our code of ethics on our website to the extent permitted by NASDAQ. Our code of ethics can be found on our website, which is located at www.papajohns.com.
Item 11. Executive Compensation Information regarding executive compensation appearing under the captions “Executive Compensation / Compensation Discussion and Analysis,” “Compensation Committee Report” and “Certain Relationships and Related Transactions – Compensation Committee Interlocks and Insider Participation” is incorporated by reference from the Company’s definitive proxy statement, which will be filed with the Securities and Exchange Commission no later than 120 days after the end of the fiscal year covered by this Report.
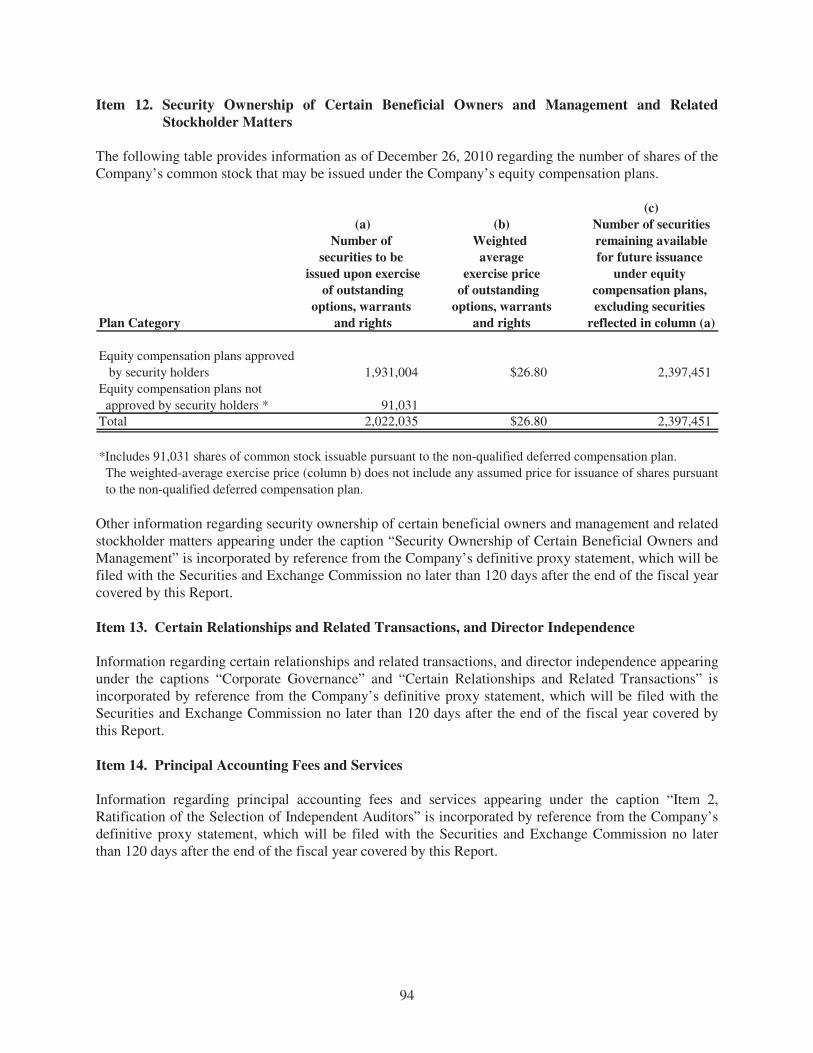
94
Item 12. Security Ownership of Certain Beneficial Owners and Management and Related
Stockholder Matters
The following table provides information as of December 26, 2010 regarding the number of shares of the Company’s common stock that may be issued under the Company’s equity compensation plans.
(c)
(a) (b) Number of securities
Number of Weighted remaining available
securities to be average for future issuance
issued upon exercise exercise price under equity
of outstanding of outstanding compensation plans,
options, warrants options, warrants excluding securities
Plan Category and rights and rights reflected in column (a)
Equity compensation plans approved
by security holders 1,931,004 $26.80 2,397,451
Equity compensation plans not
approved by security holders * 91,031
Total 2,022,035 $26.80 2,397,451
*Includes 91,031 shares of common stock issuable pursuant to the non-qualified deferred compensation plan.
The weighted-average exercise price (column b) does not include any assumed price for issuance of shares pursuant
to the non-qualified deferred compensation plan.
Other information regarding security ownership of certain beneficial owners and management and related stockholder matters appearing under the caption “Security Ownership of Certain Beneficial Owners and Management” is incorporated by reference from the Company’s definitive proxy statement, which will be filed with the Securities and Exchange Commission no later than 120 days after the end of the fiscal year covered by this Report.
Item 13. Certain Relationships and Related Transactions, and Director Independence
Information regarding certain relationships and related transactions, and director independence appearing under the captions “Corporate Governance” and “Certain Relationships and Related Transactions” is incorporated by reference from the Company’s definitive proxy statement, which will be filed with the Securities and Exchange Commission no later than 120 days after the end of the fiscal year covered by this Report.
Item 14. Principal Accounting Fees and Services
Information regarding principal accounting fees and services appearing under the caption “Item 2, Ratification of the Selection of Independent Auditors” is incorporated by reference from the Company’s definitive proxy statement, which will be filed with the Securities and Exchange Commission no later than 120 days after the end of the fiscal year covered by this Report.

95
PART IV
Item 15. Exhibits, Financial Statement Schedules (a)(1) Financial Statements: The following consolidated financial statements, notes related thereto and report of independent auditors are included in Item 8 of this Report:
• Reports of Independent Registered Public Accounting Firm
• Consolidated Statements of Income for the years ended December 26, 2010, December 27, 2009 and December 28, 2008
• Consolidated Balance Sheets as of December 26, 2010 and December 27, 2009
• Consolidated Statements of Stockholders’ Equity for the years ended December 26, 2010, December 27, 2009 and December 28, 2008
• Consolidated Statements of Cash Flows for the years ended December 26, 2010, December 27, 2009 and December 28, 2008
• Notes to Consolidated Financial Statements
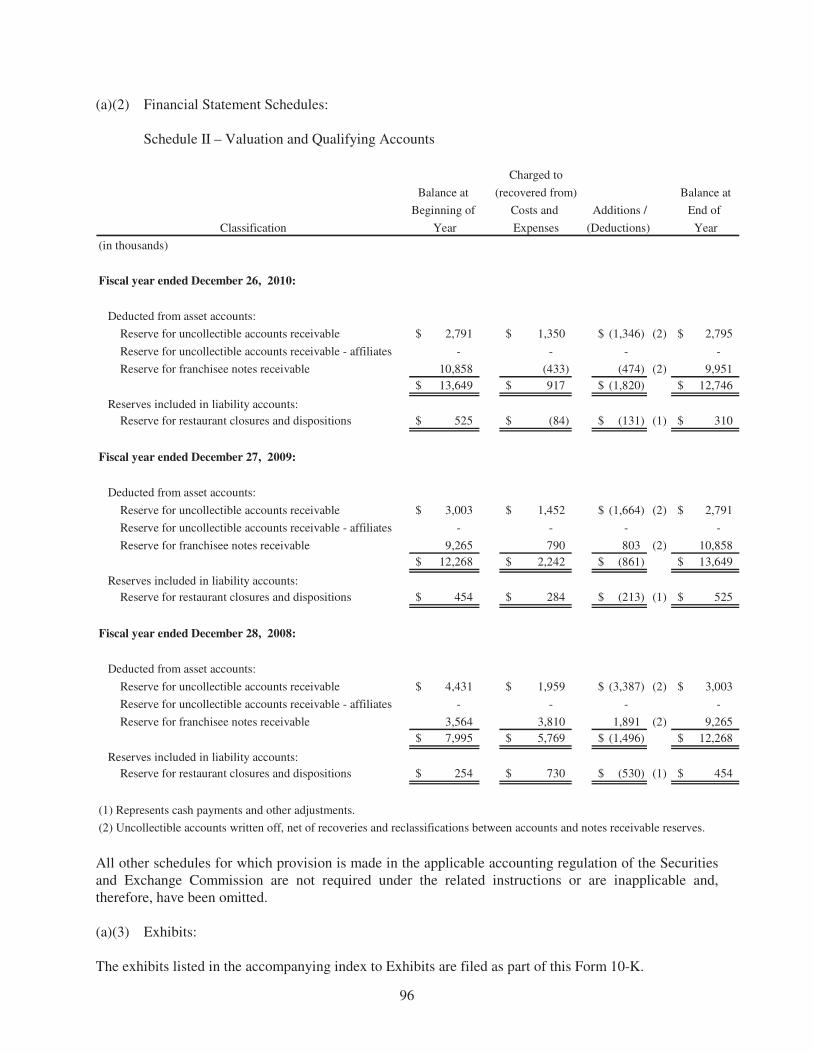
96
(a)(2) Financial Statement Schedules: Schedule II – Valuation and Qualifying Accounts
Charged to
Balance at (recovered from) Balance at
Beginning of Costs and Additions / End of
Classification Year Expenses (Deductions) Year
(in thousands)
Fiscal year ended December 26, 2010:
Deducted from asset accounts:
Reserve for uncollectible accounts receivable 2,791$ 1,350$ (1,346)$ (2) 2,795$
Reserve for uncollectible accounts receivable - affiliates - - - -
Reserve for franchisee notes receivable 10,858 (433) (474) (2) 9,951
13,649$ 917$ (1,820)$ 12,746$
Reserves included in liability accounts:
Reserve for restaurant closures and dispositions 525$ (84)$ (131)$ (1) 310$
Fiscal year ended December 27, 2009:
Deducted from asset accounts:
Reserve for uncollectible accounts receivable 3,003$ 1,452$ (1,664)$ (2) 2,791$
Reserve for uncollectible accounts receivable - affiliates - - - -
Reserve for franchisee notes receivable 9,265 790 803 (2) 10,858
12,268$ 2,242$ (861)$ 13,649$
Reserves included in liability accounts:
Reserve for restaurant closures and dispositions 454$ 284$ (213)$ (1) 525$
Fiscal year ended December 28, 2008:
Deducted from asset accounts:
Reserve for uncollectible accounts receivable 4,431$ 1,959$ (3,387)$ (2) 3,003$
Reserve for uncollectible accounts receivable - affiliates - - - -
Reserve for franchisee notes receivable 3,564 3,810 1,891 (2) 9,265
7,995$ 5,769$ (1,496)$ 12,268$
Reserves included in liability accounts:
Reserve for restaurant closures and dispositions 254$ 730$ (530)$ (1) 454$
(1) Represents cash payments and other adjustments.
(2) Uncollectible accounts written off, net of recoveries and reclassifications between accounts and notes receivable reserves.
All other schedules for which provision is made in the applicable accounting regulation of the Securities and Exchange Commission are not required under the related instructions or are inapplicable and, therefore, have been omitted. (a)(3) Exhibits: The exhibits listed in the accompanying index to Exhibits are filed as part of this Form 10-K.

97
SIGNATURES Pursuant to the requirements of Section 13 or 15(d) of the Securities Exchange Act of 1934, the Registrant has duly caused this report to be signed on its behalf by the undersigned, thereunto duly authorized.
Date: February 22, 2011 PAPA JOHN’S INTERNATIONAL, INC. By: /s/ John H. Schnatter John H. Schnatter Founder, Chairman and Co-Chief Executive Officer Pursuant to the requirements of the Securities Exchange Act of 1934, this report has been signed below by the following persons on behalf of the Registrant and in the capacities and on the dates indicated.
Signature Title Date
/s/ John H. Schnatter Founder, Chairman and February 22, 2011 John H. Schnatter Co-Chief Executive Officer (Principal Executive Officer) /s/ J. Jude Thompson Director, President and Co-Chief Executive February 22, 2011 J. Jude Thompson Officer (Principal Executive Officer) /s/ Norborne P. Cole, Jr. Director February 22, 2011 Norborne P. Cole, Jr. /s/ Philip Guarascio Director February 22, 2011 Philip Guarascio /s/ Olivia F. Kirtley Director February 22, 2011 Olivia F. Kirtley /s/ Wade S. Oney Director February 22, 2011 Wade S. Oney /s/ Alexander W. Smith Director February 22, 2011 Alexander W. Smith /s/ William M. Street Director February 22, 2011 William M. Street /s/ J. David Flanery Senior Vice President, Chief February 22, 2011 J. David Flanery Financial Officer and Treasurer (Principal Financial Officer and Principal Accounting Officer)
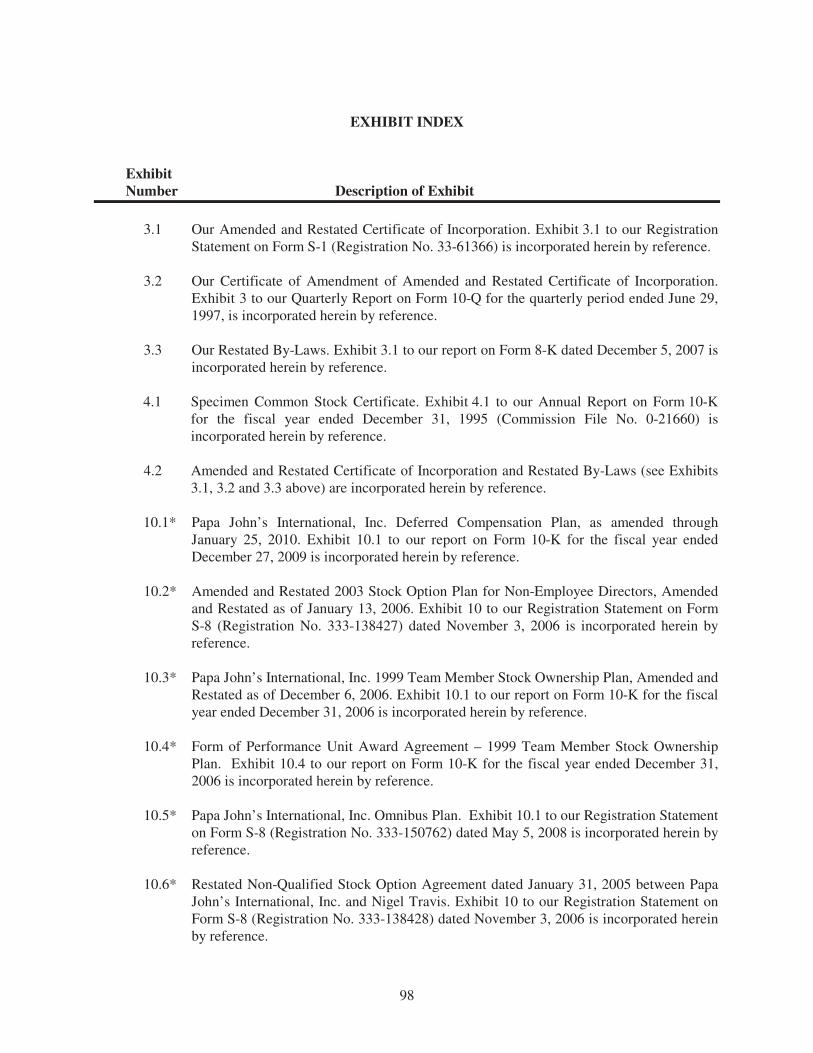
98
EXHIBIT INDEX
Exhibit
Number Description of Exhibit
3.1 Our Amended and Restated Certificate of Incorporation. Exhibit 3.1 to our Registration
Statement on Form S-1 (Registration No. 33-61366) is incorporated herein by reference.
3.2 Our Certificate of Amendment of Amended and Restated Certificate of Incorporation. Exhibit 3 to our Quarterly Report on Form 10-Q for the quarterly period ended June 29, 1997, is incorporated herein by reference.
3.3 Our Restated By-Laws. Exhibit 3.1 to our report on Form 8-K dated December 5, 2007 is
incorporated herein by reference.
4.1 Specimen Common Stock Certificate. Exhibit 4.1 to our Annual Report on Form 10-K for the fiscal year ended December 31, 1995 (Commission File No. 0-21660) is incorporated herein by reference.
4.2 Amended and Restated Certificate of Incorporation and Restated By-Laws (see Exhibits
3.1, 3.2 and 3.3 above) are incorporated herein by reference.
10.1* Papa John’s International, Inc. Deferred Compensation Plan, as amended through January 25, 2010. Exhibit 10.1 to our report on Form 10-K for the fiscal year ended December 27, 2009 is incorporated herein by reference.
10.2* Amended and Restated 2003 Stock Option Plan for Non-Employee Directors, Amended
and Restated as of January 13, 2006. Exhibit 10 to our Registration Statement on Form S-8 (Registration No. 333-138427) dated November 3, 2006 is incorporated herein by reference.
10.3* Papa John’s International, Inc. 1999 Team Member Stock Ownership Plan, Amended and
Restated as of December 6, 2006. Exhibit 10.1 to our report on Form 10-K for the fiscal year ended December 31, 2006 is incorporated herein by reference.
10.4* Form of Performance Unit Award Agreement – 1999 Team Member Stock Ownership
Plan. Exhibit 10.4 to our report on Form 10-K for the fiscal year ended December 31, 2006 is incorporated herein by reference.
10.5* Papa John’s International, Inc. Omnibus Plan. Exhibit 10.1 to our Registration Statement
on Form S-8 (Registration No. 333-150762) dated May 5, 2008 is incorporated herein by reference.
10.6* Restated Non-Qualified Stock Option Agreement dated January 31, 2005 between Papa
John’s International, Inc. and Nigel Travis. Exhibit 10 to our Registration Statement on Form S-8 (Registration No. 333-138428) dated November 3, 2006 is incorporated herein by reference.

99
10.7* Agreement and Release between Nigel Travis and Papa John’s International, Inc. Exhibit 10.1 to our report on Form 8-K/A dated December 31, 2008 is incorporated herein by reference.
10.8* Agreement for Service as Chairman between John H. Schnatter and Papa John’s
International, Inc. Exhibit 10.1 to our report on Form 8-K dated August 9, 2007 is incorporated herein by reference.
10.9* Agreement for Service as Founder between John H. Schnatter and Papa John’s
International, Inc. Exhibit 10.1 to our report on Form 8-K dated August 9, 2007 is incorporated herein by reference.
10.10* Amendment and Restated Exclusive License Agreement between John H. Schnatter and
Papa John’s International, Inc. Exhibit 10.1 to our report on Form 8-K dated May 14, 2008 is incorporated herein by reference.
10.11* Agreement and Release by and between William M. VanEpps and Papa John’s
International, Inc. dated March 25, 2009. Exhibit 10.1 to our report on Form 8-K dated March 27, 2009 is incorporated herein by reference.
10.12* Agreement and Release by and between Julie Larner and PJ Food Service, Inc. dated
July 6, 2009. Exhibit 10.1 to our report on Form 8-K/A dated July 10, 2009 is incorporated herein by reference.
10.13* Agreement and Release between William Mitchell and Papa John’s International, Inc.
Exhibit 10.1 to our report on Form 8-K/A dated May 7, 2010 is incorporated herein by reference.
10.14 Conformed Copy through Fourth Amendment, As of December 19, 2007, of the Secured
Loan Agreement, by and between BIBP Commodities, Inc. and Capital Delivery, Ltd. Exhibit 10.1 to our Annual Report on Form 10-K for the fiscal year ended December 30, 2007 is incorporated herein by reference.
10.15 Conformed Copy through Fourth Amendment, As of December 19, 2007, of the
Promissory Note by BIBP Commodities, Inc. Exhibit 10.2 to our Annual Report on Form 10-K for the fiscal year ended December 30, 2007 is incorporated herein by reference.
10.16 Fifth Amendments, As of July 31, 2008, of the Secured Loan Agreement, by and
between BIBP Commodities, Inc. and Capital Delivery, Ltd. and of the Promissory Note by BIBP Commodities, Inc. Exhibit 10.2 to our Quarterly Report on Form 10-Q for the quarter ended September 28, 2008 is incorporated herein by reference.
10.17 $175,000,000 Revolving Credit Facility by and among Papa John’s International, Inc.,
the Guarantors party thereto, RSC Insurance Services, Ltd., a Bermuda company, the Banks party thereto, PNC Bank, National Association, as Administrative Agent, JPMorgan Chase Bank, N.A., as Syndication Agent, U.S. Bank, National Association, as Co-Documentation Agent, Bank of America, N.A., as Co-Documentation Agent, Fifth Third Bank, as Co-Documentation Agent, PNC Capital Markets LLC, as Joint Lead Arranger and as Joint Bookrunner, and J.P. Morgan Securities LLC, as Joint Lead
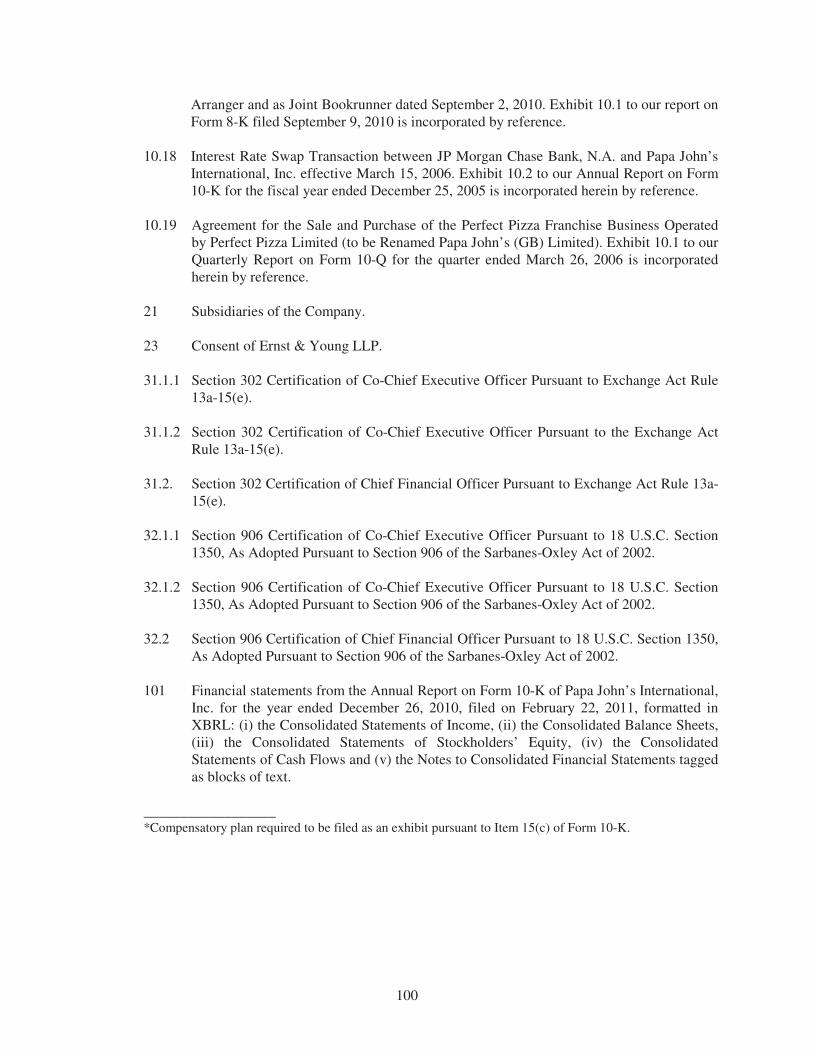
100
Arranger and as Joint Bookrunner dated September 2, 2010. Exhibit 10.1 to our report on Form 8-K filed September 9, 2010 is incorporated by reference.
10.18 Interest Rate Swap Transaction between JP Morgan Chase Bank, N.A. and Papa John’s
International, Inc. effective March 15, 2006. Exhibit 10.2 to our Annual Report on Form 10-K for the fiscal year ended December 25, 2005 is incorporated herein by reference.
10.19 Agreement for the Sale and Purchase of the Perfect Pizza Franchise Business Operated
by Perfect Pizza Limited (to be Renamed Papa John’s (GB) Limited). Exhibit 10.1 to our Quarterly Report on Form 10-Q for the quarter ended March 26, 2006 is incorporated herein by reference.
21 Subsidiaries of the Company.
23 Consent of Ernst & Young LLP. 31.1.1 Section 302 Certification of Co-Chief Executive Officer Pursuant to Exchange Act Rule
13a-15(e). 31.1.2 Section 302 Certification of Co-Chief Executive Officer Pursuant to the Exchange Act
Rule 13a-15(e). 31.2. Section 302 Certification of Chief Financial Officer Pursuant to Exchange Act Rule 13a-
15(e). 32.1.1 Section 906 Certification of Co-Chief Executive Officer Pursuant to 18 U.S.C. Section
1350, As Adopted Pursuant to Section 906 of the Sarbanes-Oxley Act of 2002. 32.1.2 Section 906 Certification of Co-Chief Executive Officer Pursuant to 18 U.S.C. Section
1350, As Adopted Pursuant to Section 906 of the Sarbanes-Oxley Act of 2002. 32.2 Section 906 Certification of Chief Financial Officer Pursuant to 18 U.S.C. Section 1350,
As Adopted Pursuant to Section 906 of the Sarbanes-Oxley Act of 2002. 101 Financial statements from the Annual Report on Form 10-K of Papa John’s International,
Inc. for the year ended December 26, 2010, filed on February 22, 2011, formatted in XBRL: (i) the Consolidated Statements of Income, (ii) the Consolidated Balance Sheets, (iii) the Consolidated Statements of Stockholders’ Equity, (iv) the Consolidated Statements of Cash Flows and (v) the Notes to Consolidated Financial Statements tagged as blocks of text.
__________________
*Compensatory plan required to be filed as an exhibit pursuant to Item 15(c) of Form 10-K.

101
The Exhibits to this Annual Report on Form 10-K are not contained herein. The Company will
furnish a copy of any of the Exhibits to a stockholder upon written request to Investor Relations,
Papa John’s International, Inc., P.O. Box 99900, Louisville, KY 40269-0900.


![[5] v. PAPA JOHN'S INTERNATIONAL, INC.; PAPA JOHN'S …wps.prenhall.com/.../ch_7/Pizza_Hut_Inc_v_Papa_Johns_Inter.pdf · introduction in 1995 until May 1997. However, the slogan "became](https://img.pdfslide.us/doc/110x75/5abc82cf7f8b9a76038df8db/5-v-papa-johns-international-inc-papa-johns-wps-in-1995-until-may-1997.jpg)