Embed Size (px)
Citation preview
Investor Presentation
September 2015
2
Safe Harbor Statement
Statements contained in this presentation that state the company’s or management’s expectations or predictions of the future are forward–looking statements intended to be covered by the safe harbor provisions of the Securities Act of 1933 and the Securities Exchange Act of 1934. The words “believe,” “expect,” “should,” “estimates,” “intend,” and other similar expressions identify forward–looking statements. It is important to note that actual results could differ materially from those projected in such forward–looking statements. For more information concerning factors that could cause actual results to differ from those expressed or forecasted, see Valero’s annual reports on Form 10-K and quarterly reports on Form 10-Q, filed with the Securities and Exchange Commission, and available on Valero’s website at www.valero.com.
3
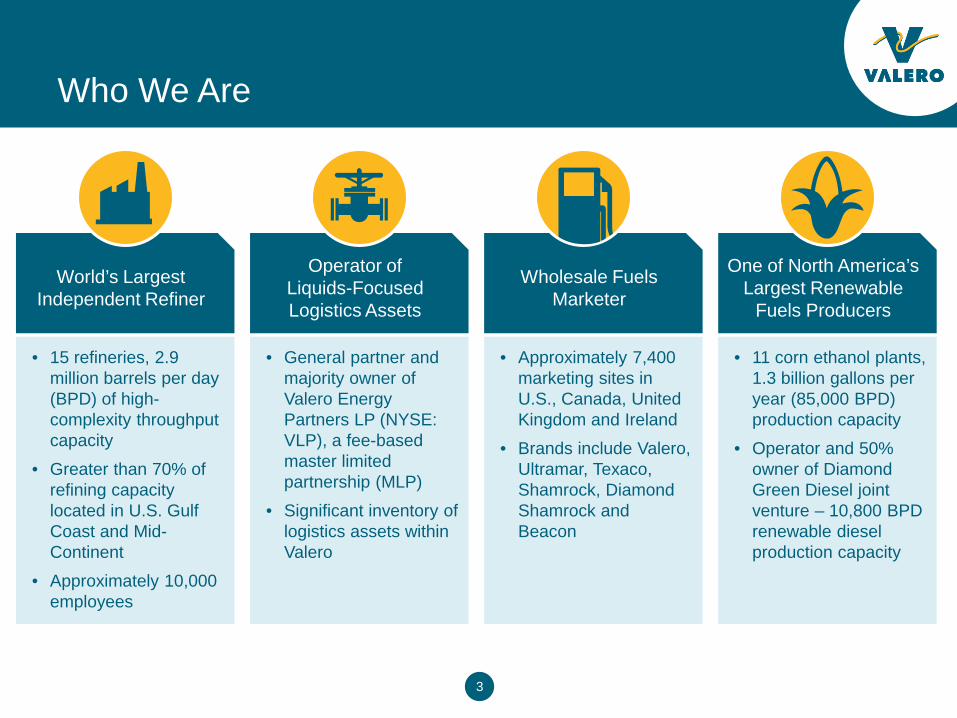
Who We Are
World’s Largest Independent Refiner
• 15 refineries, 2.9 million barrels per day (BPD) of high-complexity throughput capacity
• Greater than 70% of refining capacity located in U.S. Gulf Coast and Mid-Continent
• Approximately 10,000 employees
Operator of Liquids-Focused Logistics Assets
• General partner and majority owner of Valero Energy Partners LP (NYSE: VLP), a fee-based master limited partnership (MLP)
• Significant inventory of logistics assets within Valero
Wholesale Fuels Marketer
• Approximately 7,400 marketing sites in U.S., Canada, United Kingdom and Ireland
• Brands include Valero, Ultramar, Texaco, Shamrock, Diamond Shamrock and Beacon
One of North America’s Largest Renewable
Fuels Producers
• 11 corn ethanol plants, 1.3 billion gallons per year (85,000 BPD) production capacity
• Operator and 50% owner of Diamond Green Diesel joint venture – 10,800 BPD renewable diesel production capacity
4
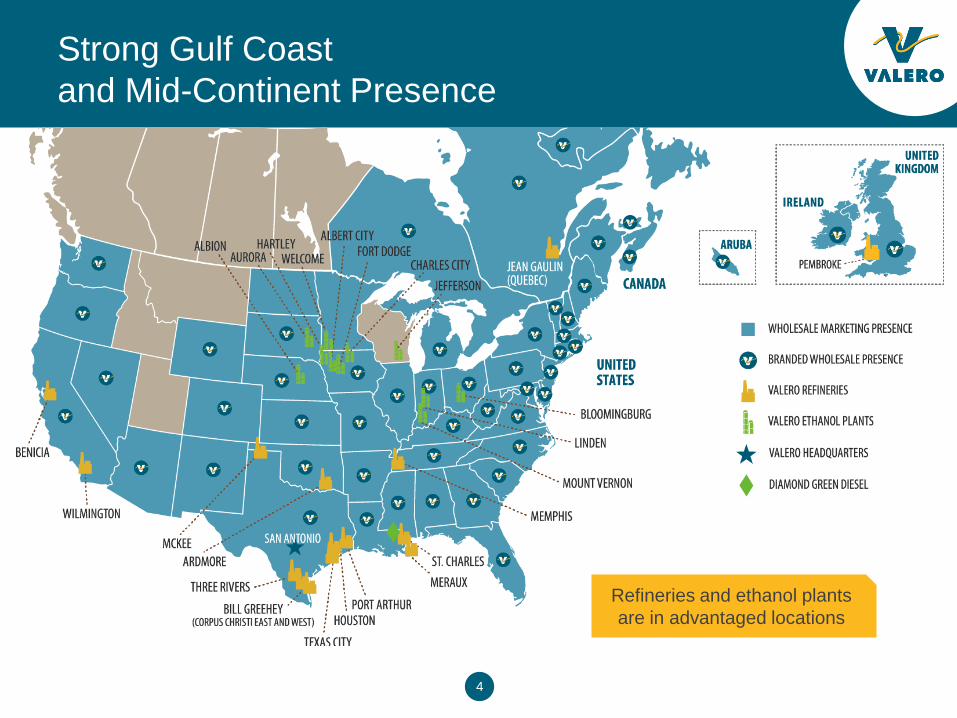
Strong Gulf Coast and Mid-Continent Presence
Refineries and ethanol plants are in advantaged locations
5
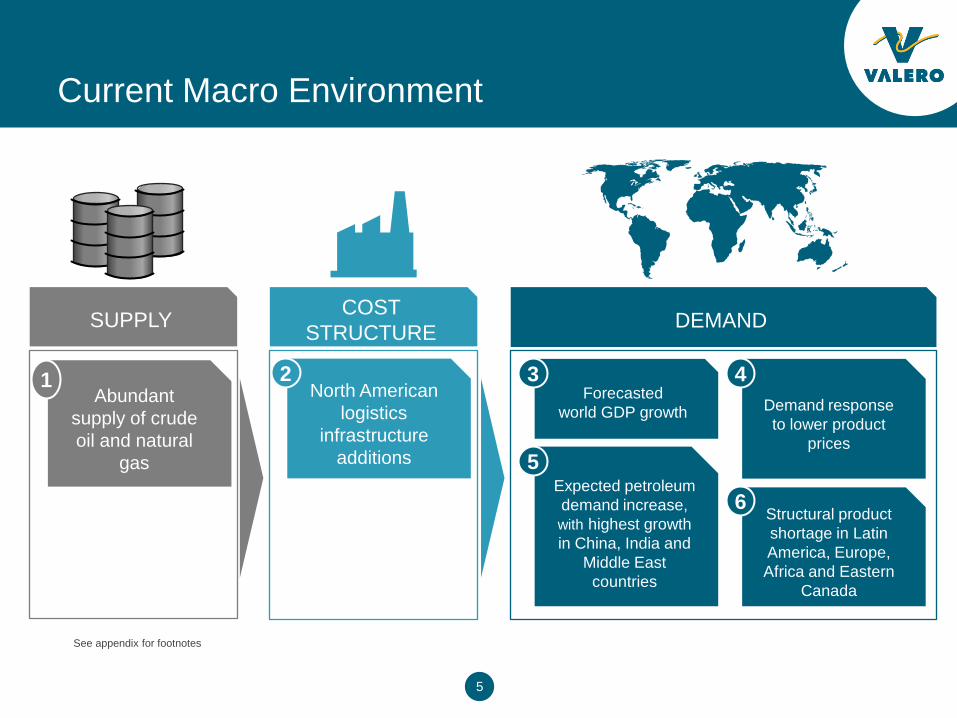
Current Macro Environment
Abundant supply of crude oil and natural
gas
1
Expected petroleum demand increase, with highest growth in China, India and
Middle East countries
5
Forecasted world GDP growth
3
Structural product shortage in Latin America, Europe, Africa and Eastern
Canada
6
Demand response to lower product
prices
4
COST STRUCTURE SUPPLY DEMAND
North American logistics
infrastructure additions
2
See appendix for footnotes
6
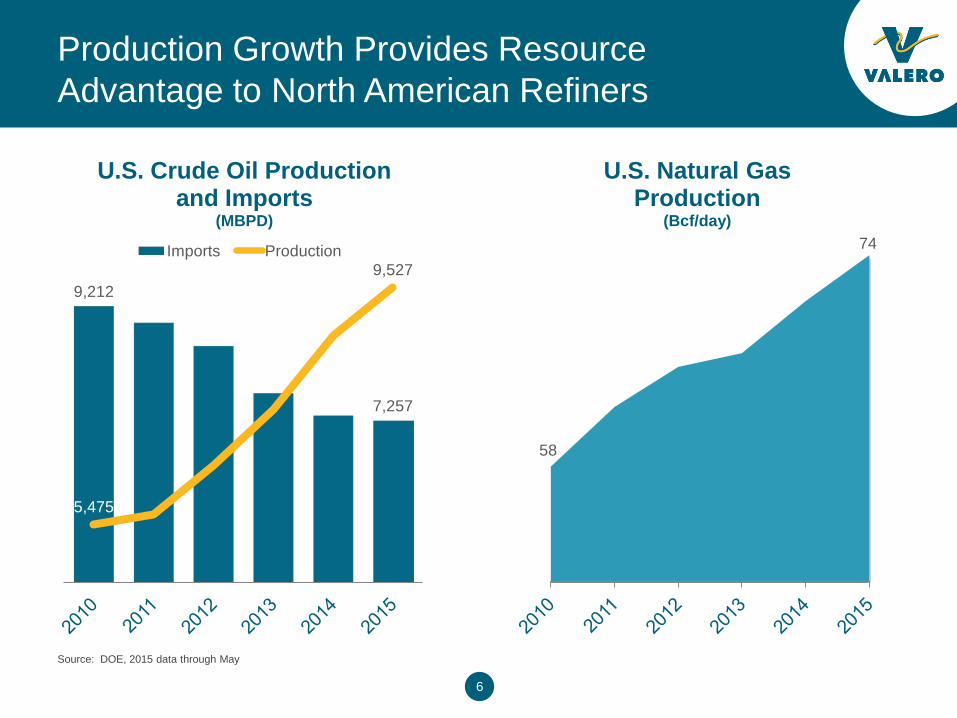
Production Growth Provides Resource Advantage to North American Refiners
58
74
U.S. Natural Gas Production
(Bcf/day)
Source: DOE, 2015 data through May
9,212
7,257
5,475
9,527
U.S. Crude Oil Production and Imports
(MBPD)
Imports Production
7
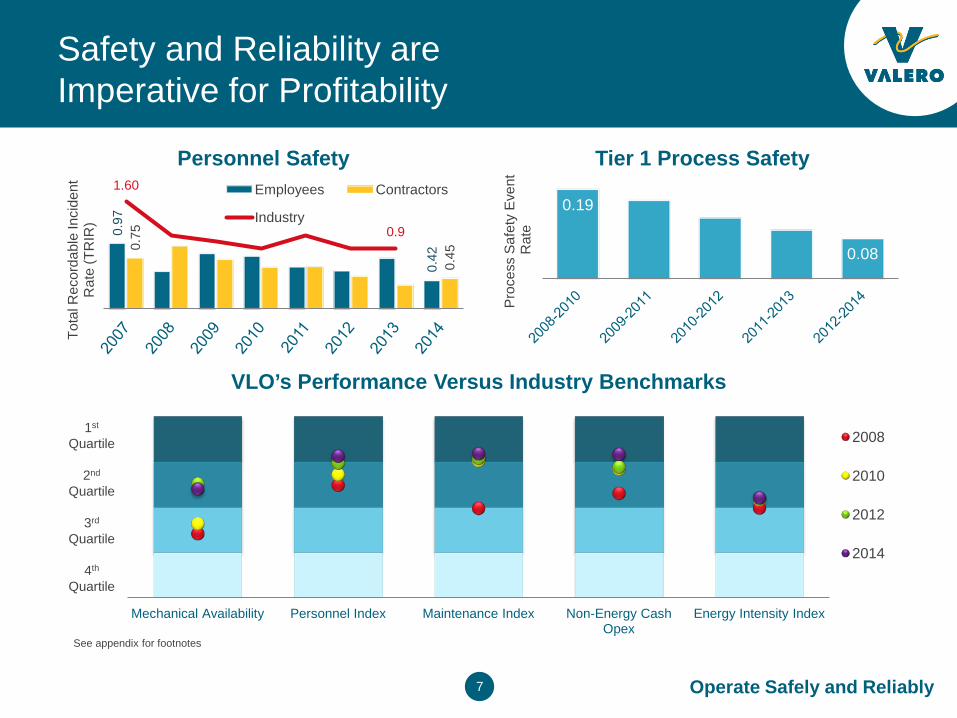
Safety and Reliability are Imperative for Profitability
0.97
0.42
0.75
0.45
1.60
0.9
Tota
l Rec
orda
ble
Inci
dent
R
ate
(TR
IR)
Personnel Safety Employees Contractors
Industry 0.19
0.08
Pro
cess
Saf
ety
Eve
nt
Rat
e
Tier 1 Process Safety
Mechanical Availability Personnel Index Maintenance Index Non-Energy Cash Opex
Energy Intensity Index
VLO’s Performance Versus Industry Benchmarks
2008
2010
2012
2014 4th
Quartile
1st Quartile
3rd Quartile
2nd Quartile
See appendix for footnotes
Operate Safely and Reliably
8
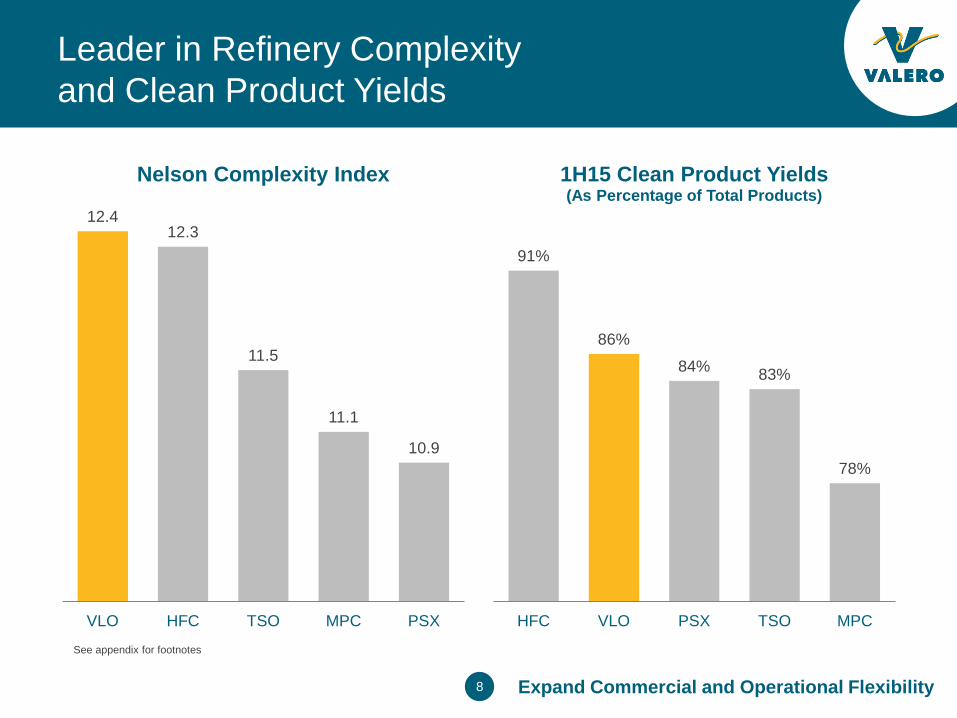
Leader in Refinery Complexity and Clean Product Yields
12.4 12.3
11.5
11.1
10.9
VLO HFC TSO MPC PSX
Nelson Complexity Index
91%
86%
84% 83%
78%
HFC VLO PSX TSO MPC
1H15 Clean Product Yields (As Percentage of Total Products)
See appendix for footnotes
Expand Commercial and Operational Flexibility
9
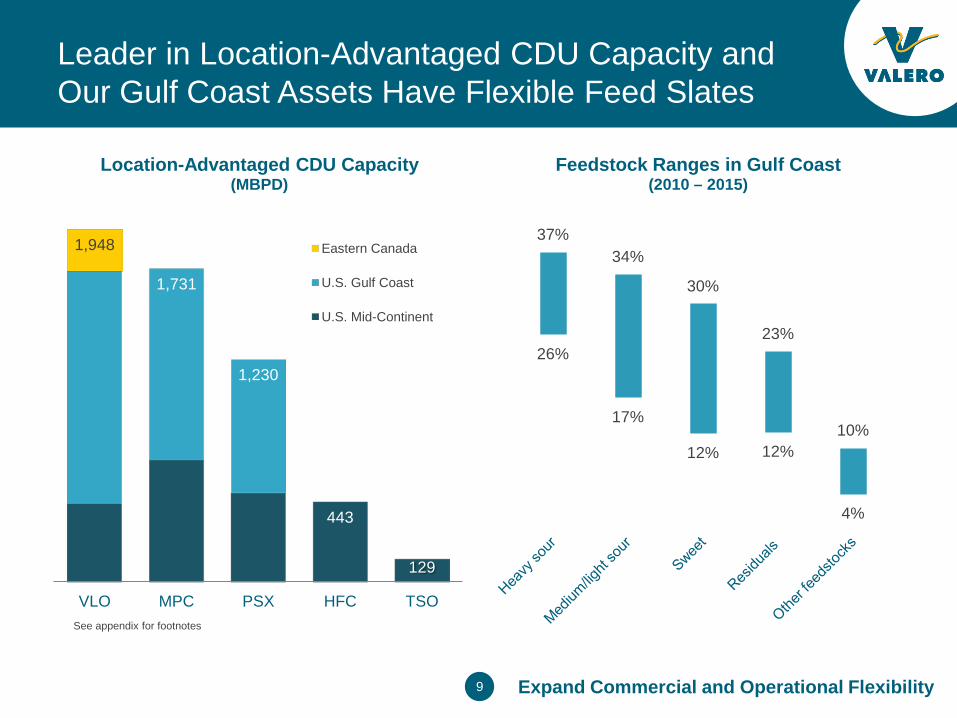
Leader in Location-Advantaged CDU Capacity and Our Gulf Coast Assets Have Flexible Feed Slates
26%
17%
12% 12%
4%
37% 34%
30%
23%
10%
Feedstock Ranges in Gulf Coast (2010 – 2015)
See appendix for footnotes
1,948
1,731
1,230
443
129
VLO MPC PSX HFC TSO
Location-Advantaged CDU Capacity (MBPD)
Eastern Canada
U.S. Gulf Coast
U.S. Mid-Continent
Expand Commercial and Operational Flexibility
10
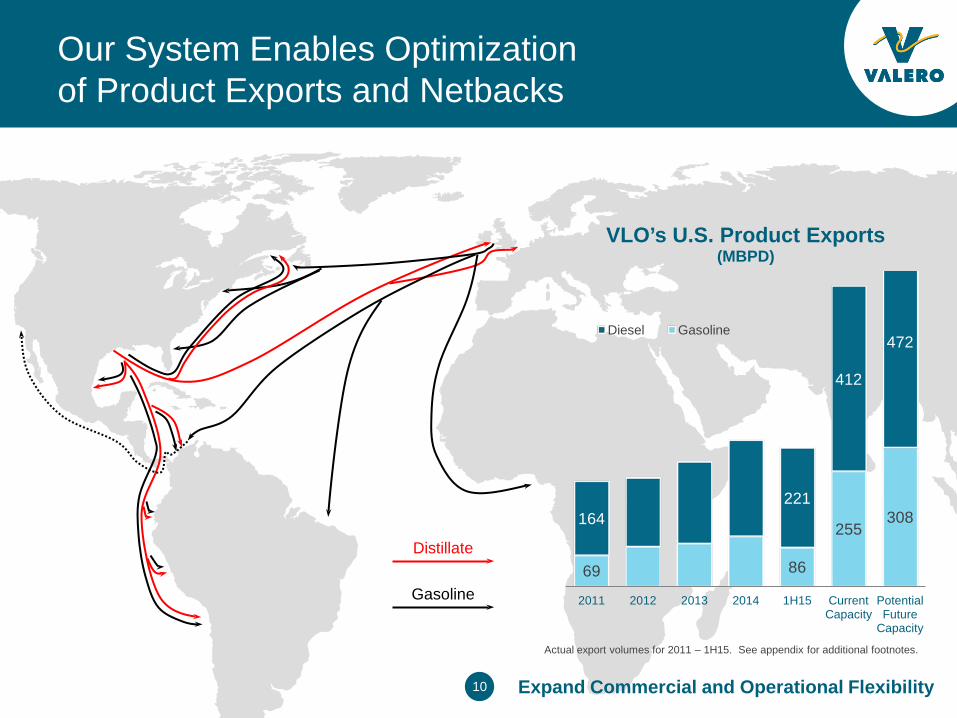
Our System Enables Optimization of Product Exports and Netbacks
Distillate
Gasoline 69 86
255 308 164
221
412
472
2011 2012 2013 2014 1H15 Current Capacity
Potential Future
Capacity
VLO’s U.S. Product Exports (MBPD)
Diesel Gasoline
Expand Commercial and Operational Flexibility
Actual export volumes for 2011 – 1H15. See appendix for additional footnotes.
11
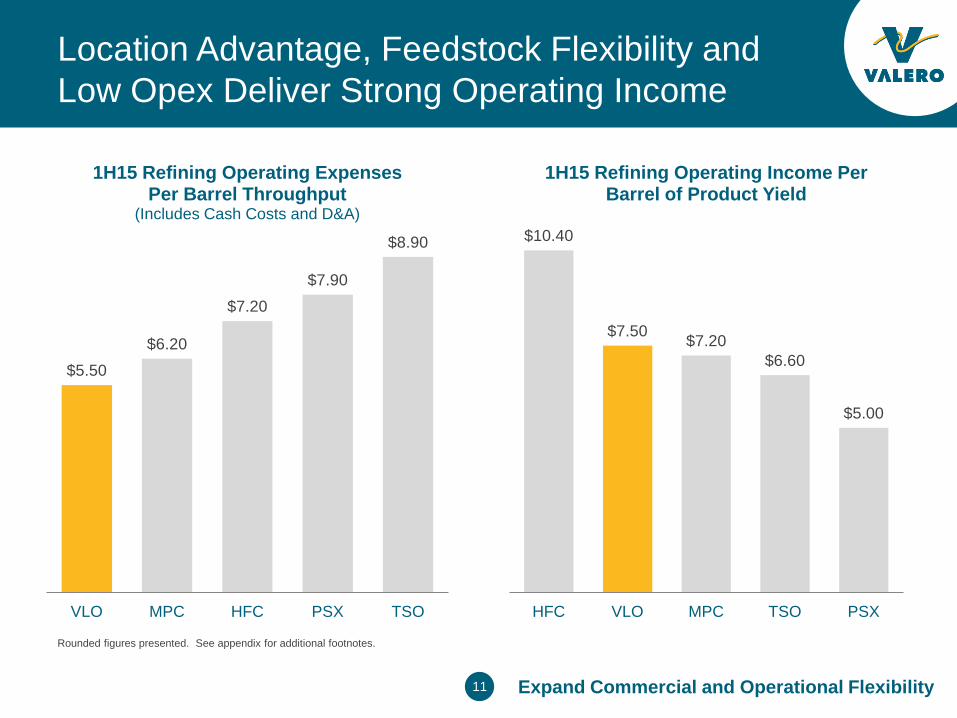
Location Advantage, Feedstock Flexibility and Low Opex Deliver Strong Operating Income
$5.50 $6.20
$7.20 $7.90
$8.90
VLO MPC HFC PSX TSO
1H15 Refining Operating Expenses Per Barrel Throughput
(Includes Cash Costs and D&A) $10.40
$7.50 $7.20 $6.60
$5.00
HFC VLO MPC TSO PSX
1H15 Refining Operating Income Per Barrel of Product Yield
Rounded figures presented. See appendix for additional footnotes.
Expand Commercial and Operational Flexibility
12
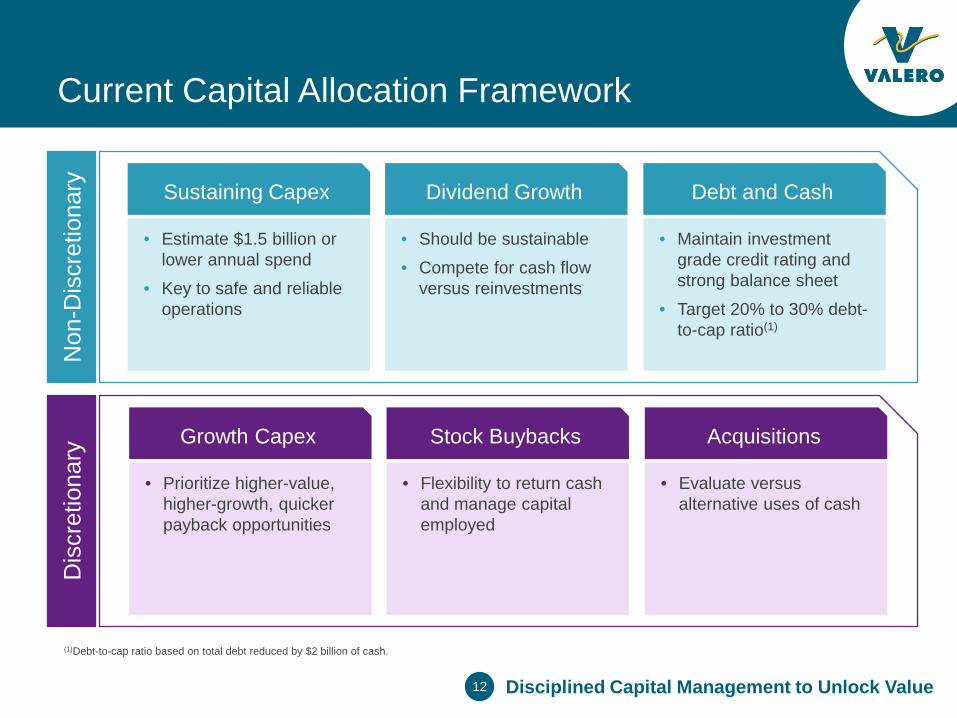
Current Capital Allocation Framework
Sustaining Capex
• Estimate $1.5 billion or lower annual spend
• Key to safe and reliable operations
Dividend Growth
• Should be sustainable
• Compete for cash flow versus reinvestments
Debt and Cash
• Maintain investment grade credit rating and strong balance sheet
• Target 20% to 30% debt-to-cap ratio(1)
(1)Debt-to-cap ratio based on total debt reduced by $2 billion of cash.
Growth Capex
• Prioritize higher-value, higher-growth, quicker payback opportunities
Stock Buybacks
• Flexibility to return cash and manage capital employed
Acquisitions
• Evaluate versus alternative uses of cash
Non
-Dis
cret
iona
ry
Dis
cret
iona
ry
Disciplined Capital Management to Unlock Value
13
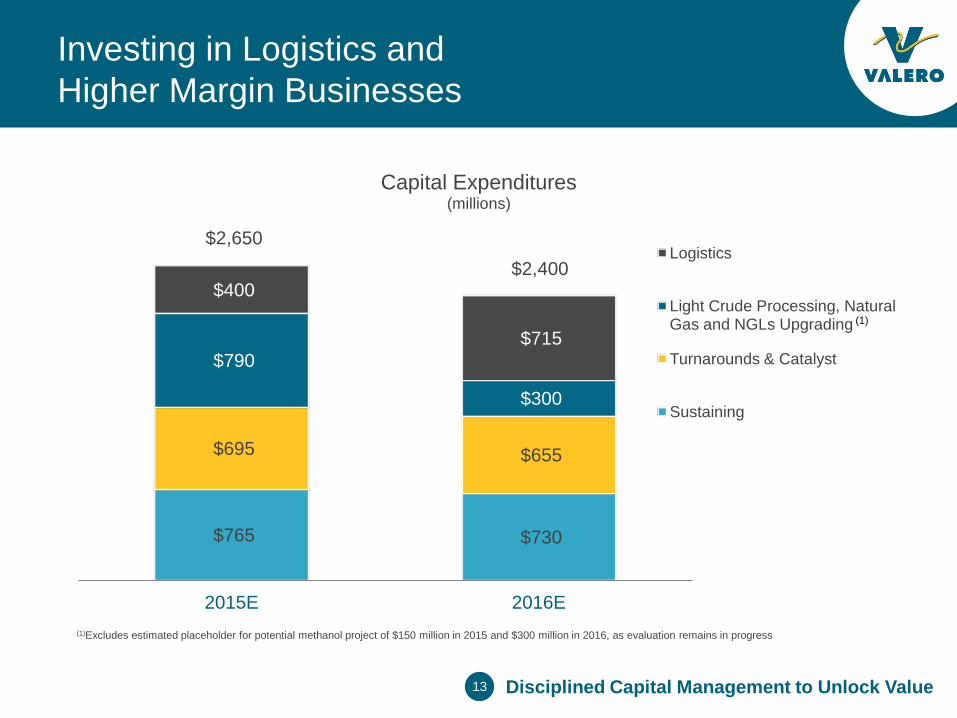
Investing in Logistics and Higher Margin Businesses
$765 $730
$695 $655
$790
$300
$400
$715
$2,650 $2,400
2015E 2016E
Capital Expenditures (millions)
Logistics
Light Crude Processing, Natural Gas and NGLs Upgrading
Turnarounds & Catalyst
Sustaining
(1)Excludes estimated placeholder for potential methanol project of $150 million in 2015 and $300 million in 2016, as evaluation remains in progress
(1)
Disciplined Capital Management to Unlock Value
14
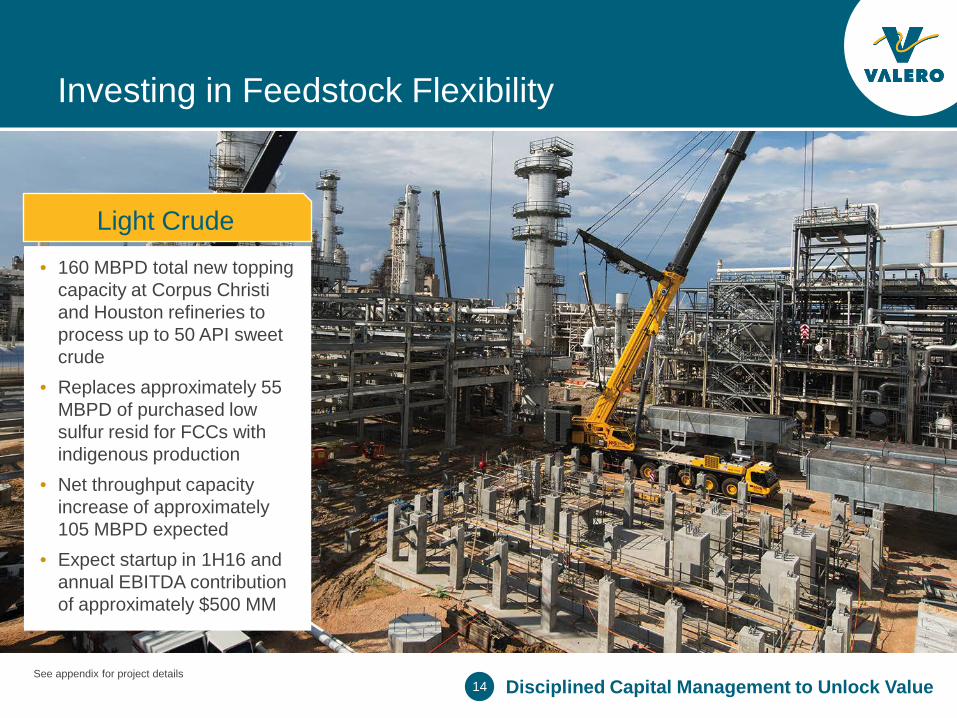
Investing in Feedstock Flexibility
Light Crude • 160 MBPD total new topping
capacity at Corpus Christi and Houston refineries to process up to 50 API sweet crude
• Replaces approximately 55 MBPD of purchased low sulfur resid for FCCs with indigenous production
• Net throughput capacity increase of approximately 105 MBPD expected
• Expect startup in 1H16 and annual EBITDA contribution of approximately $500 MM
See appendix for project details Disciplined Capital Management to Unlock Value
15
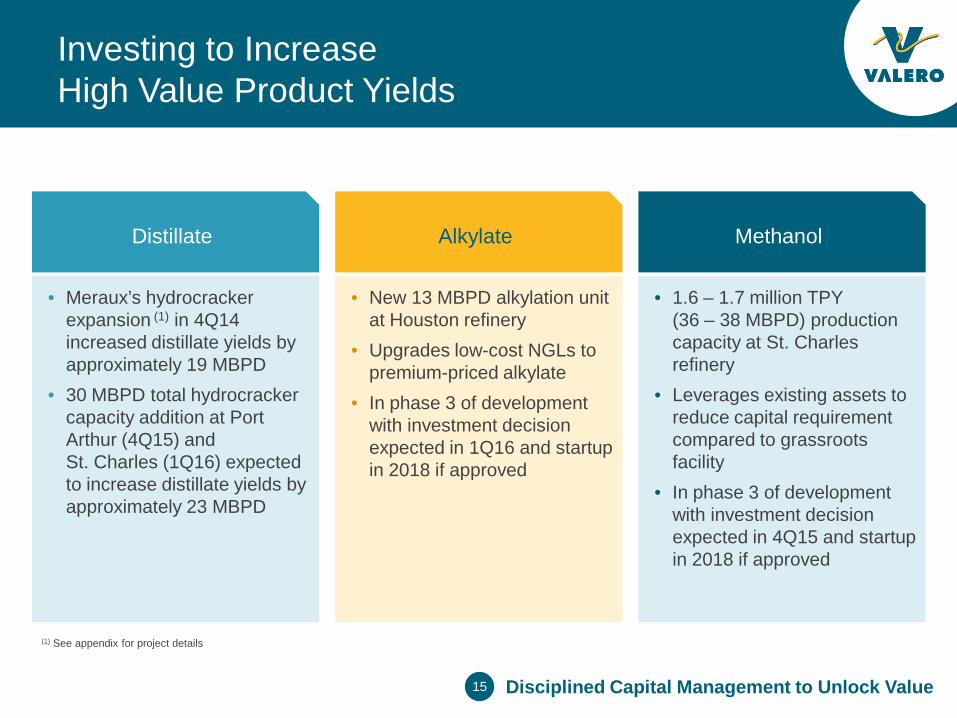
Investing to Increase High Value Product Yields
Distillate
• Meraux’s hydrocracker expansion (1) in 4Q14 increased distillate yields by approximately 19 MBPD
• 30 MBPD total hydrocracker capacity addition at Port Arthur (4Q15) and St. Charles (1Q16) expected to increase distillate yields by approximately 23 MBPD
Alkylate
• New 13 MBPD alkylation unit at Houston refinery
• Upgrades low-cost NGLs to premium-priced alkylate
• In phase 3 of development with investment decision expected in 1Q16 and startup in 2018 if approved
Methanol
• 1.6 – 1.7 million TPY (36 – 38 MBPD) production capacity at St. Charles refinery
• Leverages existing assets to reduce capital requirement compared to grassroots facility
• In phase 3 of development with investment decision expected in 4Q15 and startup in 2018 if approved
(1) See appendix for project details
Disciplined Capital Management to Unlock Value
16
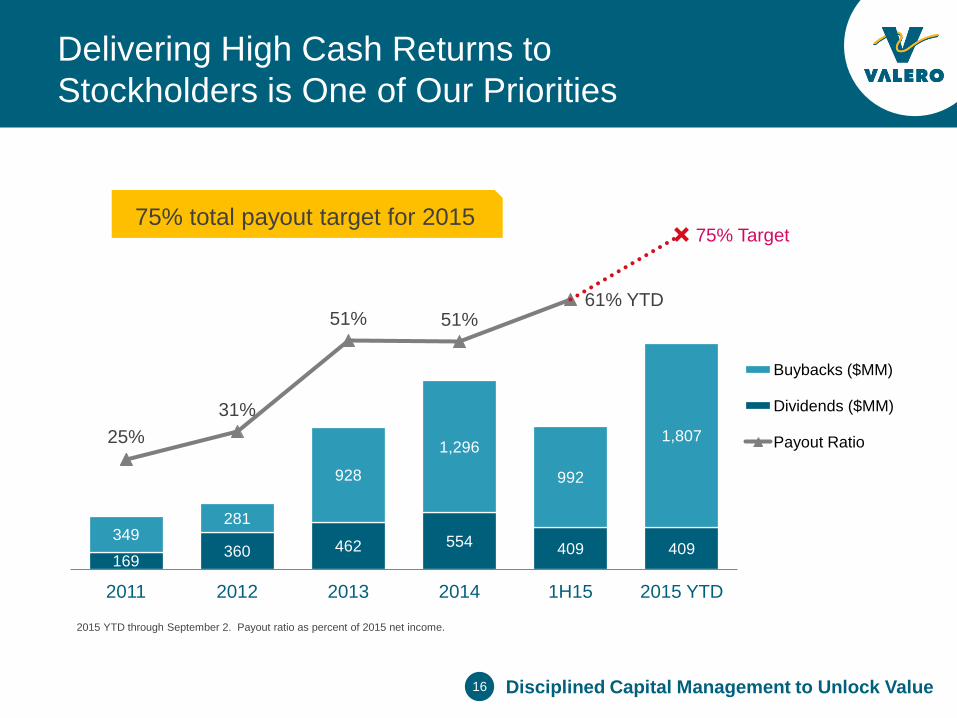
Delivering High Cash Returns to Stockholders is One of Our Priorities
75% total payout target for 2015
2015 YTD through September 2. Payout ratio as percent of 2015 net income.
169 360 462 554 409 409 349
281
928
1,296
992
1,807 25% 31%
51% 51% 61% YTD
75% Target
2011 2012 2013 2014 1H15 2015 YTD
Buybacks ($MM)
Dividends ($MM)
Payout Ratio
Disciplined Capital Management to Unlock Value
17
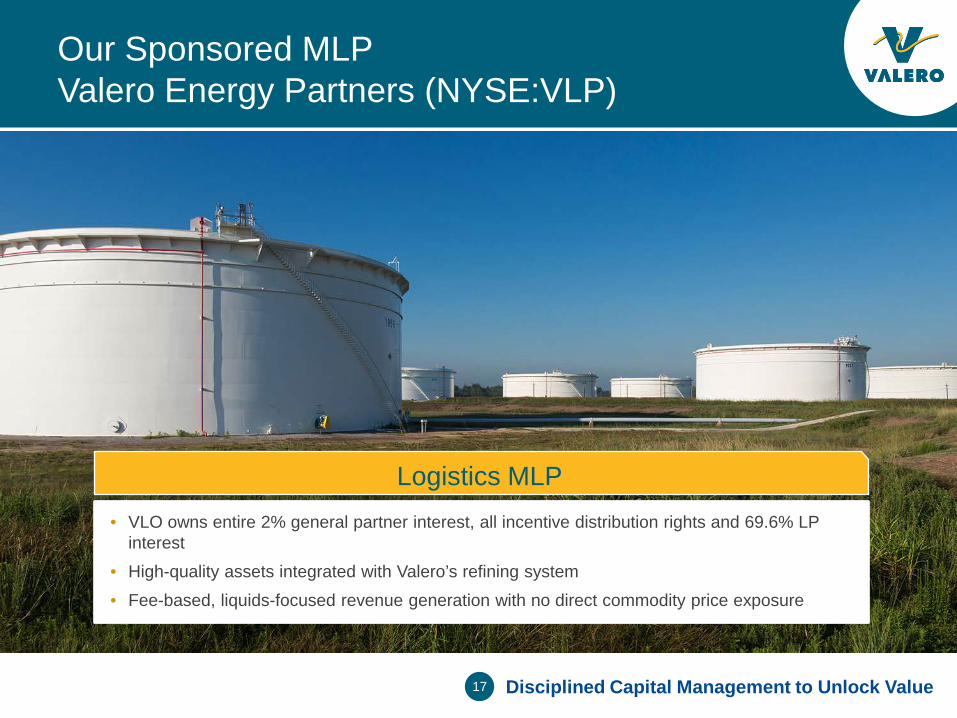
Our Sponsored MLP Valero Energy Partners (NYSE:VLP)
Disciplined Capital Management to Unlock Value
Logistics MLP • VLO owns entire 2% general partner interest, all incentive distribution rights and 69.6% LP
interest
• High-quality assets integrated with Valero’s refining system
• Fee-based, liquids-focused revenue generation with no direct commodity price exposure
18
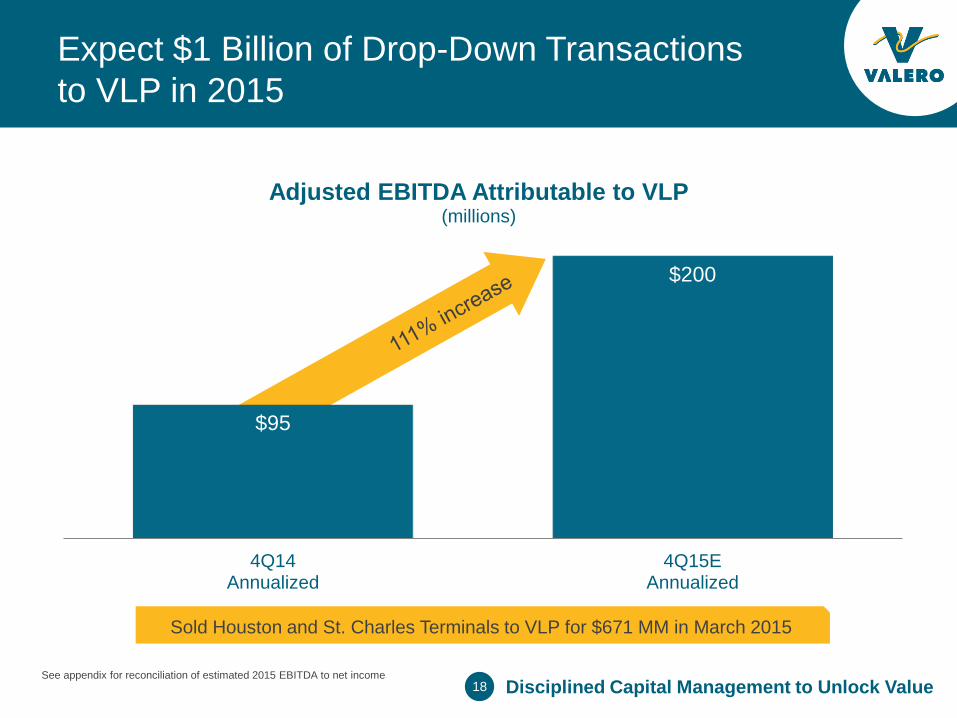
$95
$200
4Q14 Annualized
4Q15E Annualized
Adjusted EBITDA Attributable to VLP (millions)
Expect $1 Billion of Drop-Down Transactions to VLP in 2015
See appendix for reconciliation of estimated 2015 EBITDA to net income
Sold Houston and St. Charles Terminals to VLP for $671 MM in March 2015
Disciplined Capital Management to Unlock Value
19
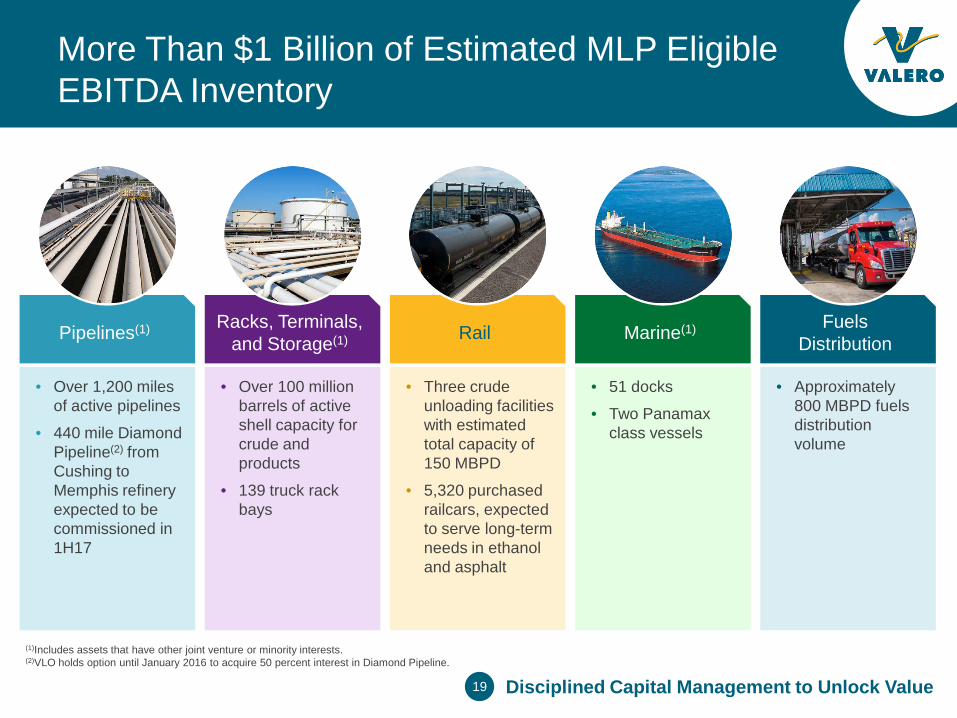
More Than $1 Billion of Estimated MLP Eligible EBITDA Inventory
Racks, Terminals, and Storage(1)
• Over 100 million barrels of active shell capacity for crude and products
• 139 truck rack bays
Rail
• Three crude unloading facilities with estimated total capacity of 150 MBPD
• 5,320 purchased railcars, expected to serve long-term needs in ethanol and asphalt
Pipelines(1)
• Over 1,200 miles of active pipelines
• 440 mile Diamond Pipeline(2) from Cushing to Memphis refinery expected to be commissioned in 1H17
Marine(1)
• 51 docks
• Two Panamax class vessels
(1)Includes assets that have other joint venture or minority interests. (2)VLO holds option until January 2016 to acquire 50 percent interest in Diamond Pipeline.
Disciplined Capital Management to Unlock Value
Fuels Distribution
• Approximately 800 MBPD fuels distribution volume
20
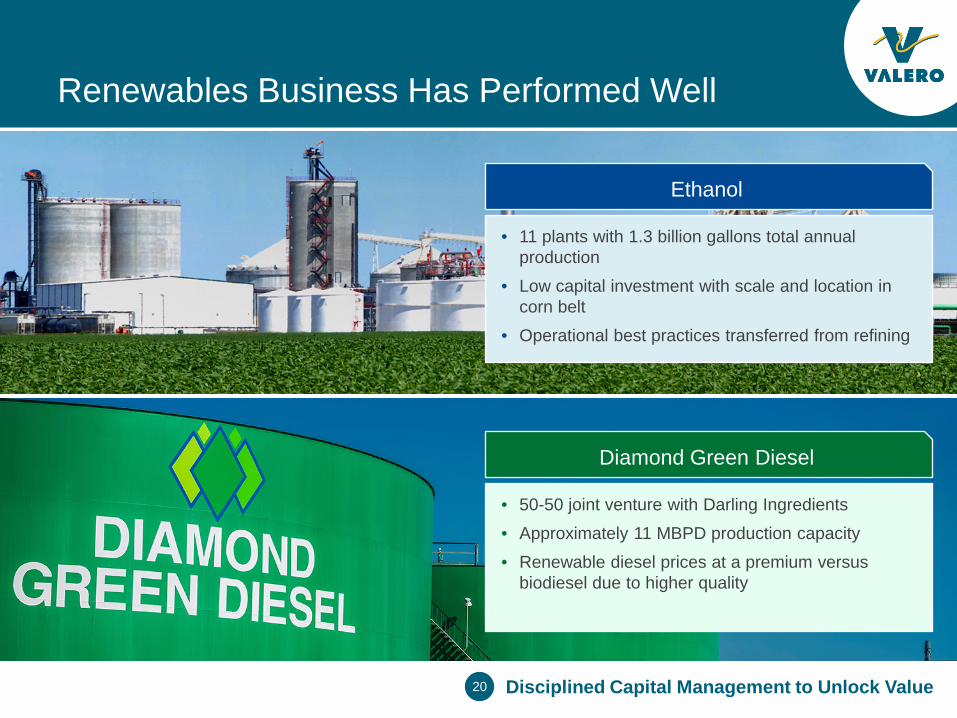
Renewables Business Has Performed Well
Ethanol
• 11 plants with 1.3 billion gallons total annual production
• Low capital investment with scale and location in corn belt
• Operational best practices transferred from refining
Disciplined Capital Management to Unlock Value
Diamond Green Diesel
• 50-50 joint venture with Darling Ingredients
• Approximately 11 MBPD production capacity
• Renewable diesel prices at a premium versus biodiesel due to higher quality
21
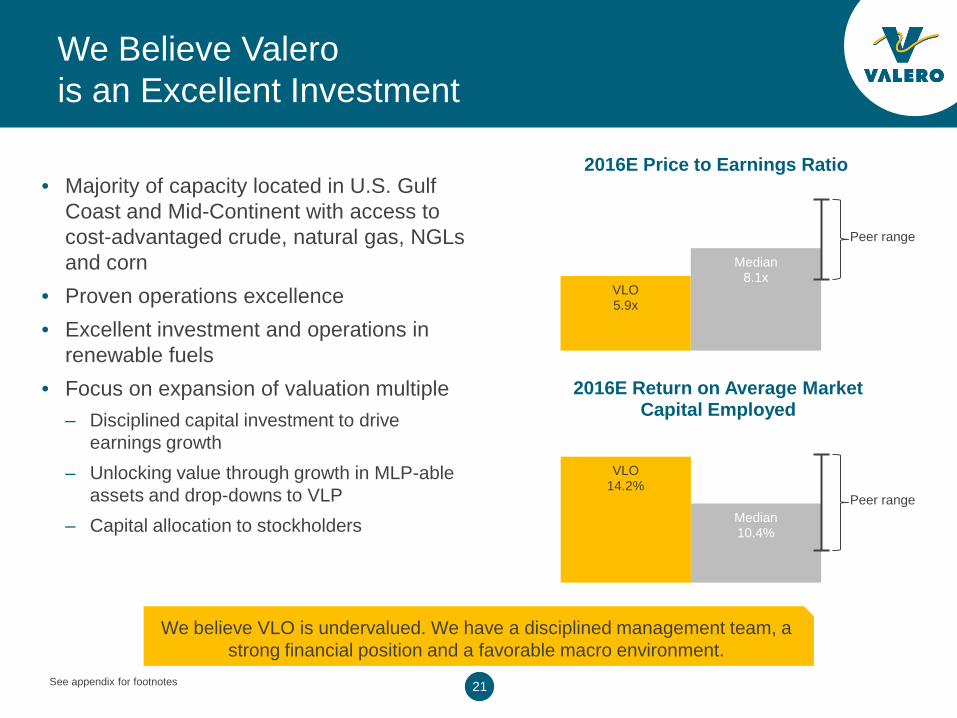
VLO 14.2%
Median 10.4%
2016E Return on Average Market Capital Employed
VLO 5.9x
Median 8.1x
2016E Price to Earnings Ratio
We Believe Valero is an Excellent Investment
• Majority of capacity located in U.S. Gulf Coast and Mid-Continent with access to cost-advantaged crude, natural gas, NGLs and corn
• Proven operations excellence • Excellent investment and operations in
renewable fuels • Focus on expansion of valuation multiple
– Disciplined capital investment to drive earnings growth
– Unlocking value through growth in MLP-able assets and drop-downs to VLP
– Capital allocation to stockholders
We believe VLO is undervalued. We have a disciplined management team, a strong financial position and a favorable macro environment.
See appendix for footnotes
Peer range
Peer range
22
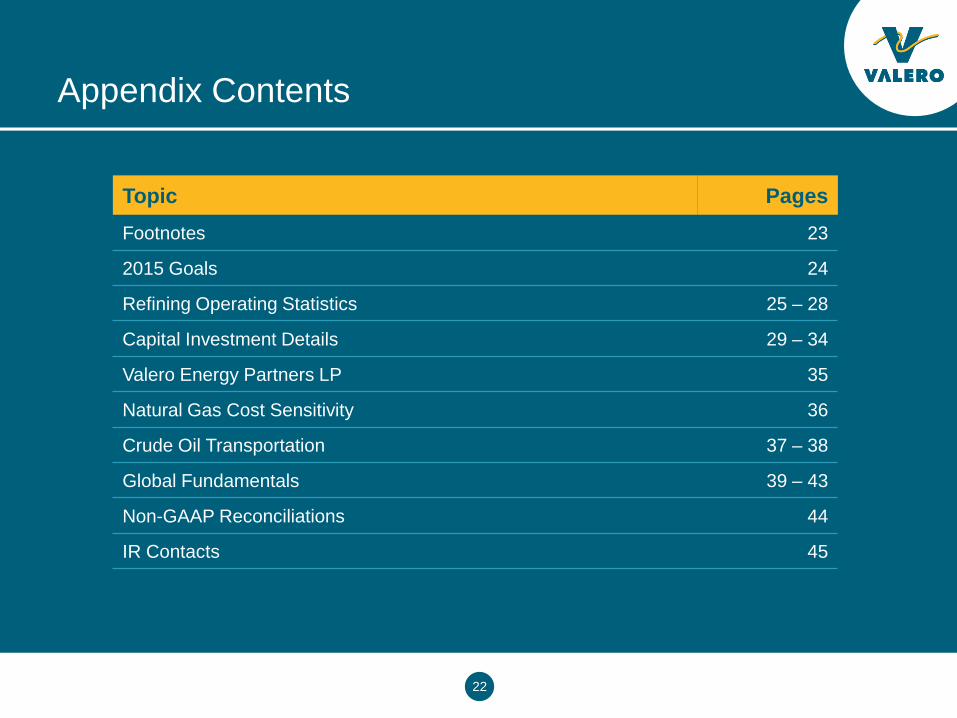
Appendix Contents
Topic Pages Footnotes 23
2015 Goals 24
Refining Operating Statistics 25 – 28
Capital Investment Details 29 – 34
Valero Energy Partners LP 35
Natural Gas Cost Sensitivity 36
Crude Oil Transportation 37 – 38
Global Fundamentals 39 – 43
Non-GAAP Reconciliations 44
IR Contacts 45
23
Footnotes
Slide 5
Macro environment themes represent industry consult views, of which points 1, 2, 5, and 6 are supported by additional slides in the presentation.
Slide 7
Contractor recordable incident rate from U.S. Bureau of Labor Statistics. Tier 1 process safety event defined within API Recommended Practice 754. Industry benchmarking and VLO performance statistics from Solomon Associates and Valero.
Slide 8
Nelson Complexity Index for HFC, TSO, and MPC from company presentations. PSX’s Nelson Complexity calculated per Oil and Gas Journal NCI formula based on crude capacities in company 10-K report and process unit capacities in Oil and Gas Journal as of January 1, 2015. Total company NCI is weighted average for refineries.
Product yields from company 10-Q reports and presentations for six months ended June 30, 2015. Clean products defined as gasoline, jet fuel/kerosene, and distillates.
Slide 9
Crude distillation capacities from company 10-K reports and presentations, grouped by geographic location.
Valero’s Gulf Coast feedstock ranges are based upon quarterly processing rates between 1Q10 and 2Q15.
Slide 10
Valero’s potential future gasoline and distillate export capacities are based upon potential expansion opportunities at the St. Charles and Port Arthur refineries.
Slide 11
Refining operating expenses include cash costs and depreciation and amortization from company 10-Q reports for six months ended June 30, 2015. PSX’s refining operating expense per barrel of throughput from analyst reports.
Refining operating income and total product yields from company 10-Q reports for six months ended June 30, 2015. PSX’s refining operating income approximated as segment net income from company 10-Q with a 50% allocation of interest and debt expense and an assumed income tax of 35%.
Slide 21
Source for price to earnings ratios and returns on average market capital employed (ROMC) is Barclays. 2016 estimated ROMC defined as (tax effected operating and other income) / (average of 2016 and 2015 market capital employed), where market capital employed is calculated as (year-end share price * shares outstanding) + total debt. Prices as of August 28, 2015 market close.
24
Key Goals Expected in 2015
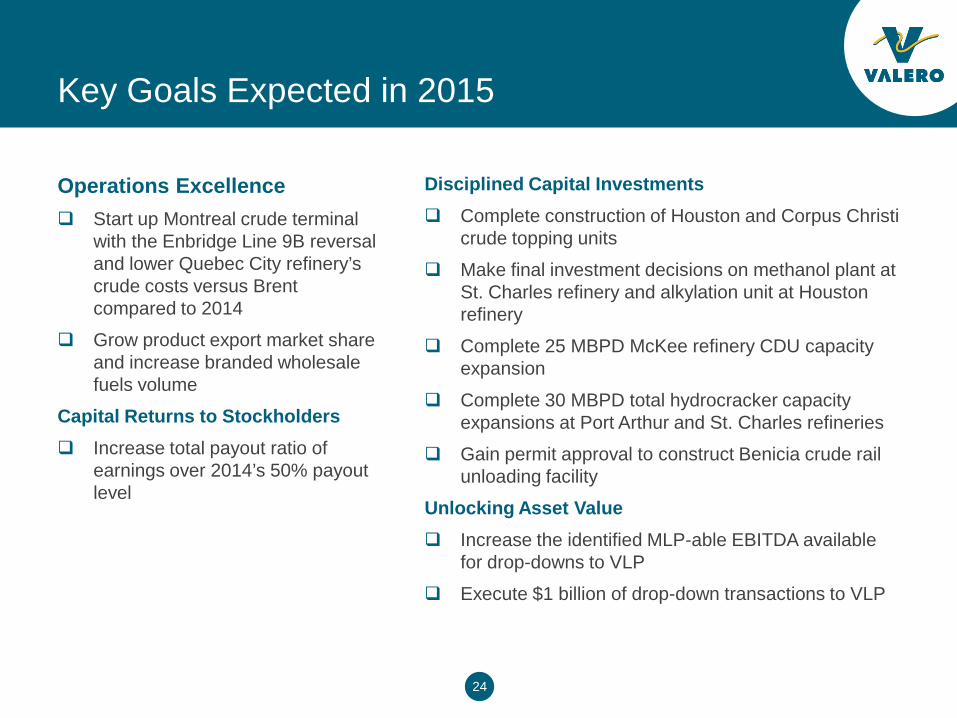
Operations Excellence Start up Montreal crude terminal
with the Enbridge Line 9B reversal and lower Quebec City refinery’s crude costs versus Brent compared to 2014
Grow product export market share and increase branded wholesale fuels volume
Capital Returns to Stockholders Increase total payout ratio of
earnings over 2014’s 50% payout level
Disciplined Capital Investments Complete construction of Houston and Corpus Christi
crude topping units
Make final investment decisions on methanol plant at St. Charles refinery and alkylation unit at Houston refinery
Complete 25 MBPD McKee refinery CDU capacity expansion
Complete 30 MBPD total hydrocracker capacity expansions at Port Arthur and St. Charles refineries
Gain permit approval to construct Benicia crude rail unloading facility
Unlocking Asset Value Increase the identified MLP-able EBITDA available
for drop-downs to VLP
Execute $1 billion of drop-down transactions to VLP
25
Our Refining Capacity and Nelson Complexity
Refinery
Capacities (MBPD) Nelson Complexity
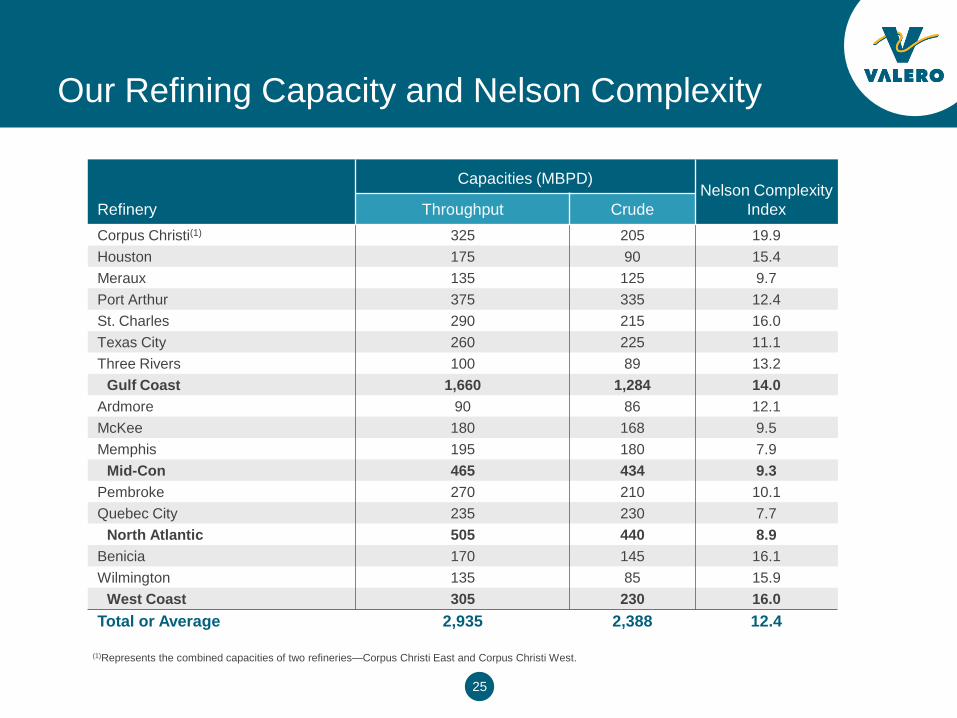
Index Throughput Crude Corpus Christi(1) 325 205 19.9 Houston 175 90 15.4 Meraux 135 125 9.7 Port Arthur 375 335 12.4 St. Charles 290 215 16.0 Texas City 260 225 11.1 Three Rivers 100 89 13.2
Gulf Coast 1,660 1,284 14.0 Ardmore 90 86 12.1 McKee 180 168 9.5 Memphis 195 180 7.9
Mid-Con 465 434 9.3 Pembroke 270 210 10.1 Quebec City 235 230 7.7
North Atlantic 505 440 8.9 Benicia 170 145 16.1 Wilmington 135 85 15.9
West Coast 305 230 16.0 Total or Average 2,935 2,388 12.4
(1)Represents the combined capacities of two refineries—Corpus Christi East and Corpus Christi West.
26
Reliability Initiatives Have Improved Refinery Availability and Enabled Higher Utilization
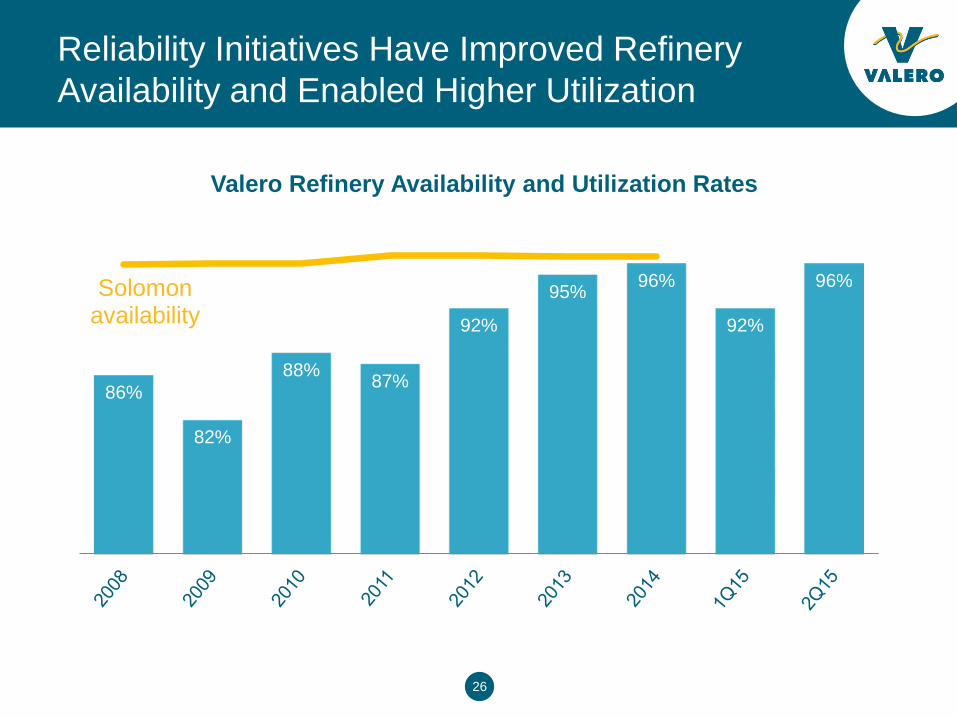
86%
82%
88% 87%
92%
95% 96%
92%
96% Solomon availability
Valero Refinery Availability and Utilization Rates
27
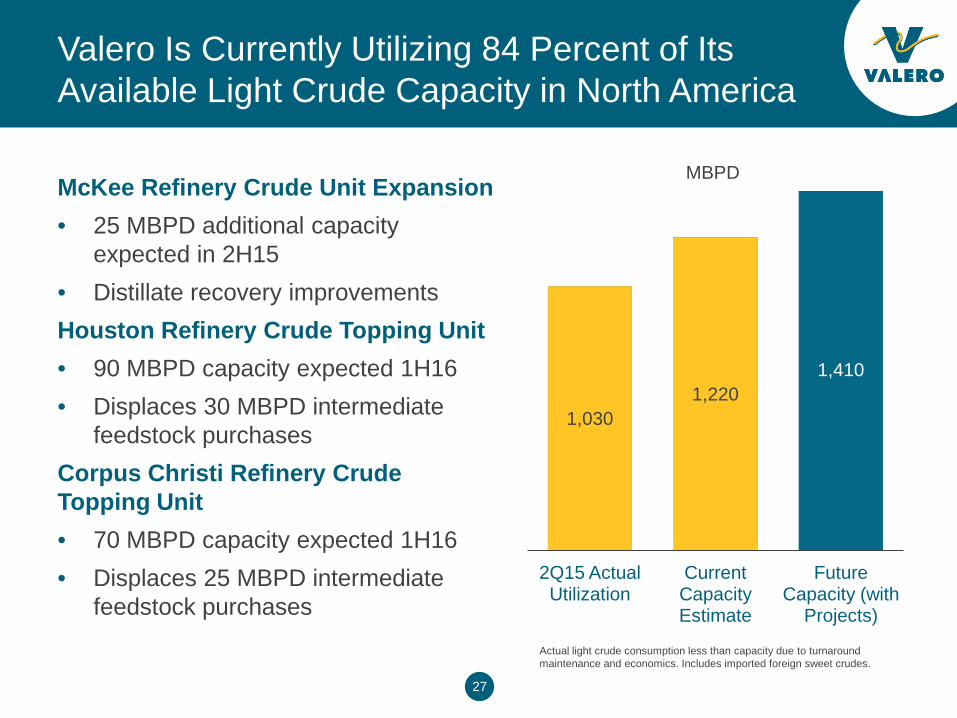
Valero Is Currently Utilizing 84 Percent of Its Available Light Crude Capacity in North America
McKee Refinery Crude Unit Expansion • 25 MBPD additional capacity
expected in 2H15 • Distillate recovery improvements Houston Refinery Crude Topping Unit • 90 MBPD capacity expected 1H16 • Displaces 30 MBPD intermediate
feedstock purchases Corpus Christi Refinery Crude Topping Unit • 70 MBPD capacity expected 1H16 • Displaces 25 MBPD intermediate
feedstock purchases Actual light crude consumption less than capacity due to turnaround maintenance and economics. Includes imported foreign sweet crudes.
1,030 1,220
1,410
2Q15 Actual Utilization
Current Capacity Estimate
Future Capacity (with
Projects)
MBPD
28
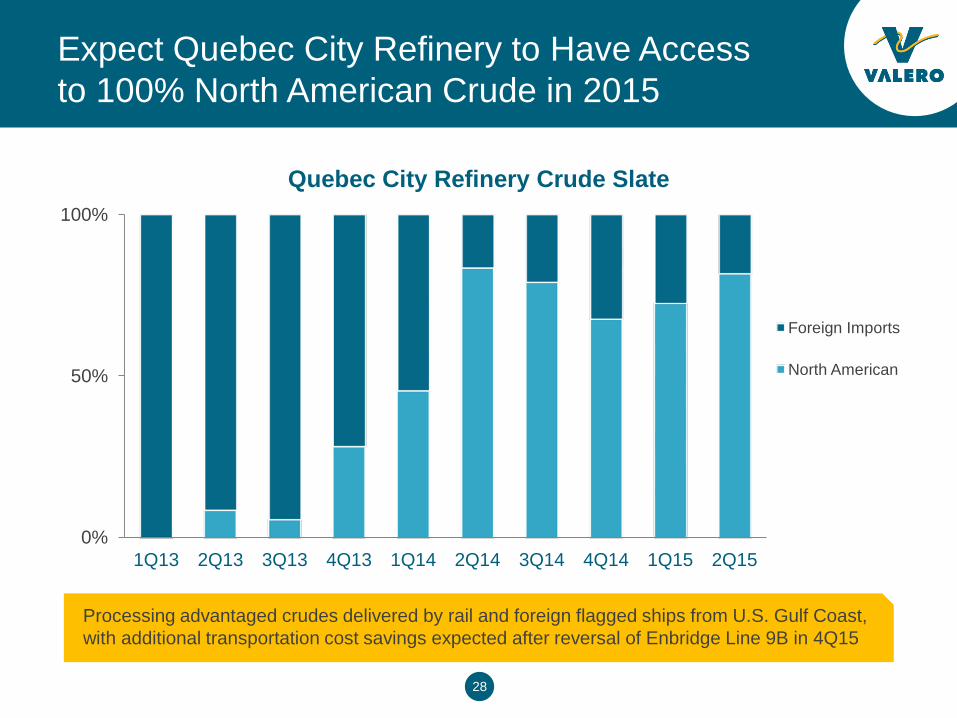
0%
50%
100%
1Q13 2Q13 3Q13 4Q13 1Q14 2Q14 3Q14 4Q14 1Q15 2Q15
Quebec City Refinery Crude Slate
Foreign Imports
North American
Expect Quebec City Refinery to Have Access to 100% North American Crude in 2015
Processing advantaged crudes delivered by rail and foreign flagged ships from U.S. Gulf Coast, with additional transportation cost savings expected after reversal of Enbridge Line 9B in 4Q15
29
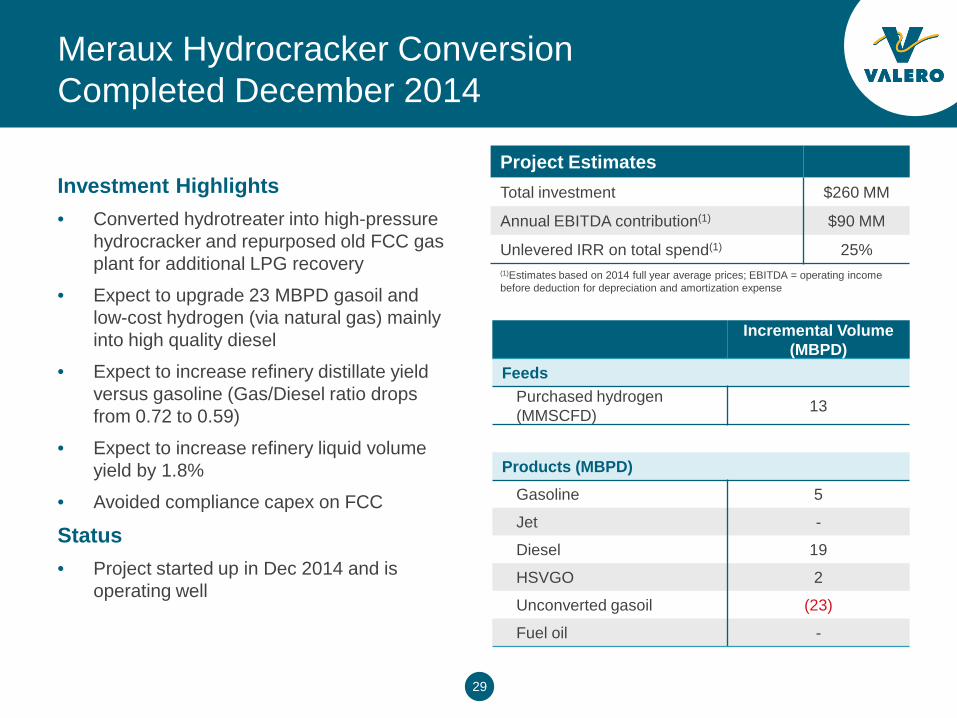
Meraux Hydrocracker Conversion Completed December 2014
Investment Highlights • Converted hydrotreater into high-pressure
hydrocracker and repurposed old FCC gas plant for additional LPG recovery
• Expect to upgrade 23 MBPD gasoil and low-cost hydrogen (via natural gas) mainly into high quality diesel
• Expect to increase refinery distillate yield versus gasoline (Gas/Diesel ratio drops from 0.72 to 0.59)
• Expect to increase refinery liquid volume yield by 1.8%
• Avoided compliance capex on FCC
Status • Project started up in Dec 2014 and is
operating well
Incremental Volume (MBPD)
Feeds Purchased hydrogen (MMSCFD) 13
Products (MBPD) Gasoline 5
Jet -
Diesel 19
HSVGO 2
Unconverted gasoil (23)
Fuel oil -
Project Estimates
Total investment $260 MM
Annual EBITDA contribution(1) $90 MM
Unlevered IRR on total spend(1) 25% (1)Estimates based on 2014 full year average prices; EBITDA = operating income before deduction for depreciation and amortization expense
30
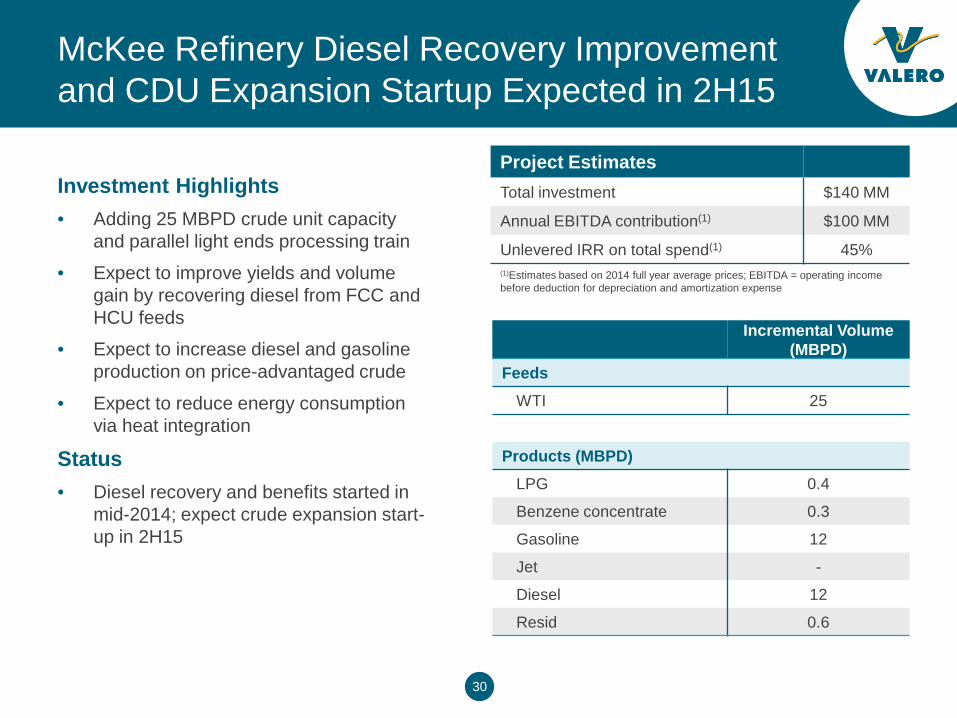
McKee Refinery Diesel Recovery Improvement and CDU Expansion Startup Expected in 2H15
Investment Highlights • Adding 25 MBPD crude unit capacity
and parallel light ends processing train
• Expect to improve yields and volume gain by recovering diesel from FCC and HCU feeds
• Expect to increase diesel and gasoline production on price-advantaged crude
• Expect to reduce energy consumption via heat integration
Status • Diesel recovery and benefits started in
mid-2014; expect crude expansion start-up in 2H15
Incremental Volume (MBPD)
Feeds WTI 25
Products (MBPD) LPG 0.4
Benzene concentrate 0.3
Gasoline 12
Jet -
Diesel 12
Resid 0.6
Project Estimates
Total investment $140 MM
Annual EBITDA contribution(1) $100 MM
Unlevered IRR on total spend(1) 45% (1)Estimates based on 2014 full year average prices; EBITDA = operating income before deduction for depreciation and amortization expense
31
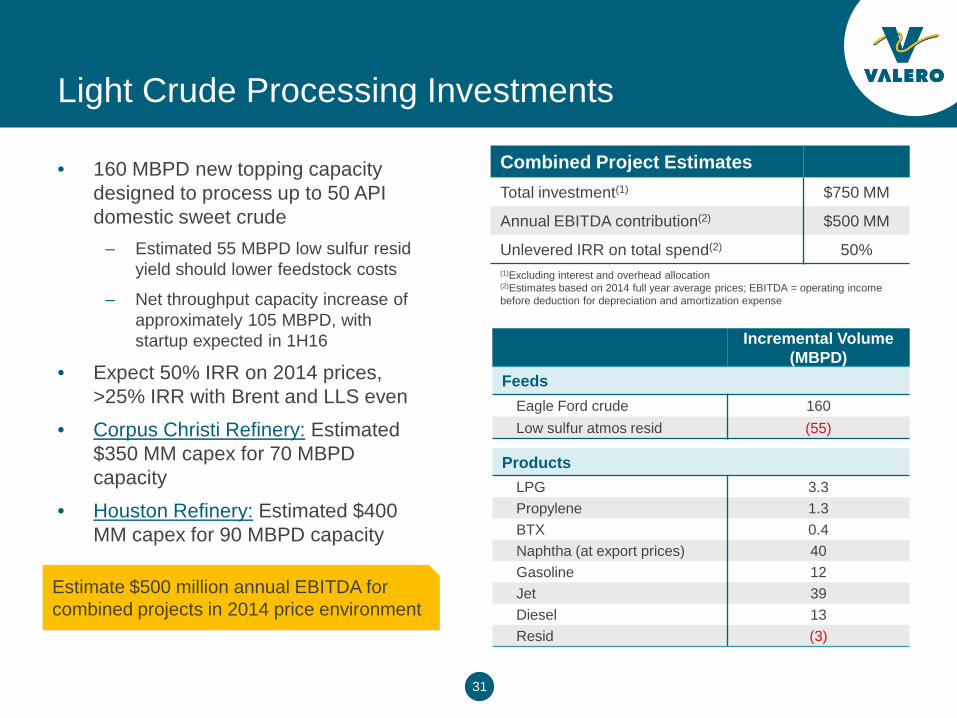
Light Crude Processing Investments
• 160 MBPD new topping capacity designed to process up to 50 API domestic sweet crude
– Estimated 55 MBPD low sulfur resid yield should lower feedstock costs
– Net throughput capacity increase of approximately 105 MBPD, with startup expected in 1H16
• Expect 50% IRR on 2014 prices, >25% IRR with Brent and LLS even
• Corpus Christi Refinery: Estimated $350 MM capex for 70 MBPD capacity
• Houston Refinery: Estimated $400 MM capex for 90 MBPD capacity
Estimate $500 million annual EBITDA for combined projects in 2014 price environment
Incremental Volume (MBPD)
Feeds Eagle Ford crude 160 Low sulfur atmos resid (55)
Products LPG 3.3 Propylene 1.3 BTX 0.4 Naphtha (at export prices) 40 Gasoline 12 Jet 39 Diesel 13 Resid (3)
Combined Project Estimates
Total investment(1) $750 MM
Annual EBITDA contribution(2) $500 MM
Unlevered IRR on total spend(2) 50% (1)Excluding interest and overhead allocation (2)Estimates based on 2014 full year average prices; EBITDA = operating income before deduction for depreciation and amortization expense
32
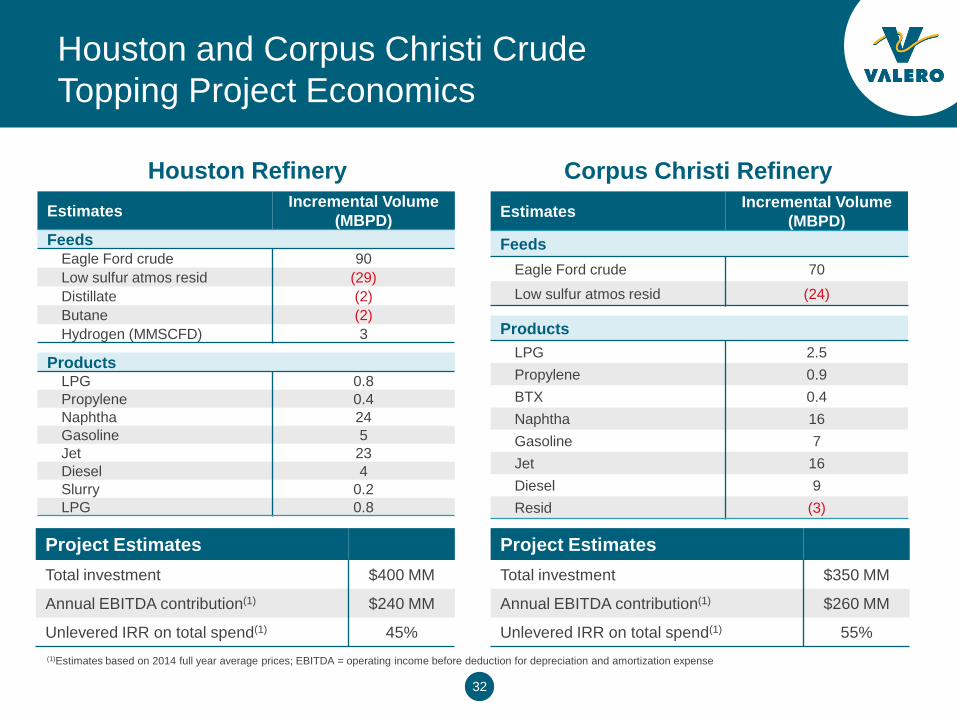
Houston and Corpus Christi Crude Topping Project Economics
Corpus Christi Refinery Houston Refinery
(1)Estimates based on 2014 full year average prices; EBITDA = operating income before deduction for depreciation and amortization expense
Project Estimates
Total investment $400 MM
Annual EBITDA contribution(1) $240 MM
Unlevered IRR on total spend(1) 45%
Project Estimates
Total investment $350 MM
Annual EBITDA contribution(1) $260 MM
Unlevered IRR on total spend(1) 55%
Estimates Incremental Volume (MBPD)
Feeds Eagle Ford crude 90 Low sulfur atmos resid (29) Distillate (2) Butane (2) Hydrogen (MMSCFD) 3
Products LPG 0.8 Propylene 0.4 Naphtha 24 Gasoline 5 Jet 23 Diesel 4 Slurry 0.2 LPG 0.8
Estimates Incremental Volume (MBPD)
Feeds Eagle Ford crude 70
Low sulfur atmos resid (24)
Products LPG 2.5 Propylene 0.9 BTX 0.4 Naphtha 16 Gasoline 7 Jet 16 Diesel 9 Resid (3)
33
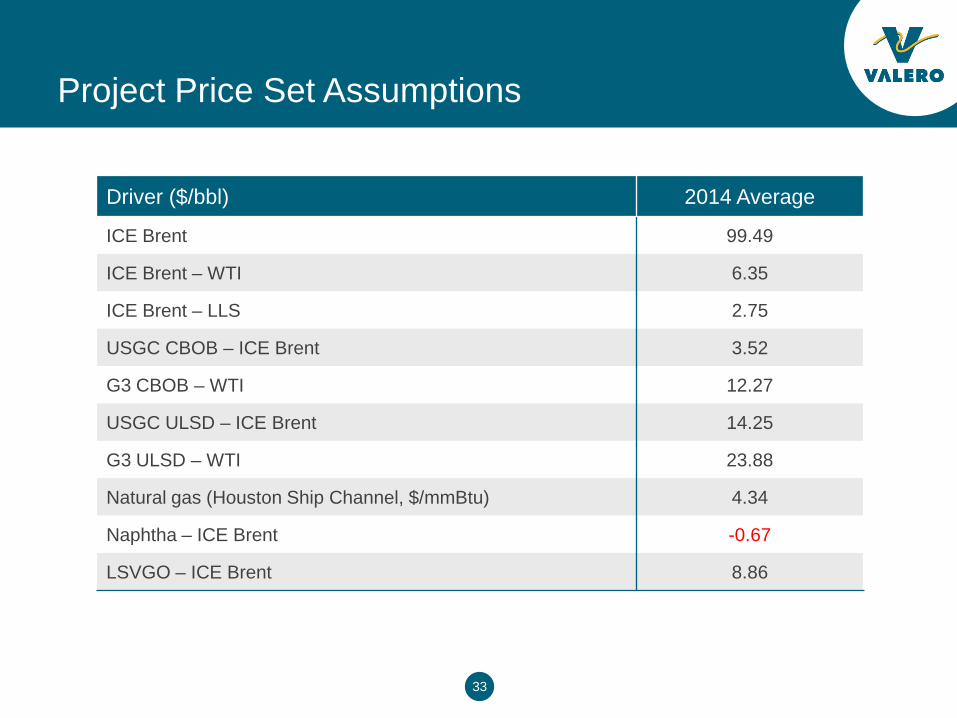
Project Price Set Assumptions
Driver ($/bbl) 2014 Average
ICE Brent 99.49
ICE Brent – WTI 6.35
ICE Brent – LLS 2.75
USGC CBOB – ICE Brent 3.52
G3 CBOB – WTI 12.27
USGC ULSD – ICE Brent 14.25
G3 ULSD – WTI 23.88
Natural gas (Houston Ship Channel, $/mmBtu) 4.34
Naphtha – ICE Brent -0.67
LSVGO – ICE Brent 8.86
34
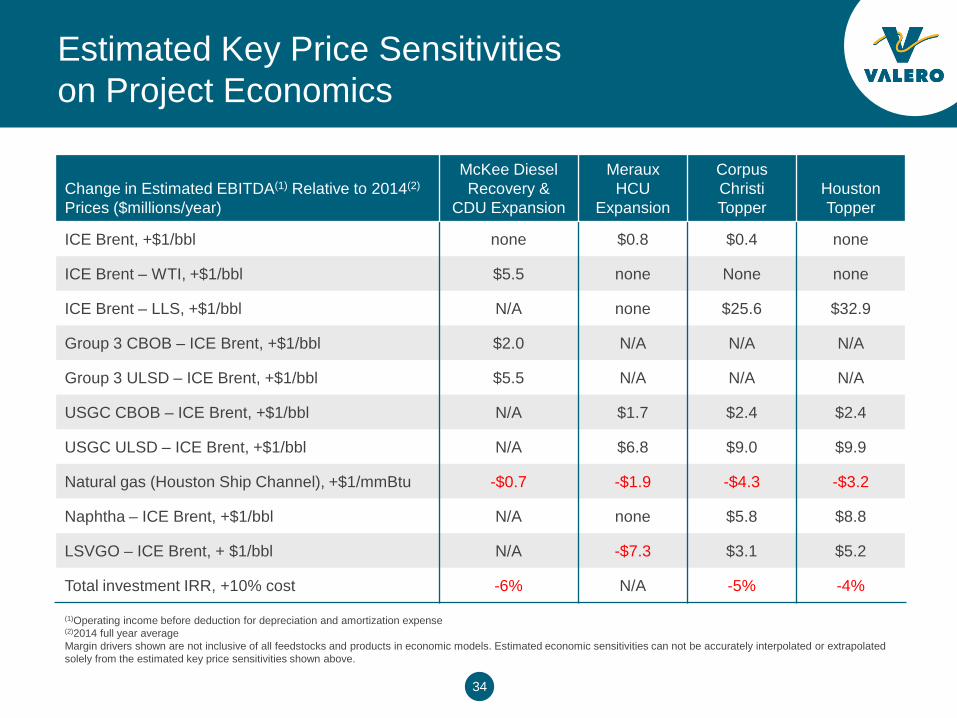
Estimated Key Price Sensitivities on Project Economics
Change in Estimated EBITDA(1) Relative to 2014(2) Prices ($millions/year)
McKee Diesel Recovery &
CDU Expansion
Meraux HCU
Expansion
Corpus Christi Topper
Houston Topper
ICE Brent, +$1/bbl none $0.8 $0.4 none
ICE Brent – WTI, +$1/bbl $5.5 none None none
ICE Brent – LLS, +$1/bbl N/A none $25.6 $32.9
Group 3 CBOB – ICE Brent, +$1/bbl $2.0 N/A N/A N/A
Group 3 ULSD – ICE Brent, +$1/bbl $5.5 N/A N/A N/A
USGC CBOB – ICE Brent, +$1/bbl N/A $1.7 $2.4 $2.4
USGC ULSD – ICE Brent, +$1/bbl N/A $6.8 $9.0 $9.9
Natural gas (Houston Ship Channel), +$1/mmBtu -$0.7 -$1.9 -$4.3 -$3.2
Naphtha – ICE Brent, +$1/bbl N/A none $5.8 $8.8
LSVGO – ICE Brent, + $1/bbl N/A -$7.3 $3.1 $5.2
Total investment IRR, +10% cost -6% N/A -5% -4%
(1)Operating income before deduction for depreciation and amortization expense (2)2014 full year average Margin drivers shown are not inclusive of all feedstocks and products in economic models. Estimated economic sensitivities can not be accurately interpolated or extrapolated solely from the estimated key price sensitivities shown above.
35
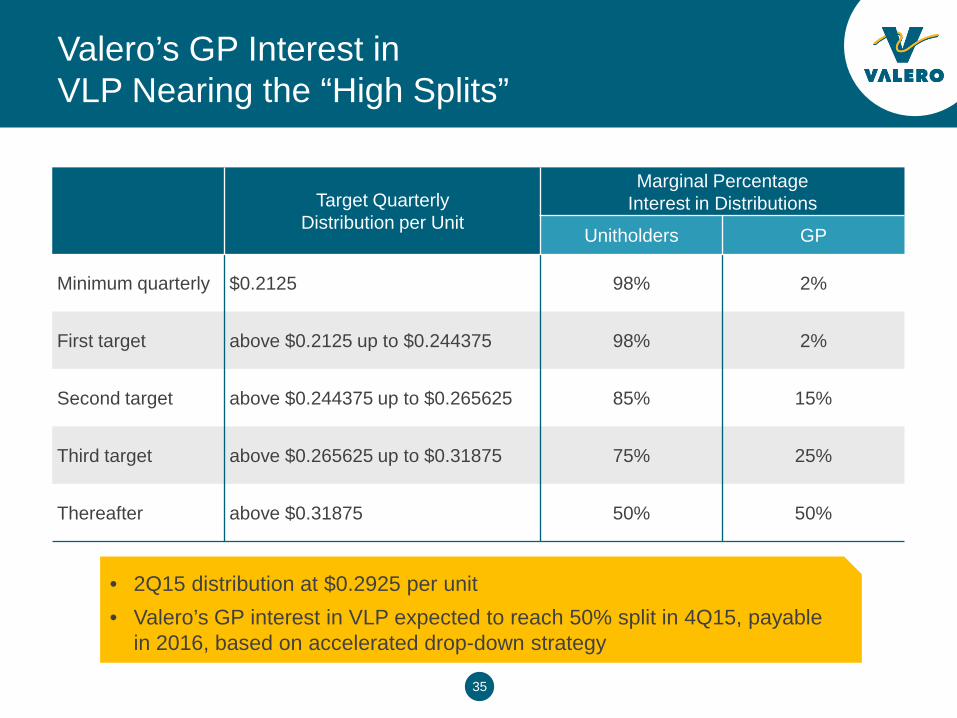
Valero’s GP Interest in VLP Nearing the “High Splits”
Target Quarterly Distribution per Unit
Marginal Percentage Interest in Distributions
Unitholders GP
Minimum quarterly $0.2125 98% 2%
First target above $0.2125 up to $0.244375 98% 2%
Second target above $0.244375 up to $0.265625 85% 15%
Third target above $0.265625 up to $0.31875 75% 25%
Thereafter above $0.31875 50% 50%
• 2Q15 distribution at $0.2925 per unit • Valero’s GP interest in VLP expected to reach 50% split in 4Q15, payable
in 2016, based on accelerated drop-down strategy
36
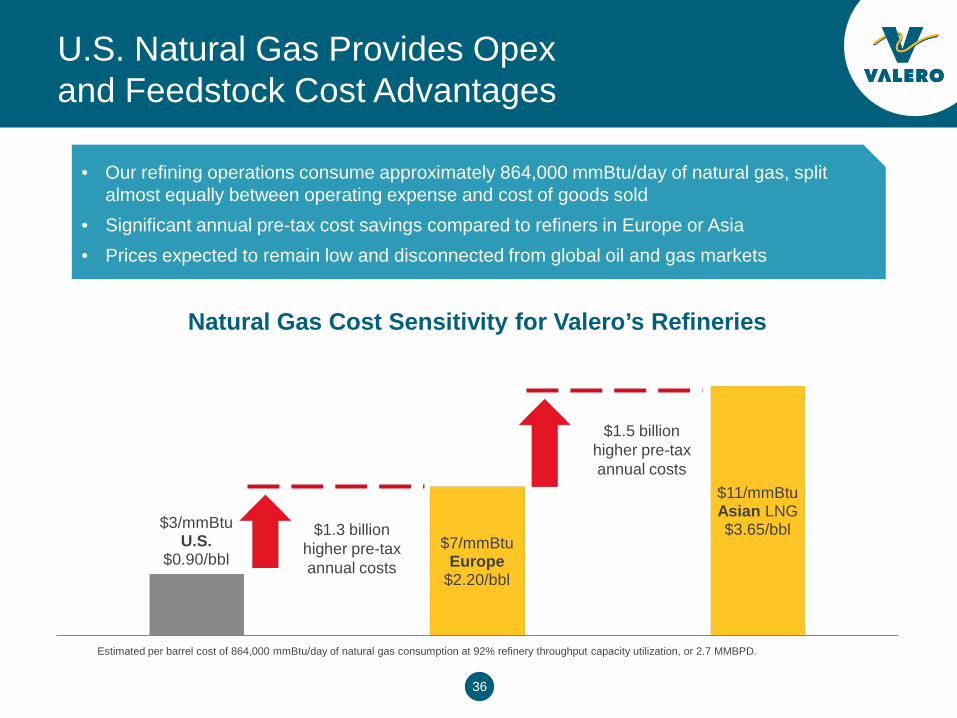
$3/mmBtu U.S.
$0.90/bbl $7/mmBtu
Europe $2.20/bbl
$11/mmBtu Asian LNG $3.65/bbl
Natural Gas Cost Sensitivity for Valero’s Refineries
U.S. Natural Gas Provides Opex and Feedstock Cost Advantages
Estimated per barrel cost of 864,000 mmBtu/day of natural gas consumption at 92% refinery throughput capacity utilization, or 2.7 MMBPD.
$1.3 billion higher pre-tax annual costs
$1.5 billion higher pre-tax annual costs
• Our refining operations consume approximately 864,000 mmBtu/day of natural gas, split almost equally between operating expense and cost of goods sold
• Significant annual pre-tax cost savings compared to refiners in Europe or Asia • Prices expected to remain low and disconnected from global oil and gas markets
37
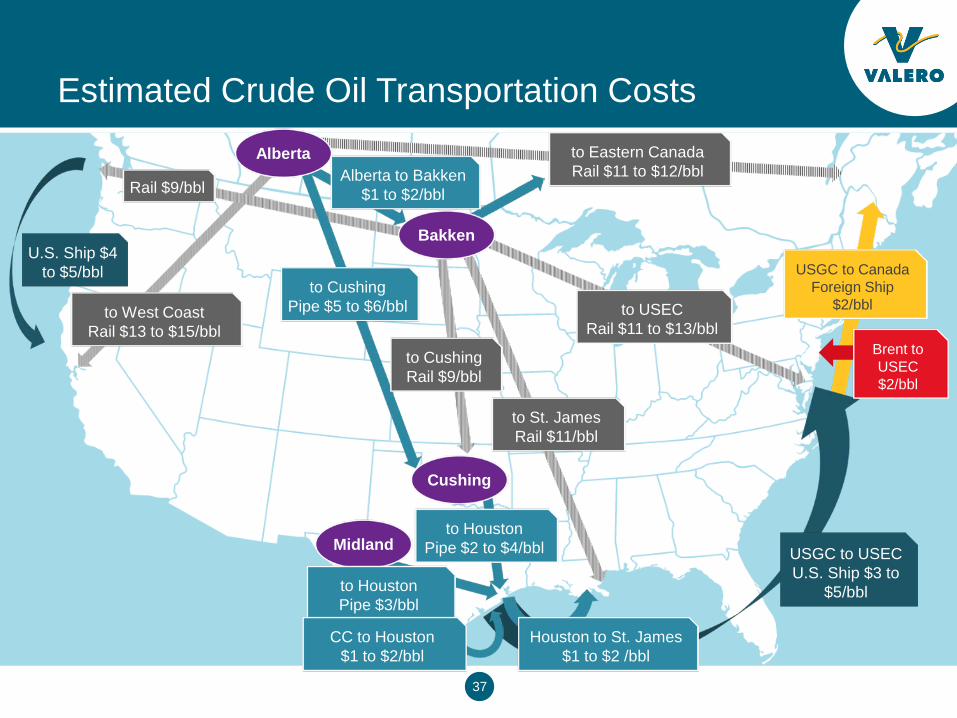
Estimated Crude Oil Transportation Costs
to Houston Pipe $2 to $4/bbl USGC to USEC
U.S. Ship $3 to $5/bbl
USGC to Canada Foreign Ship
$2/bbl
U.S. Ship $4 to $5/bbl
Brent to USEC $2/bbl
to USEC Rail $11 to $13/bbl
to St. James Rail $11/bbl
Cushing
Midland
to Houston Pipe $3/bbl
CC to Houston $1 to $2/bbl
Houston to St. James $1 to $2 /bbl
to West Coast Rail $13 to $15/bbl
Alberta to Bakken $1 to $2/bbl Rail $9/bbl
Alberta to Eastern Canada Rail $11 to $12/bbl
Bakken
to Cushing Rail $9/bbl
to Cushing Pipe $5 to $6/bbl
38
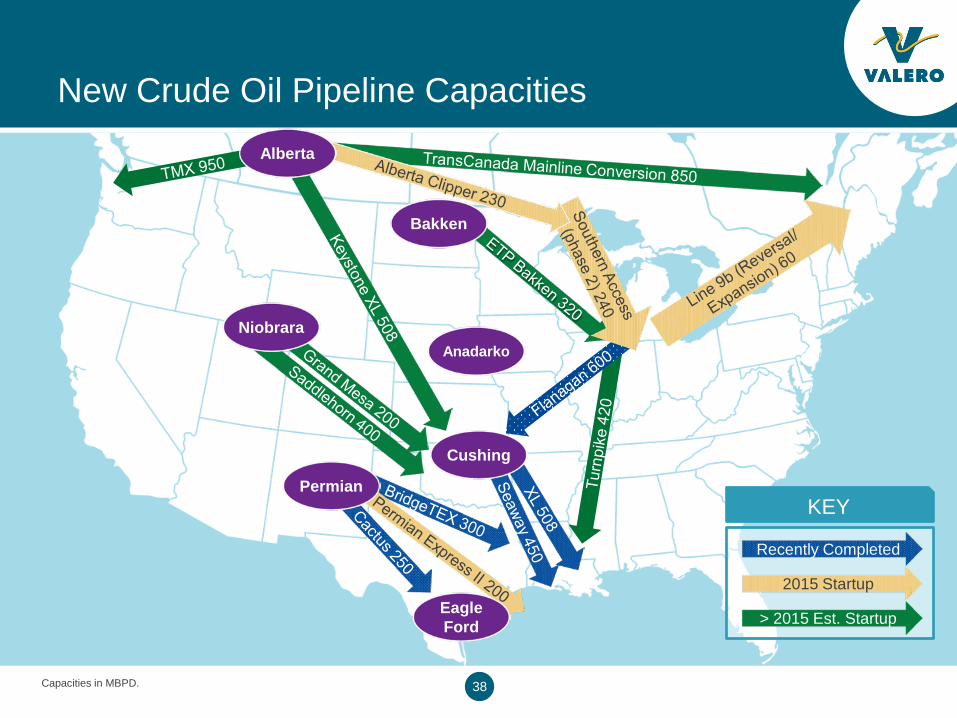
KEY
New Crude Oil Pipeline Capacities
Anadarko Niobrara
Eagle Ford
Permian
Cushing
Alberta
Bakken
Recently Completed
2015 Startup
> 2015 Est. Startup
Capacities in MBPD.
39
Net 0.8
Net 1.5
Net 1.4
-2.5
-1.5
-0.5
0.5
1.5
2.5
3.5
2005 2006 2007 2008 2009 2010 2011 2012 2013 2014 2015E 2016E
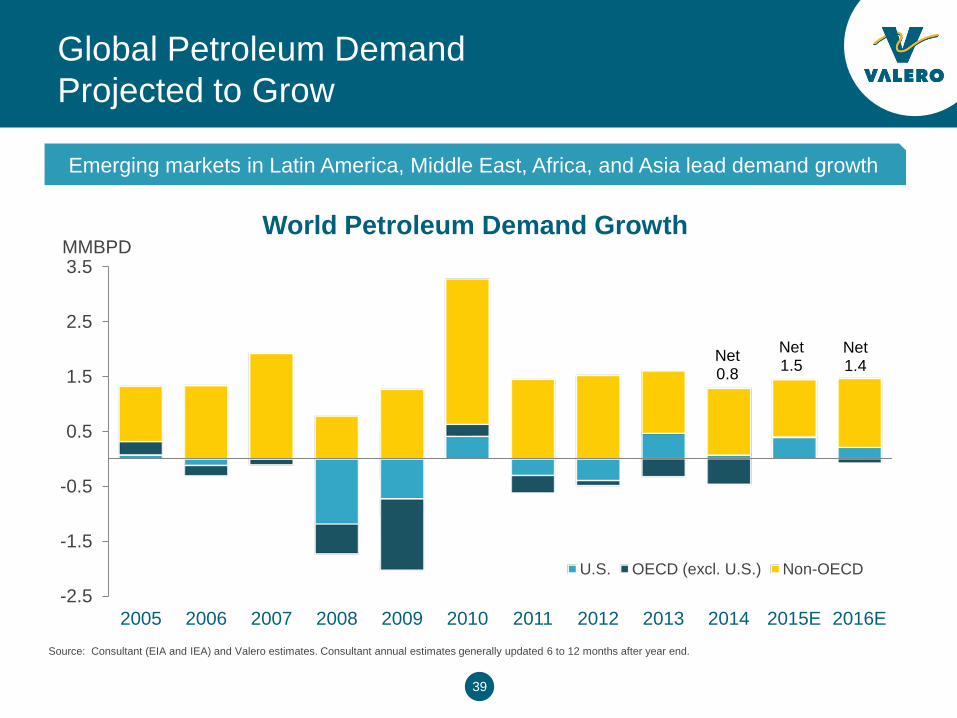
MMBPD World Petroleum Demand Growth
U.S. OECD (excl. U.S.) Non-OECD
Global Petroleum Demand Projected to Grow
Source: Consultant (EIA and IEA) and Valero estimates. Consultant annual estimates generally updated 6 to 12 months after year end.
Emerging markets in Latin America, Middle East, Africa, and Asia lead demand growth
40
0.85 0.70
0.98 0.91 0.96
-0.4
0.0
0.4
0.8
1.2
2015 2016 2017 2018 2019
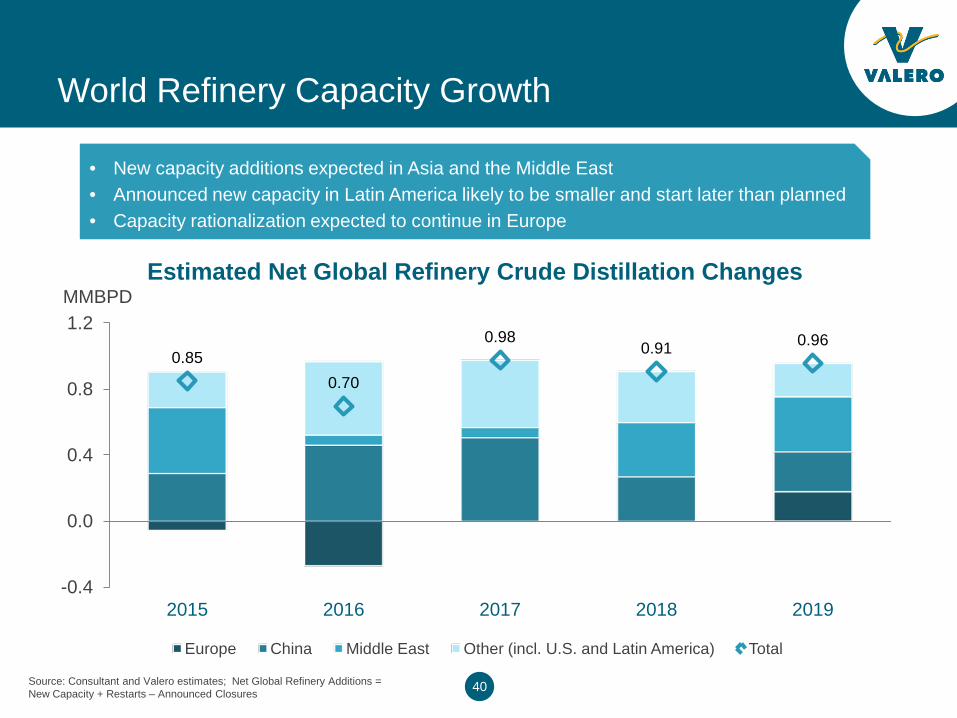
MMBPD Estimated Net Global Refinery Crude Distillation Changes
Europe China Middle East Other (incl. U.S. and Latin America) Total
World Refinery Capacity Growth
• New capacity additions expected in Asia and the Middle East • Announced new capacity in Latin America likely to be smaller and start later than planned • Capacity rationalization expected to continue in Europe
Source: Consultant and Valero estimates; Net Global Refinery Additions = New Capacity + Restarts – Announced Closures
41
0
100
200
300
400
500
600
700
800
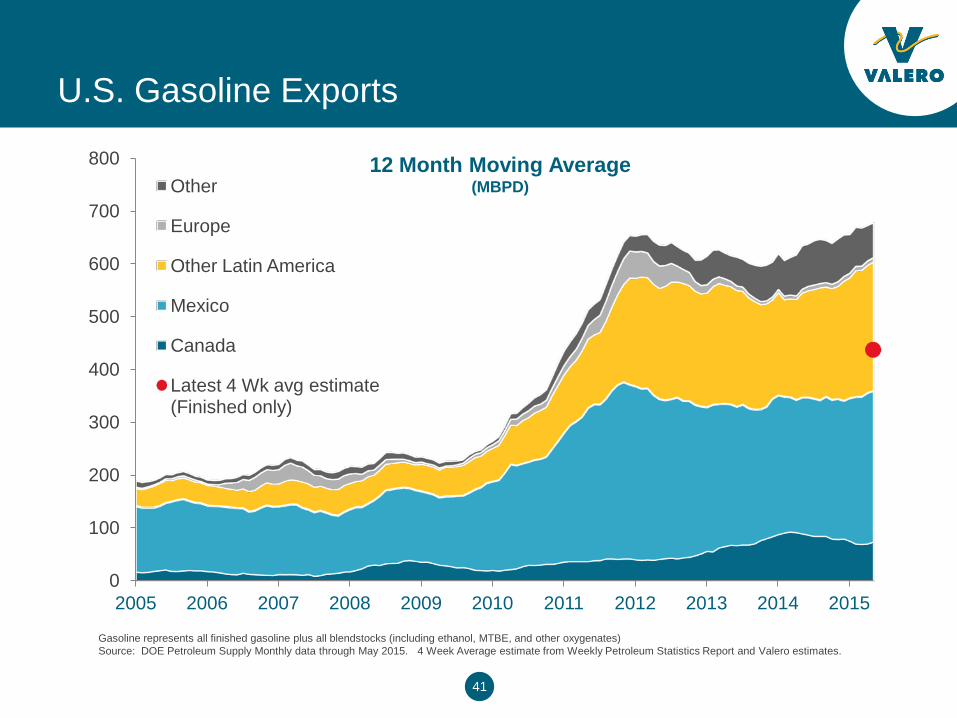
2005 2006 2007 2008 2009 2010 2011 2012 2013 2014 2015
Other
Europe
Other Latin America
Mexico
Canada
Latest 4 Wk avg estimate (Finished only)
12 Month Moving Average (MBPD)
Gasoline represents all finished gasoline plus all blendstocks (including ethanol, MTBE, and other oxygenates) Source: DOE Petroleum Supply Monthly data through May 2015. 4 Week Average estimate from Weekly Petroleum Statistics Report and Valero estimates.
U.S. Gasoline Exports
42
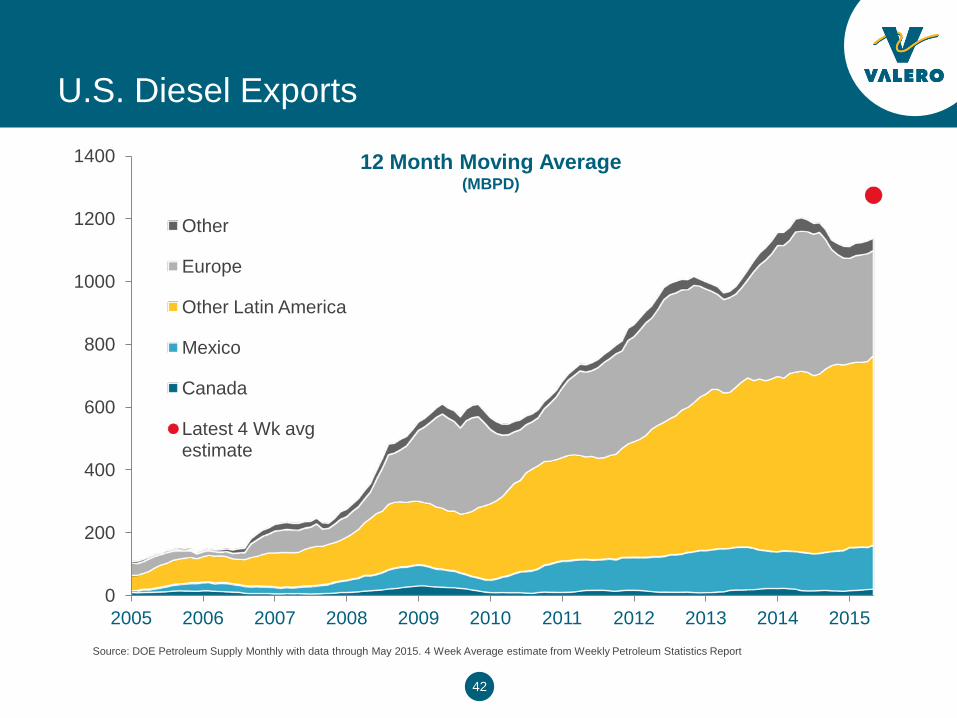
Source: DOE Petroleum Supply Monthly with data through May 2015. 4 Week Average estimate from Weekly Petroleum Statistics Report
U.S. Diesel Exports
0
200
400
600
800
1000
1200
1400
2005 2006 2007 2008 2009 2010 2011 2012 2013 2014 2015
Other
Europe
Other Latin America
Mexico
Canada
Latest 4 Wk avg estimate
12 Month Moving Average (MBPD)
43
-3,000
-2,500
-2,000
-1,500
-1,000
-500
0
500
1,000
1,500
2,000
2005 2006 2007 2008 2009 2010 2011 2012 2013 2014 2015
Other Diesel Gasoline Total
Net
Impo
rts
Net
Exp
orts
MBPD
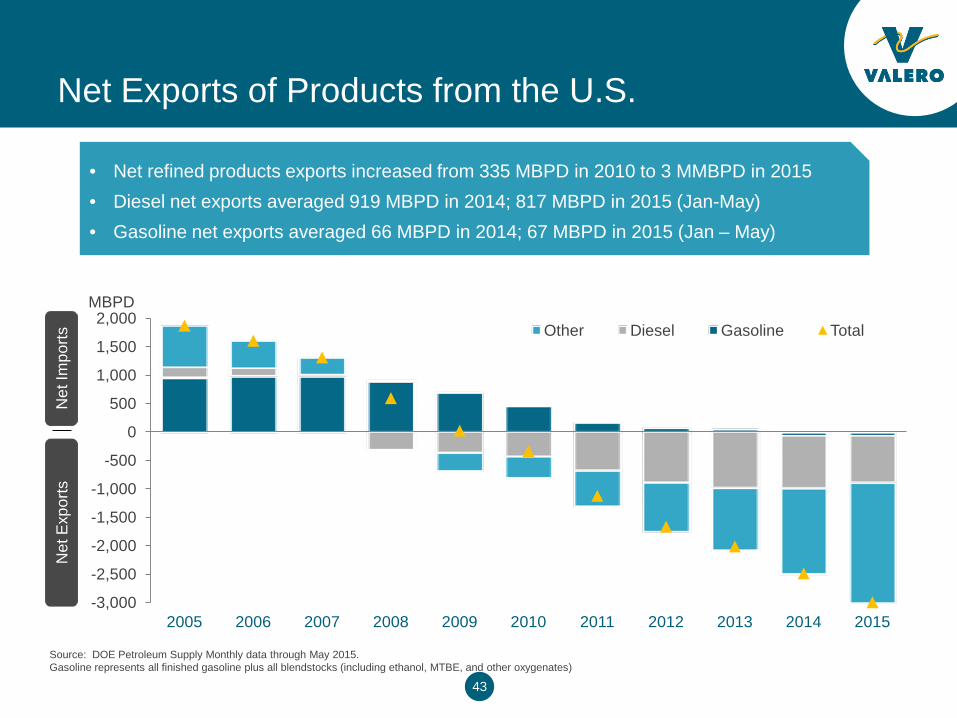
Net Exports of Products from the U.S.
Source: DOE Petroleum Supply Monthly data through May 2015. Gasoline represents all finished gasoline plus all blendstocks (including ethanol, MTBE, and other oxygenates)
• Net refined products exports increased from 335 MBPD in 2010 to 3 MMBPD in 2015 • Diesel net exports averaged 919 MBPD in 2014; 817 MBPD in 2015 (Jan-May) • Gasoline net exports averaged 66 MBPD in 2014; 67 MBPD in 2015 (Jan – May)
44
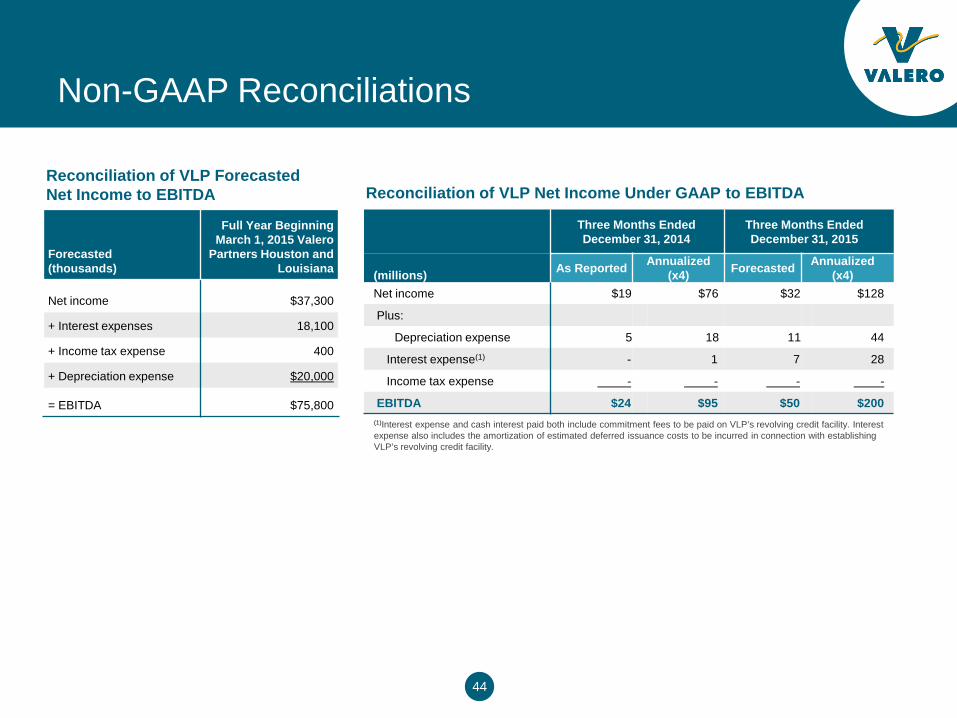
Non-GAAP Reconciliations
Forecasted (thousands)
Full Year Beginning March 1, 2015 Valero
Partners Houston and Louisiana
Net income $37,300
+ Interest expenses 18,100
+ Income tax expense 400
+ Depreciation expense $20,000
= EBITDA $75,800
Reconciliation of VLP Forecasted Net Income to EBITDA
Three Months Ended December 31, 2014
Three Months Ended December 31, 2015
(millions) As Reported Annualized (x4) Forecasted Annualized
(x4) Net income $19 $76 $32 $128
Plus:
Depreciation expense 5 18 11 44
Interest expense(1) - 1 7 28
Income tax expense - - - -
EBITDA $24 $95 $50 $200
Reconciliation of VLP Net Income Under GAAP to EBITDA
(1)Interest expense and cash interest paid both include commitment fees to be paid on VLP’s revolving credit facility. Interest expense also includes the amortization of estimated deferred issuance costs to be incurred in connection with establishing VLP’s revolving credit facility.
45
Investor Relations Contacts
For more information, please contact:
John Locke
Vice President, Investor Relations
210.345.3077
Karen Ngo
Manager, Investor Relations
210.345.4574