Embed Size (px)
Citation preview

TSX:TML
Advancing Toward Production in Ontario
April 2018
www.treasurymetals.com
| TSX:TML

Forward Looking Statements
This presentation contains projections and forward-looking information that involve various risks and uncertainties regarding future events. Such
forward-looking information can include without limitation statements based on current expectations involving a number of risks and uncertainties and
are not guarantees of future performance of the Corporation. These risks and uncertainties could cause actual results and the Corporation’s plans and
objectives to differ materially from those expressed in the forward-looking information. Actual results and future events could differ materially from
anticipated in such information. These and all subsequent written and oral forward-looking information are based on estimates and opinions of
management on the dates they are made and expressly qualified in their entirety by this notice. The Corporation assumes no obligation to update
forward-looking information should circumstances or management’s estimates or opinions change. This presentation contains projections and forward-
looking information that involve various risks and uncertainties regarding future events. Such forward-looking information can include without limitation
statements based on current expectations involving a number of risks and uncertainties and are not guarantees of future performance of the
Corporation. These risks and uncertainties could cause actual results and the Corporation’s plans and objectives to differ materially from those
expressed in the forward-looking information. Actual results and future events could differ materially from anticipated in such information. These and all
subsequent written and oral forward-looking information are based on estimates and opinions of management on the dates they are made and
expressly qualified in their entirety by this notice. The Corporation assumes no obligation to update forward-looking information should circumstances or
management’s estimates or opinions change.
The preliminary economic assessment is preliminary in nature and includes inferred mineral resources that are considered too speculative geologically
to have the economic considerations applied to them that would enable them to be categorized as mineral reserves, and there is no certainty that
the preliminary economic assessment will be realized. Mineral resources that are not mineral reserves do not have demonstrated economic viability.
The 3D Mine visualization images on cover and within this presentation are for illustrative purposes. Images by Cicada Design Inc. were created for
Treasury Metals Inc. and are based on design elements from Goliath Gold Project technical studies.
Technical information in this presentation has been reviewed and approved by Mark Wheeler, P. Eng., and Adam Larsen, P. Geo, who are both
Qualified Persons for the Goliath Gold Project under the definitions established by National Instrument 43-101.
2

Ottawa
Toronto
Treasury Metals – Premier Ontario Gold Developer
3
Advancing the ~100koz/year Goliath Gold
Project towards production
Attractive PEA economics: high grade, low cost
World’s leading mining jurisdiction with excellent
infrastructure – power, highway and skilled
workforce
Significant upside potential with successful step-
out and exploratory drilling
Upcoming catalysts with PFS underway and
active 27,000m drill program
Veteran mine-building Management Team
Thunder Bay

Treasury Metals – Experienced Management Team
Chris Stewart, P.Eng. | President, CEO & Director
• Mining engineer with 25 years of management experience
• Most recently VP Operations at Kirkland Lake Gold, previously played an integral role in the development of Lake Shore’s Timmins Mine and operated Bell Creek Mill as Lake Shore’s VP Operations
Dennis Gibson CPA | CFO
• Over 30 years experience in senior financial positions
• Additionally, CFO of Laramide Resources
Greg Ferron | VP Corporate Development & Investor Relations
• 15 years of capital markets experience in corporate finance, business development and IR
Bob MacDonald | VP Goliath Project
• Over 30 years of engineering experience in the mining industry
• Senior roles at Goldcorp’s Musselwhite Mine, Red Lake operations and Kirkland Lake’s Macassa
4
Marc Henderson, CFA | Chairman
Bill Fisher| Lead Director Doug Bache| Independent Director
Flora Wood| Independent Director
Christophe Vereecke| Independent Director
Blaise Yerly | Independent Director
Management and Investors at the Goliath Gold Project
Board of Directors
Management Team

Capital Markets Snapshot
5
TSX:TML | OTCQX: TSRMF | FSE:TRC
Share Price (February 5, 2018) C$0.55 /share
52 Week High / Low C$0.90 / C$0.50
Shares Outstanding 123,061,498
Warrants (average price $0.74) 16,600,000
Convertible Debentures (average price $0.67)
7,783,000
Options (average price $0.52) 6,500,000
Fully Diluted 146,161,000
Market Capitalization C$67M
Cash Position C$2.0M
Insiders
11%
Institutional
30%
High Net
Worth and
Retail
59%
Europe
45%
Canada
40%
USA
15%
Share Capitalization Ownership Summary Investor Geography
Haywood Securities | Geordie Mark
PI Financial | Phil Ker
Analyst Coverage

Robust Economics and Attractive Valuation
6
Production Metrics Goliath
Total ore processed Mt 9.8 (OP 3.2 & UG 6.6
Average Head Gold
Grade g/t 3.81 (OP 1.6, UG 4.9)
Mill Feed Production
Rate tpd 2,500
LOM Gold Produced oz 1,142,000
Gold recovery (CIL) % 95.5%
Average Annual
Production oz/yr
87,850 Au
(90,000 AuEq)
Mine Life yrs 13
Peak Production oz/yr 111,800 (year 6)
Initial Capital
Expenditures C$M C$133
Cash Costs US$/oz US$525
AISC US$/oz US$611
NPV at US$1,250/oz C$M C$306
IRR at US$1,250/oz % 25%
Robust economics with low costs and attractive grades
$118
$55 $53
$45 $43
$39 $36
$30 $29
$19
Company Harte
Gold
Osisko
Mining Probe Pure Gold Sabina Barkerville
Treasury
Metals Marathon IDM Falco
Mkt Cap
(US$M) $177 $405 $95 $96 $337 $213 $50 $105 $24 $117
Annual
Production 66,000 n/a n/a 66,000 198,000 n/a 90,000 n/a 78,000 236,000
AISC
(US$/oz) $694 n/a n/a $714 $763 n/a $611 n/a $658 $427
EV / Resource Oz - US$36/oz. vs peer average of US$47/oz.
Peer average: $47/oz.
2017 PEA Summary Undervalued Relative to Peers
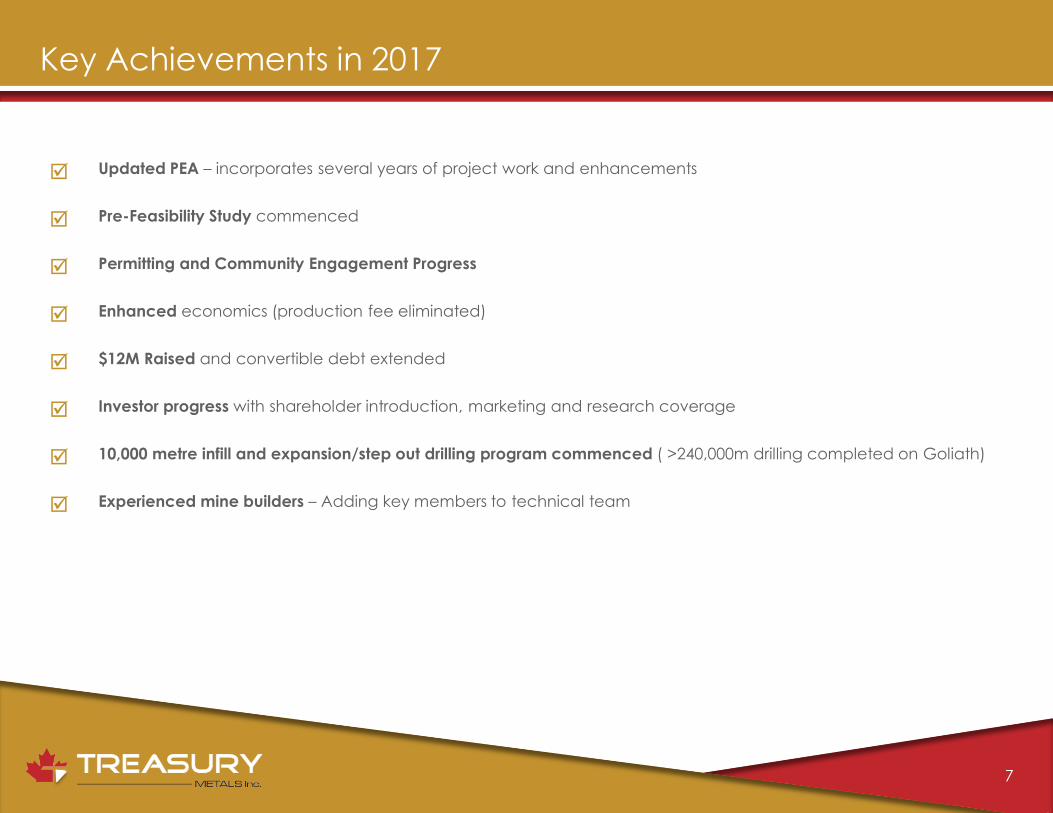
Key Achievements in 2017
7
Updated PEA – incorporates several years of project work and enhancements
Pre-Feasibility Study commenced
Permitting and Community Engagement Progress
Enhanced economics (production fee eliminated)
$12M Raised and convertible debt extended
Investor progress with shareholder introduction, marketing and research coverage
10,000 metre infill and expansion/step out drilling program commenced ( >240,000m drilling completed on Goliath)
Experienced mine builders – Adding key members to technical team
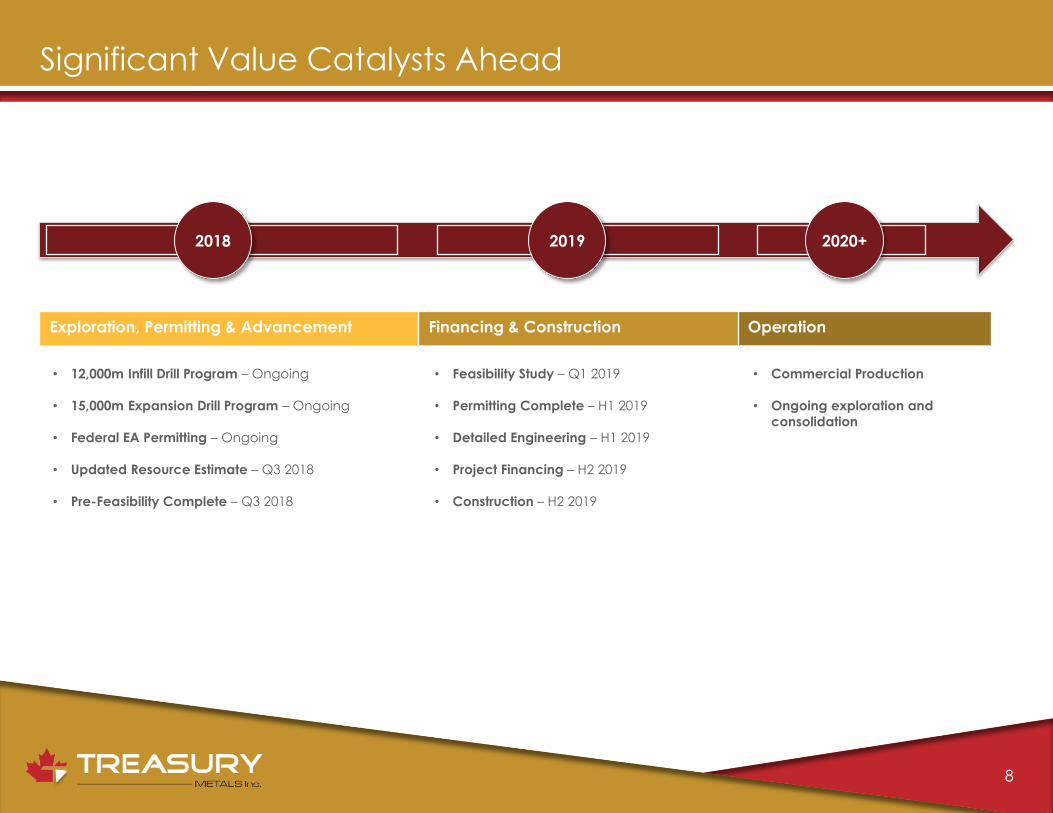
Significant Value Catalysts Ahead
8
2018 2019 2020+
• 12,000m Infill Drill Program – Ongoing
• 15,000m Expansion Drill Program – Ongoing
• Federal EA Permitting – Ongoing
• Updated Resource Estimate – Q3 2018
• Pre-Feasibility Complete – Q3 2018
• Feasibility Study – Q1 2019
• Permitting Complete – H1 2019
• Detailed Engineering – H1 2019
• Project Financing – H2 2019
• Construction – H2 2019
• Commercial Production
• Ongoing exploration and
consolidation
Exploration, Permitting & Advancement Financing & Construction Operation
2018 2019 2020+

TSX:TML
Project Details

Excellent Infrastructure and Access to City of Dryden
Existing Infrastructure
• Local skilled workforce
• Hydro One
• Natural Gas
• Trans-Canada Highway
• CP Rail
10
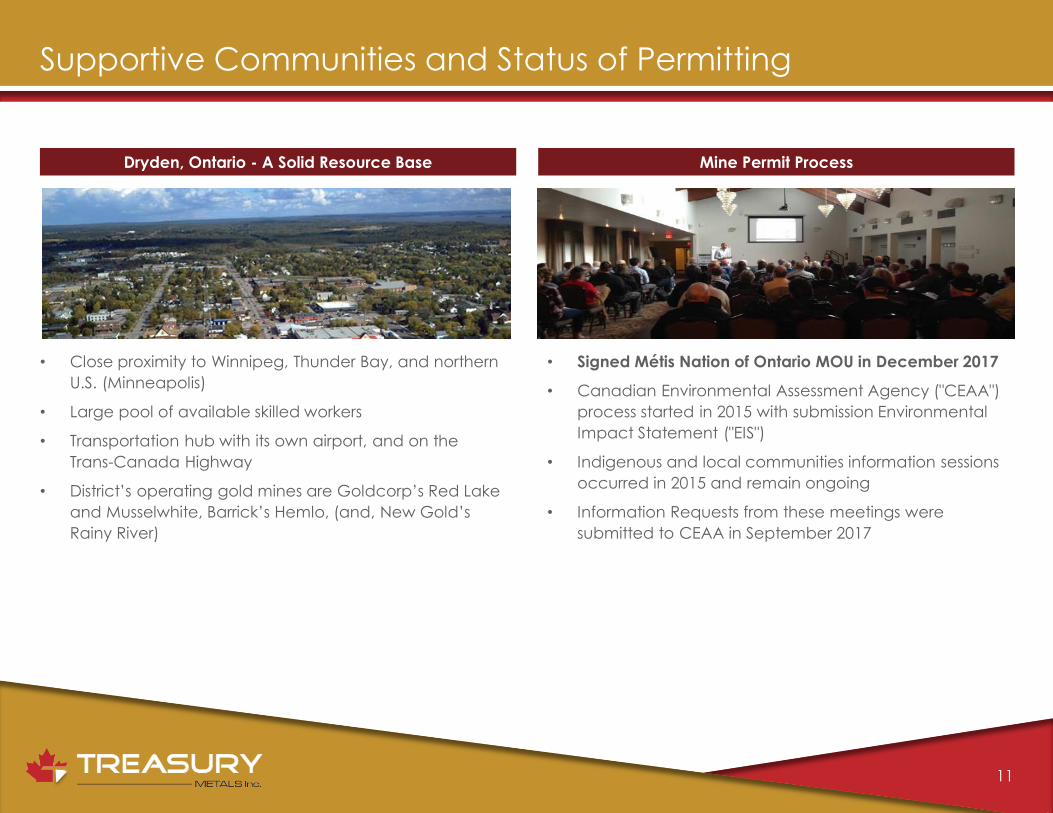
Supportive Communities and Status of Permitting
11
Dryden, Ontario - A Solid Resource Base Mine Permit Process
• Close proximity to Winnipeg, Thunder Bay, and northern
U.S. (Minneapolis)
• Large pool of available skilled workers
• Transportation hub with its own airport, and on the
Trans-Canada Highway
• District’s operating gold mines are Goldcorp’s Red Lake
and Musselwhite, Barrick’s Hemlo, (and, New Gold’s
Rainy River)
• Signed Métis Nation of Ontario MOU in December 2017
• Canadian Environmental Assessment Agency ("CEAA")
process started in 2015 with submission Environmental
Impact Statement ("EIS")
• Indigenous and local communities information sessions
occurred in 2015 and remain ongoing
• Information Requests from these meetings were
submitted to CEAA in September 2017

Mining Plan – New Project Parameters for Updated PEA
• Optimized mining plan; Open Pit: reduced stripping ratio and maximized NPV in conjunction with UG mill feed.
• Initial open pit generating immediate revenues to fund underground development. UG starts in year 2 and OP ends in Year 8
• Increased Measured and Indicated ounces in mine plan: MI representing 100% and 70% in the OP and UG
• Optimization studies for tailings storage and mine closure completed to an advanced stage
• Carbon-in-leach (CIL) circuit with gravity extraction with recoveries estimated at 95.5% for gold and 62.6% for silver
• Open pit depth of ~130 m & UG depth of 500 – 600 m
• $3.45/t Open Pit, $77/t UG, $18.15/t Mill
12

Conceptual Open Pit and Underground Outline
• Main Zone and C Zone are the two principal zones of mineralization
• Main Zone and C Zone shoots are open at depth and they are potential new shoots in the Main and C Zone open along strike
• Zones strike east-west and dip 70°- 80° to the south-southeast
• C Zone runs parallel to the Main Zone approx. 40 metres into the footwall
13

Main Zone Resource Area
In-fill drilling underway
• 12,000m of drilling to convert Inferred to Indicated Resources
• Focused on the Main & East Shoots at the 500 m level area
14
East Resource Target

Goliath Property – Significant Exploration Potential Along Strike
15
Goliath Gold Deposit – 1.5M oz
• ~10km of largely unexplored strike
length
• Same rock type with similar
mineralization style at eastern end of
property
• Highly prospective regional fold nose
structure with deformed iron
formation

Goliath Project – PFS Enhancements
• Battery Technology
• Ventilation System Optimization
• Tele-remote Equipment Operation
• Pre-production UG Development
• OP/UG Interface Optimization
16
Resource and Exploration Expansion
EV/Technology
Focused Operation
Reduction of Capital Expenditures
Mine Plan Optimization
Process Optimization

Why Invest In Treasury Metals?
17
~100,000 oz/year advanced gold development project in NW Ontario – A Tier 1 mining jurisdiction (Rainy River, Red Lake, Musselwhite)
Attractive +25% post tax IRR project economics with low initial capex
Exploration upside with significant expansion potential at depth and along strike
Potential to be the leader for area consolidation in a highly prospective mining jurisdiction
Attractive valuation levels

TSX:TML
Greg Ferron Vice President, Corporate Development
416.214.4654
Chris Stewart President and CEO
416.214.4654
Toronto Office 416.214.4654 or
1.855.664.4654 (toll-free)
Dryden Office 807.938.6961
www.treasurymetals.com
Contact Information

TSX:TML
Appendix

Management
Chris Stewart, President, Chief Executive Officer and Director Mr. Stewart is an engineer with more than 25 years in senior management experience at mining and milling operations, including VP Operations at Kirkland Lake Gold Inc.
Marc Henderson, Chairman Founder of Laramide Resources Ltd. and Aquiline Resources Inc.; well established financier previously involved with Lydian, Minefinders; CFA.
Dennis Gibson, Chief Financial Officer
Mr. Dennis Gibson, CPA, has held various senior financial positions for more than 30 years. In addition, he is CFO of Laramide Resources.
Bill Fisher, Lead Director
Seasoned mining executive; former Chairman of Aurelian, Globestar and currently Executive Chairman of Goldquest Mining Corp.; geologist.
Greg Ferron, VP, Corporate Development and Investor Relations Mr. Ferron brings 15 years of capital markets experience including corporate finance, business development and investor relations.
Doug Bache, Independent Director Head of company’s audit committee, extensive mine finance and accounting work with public mining companies; director of Marathon Gold.
Bob MacDonald, Vice President, Goliath Project Mr. MacDonald is an engineer with more than 30 years of mining experience at Goldcorp.’s Musselwhite and Red Lake operations, Kirkland Lake Gold’s Macassa, and also Cameco projects.
Flora Wood, Independent Director Extensive capital market and investor relations experience including with Sherritt, Inmet Mining, Algoma and Aquiline.
Mark Wheeler, Director, Projects
Engineer with both open pit and underground mining operations experience, most recently as production engineer at Teck.
Christophe Vereecke, Independent Director Investment advisory firm specializes in private client fund management focused in the extractive industry, mine royalties and precious metals.
Adam Larsen, Senior Project Geologist Geologist with more than 8 years of experience leading mineral exploration programs to the resource development stage, and underground experience at Goldcorp Inc.’s Musselwhite Mine.
Blaise Yerly, Independent Director Previous Chairman of Aquiline, Swiss based financier and founder / operator of mining equipment leasing companies.
20
Board of Directors

Chris Stewart’s Experience in Ontario Gold Sector
• Chris Stewart, P.Eng., is a veteran mining executive with more than 24 years of diversified experience in the mining industry
• Chris developed the Timmins Mine and refurbished and operated Bell Creek Mill as VP Operations for Lake Shore Gold
• Chris led Kirkland Lake Gold’s operations as VP Ops and during that period, accomplishments included:
– Share price increase of >350% from $2.67 to a high of $12.39;
– Market cap increased over 4.5x from $260M to a high of $1.45B;
– Successfully integrated the St. Andrew Goldfields acquisition; and
– Generated significant operating cash flow and 11 straight quarters of positive cash flow under his leadership
Keys to a Successful Gold Operation in Ontario:
• The right strategy for the operation and focus on safety
• Leadership & Communication – People
• Culture of Accountability, Responsibility & Respect
• Build and strengthen relations among Indigenous communities and organizations
• Focus on the details but allowing people to do their jobs
21

Goliath Gold Project – 2017 PEA
22
Preliminary Economic Assessment
Project Parameters Unit Amount
Gold Resources
Gold and Silver Production - Resources Mined Oz 1,142,000 and 2,075,000
Average Mill Feed Gold Grade Au (g/tonne) 3.81
Average Mill Feed Silver Grade Ag (g/tonne) 10.55
Cut-off Grade - Open Pit and Underground Au g/tonne 0.55 and 2.10
Average Open Pit and UG gold grade (Au) Au (g/tonne) 1.58 and 4.87
Operating Metrics
Total Tonnes Ore Produced (OP and UG) Tonnes 9.8 million
Breakdown (OP and UG) Tonnes 3.18 and 6.60 million
Open Pit Mill Feed Production Rate tpd/tpa 2,500 tonne/day or 875,000/yr
Total Strip Ratio Waste:Mill Feed 6:1
Gold and Silver Recovery (Processing) % 95.5% and 62.6%
Dilution (open pit and UG) % 25% and 10%
Average Gold Production and AuEq Oz/year 87,850 and 90,000
Peak Production (Year 6) Oz/year 111,800
Mine life years 13 years
Financial Metrics
Realized Gold and Silver Price (Base Case) US$/Oz US$1,225 and $17
Total Initial Capital Expenditures C$M $133
Total Sustaining Capital (Including U/G) C$M $132
Cash Operating Cost U$/Oz $525
All in Sustaining Cost (AISC) U$/Oz $611
Mining Costs - Open Pit and UG $/tonne OP $3.45 and UG $77
General and Admin cost C$/tonne $2.85
Milling Costs and Open Pit Waste Mining $/tonne $18.15 and $3.30
Exchange Rate C$ C$1.32: US$1.00

Goliath Gold Project – Production by Year and Low Costs
23
$400
$500
$600
$700
$800
$900
$1,000
$1,100
$1,200
0
20,000
40,000
60,000
80,000
100,000
120,000
140,000
Yr 1 Yr 2 Yr 3 Yr 4 Yr 5 Yr 6 Yr 7 Yr 8 Yr 9 Yr 10 Yr 11 Yr 12 Yr 13
Silver Production (AuEq ozs)
UG Production (Oz Au)
Open Pit Production (Au ozs)
Cash Cost US$/Oz AuEq
AISC (US$/Oz AuEq)
Oz. $US

Goliath Gold Project – Cash Flows and Capex (C$ million)
C$ Million Yearly Average1 Yearly Average for Years 3 to 9 LOM Total
Net Metal Revenue $134.2M $166.1M $1,878M
Operating Costs $58.1M $67.2M $812.7M
Transportation, Royalties and Refining $0.6M $0.78M $9.3M
Capital Costs $18.8M $11.0M $265.7M
Pre-Tax Cash Flows $48.6M $81.1M $729.5M
Corporate Tax $18.2M $24.0M $254.5M
After-Tax Cash Flow $36.3M $63.5M $545.0M
24
C$ Million Initial Capital Sustaining and Underground Capital Total Capital
Processing Plant $90.7M $12.4M $103.1M
Tailings $11.3M $10.0M $21.3M
Open Pit Pre-Production $12.5M $0.0M $12.5M
Open Pit Equipment $17.0M $1.6M $18.6M
Underground $0.0M $96.3M $96.3M
1Certain averages assume impact of pre-production period

Goliath Gold Project – PEA Sensitivity Data
Gold Price (USD/oz)
$1,150 $1,200 Base Case
($1,225) $1,300 $1,350 $1,400
Pre-Tax and Post Tax NPV and IRR Sensitivity to Gold Price
Pre-Tax NPV 5% – C$M $356.7 $402.4 $425.2 $493.8 $539.4 $585.3
Post-Tax NPV 5% – C$M $254.6 $288.9 $306.1 $357.5 $391.8 $426.2
Pre-tax IRR 26.3% 28.71% 29.9% 33.4% 35.7% 37.9%
Post-tax IRR 22.1% 24.1% 25.0% 27.9% 29.8% 31.6%
Pre-tax Payback - Yrs 4.0 3.8 3.7 3.4 3.2 3.1
Post-tax Payback – Yrs 4.6 4.3 4.1 3.8 3.6 3.5
Note: Underground development, closure and sustaining capital commences in Year 1 averages C$10M per year.
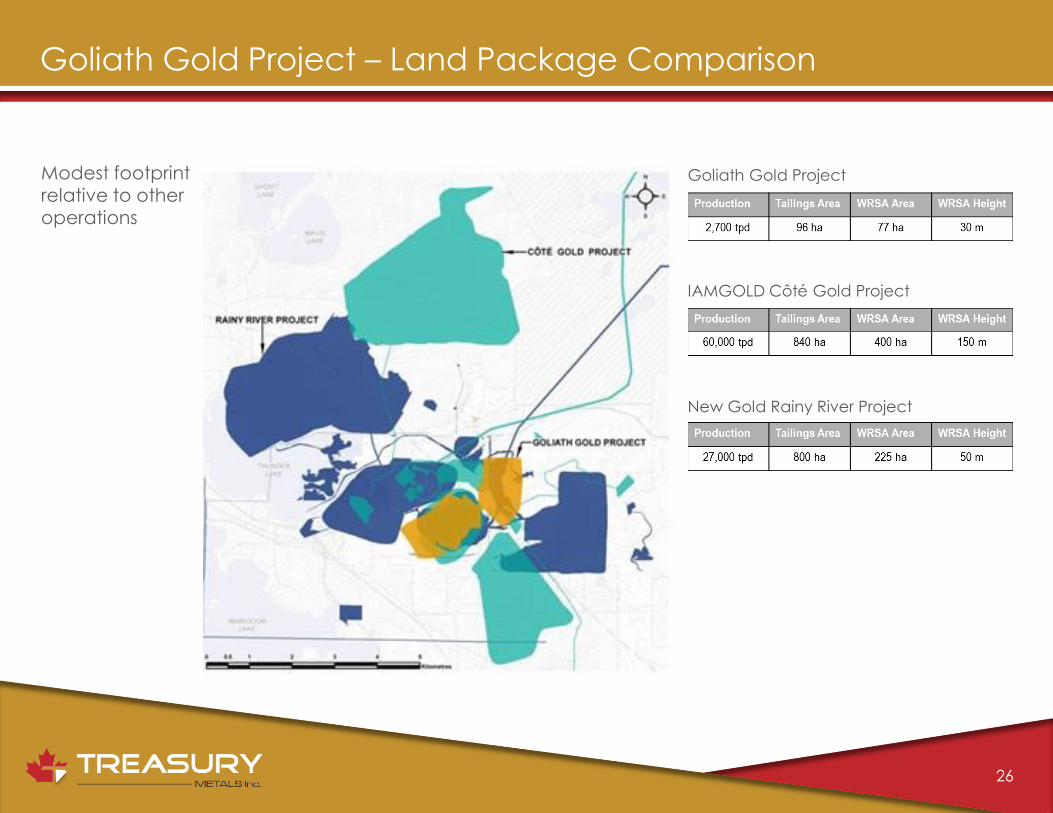
Goliath Gold Project – Land Package Comparison
Goliath Gold Project
IAMGOLD Côté Gold Project
New Gold Rainy River Project
26
Modest footprint relative to other operations
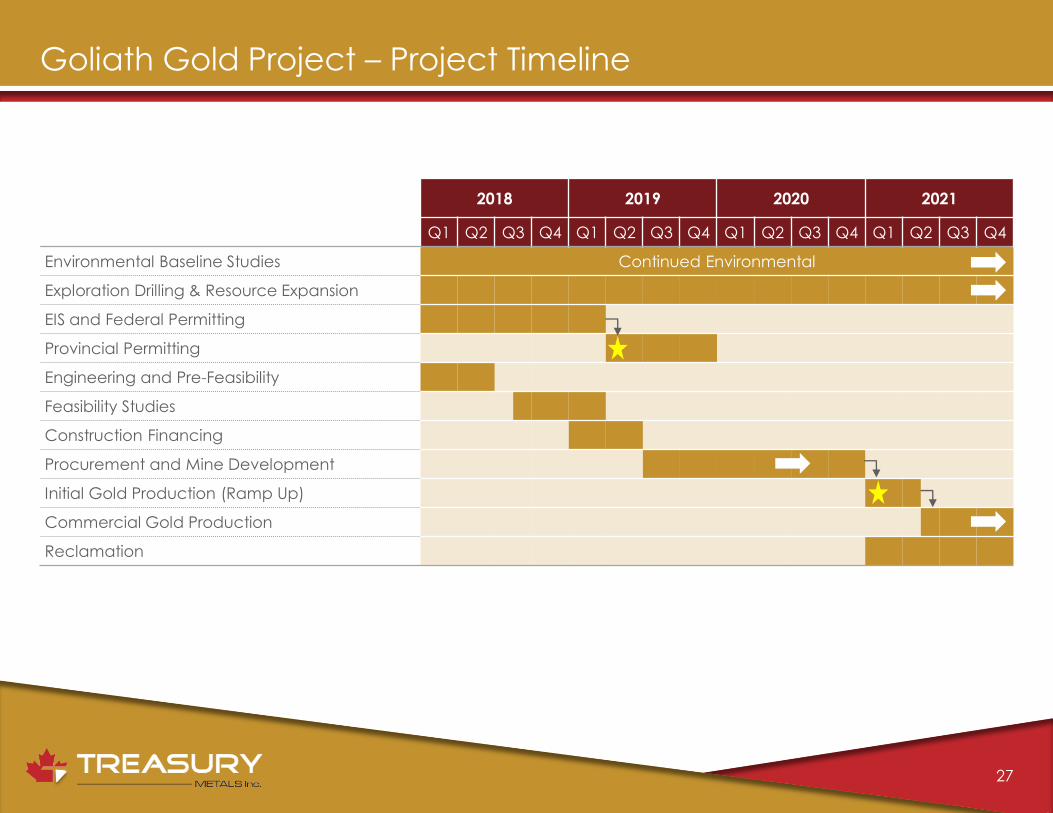
Goliath Gold Project – Project Timeline
27
2018 2019 2020 2021
Q1 Q2 Q3 Q4 Q1 Q2 Q3 Q4 Q1 Q2 Q3 Q4 Q1 Q2 Q3 Q4
Environmental Baseline Studies Continued Environmental
Exploration Drilling & Resource Expansion
EIS and Federal Permitting
Provincial Permitting
Engineering and Pre-Feasibility
Feasibility Studies
Construction Financing
Procurement and Mine Development
Initial Gold Production (Ramp Up)
Commercial Gold Production
Reclamation

Goliath Gold Project – N1 43-101 Resource Estimate
Resource Category
Block Cut-off AuEq g/t Tonnage
Au (g/t)
Contained Au (ounces) Ag (g/t)
Contained Ag (ounces)
AuEq (g/t)
Contained AuEq (ounces)
Open Pit Measured 0.35 1,015,000 1.90 62,100 7.8 256,000 2.00 65,200
Indicated 0.35 17,174,000 1.22 675,700 5.2 2,869,000 1.29 710,400
M+I 0.35 18,189,000 1.26 737,800 5.3 3,125,000 1.33 775,600
Inferred 0.35 1,351,000 0.99 42,800 4.3 186,000 1.04 45,000
Underground Measured 1.90 103,000 7.32 24,200 23.1 76,000 7.60 25,100
Indicated 1.90 2,264,000 4.84 352,400 14.4 1,044,000 5.02 365,000
M+I 1.90 2,367,000 4.95 376,600 14.7 1,120,000 5.13 390,100
Inferred 1.90 2,120,000 4.22 287,300 10.9 743,000 4.35 296,300
Total Measured 0.35&1.90 1,117,000 2.40 86,300 9.2 332,000 2.51 90,300
Indicated 0.35&1.90 19,437,000 1.65 1,028,100 6.3 3,913,000 1.72 1,075,500
M+I 0.35&1.90 20,554,000 1.69 1,114,400 6.4 4,245,000 1.76 1,165,800
Inferred 0.35&1.90 3,470,000 2.96 330,100 8.3 928,000 3.06 341,300
28
Notes from Resource Estimate:
1.Mineral resources which are not mineral reserves do not have demonstrated economic viability. The estimate of
mineral resources may be materially affected by environmental, permitting, legal, title, taxation, socio-political,
marketing, or other relevant issues.
2.The quantity and grade of reported Inferred resources in this estimation are uncertain in nature and there has been
insufficient exploration to define these Inferred resources as an Indicated or Measured mineral resource and it is
uncertain if further exploration will result in upgrading them to an Indicated or Measured mineral resource category.
3.The mineral resources in this press release were estimated using the Canadian Institute of Mining, Metallurgy and
Petroleum (CIM), CIM Standards on Mineral Resources and Reserves, Definitions and Guidelines prepared by the CIM
Standing Committee on Reserve Definitions and adopted by the CIM Council.
4. A gold price of US$1,397/oz and silver price of US$22.93/oz
based on the April 30, 2015 three year trailing average prices
and an exchange rate of US$1.06=Cdn$1.00 were utilized in
the AuEq cut-off grade calculations of 0.35 g/t AuEq for
Open Pit and 1.90 g/t AuEq for Underground mineral
resources.
5. Open Pit mining costs were assumed at Cdn$5.00/t for
mineralized material, Cdn$3.15/t for waste rock and
Cdn$2.00/t for overburden, while Underground mining costs
were assumed at Cdn$70.00/t, with process costs of
Cdn$13.81/t, G&A of Cdn$2.72/t, and process recoveries of
95% for gold and 70% for silver.
6. The Au:Ag ratio used for AuEq was 82.68.
7. A bulk density model averaged 2.76 t/m3 for mineralized
material.
8. Totals in the table may not sum due to rounding.
*Independent NI
43-101 Mineral
Resource
Estimate
completed by
P&E Mining
Consultants Inc.
(Press release,
August 28, 2015).

Eastern Resource Target Results (C Zone)
29
• Recent near surface intervals in the
C Zone with the potential to expand
pit farther east
• Developing mineralized shoot
– Drill holes planned to delineate in
2018 Drill program
• Main Zone Results Include:
– Tl 12-268 which contained 3.53
g/t over 7m and TL 12-265 with
0.71 g/t over 8.5m

Productive Greenstone Belt
Historic Ontario Gold Mining Camps
• Timmins
• Kirkland Lake
• Marathon
• Red Lake
30

Non-core Projects: Lara (BC) & Weebigee (ON)
31
Lara Polymetallic Project is located in the southern region of Vancouver Island, near Chemainus, about 75 km north of Victoria, B.C. Located in close proximity to Nystar’s Myra Falls mine and mill
Treasury’s Weebigee Gold Project (part of subsidiary Goldeye Explorations), is proximal to gold deposits Red Lake and Musselwhite and located near Sandy Lake in northwestern Ontario. Attractive near surface gold intersections
Mineral Resource Estimation (1% Zn Block Cut-off)*
Category Tonnes Zn (%) Ag (g/t) Cu (%) Pb (%) Au (g/t)
Indicated 1,146,70
0 3.01 32.97 1.05 0.58 1.97
Inferred 669,600 2.26 32.99 0.90 0.44 1.90