Embed Size (px)
Citation preview
Q3, 2018
INVESTOR PRESENTATION
2
Classification: General Business Use
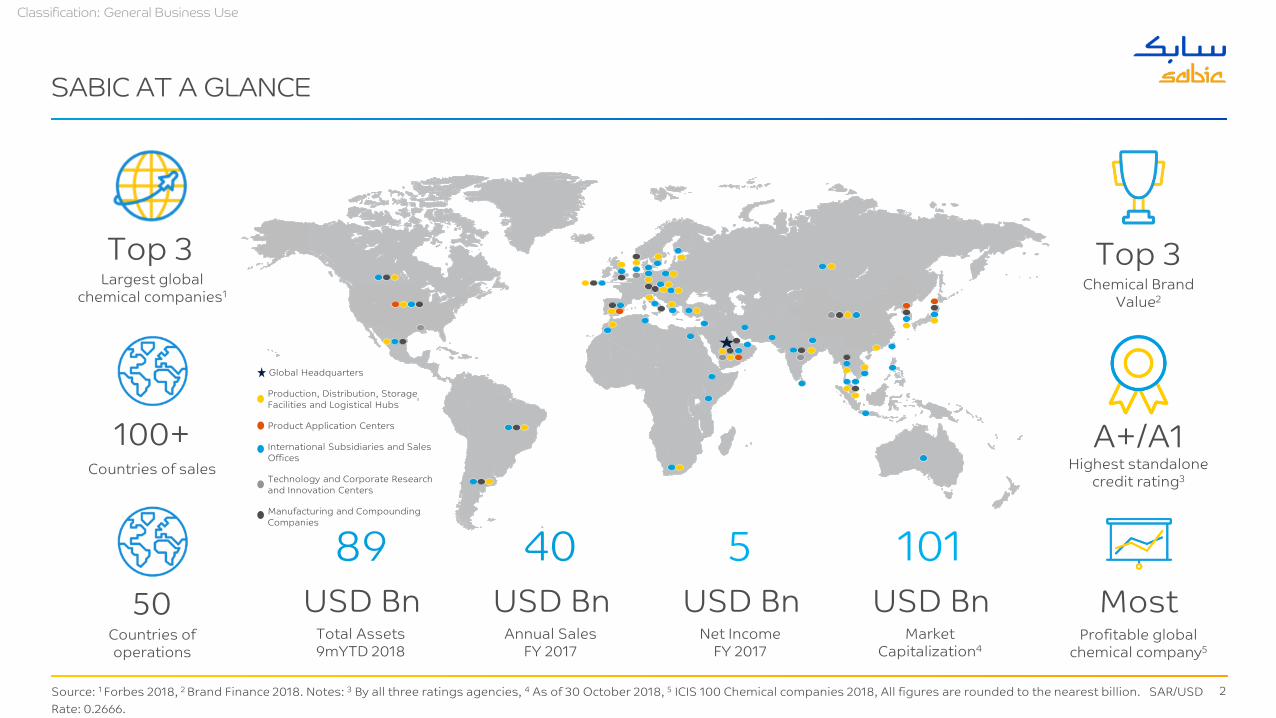
SABIC AT A GLANCE
50Countries of operations
Top 3 Largest global
chemical companies1
100+Countries of sales
USD BnTotal Assets9mYTD 2018
89USD Bn
Annual SalesFY 2017
40USD Bn
Net Income FY 2017
5USD Bn
Market Capitalization4
101
A+/A1Highest standalone
credit rating3
Top 3 Chemical Brand
Value2
MostProfitable global
chemical company5
Product Application Centers
Technology and Corporate Research and Innovation Centers
Production, Distribution, Storage Facilities and Logistical Hubs
International Subsidiaries and Sales Offices
Manufacturing and Compounding Companies
Global Headquarters
Source: 1 Forbes 2018, 2 Brand Finance 2018. Notes: 3 By all three ratings agencies, 4 As of 30 October 2018, 5 ICIS 100 Chemical companies 2018, All figures are rounded to the nearest billion. SAR/USD Rate: 0.2666.
3
Classification: General Business Use
0
10
20
30
40
50
60
70
80
1983 1985 1987 1989 1991 1993 1995 1997 1999 2001 2003 2005 2007 2009 2011 2013 2015 2017
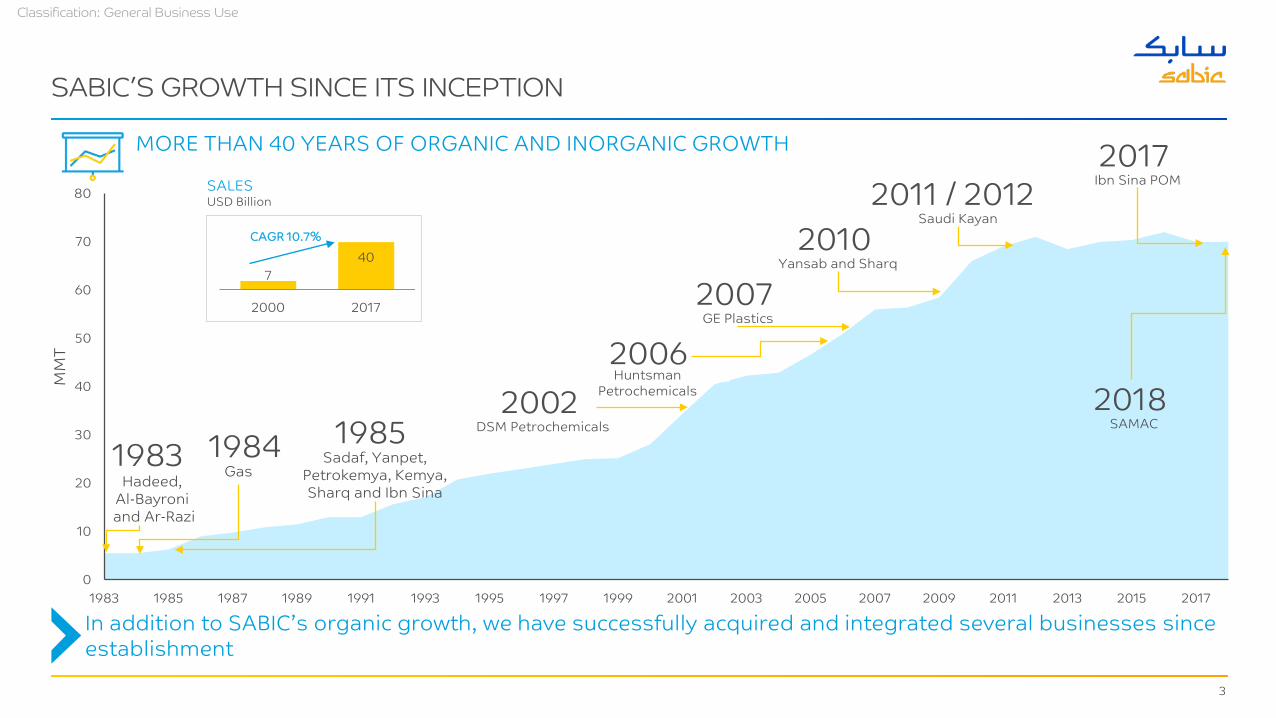
SABIC’S GROWTH SINCE ITS INCEPTION
In addition to SABIC’s organic growth, we have successfully acquired and integrated several businesses since establishment
MORE THAN 40 YEARS OF ORGANIC AND INORGANIC GROWTH
1984Gas
1985Sadaf, Yanpet,
Petrokemya, Kemya, Sharq and Ibn Sina
2002DSM Petrochemicals
2006Huntsman
Petrochemicals
2007GE Plastics
2010Yansab and Sharq
2011 / 2012Saudi Kayan
2017Ibn Sina POM
2018SAMAC
1983Hadeed,
Al-Bayroniand Ar-Razi
MM
T
740
2000 2017
SALES USD Billion
CAGR 10.7%
4
Classification: General Business Use
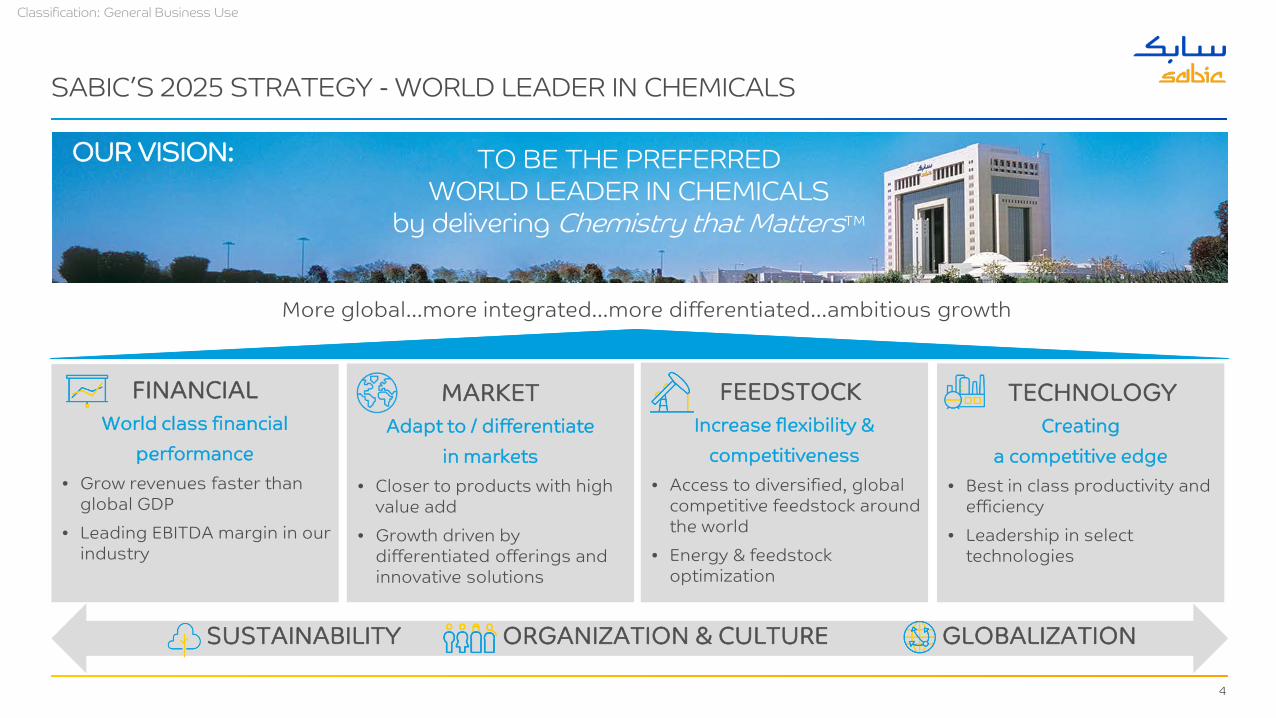
SABIC’S 2025 STRATEGY - WORLD LEADER IN CHEMICALS
TO BE THE PREFERRED WORLD LEADER IN CHEMICALS
by delivering Chemistry that MattersTM
More global…more integrated…more differentiated…ambitious growth
FINANCIALWorld class financial
performance• Grow revenues faster than
global GDP• Leading EBITDA margin in our
industry
MARKETAdapt to / differentiate
in markets• Closer to products with high
value add• Growth driven by
differentiated offerings and innovative solutions
FEEDSTOCKIncrease flexibility &
competitiveness• Access to diversified, global
competitive feedstock around the world
• Energy & feedstock optimization
TECHNOLOGYCreating
a competitive edge• Best in class productivity and
efficiency• Leadership in select
technologies
OUR VISION:
SUSTAINABILITY ORGANIZATION & CULTURE GLOBALIZATION
KEY HIGHLIGHTS
INVESTOR PRESENTATION
6
Classification: General Business Use
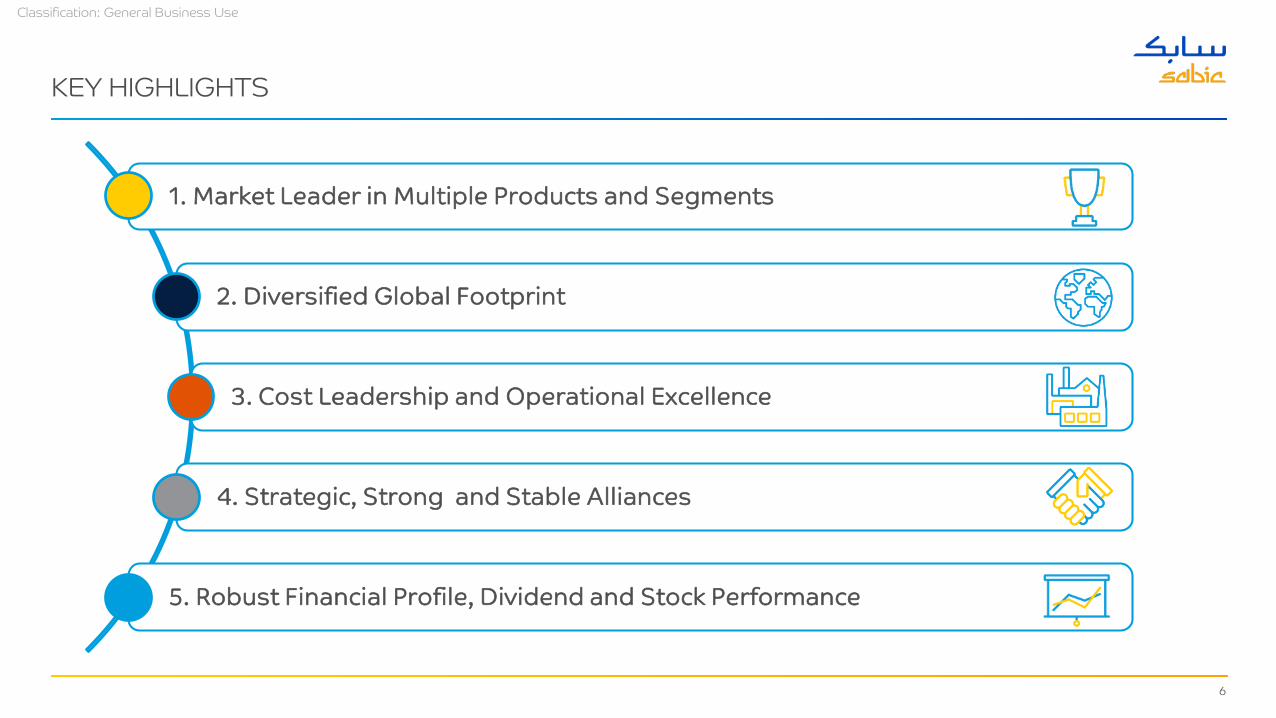
KEY HIGHLIGHTS
1. Market Leader in Multiple Products and Segments
2. Diversified Global Footprint
3. Cost Leadership and Operational Excellence
4. Strategic, Strong and Stable Alliances
5. Robust Financial Profile, Dividend and Stock Performance
7
Classification: General Business Use
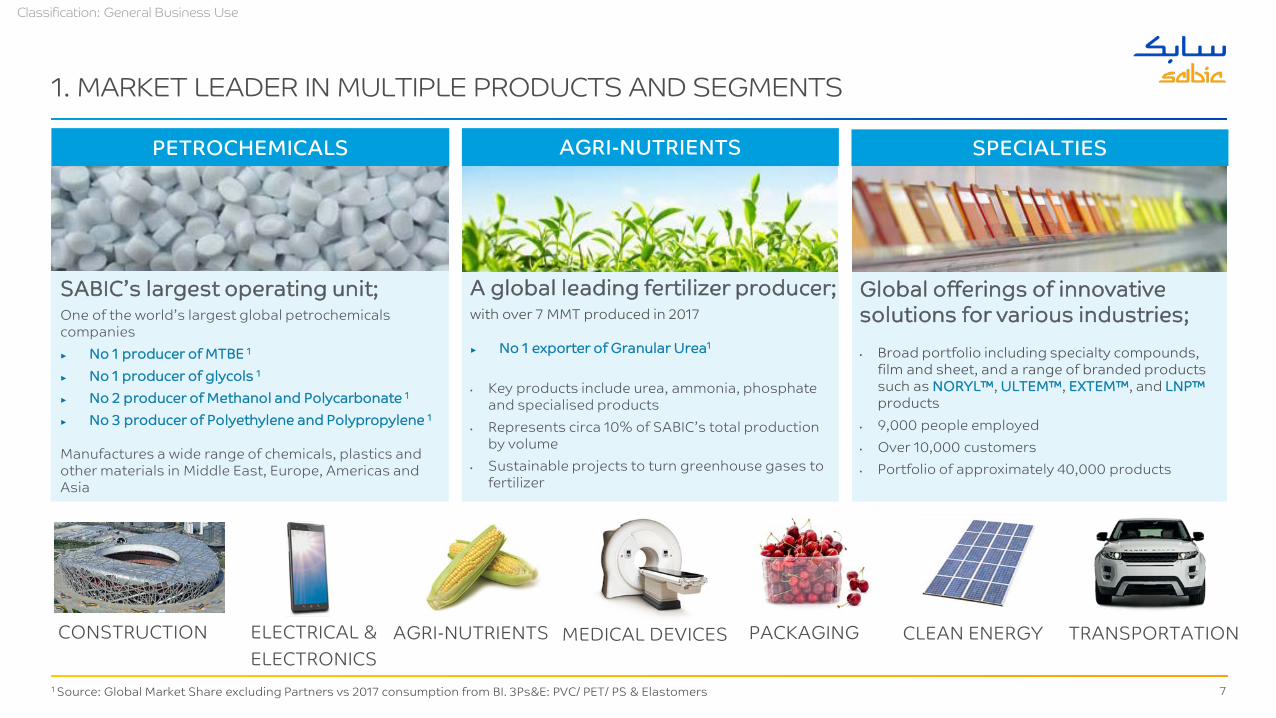
1. MARKET LEADER IN MULTIPLE PRODUCTS AND SEGMENTS
1 Source: Global Market Share excluding Partners vs 2017 consumption from BI. 3Ps&E: PVC/ PET/ PS & Elastomers
PETROCHEMICALS AGRI-NUTRIENTS SPECIALTIES
TRANSPORTATIONMEDICAL DEVICES PACKAGING CLEAN ENERGYCONSTRUCTION
A global leading fertilizer producer;with over 7 MMT produced in 2017
► No 1 exporter of Granular Urea1
• Key products include urea, ammonia, phosphate and specialised products
• Represents circa 10% of SABIC’s total production by volume
• Sustainable projects to turn greenhouse gases to fertilizer
Global offerings of innovative solutions for various industries; • Broad portfolio including specialty compounds,
film and sheet, and a range of branded products such as NORYL™, ULTEM™, EXTEM™, and LNP™products
• 9,000 people employed• Over 10,000 customers• Portfolio of approximately 40,000 products
AGRI-NUTRIENTSELECTRICAL &ELECTRONICS
SABIC’s largest operating unit;One of the world’s largest global petrochemicals companies► No 1 producer of MTBE 1
► No 1 producer of glycols 1
► No 2 producer of Methanol and Polycarbonate 1
► No 3 producer of Polyethylene and Polypropylene 1
Manufactures a wide range of chemicals, plastics and other materials in Middle East, Europe, Americas and Asia
8
Classification: General Business Use
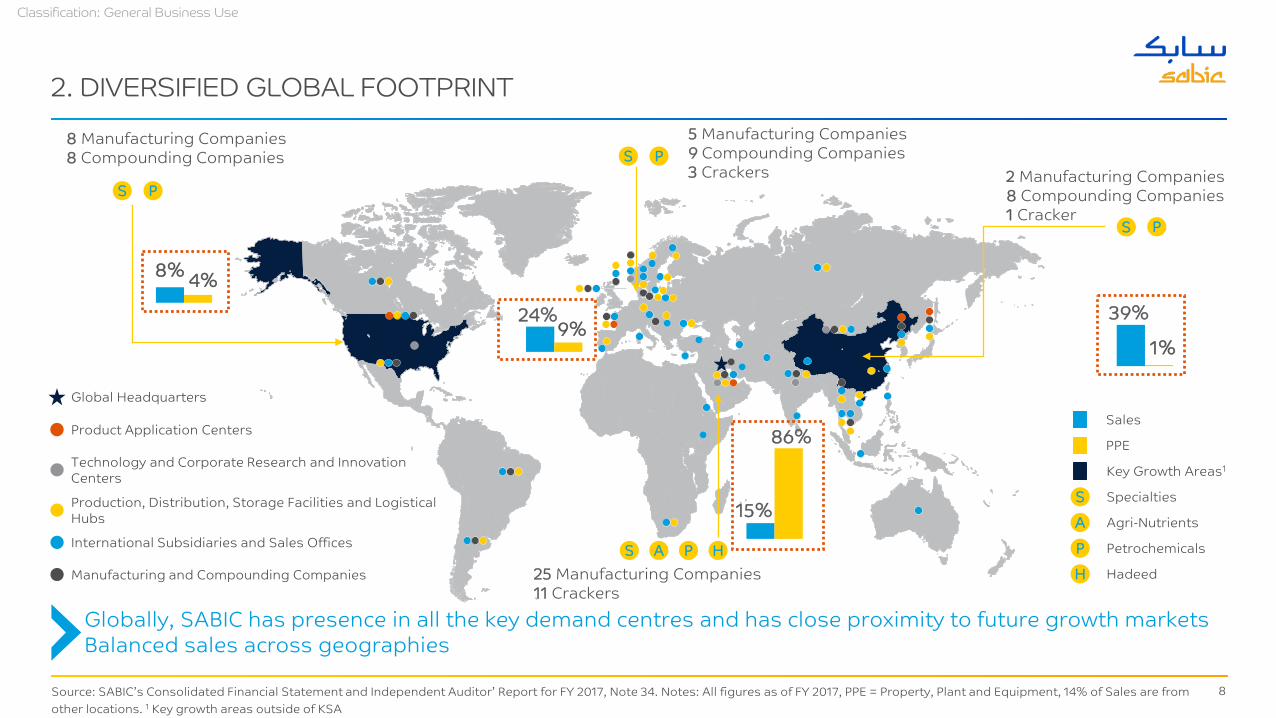
2. DIVERSIFIED GLOBAL FOOTPRINT
Source: SABIC’s Consolidated Financial Statement and Independent Auditor’ Report for FY 2017, Note 34. Notes: All figures as of FY 2017, PPE = Property, Plant and Equipment, 14% of Sales are from other locations. 1 Key growth areas outside of KSA
Globally, SABIC has presence in all the key demand centres and has close proximity to future growth markets Balanced sales across geographies
Product Application Centers
Technology and Corporate Research and Innovation Centers
Production, Distribution, Storage Facilities and Logistical Hubs
International Subsidiaries and Sales Offices
Manufacturing and Compounding Companies
Global Headquarters
2 Manufacturing Companies8 Compounding Companies1 Cracker
S P
25 Manufacturing Companies11 Crackers
A PSH Hadeed
P Petrochemicals
A Agri-Nutrients
S Specialties
Key Growth Areas1
1%
S8 Manufacturing Companies8 Compounding Companies
PS
8% 4%
P
9%
5 Manufacturing Companies 9 Compounding Companies3 Crackers
24%
15%
86%
39%
Sales
PPE
H
9
Classification: General Business Use
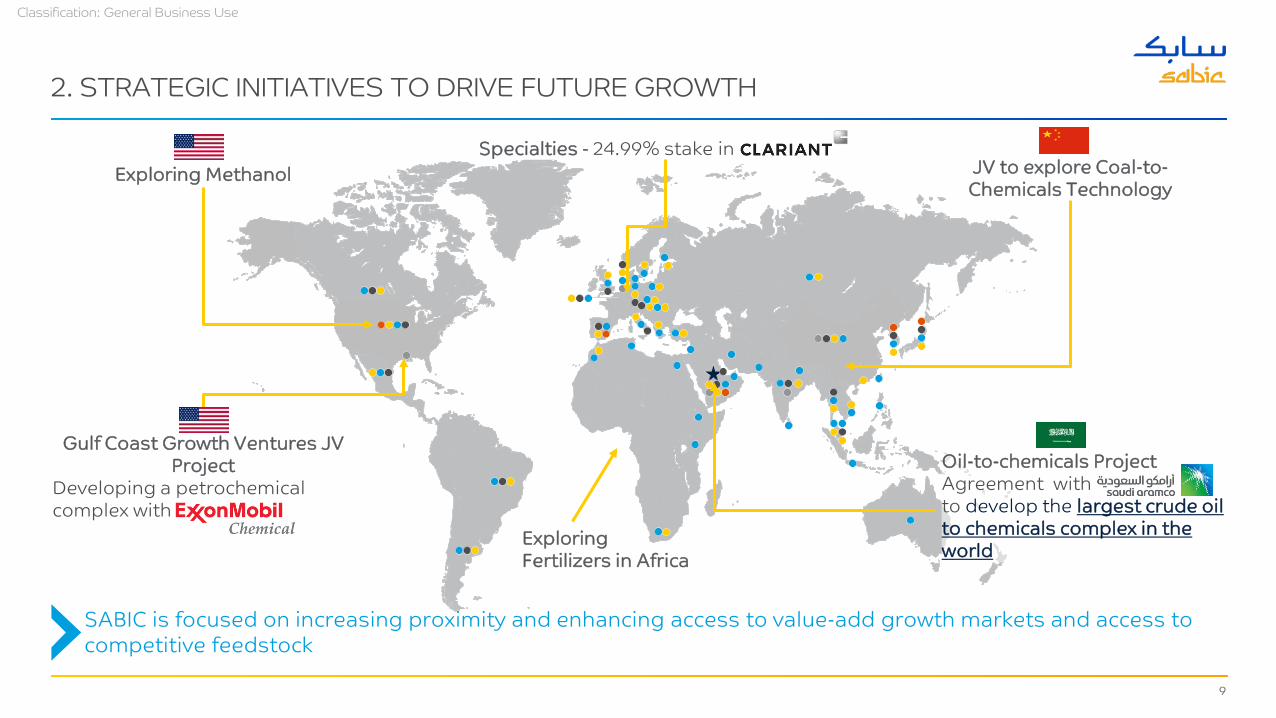
2. STRATEGIC INITIATIVES TO DRIVE FUTURE GROWTH
Oil-to-chemicals Project Agreement with Saudi Aramco to develop the largest crude oil to chemicals complex in the world
Exploring MethanolSpecialties - 24.99% stake in Clariant AG
JV to explore Coal-to-Chemicals Technology
Gulf Coast Growth Ventures JV Project
Developing a petrochemical complex with ExxonMobil Chemical Exploring
Fertilizers in Africa
SABIC is focused on increasing proximity and enhancing access to value-add growth markets and access to competitive feedstock
10
Classification: General Business Use
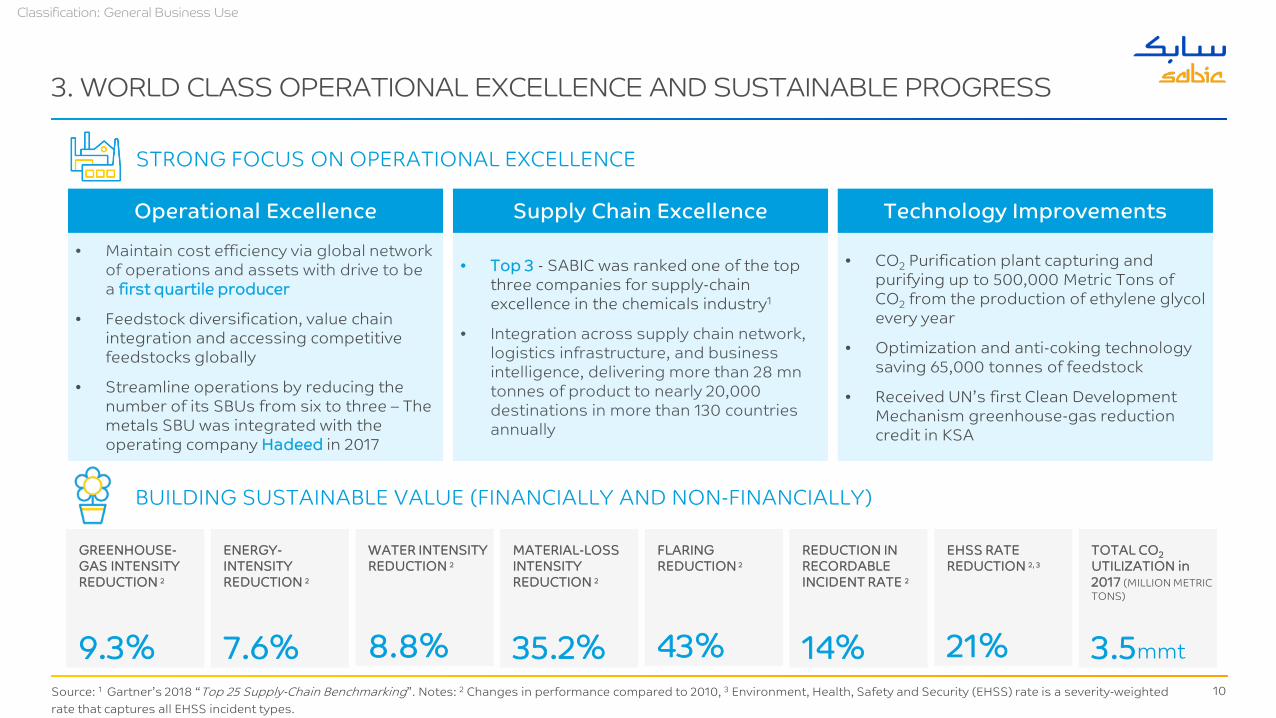
3. WORLD CLASS OPERATIONAL EXCELLENCE AND SUSTAINABLE PROGRESS
Source: 1 Gartner’s 2018 “Top 25 Supply-Chain Benchmarking”. Notes: 2 Changes in performance compared to 2010, 3 Environment, Health, Safety and Security (EHSS) rate is a severity-weighted rate that captures all EHSS incident types.
BUILDING SUSTAINABLE VALUE (FINANCIALLY AND NON-FINANCIALLY)
GREENHOUSE-GAS INTENSITY REDUCTION 2
9.3%
ENERGY-INTENSITY REDUCTION 2
7.6%
WATER INTENSITY REDUCTION 2
8.8%
MATERIAL-LOSS INTENSITY REDUCTION 2
35.2%
TOTAL CO2UTILIZATION in 2017 (MILLION METRIC TONS)
3.5mmt
FLARING REDUCTION 2
43%
EHSS RATE REDUCTION 2, 3
21%
STRONG FOCUS ON OPERATIONAL EXCELLENCE
• Maintain cost efficiency via global network of operations and assets with drive to be a first quartile producer
• Feedstock diversification, value chain integration and accessing competitive feedstocks globally
• Streamline operations by reducing the number of its SBUs from six to three – The metals SBU was integrated with the operating company Hadeed in 2017
• Top 3 - SABIC was ranked one of the top three companies for supply-chain excellence in the chemicals industry1
• Integration across supply chain network, logistics infrastructure, and business intelligence, delivering more than 28 mntonnes of product to nearly 20,000 destinations in more than 130 countries annually
• CO2 Purification plant capturing and purifying up to 500,000 Metric Tons of CO2 from the production of ethylene glycol every year
• Optimization and anti-coking technology saving 65,000 tonnes of feedstock
• Received UN’s first Clean Development Mechanism greenhouse-gas reduction credit in KSA
Operational Excellence Supply Chain Excellence Technology Improvements
REDUCTION IN RECORDABLE INCIDENT RATE 2
14%
11
Classification: General Business Use
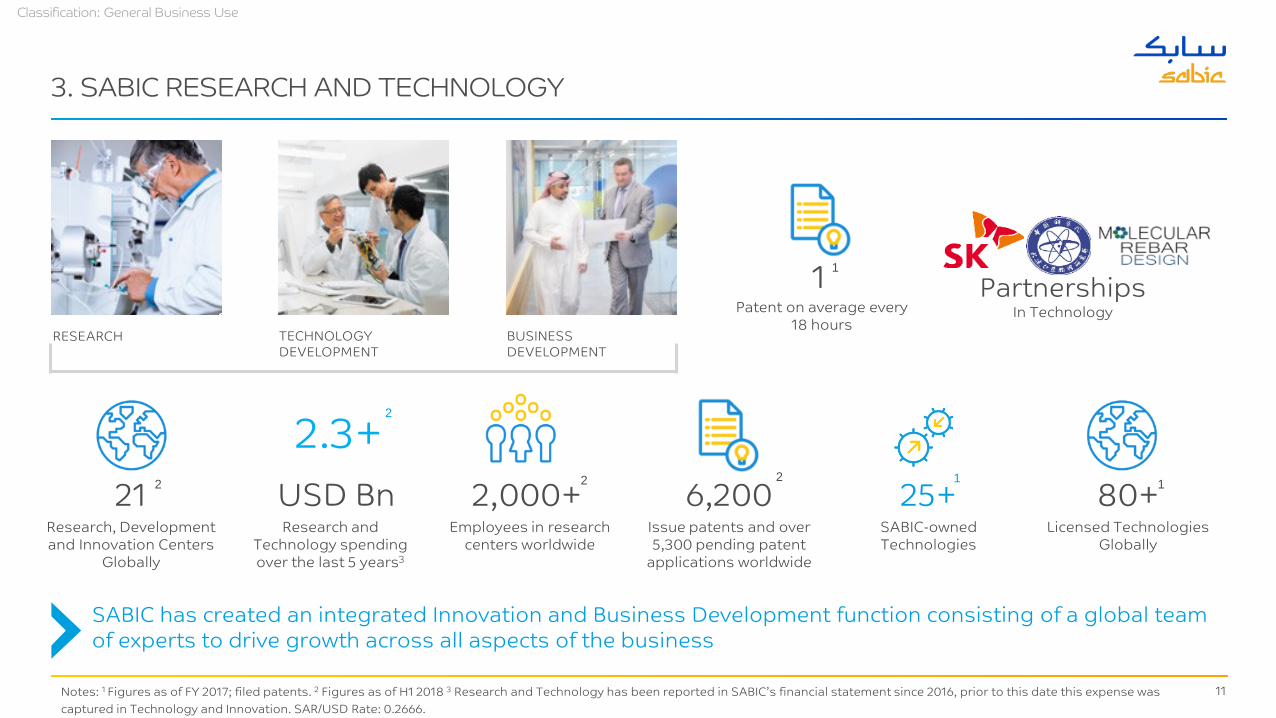
3. SABIC RESEARCH AND TECHNOLOGY
SABIC has created an integrated Innovation and Business Development function consisting of a global team of experts to drive growth across all aspects of the business
Notes: 1 Figures as of FY 2017; filed patents. 2 Figures as of H1 2018 3 Research and Technology has been reported in SABIC’s financial statement since 2016, prior to this date this expense was captured in Technology and Innovation. SAR/USD Rate: 0.2666.
PartnershipsIn Technology
RESEARCH TECHNOLOGY DEVELOPMENT
BUSINESS DEVELOPMENT
21Research, Development and Innovation Centers
Globally
1 Patent on average every
18 hours
USD BnResearch and
Technology spending over the last 5 years3
2,000+Employees in research
centers worldwide
6,200Issue patents and over 5,300 pending patent
applications worldwide
25+SABIC-owned Technologies
80+ Licensed Technologies
Globally
2.3+2 2 2 1
2
1
1
12
Classification: General Business Use
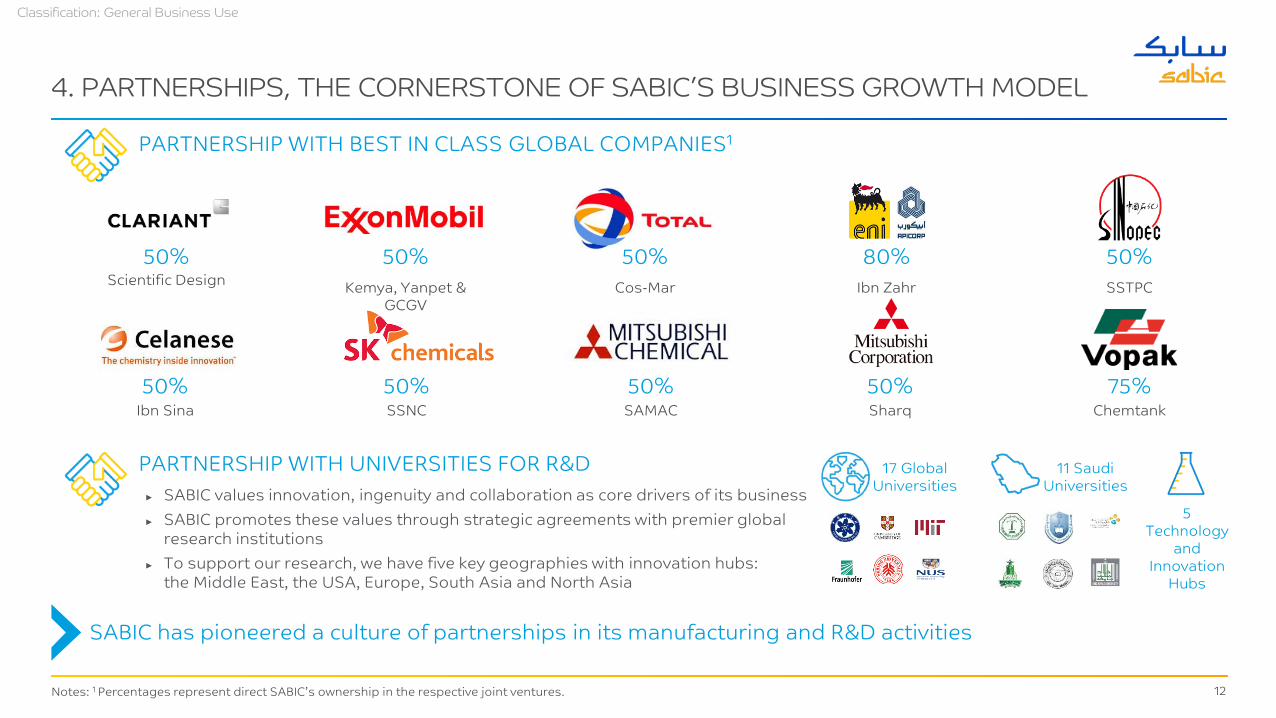
4. PARTNERSHIPS, THE CORNERSTONE OF SABIC’S BUSINESS GROWTH MODEL
PARTNERSHIP WITH BEST IN CLASS GLOBAL COMPANIES1
Notes: 1 Percentages represent direct SABIC’s ownership in the respective joint ventures.
Scientific Design50%
Kemya, Yanpet & GCGV
50%Cos-Mar
50%Ibn Zahr
80%
Ibn Sina50%
SAMAC50%
Chemtank75%
Sharq50%
SSTPC
50%
SSNC50%
PARTNERSHIP WITH UNIVERSITIES FOR R&D► SABIC values innovation, ingenuity and collaboration as core drivers of its business ► SABIC promotes these values through strategic agreements with premier global
research institutions ► To support our research, we have five key geographies with innovation hubs:
the Middle East, the USA, Europe, South Asia and North Asia
17 Global Universities
5 Technology
and Innovation
Hubs
11 Saudi Universities
SABIC has pioneered a culture of partnerships in its manufacturing and R&D activities
13
Classification: General Business Use
4. STRATEGIC ALIGNMENT WITH GOVERNMENT INITIATIVES
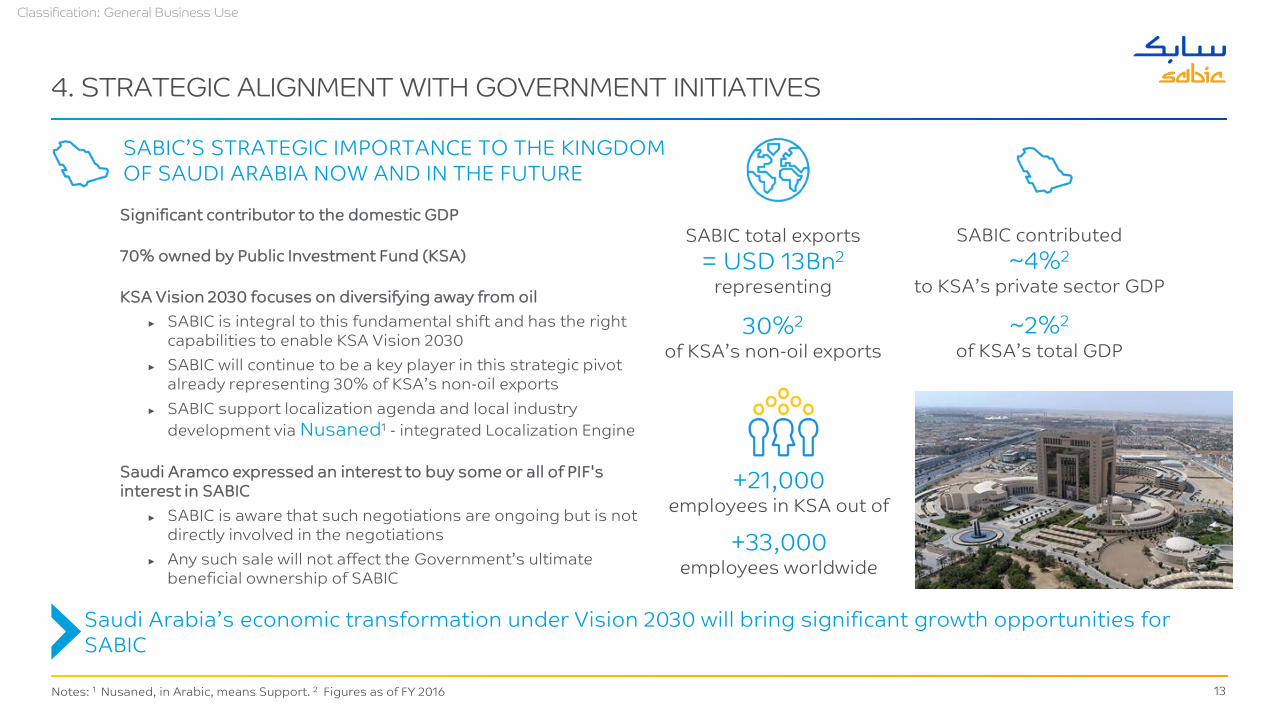
Significant contributor to the domestic GDP
70% owned by Public Investment Fund (KSA)
KSA Vision 2030 focuses on diversifying away from oil ► SABIC is integral to this fundamental shift and has the right
capabilities to enable KSA Vision 2030► SABIC will continue to be a key player in this strategic pivot
already representing 30% of KSA’s non-oil exports► SABIC support localization agenda and local industry
development via Nusaned1 - integrated Localization Engine
Saudi Aramco expressed an interest to buy some or all of PIF's interest in SABIC
► SABIC is aware that such negotiations are ongoing but is not directly involved in the negotiations
► Any such sale will not affect the Government’s ultimate beneficial ownership of SABIC
SABIC total exports= USD 13Bn2
representing
30%2
of KSA’s non-oil exports
SABIC contributed~4%2
to KSA’s private sector GDP
~2%2
of KSA’s total GDP
SABIC’S STRATEGIC IMPORTANCE TO THE KINGDOM OF SAUDI ARABIA NOW AND IN THE FUTURE
+21,000employees in KSA out of
+33,000employees worldwide
Notes: 1 Nusaned, in Arabic, means Support. 2 Figures as of FY 2016
Saudi Arabia’s economic transformation under Vision 2030 will bring significant growth opportunities for SABIC
14
Classification: General Business Use
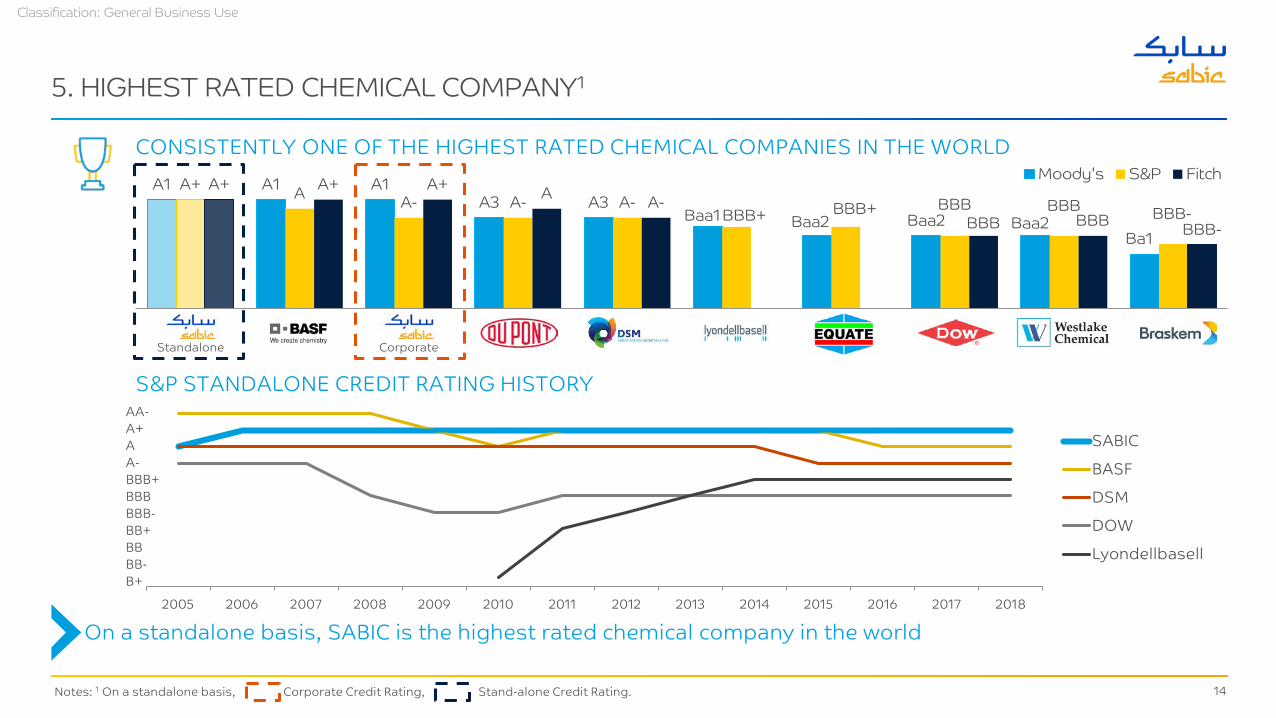
5. HIGHEST RATED CHEMICAL COMPANY1
A1 A1 A1A3 A3
Baa1 Baa2 Baa2 Baa2Ba1
A+ A A- A- A-BBB+ BBB+ BBB BBB BBB-
A+ A+ A+ A A-BBB BBB BBB-
SABIC SABIC DSM Equate Westlake
Moody's S&P FitchCONSISTENTLY ONE OF THE HIGHEST RATED CHEMICAL COMPANIES IN THE WORLD
2005 2006 2007 2008 2009 2010 2011 2012 2013 2014 2015 2016 2017 2018
SABIC
BASF
DSM
DOW
Lyondellbasell
AA-A+AA-BBB+BBBBBB-BB+BBBB-B+
S&P STANDALONE CREDIT RATING HISTORY
Notes: 1 On a standalone basis, Corporate Credit Rating, Stand-alone Credit Rating.
Standalone Corporate
On a standalone basis, SABIC is the highest rated chemical company in the world
15
Classification: General Business Use
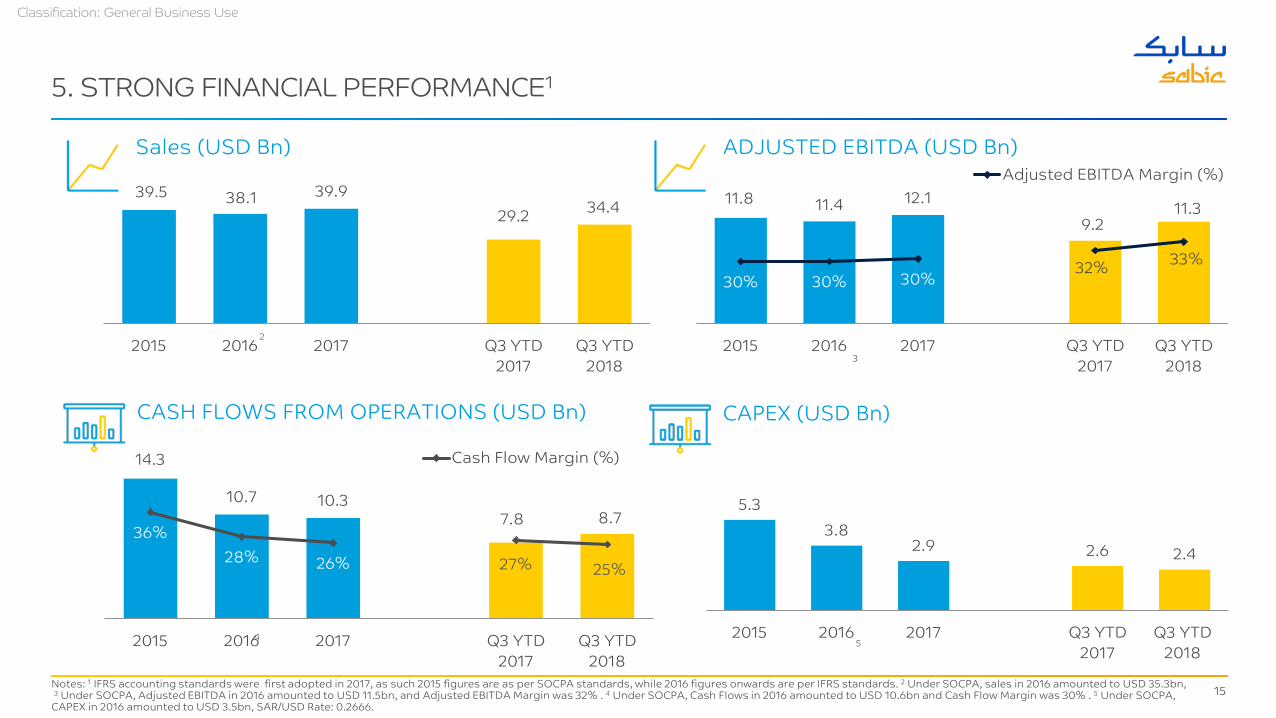
5. STRONG FINANCIAL PERFORMANCE1
Notes: 1 IFRS accounting standards were first adopted in 2017, as such 2015 figures are as per SOCPA standards, while 2016 figures onwards are per IFRS standards. 2 Under SOCPA, sales in 2016 amounted to USD 35.3bn,3 Under SOCPA, Adjusted EBITDA in 2016 amounted to USD 11.5bn, and Adjusted EBITDA Margin was 32% . 4 Under SOCPA, Cash Flows in 2016 amounted to USD 10.6bn and Cash Flow Margin was 30% . 5 Under SOCPA,
CAPEX in 2016 amounted to USD 3.5bn, SAR/USD Rate: 0.2666.
39.5 38.1 39.929.2 34.4
2015 2016 2017 Q3 YTD2017
Q3 YTD2018
Sales (USD Bn) ADJUSTED EBITDA (USD Bn)
11.8 11.4 12.19.2
11.3
30% 30% 30%32% 33%
2015 2016 2017 Q3 YTD2017
Q3 YTD2018
Adjusted EBITDA Margin (%)
14.3
10.7 10.37.8 8.7
36%28% 26% 27% 25%
0%
10%
20%
30%
40%
50%
60%
2015 2016 2017 Q3 YTD2017
Q3 YTD2018
Cash Flow Margin (%)
CASH FLOWS FROM OPERATIONS (USD Bn) CAPEX (USD Bn)
5.33.8
2.9 2.6 2.4
2015 2016 2017 Q3 YTD2017
Q3 YTD2018
2
3
45
16
Classification: General Business Use
1,300
1,400
1,500
1,600
1,700
1,800
1,900
2,000
2,100
20
40
60
80
100
120
140
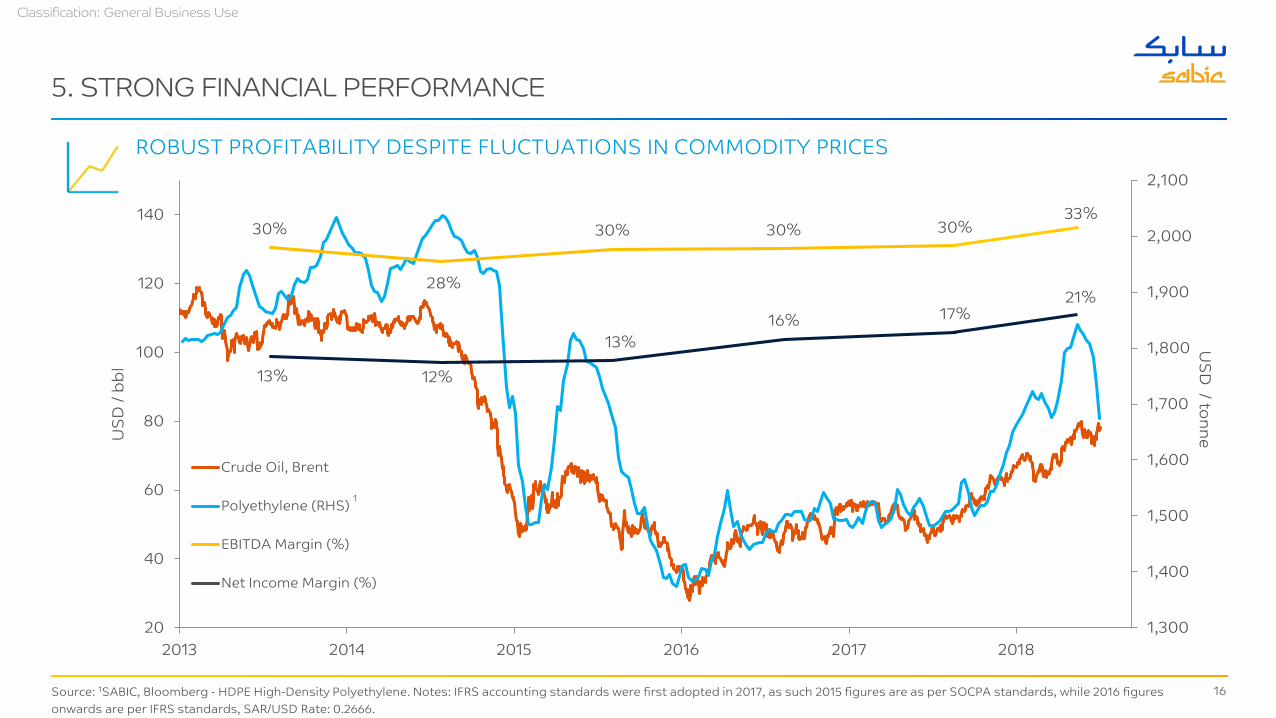
2013 2014 2015 2016 2017 2018
Crude Oil, Brent
Polyethylene (RHS)
EBITDA Margin (%)
Net Income Margin (%)
30%
28%
30% 30% 30%
13% 12%
13%16% 17%
33%
5. STRONG FINANCIAL PERFORMANCE
Source: 1SABIC, Bloomberg - HDPE High-Density Polyethylene. Notes: IFRS accounting standards were first adopted in 2017, as such 2015 figures are as per SOCPA standards, while 2016 figures onwards are per IFRS standards, SAR/USD Rate: 0.2666.
ROBUST PROFITABILITY DESPITE FLUCTUATIONS IN COMMODITY PRICESU
SD /
bbl
USD
/ tonne
1
21%
17
Classification: General Business Use
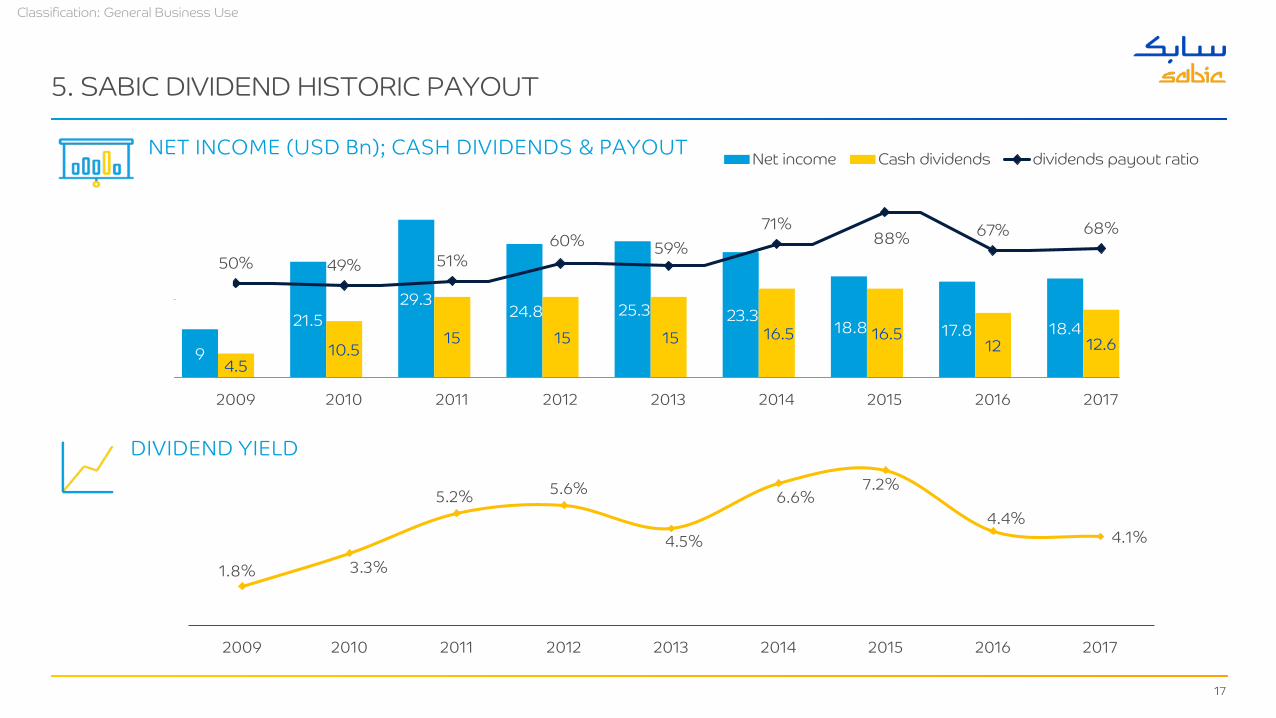
5. SABIC DIVIDEND HISTORIC PAYOUT
22
9
21.529.3
24.8 25.3 23.3 18.8 17.8 18.4
94.5
10.515 15 15 16.5 16.5
12 12.6
5
41%50% 49% 51%
60% 59%71%
88% 67% 68%
0%
20%
40%
60%
80%
100%
2008 2009 2010 2011 2012 2013 2014 2015 2016 2017
Net income Cash dividends dividends payout ratio
1.8% 3.3%
5.2% 5.6%
4.5%
6.6%7.2%
4.4%4.1%
2009 2010 2011 2012 2013 2014 2015 2016 2017
DIVIDEND YIELD
NET INCOME (USD Bn); CASH DIVIDENDS & PAYOUT
18
Classification: General Business Use
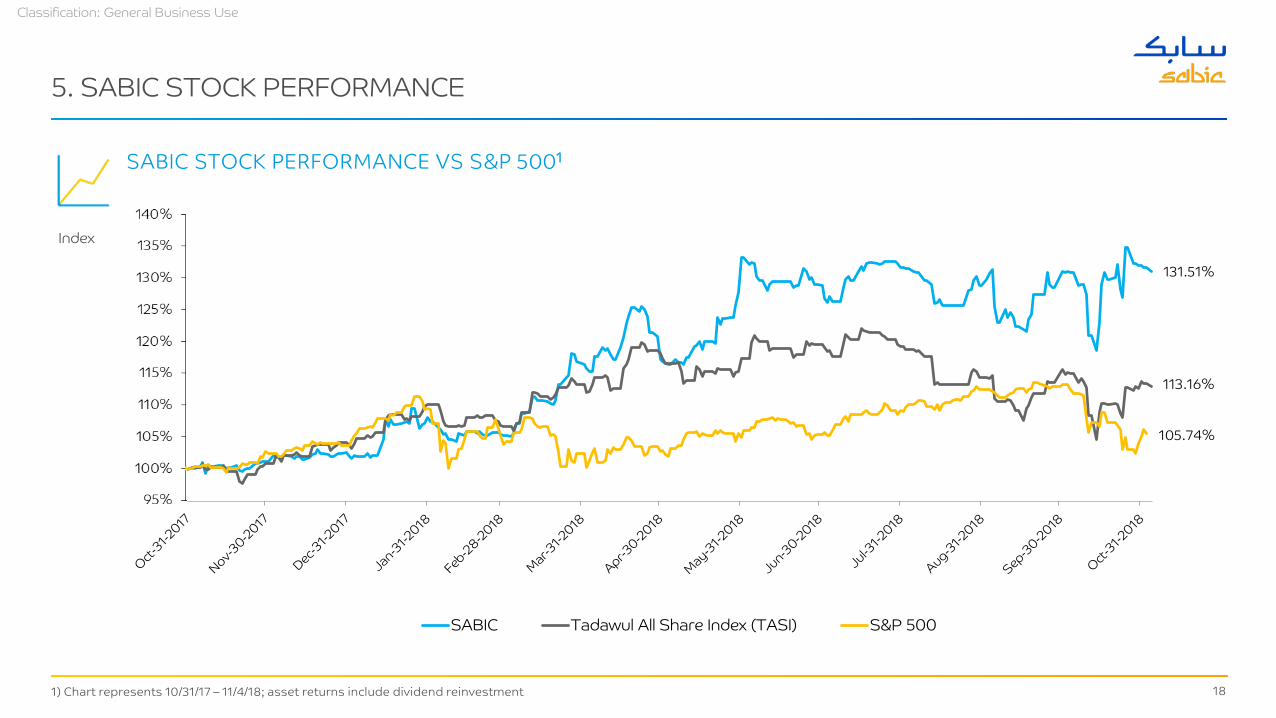
5. SABIC STOCK PERFORMANCE
1) Chart represents 10/31/17 – 11/4/18; asset returns include dividend reinvestment
SABIC STOCK PERFORMANCE VS S&P 5001
131.51%
105.74%
Index
-5%
0%
5%
10%
15%
20%
25%
30%
35%
40%
SABIC Tadawul All Share Index (TASI) S&P 500
113.16%
19
Classification: General Business Use
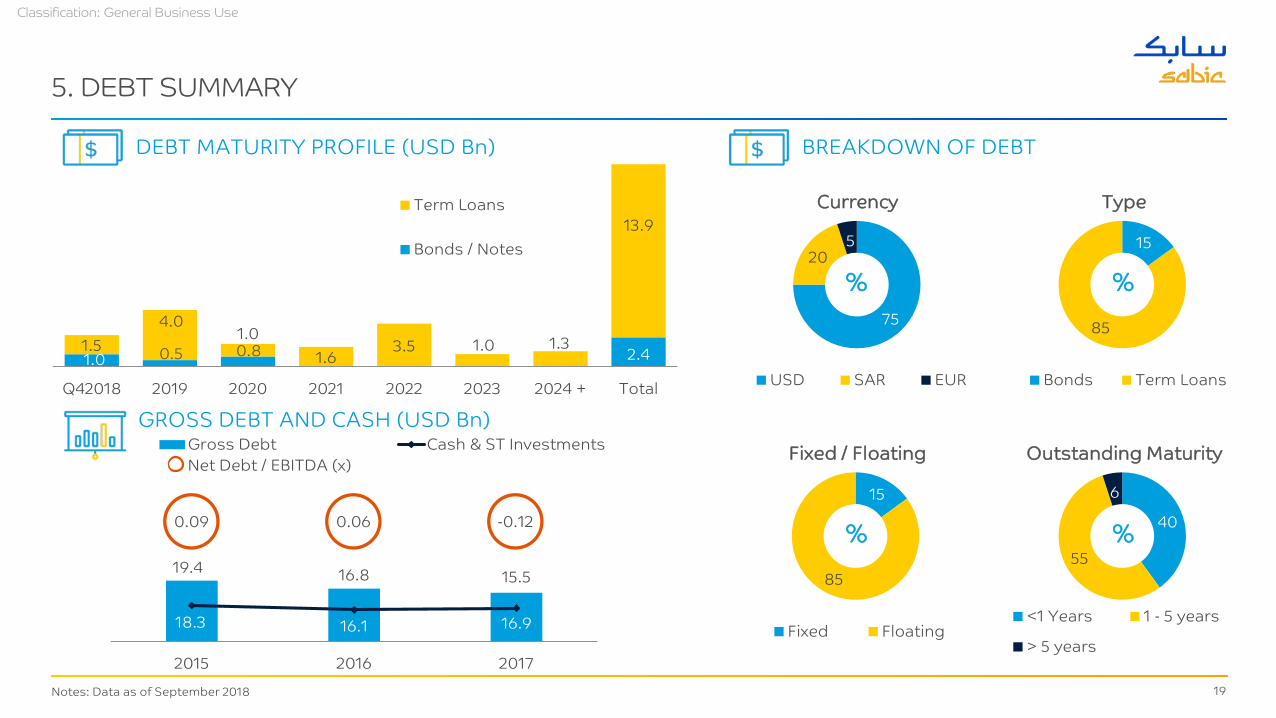
19.4 16.8 15.5
18.3 16.1 16.90.0
5.0
10.0
15.0
20.0
25.0
30.0
35.0
40.0
2015 2016 2017
Gross Debt Cash & ST InvestmentsNet Debt / EBITDA (x)
5. DEBT SUMMARY
Type
15
85
Bonds Term Loans
%
Currency
75
205
USD SAR EUR
%
Fixed / Floating
15
85
Fixed Floating
%
Outstanding Maturity
40
55
6
<1 Years 1 - 5 years
> 5 years
%
DEBT MATURITY PROFILE (USD Bn)
Notes: Data as of September 2018
BREAKDOWN OF DEBT
GROSS DEBT AND CASH (USD Bn)
0.09 0.06 -0.12
1.0 0.5 0.8 2.41.54.0
1.01.6
3.5 1.0 1.3
13.9
Q42018 2019 2020 2021 2022 2023 2024 + Total
Term Loans
Bonds / Notes
20
Classification: General Business Use
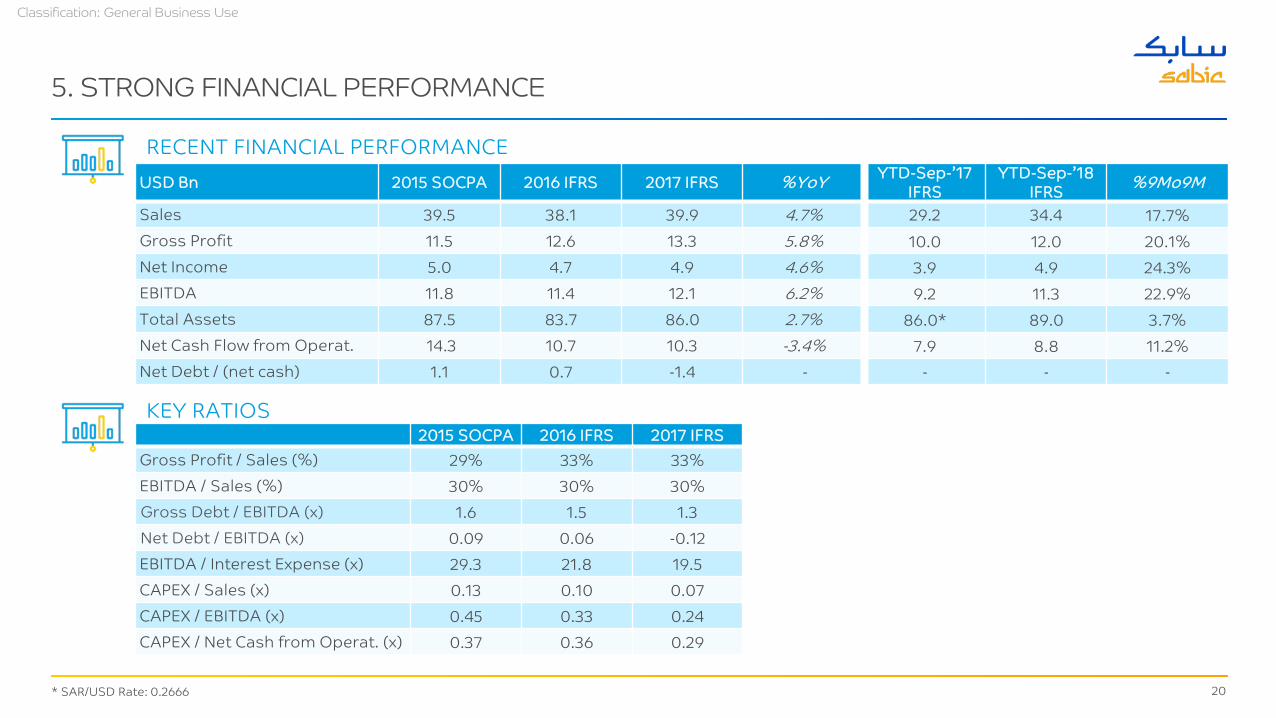
5. STRONG FINANCIAL PERFORMANCE
USD Bn 2015 SOCPA 2016 IFRS 2017 IFRS %YoY YTD-Sep-’17IFRS
YTD-Sep-’18IFRS %9Mo9M
Sales 39.5 38.1 39.9 4.7% 29.2 34.4 17.7%Gross Profit 11.5 12.6 13.3 5.8% 10.0 12.0 20.1%Net Income 5.0 4.7 4.9 4.6% 3.9 4.9 24.3%EBITDA 11.8 11.4 12.1 6.2% 9.2 11.3 22.9%Total Assets 87.5 83.7 86.0 2.7% 86.0* 89.0 3.7%Net Cash Flow from Operat. 14.3 10.7 10.3 -3.4% 7.9 8.8 11.2%Net Debt / (net cash) 1.1 0.7 -1.4 - - - -
* SAR/USD Rate: 0.2666
2015 SOCPA 2016 IFRS 2017 IFRSGross Profit / Sales (%) 29% 33% 33%EBITDA / Sales (%) 30% 30% 30%Gross Debt / EBITDA (x) 1.6 1.5 1.3Net Debt / EBITDA (x) 0.09 0.06 -0.12EBITDA / Interest Expense (x) 29.3 21.8 19.5CAPEX / Sales (x) 0.13 0.10 0.07CAPEX / EBITDA (x) 0.45 0.33 0.24CAPEX / Net Cash from Operat. (x) 0.37 0.36 0.29
RECENT FINANCIAL PERFORMANCE
KEY RATIOS

21
Classification: General Business Use
KEY HIGHLIGHTS
1. Market Leader in Multiple Products and Segments
2. Diversified Global Footprint
3. Cost Leadership and Operational Excellence
4. Strategic, Strong and Stable Alliances
5. Robust Financial Profile, Dividend and Stock Performance
THANK YOU