Embed Size (px)
Citation preview

Quilter Basic Brand Guidelines Our brand assets 1
Winter 2020
Investor presentation

Investment overview and Quilter’s journey to date
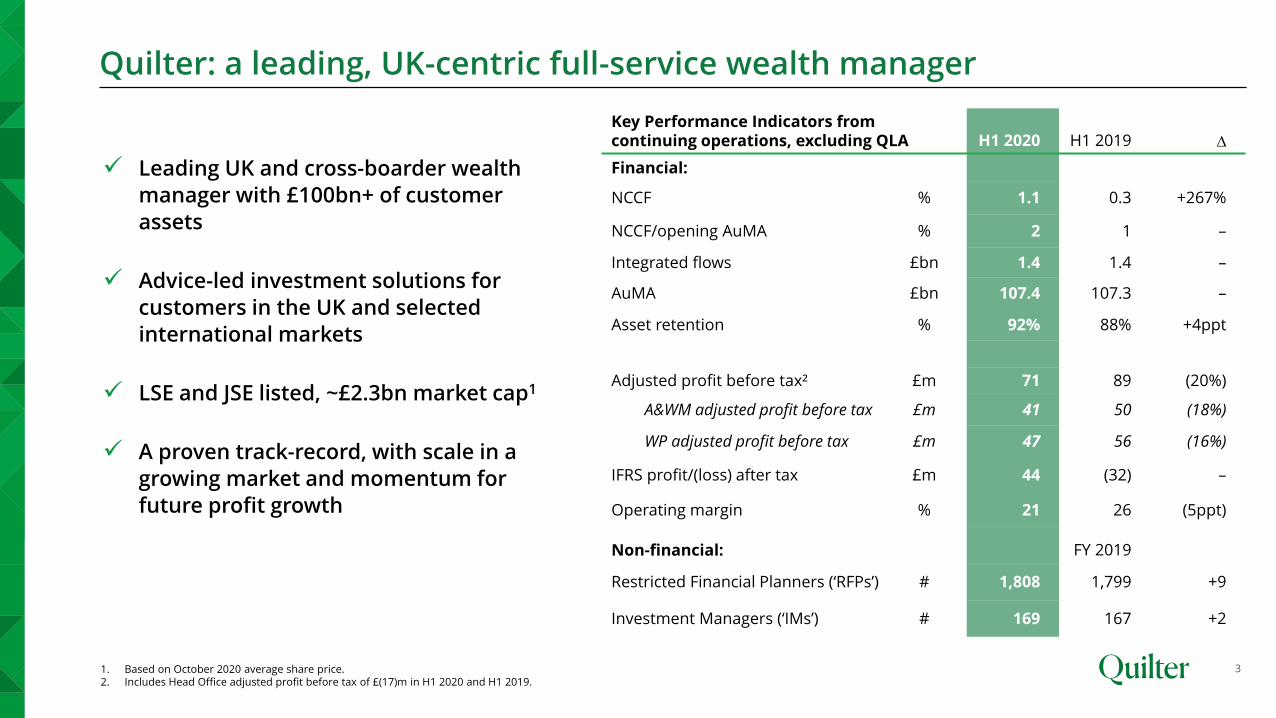
Quilter: a leading, UK-centric full-service wealth manager
3
✓ Leading UK and cross-boarder wealth
manager with £100bn+ of customer
assets
✓ Advice-led investment solutions for
customers in the UK and selected
international markets
✓ LSE and JSE listed, ~£2.3bn market cap1
✓ A proven track-record, with scale in a
growing market and momentum for
future profit growth
1. Based on October 2020 average share price.2. Includes Head Office adjusted profit before tax of £(17)m in H1 2020 and H1 2019.
Key Performance Indicators from continuing operations, excluding QLA H1 2020 H1 2019 ∆
Financial:
NCCF % 1.1 0.3 +267%
NCCF/opening AuMA % 2 1 –
Integrated flows £bn 1.4 1.4 –
AuMA £bn 107.4 107.3 –
Asset retention % 92% 88% +4ppt
Adjusted profit before tax² £m 71 89 (20%)
A&WM adjusted profit before tax £m 41 50 (18%)
WP adjusted profit before tax £m 47 56 (16%)
IFRS profit/(loss) after tax £m 44 (32) –
Operating margin % 21 26 (5ppt)
Non-financial: FY 2019
Restricted Financial Planners (‘RFPs’) # 1,808 1,799 +9
Investment Managers (‘IMs’) # 169 167 +2
1. Includes closing AuA and / or closing AuM for competitors as at 30 June 2020, Standard Life Aberdeen and Brewin as at 30 June 2020.2. Quilter and SJP figures as at 30 June 2020; SLA as quoted in its 2019 Annual Report and Accounts; HL and BRW figures as quoted in FT Top 100 financial advisers 30 June 2018 which includes all CF30’s, not only financial
advisers. 3. Total Quilter closing AuMA includes intra-group eliminations.4. Platform & Wealth-only assets total £84.4bn as at 30 June 2020.
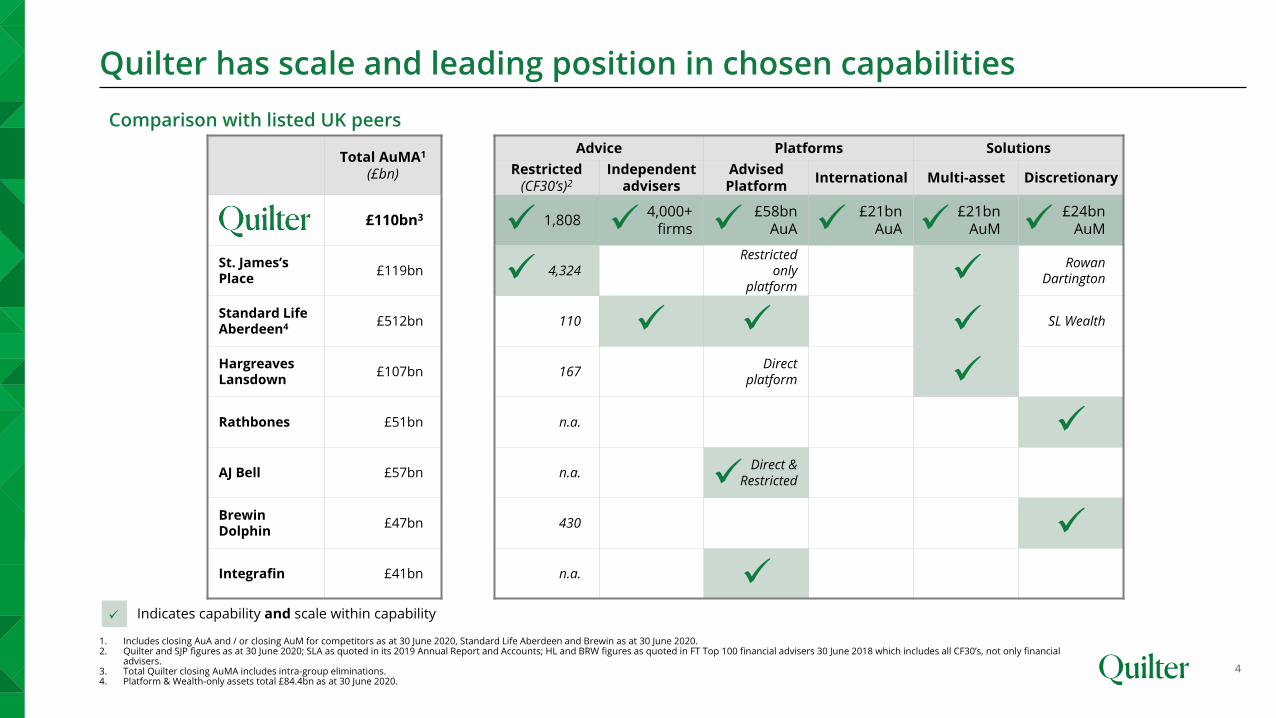
Quilter has scale and leading position in chosen capabilities
Total AuMA1
(£bn)
Advice Platforms Solutions
Restricted(CF30’s)2
Independent advisers
Advised Platform
International Multi-asset Discretionary
£110bn3 1,8084,000+
firms£58bn
AuA£21bn
AuA£21bn
AuM£24bn
AuM
St. James’sPlace
£119bn 4,324Restricted
onlyplatform
Rowan Dartington
Standard Life Aberdeen4 £512bn 110 SL Wealth
HargreavesLansdown
£107bn 167Direct
platform
Rathbones £51bn n.a.
AJ Bell £57bn n.a.Direct &
Restricted
Brewin Dolphin
£47bn 430
Integrafin £41bn n.a.
✓ Indicates capability and scale within capability
✓ ✓ ✓
✓
✓
✓
✓
✓
✓
✓
✓
✓
✓
✓
Comparison with listed UK peers
✓
✓
4
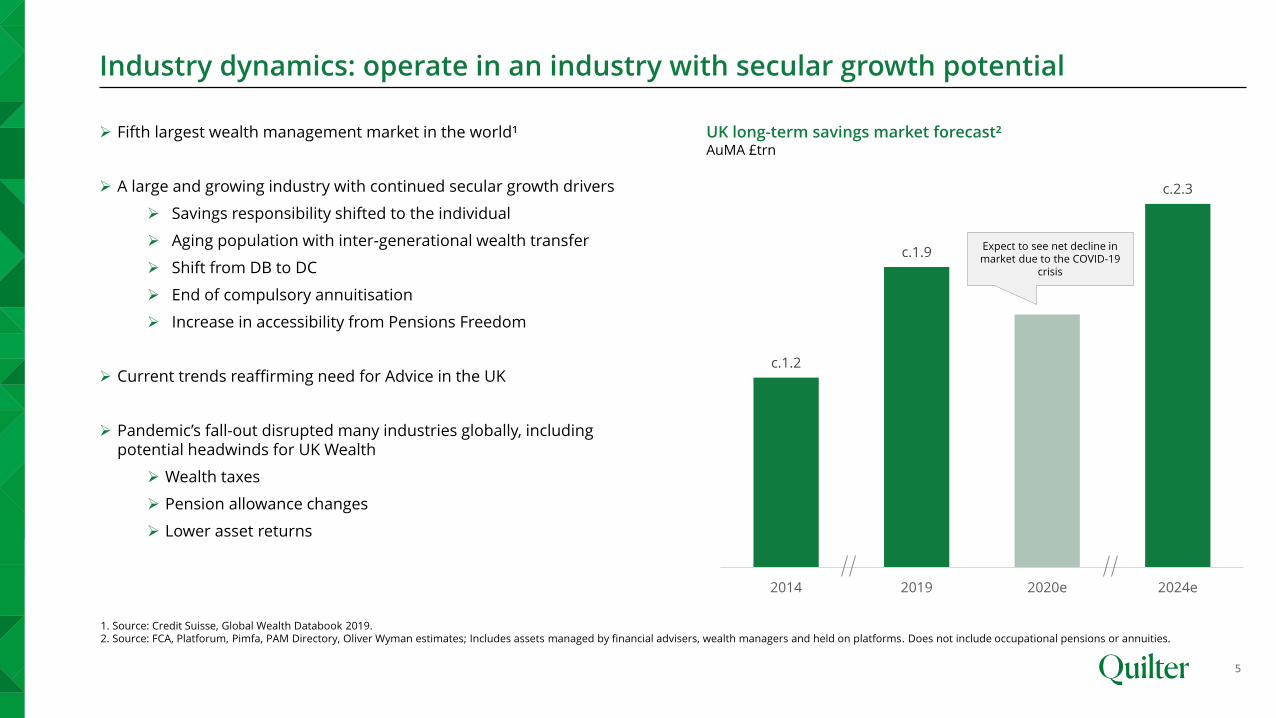
Industry dynamics: operate in an industry with secular growth potential
5
➢ Fifth largest wealth management market in the world¹
➢ A large and growing industry with continued secular growth drivers
➢ Savings responsibility shifted to the individual
➢ Aging population with inter-generational wealth transfer
➢ Shift from DB to DC
➢ End of compulsory annuitisation
➢ Increase in accessibility from Pensions Freedom
➢ Current trends reaffirming need for Advice in the UK
➢ Pandemic’s fall-out disrupted many industries globally, including potential headwinds for UK Wealth
➢ Wealth taxes
➢ Pension allowance changes
➢ Lower asset returns
c.1.2
c.1.9
c.2.3
2014 2019 2020e 2024e
1. Source: Credit Suisse, Global Wealth Databook 2019.2. Source: FCA, Platforum, Pimfa, PAM Directory, Oliver Wyman estimates; Includes assets managed by financial advisers, wealth managers and held on platforms. Does not include occupational pensions or annuities.
UK long-term savings market forecast²AuMA £trn
Expect to see net decline in market due to the COVID-19
crisis
0
2
4
6
8
10
12
Q1 Q2 Q3 Q4 Q1 Q2 Q3 Q4 Q1 Q2 Q3 Q4 Q1 Q2 Q3 Q4 Q1 Q2 Q3 Q4 Q1 Q2 Q3 Q4 Q1 Q2 Q3 Q4 Q1 Q2 Q3 Q4 Q1 Q2 Q3 Q4 Q1 Q2
Retail advised sales¹ FTSE All Share
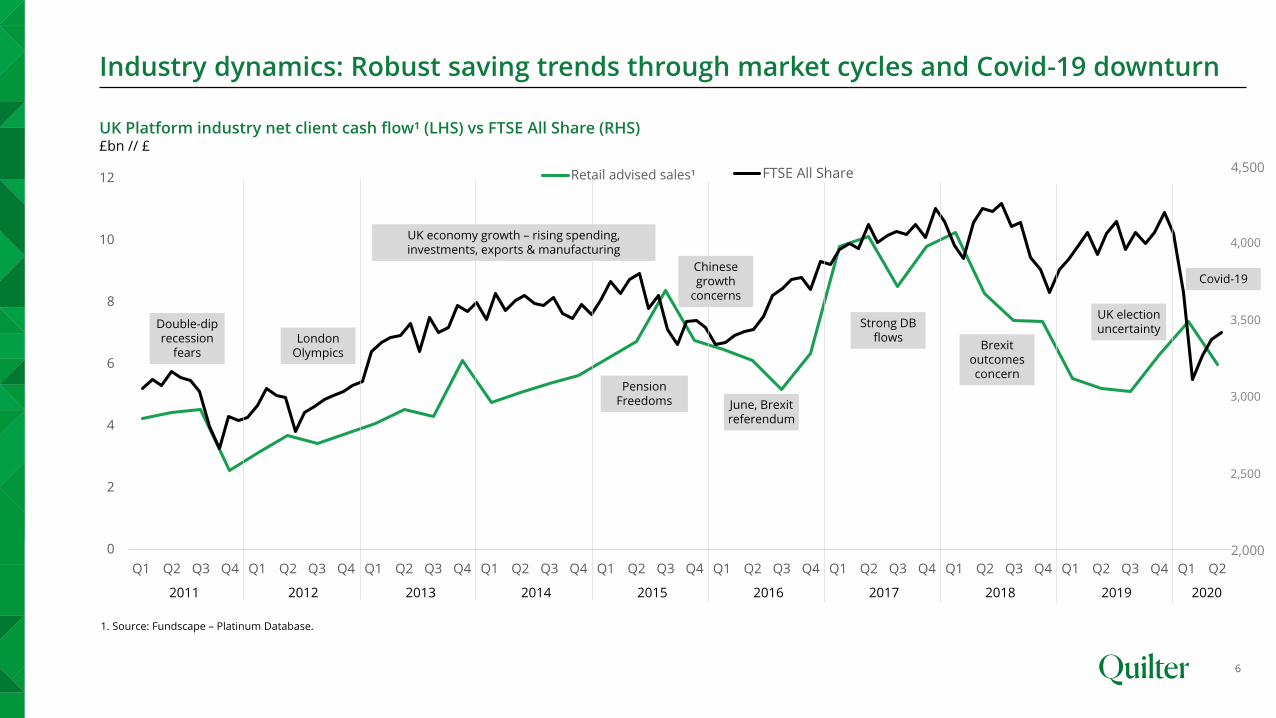
Industry dynamics: Robust saving trends through market cycles and Covid-19 downturn
6
1. Source: Fundscape – Platinum Database.
UK Platform industry net client cash flow¹ (LHS) vs FTSE All Share (RHS)£bn // £
2011 2012 2013 2014 2015 2016 2017 2018 2019 2020
June, Brexit referendum
Brexit outcomes concern
Covid-19
Double-dip recession
fears
4,000
4,500
3,500
3,000
2,500
2,000
UK election uncertainty
Chinese growth
concerns
London Olympics
UK economy growth – rising spending, investments, exports & manufacturing
Strong DB flows
Pension Freedoms
25 30 35 40 45 50 55 60 65 70 75 80 85 90
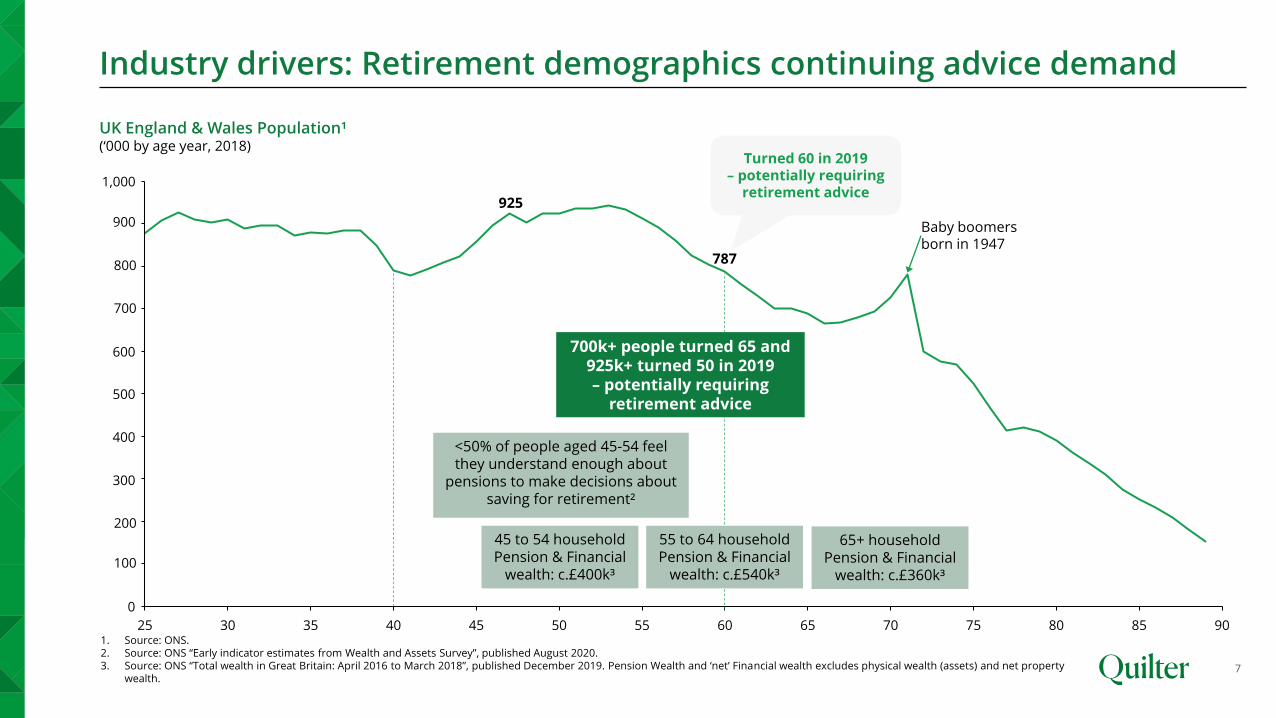
Industry drivers: Retirement demographics continuing advice demand
7
200
500
600
100
0
300
700
400
800
900
1,000
925
787
UK England & Wales Population¹(‘000 by age year, 2018)
Baby boomers born in 1947
1. Source: ONS.2. Source: ONS “Early indicator estimates from Wealth and Assets Survey”, published August 2020.3. Source: ONS “Total wealth in Great Britain: April 2016 to March 2018”, published December 2019. Pension Wealth and ‘net’ Financial wealth excludes physical wealth (assets) and net property
wealth.
Turned 60 in 2019– potentially requiring
retirement advice
<50% of people aged 45-54 feel they understand enough about
pensions to make decisions about saving for retirement²
700k+ people turned 65 and 925k+ turned 50 in 2019 – potentially requiring
retirement advice
45 to 54 household Pension & Financial
wealth: c.£400k³
55 to 64 household Pension & Financial
wealth: c.£540k³
65+ household Pension & Financial
wealth: c.£360k³
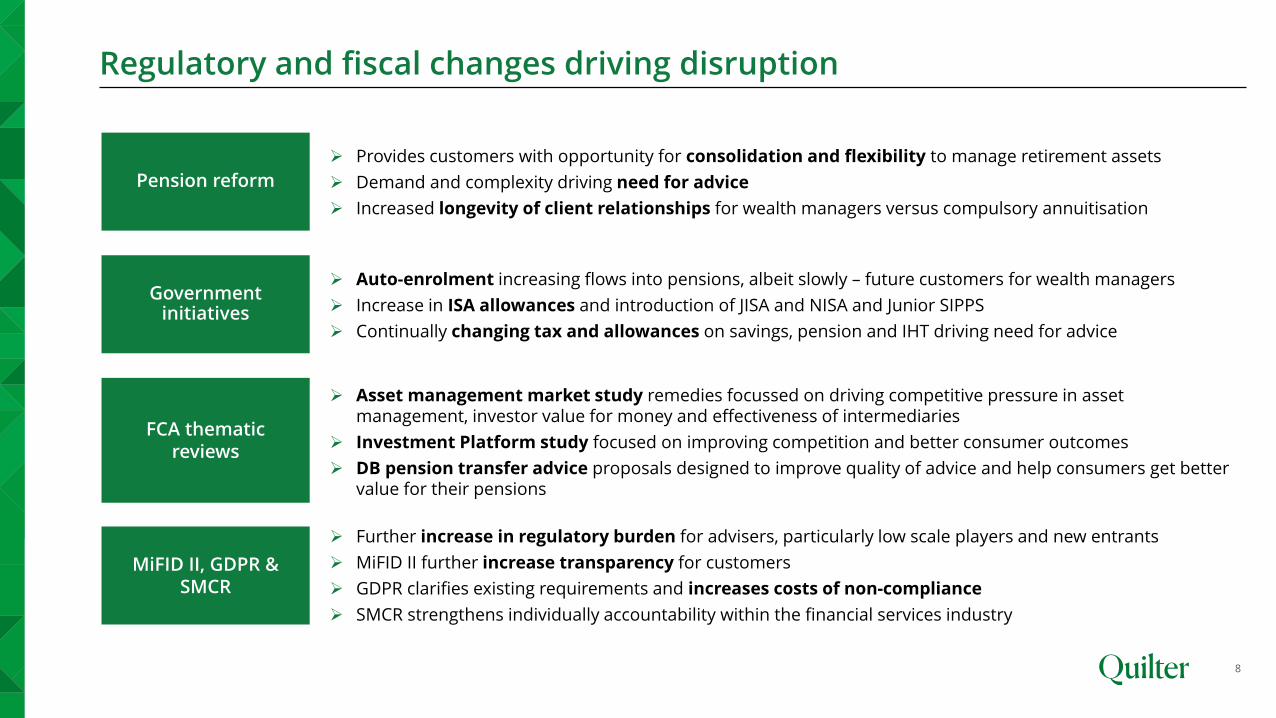
Regulatory and fiscal changes driving disruption
8
Pension reform
➢ Provides customers with opportunity for consolidation and flexibility to manage retirement assets
➢ Demand and complexity driving need for advice
➢ Increased longevity of client relationships for wealth managers versus compulsory annuitisation
Government initiatives
➢ Auto-enrolment increasing flows into pensions, albeit slowly – future customers for wealth managers
➢ Increase in ISA allowances and introduction of JISA and NISA and Junior SIPPS
➢ Continually changing tax and allowances on savings, pension and IHT driving need for advice
FCA thematic reviews
➢ Asset management market study remedies focussed on driving competitive pressure in asset management, investor value for money and effectiveness of intermediaries
➢ Investment Platform study focused on improving competition and better consumer outcomes
➢ DB pension transfer advice proposals designed to improve quality of advice and help consumers get better value for their pensions
MiFID II, GDPR & SMCR
➢ Further increase in regulatory burden for advisers, particularly low scale players and new entrants
➢ MiFID II further increase transparency for customers
➢ GDPR clarifies existing requirements and increases costs of non-compliance
➢ SMCR strengthens individually accountability within the financial services industry
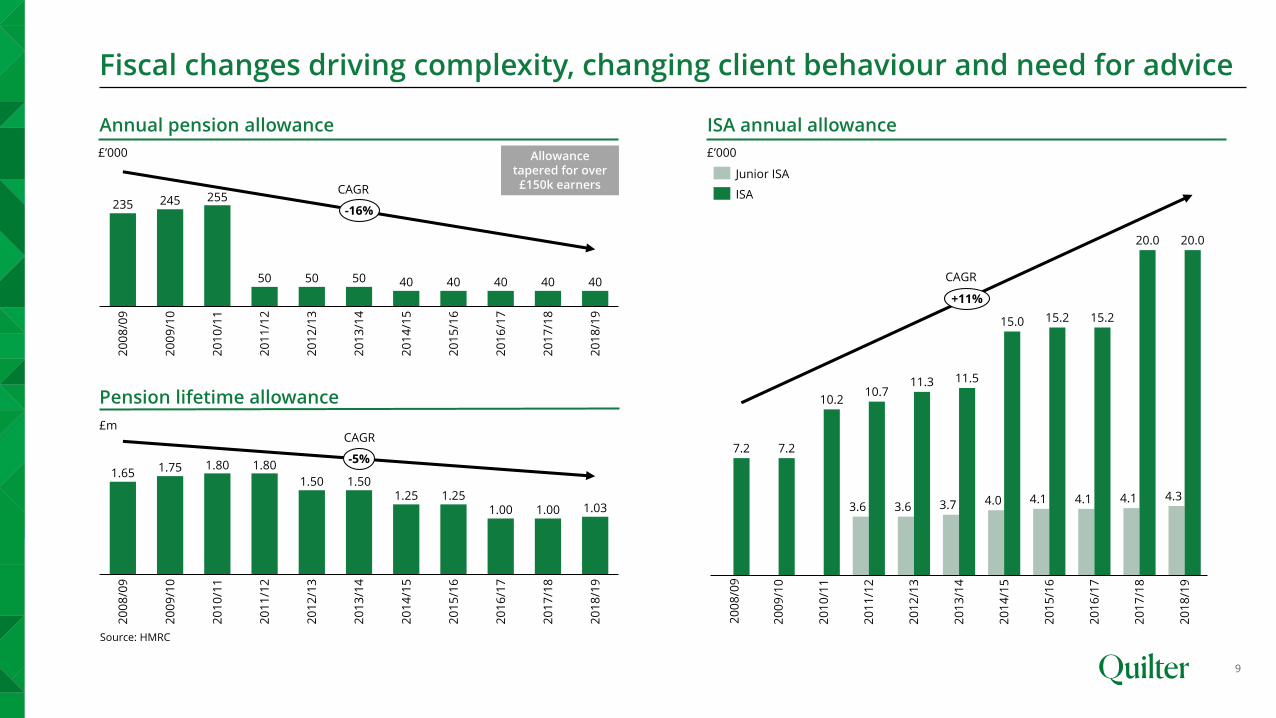
Fiscal changes driving complexity, changing client behaviour and need for advice
9
Source: HMRC
Annual pension allowance
Pension lifetime allowance
1.65 1.75 1.80 1.80
1.50 1.501.25 1.25
1.00 1.00 1.03
20
12
/13
20
09
/10
20
14
/15
20
08
/09
20
13
/14
20
15
/16
20
10
/11
20
11
/12
20
16
/17
20
17
/18
20
18
/19
-5%
ISA annual allowance
235 245 255
50 50 50 40 40 40 40 40
20
13
/14
20
08
/09
20
12
/13
20
09
/10
20
10
/11
20
15
/16
20
11
/12
20
14
/15
20
16
/17
20
17
/18
20
18
/19
-16%
15.2
20
09
/10
20
13
/14
4.1
20
10
/11
20
14
/15
3.6
20
12
/13
20
11
/12
20
15
/16
20
16
/17
11.3
20
17
/18
20
18
/19
4.3
20.0
20
08
/09
7.27.2
10.210.7
3.6 3.7
11.5
4.0
15.0 15.2
4.1 4.1
20.0
+11%
Junior ISA
ISA
Allowance tapered for over
£150k earners
£m
£’000 £’000
CAGR
CAGR
CAGR
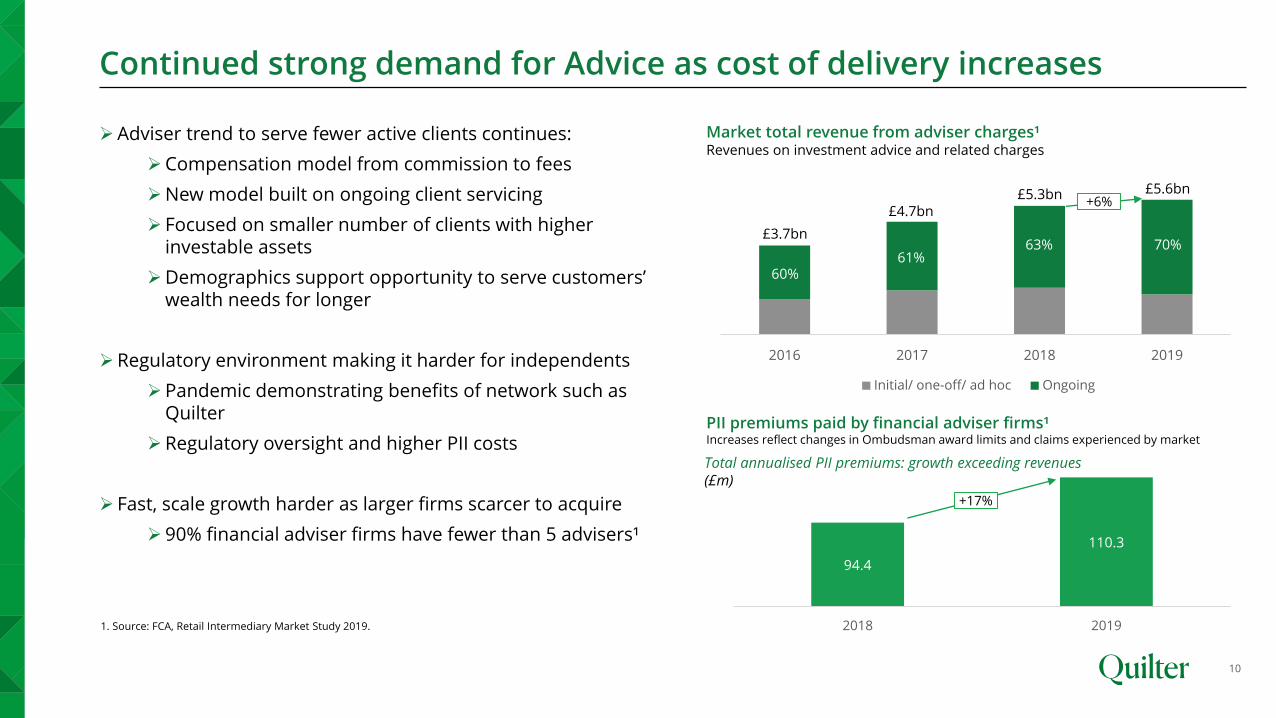
Continued strong demand for Advice as cost of delivery increases
10
➢Adviser trend to serve fewer active clients continues:
➢Compensation model from commission to fees
➢New model built on ongoing client servicing
➢ Focused on smaller number of clients with higher investable assets
➢Demographics support opportunity to serve customers’ wealth needs for longer
➢Regulatory environment making it harder for independents
➢Pandemic demonstrating benefits of network such as Quilter
➢Regulatory oversight and higher PII costs
➢ Fast, scale growth harder as larger firms scarcer to acquire
➢ 90% financial adviser firms have fewer than 5 advisers¹
Market total revenue from adviser charges¹Revenues on investment advice and related charges
2016 2017 2018 2019
Initial/ one-off/ ad hoc Ongoing
1. Source: FCA, Retail Intermediary Market Study 2019.
£3.7bn
£4.7bn£5.3bn £5.6bn
60%61%
63% 70%
PII premiums paid by financial adviser firms¹Increases reflect changes in Ombudsman award limits and claims experienced by market
94.4
110.3
2018 2019
Total annualised PII premiums: growth exceeding revenues(£m)
+17%
+6%
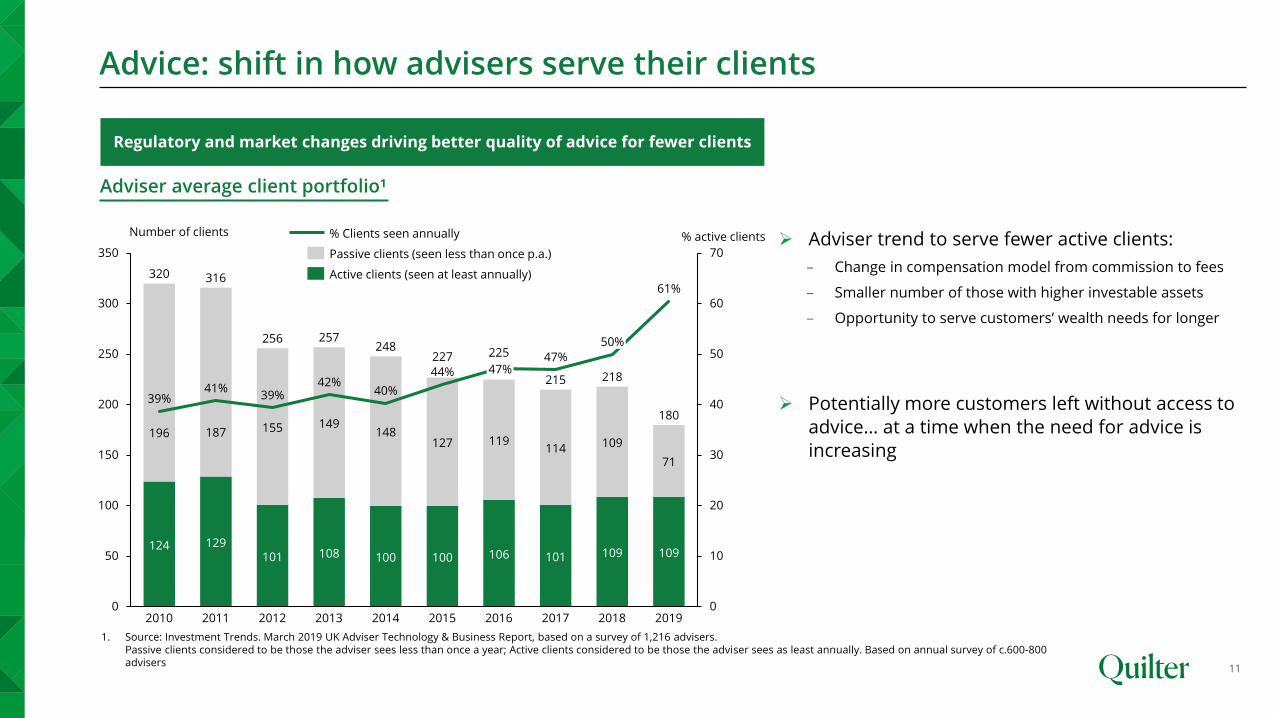
Advice: shift in how advisers serve their clients
11
Adviser average client portfolio¹
Number of clients
Regulatory and market changes driving better quality of advice for fewer clients
1. Source: Investment Trends. March 2019 UK Adviser Technology & Business Report, based on a survey of 1,216 advisers.Passive clients considered to be those the adviser sees less than once a year; Active clients considered to be those the adviser sees as least annually. Based on annual survey of c.600-800 advisers
➢ Adviser trend to serve fewer active clients:
– Change in compensation model from commission to fees
– Smaller number of those with higher investable assets
– Opportunity to serve customers’ wealth needs for longer
➢ Potentially more customers left without access to
advice… at a time when the need for advice is
increasing
124 129101 108 100 100 106 101 109 109
196 187 155 149148
127 119114 109
71
0
10
20
30
40
50
60
70
0
50
100
150
200
250
300
350
225227
2013
47%
41%
2010
42%
39%
248
44%
2011
39%
20152012
40%
2014
47%
2016 2017
50%257
2018
61%
2019
320 316
256
215
180
218
% Clients seen annually
Passive clients (seen less than once p.a.)
Active clients (seen at least annually)
% active clients
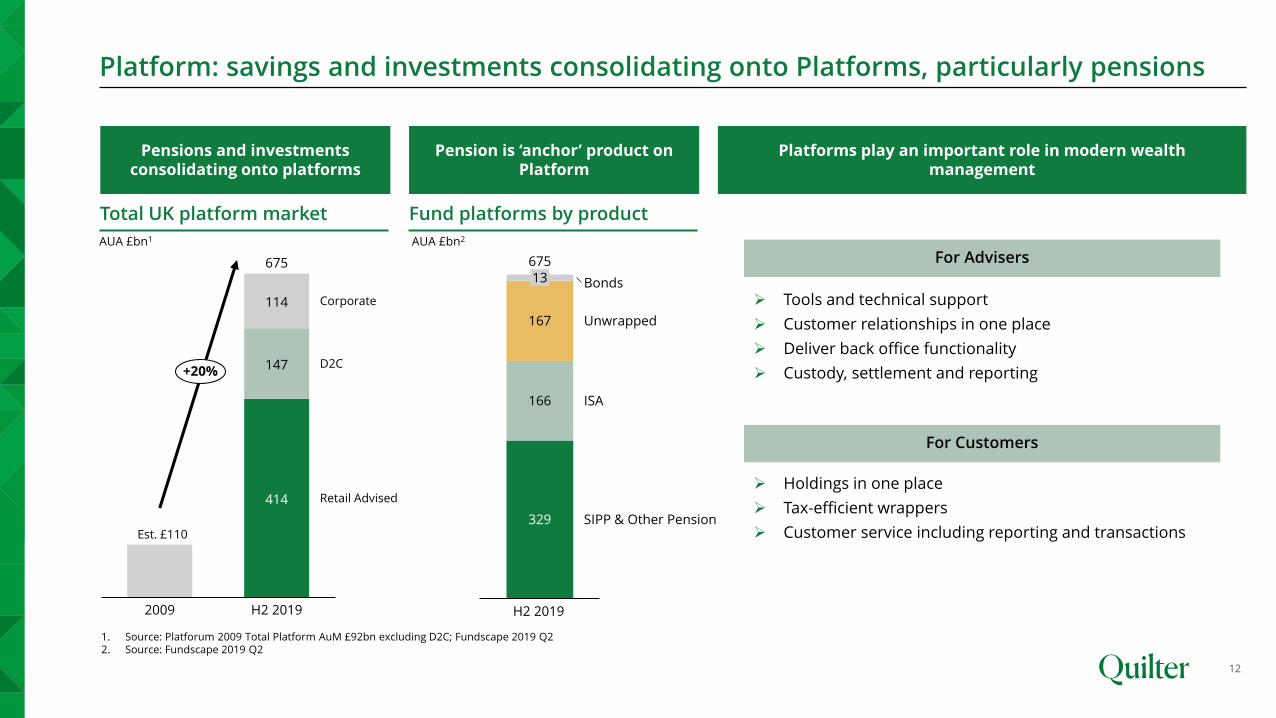
Platform: savings and investments consolidating onto Platforms, particularly pensions
12
Total UK platform market
AUA £bn1
Pensions and investmentsconsolidating onto platforms
1. Source: Platforum 2009 Total Platform AuM £92bn excluding D2C; Fundscape 2019 Q22. Source: Fundscape 2019 Q2
Platforms play an important role in modern wealth management
For Customers
For Advisers
➢ Holdings in one place
➢ Tax-efficient wrappers
➢ Customer service including reporting and transactions
➢ Tools and technical support
➢ Customer relationships in one place
➢ Deliver back office functionality
➢ Custody, settlement and reporting
Pension is ‘anchor’ product on Platform
Fund platforms by product
AUA £bn2
Unwrapped167
13
166
329
Bonds
ISA
SIPP & Other Pension
675
414
147
114
2009 H2 2019
675
Corporate
Retail Advised
D2C+20%
Est. £110
H2 2019
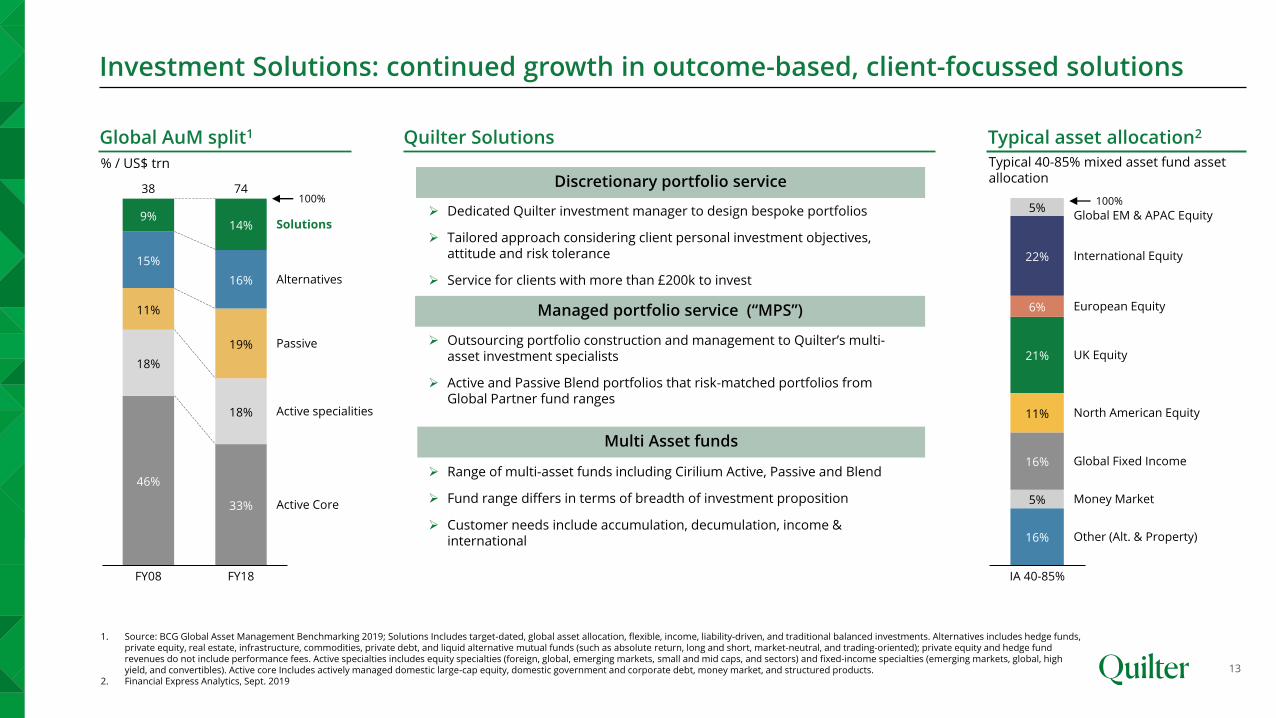
Investment Solutions: continued growth in outcome-based, client-focussed solutions
13
46%
33%
18%
18%
11%
19%
15%
16%
9%14%
FY08
Passive
FY18
Solutions
Active specialities
Alternatives
Active Core
100%38 74
1. Source: BCG Global Asset Management Benchmarking 2019; Solutions Includes target-dated, global asset allocation, flexible, income, liability-driven, and traditional balanced investments. Alternatives includes hedge funds, private equity, real estate, infrastructure, commodities, private debt, and liquid alternative mutual funds (such as absolute return, long and short, market-neutral, and trading-oriented); private equity and hedge fund revenues do not include performance fees. Active specialties includes equity specialties (foreign, global, emerging markets, small and mid caps, and sectors) and fixed-income specialties (emerging markets, global, high yield, and convertibles). Active core Includes actively managed domestic large-cap equity, domestic government and corporate debt, money market, and structured products.
2. Financial Express Analytics, Sept. 2019
Global AuM split1
Discretionary portfolio service
➢ Dedicated Quilter investment manager to design bespoke portfolios
➢ Tailored approach considering client personal investment objectives, attitude and risk tolerance
➢ Service for clients with more than £200k to invest
➢ Outsourcing portfolio construction and management to Quilter’s multi-asset investment specialists
➢ Active and Passive Blend portfolios that risk-matched portfolios from Global Partner fund ranges
Managed portfolio service (“MPS”)
Multi Asset funds
➢ Range of multi-asset funds including Cirilium Active, Passive and Blend
➢ Fund range differs in terms of breadth of investment proposition
➢ Customer needs include accumulation, decumulation, income & international
% / US$ trn
16%
5%
16%
11%
21%
6%
22%
5%
European Equity
IA 40-85%
North American Equity
International Equity
Global EM & APAC Equity
Global Fixed Income
UK Equity
100%
Money Market
Other (Alt. & Property)
Typical asset allocation2
Typical 40-85% mixed asset fund asset allocation
Quilter Solutions
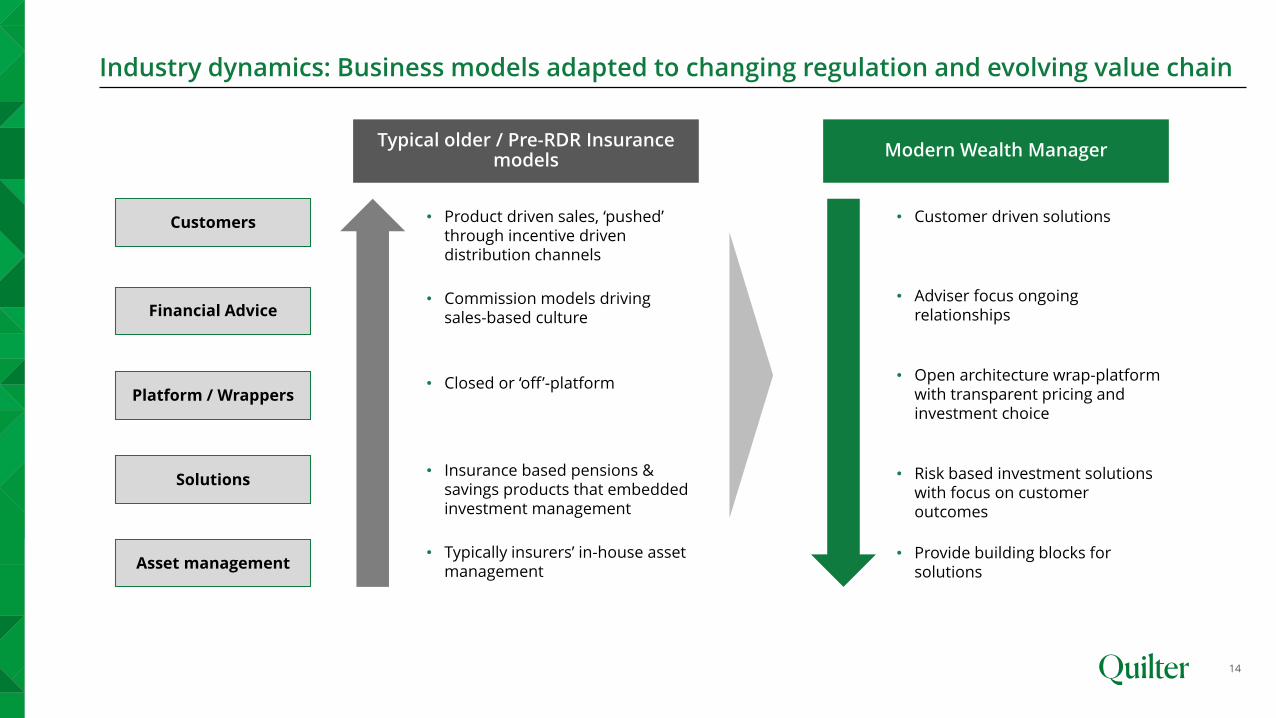
Industry dynamics: Business models adapted to changing regulation and evolving value chain
14
Customers
Financial Advice
Typical older / Pre-RDR Insurance models
Modern Wealth Manager
Platform / Wrappers
Solutions
Asset management
• Product driven sales, ‘pushed’ through incentive driven distribution channels
• Commission models driving sales-based culture
• Closed or ‘off’-platform
• Insurance based pensions & savings products that embedded investment management
• Typically insurers’ in-house asset management
• Customer driven solutions
• Adviser focus ongoing relationships
• Open architecture wrap-platform with transparent pricing and investment choice
• Risk based investment solutions with focus on customer outcomes
• Provide building blocks for solutions
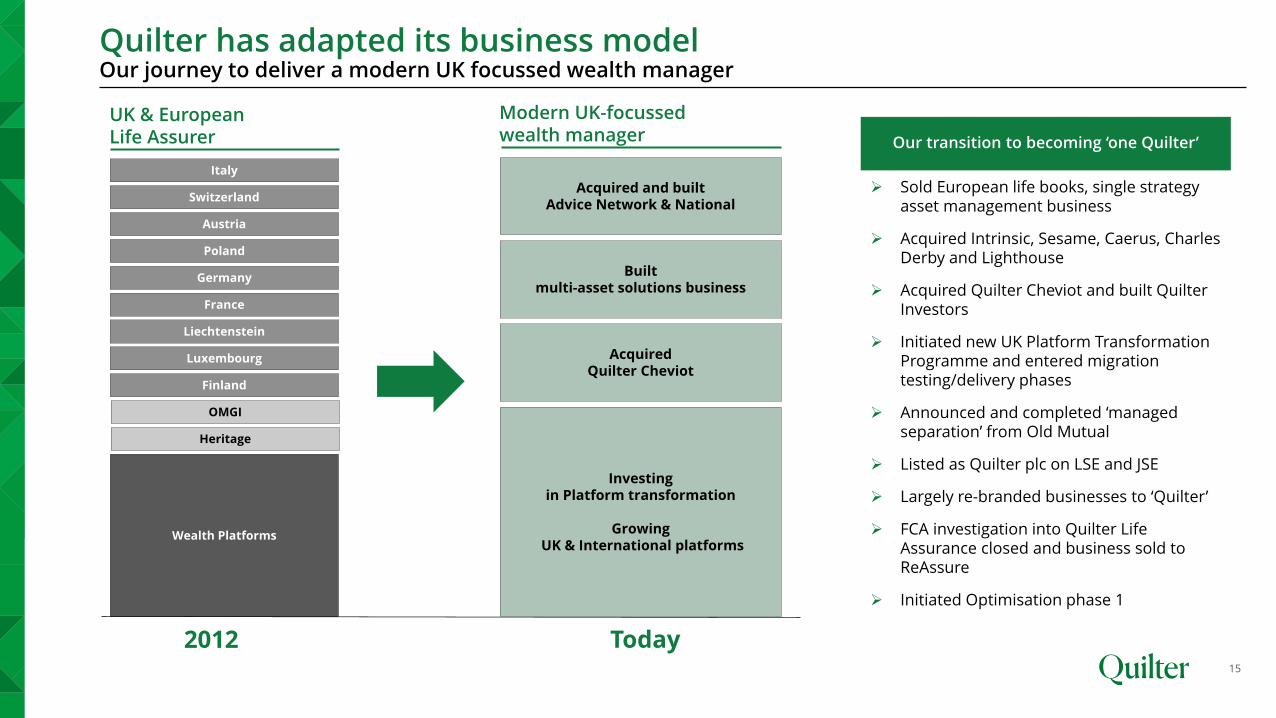
Quilter has adapted its business modelOur journey to deliver a modern UK focussed wealth manager
15
Wealth Platforms
OMGI
Luxembourg
Liechtenstein
France
Germany
Poland
Italy
Switzerland
Austria
Acquired and built Advice Network & National
Acquired Quilter Cheviot
Built multi-asset solutions business
Investing in Platform transformation
GrowingUK & International platforms
Finland
Today2012
UK & European Life Assurer
Modern UK-focussed wealth manager Our transition to becoming ‘one Quilter’
➢ Sold European life books, single strategy asset management business
➢ Acquired Intrinsic, Sesame, Caerus, Charles Derby and Lighthouse
➢ Acquired Quilter Cheviot and built Quilter Investors
➢ Initiated new UK Platform Transformation Programme and entered migration testing/delivery phases
➢ Announced and completed ‘managed separation’ from Old Mutual
➢ Listed as Quilter plc on LSE and JSE
➢ Largely re-branded businesses to ‘Quilter’
➢ FCA investigation into Quilter Life Assurance closed and business sold to ReAssure
➢ Initiated Optimisation phase 1
Heritage
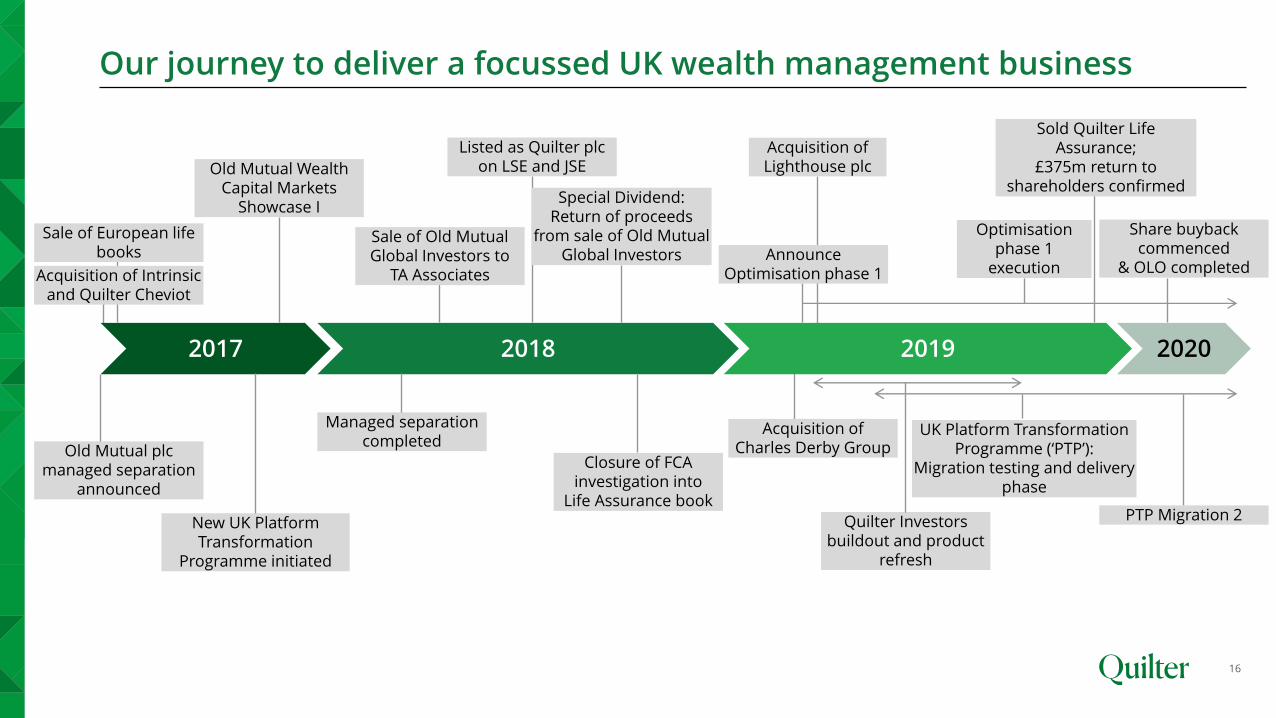
Acquisition of Lighthouse plc
Our journey to deliver a focussed UK wealth management business
16
2017 20192018 2020
Old Mutual plc managed separation
announced
Old Mutual Wealth Capital Markets
Showcase I
Managed separation completed
Listed as Quilter plc on LSE and JSE
Special Dividend: Return of proceeds
from sale of Old Mutual Global Investors
Sale of Old Mutual Global Investors to
TA Associates
Closure of FCA investigation into
Life Assurance book
Announce Optimisation phase 1
UK Platform Transformation Programme (‘PTP’):
Migration testing and delivery phase
Acquisition of Charles Derby Group
Optimisation phase 1
execution
Sale of European life books
Acquisition of Intrinsic and Quilter Cheviot
Sold Quilter Life Assurance;
£375m return to shareholders confirmed
Quilter Investors buildout and product
refresh
New UK Platform Transformation
Programme initiated
PTP Migration 2
Share buyback commenced
& OLO completed
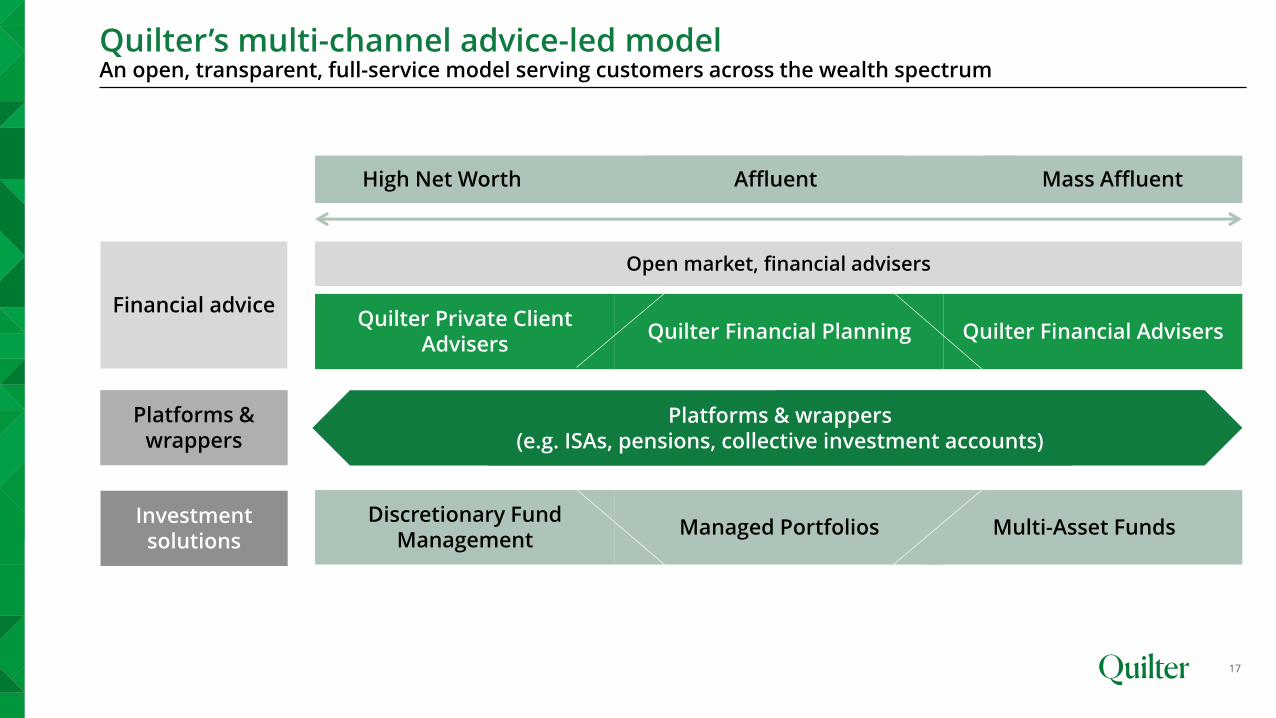
Quilter’s multi-channel advice-led modelAn open, transparent, full-service model serving customers across the wealth spectrum
High Net Worth Mass Affluent
Financial advice
Affluent
Quilter Private Client Advisers
Investment solutions
Open market, financial advisers
Quilter Financial AdvisersQuilter Financial Planning
Platforms & wrappers
Discretionary Fund Management
Multi-Asset FundsManaged Portfolios
17
Platforms & wrappers(e.g. ISAs, pensions, collective investment accounts)
Quilter Cheviot
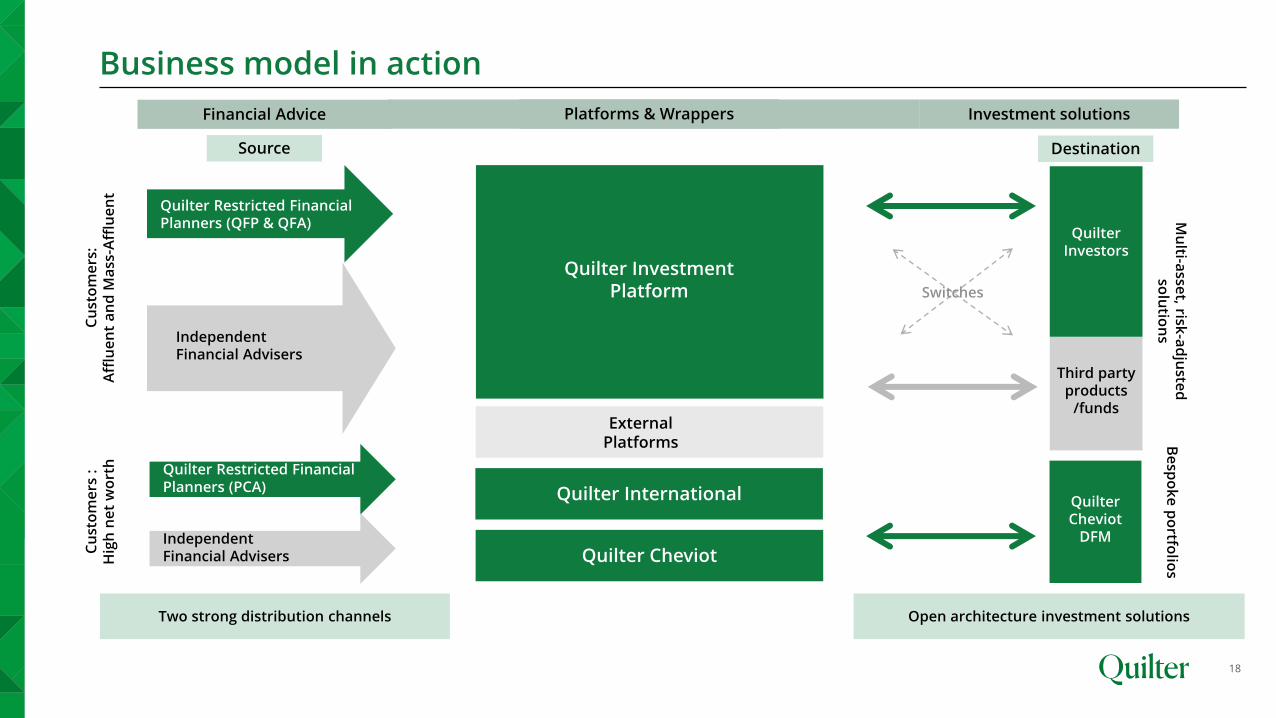
Business model in action
18
Two strong distribution channels Open architecture investment solutions
Source
Quilter Investment Platform
Cu
sto
me
rs:
Aff
lue
nt
an
d M
ass
-Aff
lue
nt
Cu
sto
me
rs :
H
igh
ne
t w
ort
h
Quilter Investors
Third party products
/funds
Switches
Destination
Independent Financial Advisers
Quilter Restricted Financial Planners (QFP & QFA)
Quilter International
Quilter Restricted Financial Planners (PCA)
Independent Financial Advisers
Quilter Cheviot
DFM
Mu
lti-asse
t, risk-a
dju
sted
so
lutio
ns
Be
spo
ke
po
rtfolio
s
External Platforms
Financial Advice Investment solutionsPlatforms & Wrappers

Performance
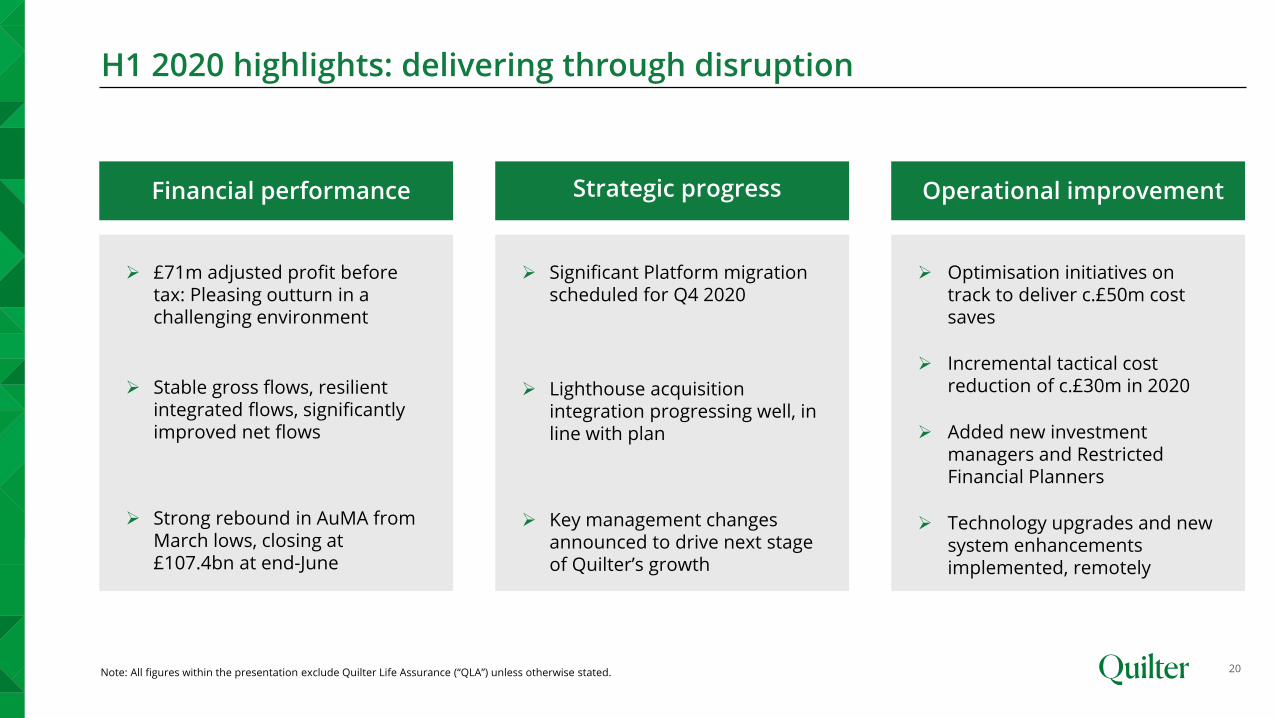
H1 2020 highlights: delivering through disruption
20Note: All figures within the presentation exclude Quilter Life Assurance (“QLA”) unless otherwise stated.
Financial performance
➢ £71m adjusted profit before tax: Pleasing outturn in a challenging environment
➢ Stable gross flows, resilient integrated flows, significantly improved net flows
➢ Strong rebound in AuMA from March lows, closing at £107.4bn at end-June
Strategic progress Operational improvement
➢ Optimisation initiatives on track to deliver c.£50m cost saves
➢ Incremental tactical cost reduction of c.£30m in 2020
➢ Added new investment managers and Restricted Financial Planners
➢ Technology upgrades and new system enhancements implemented, remotely
➢ Significant Platform migration scheduled for Q4 2020
➢ Lighthouse acquisition integration progressing well, in line with plan
➢ Key management changes announced to drive next stage of Quilter’s growth
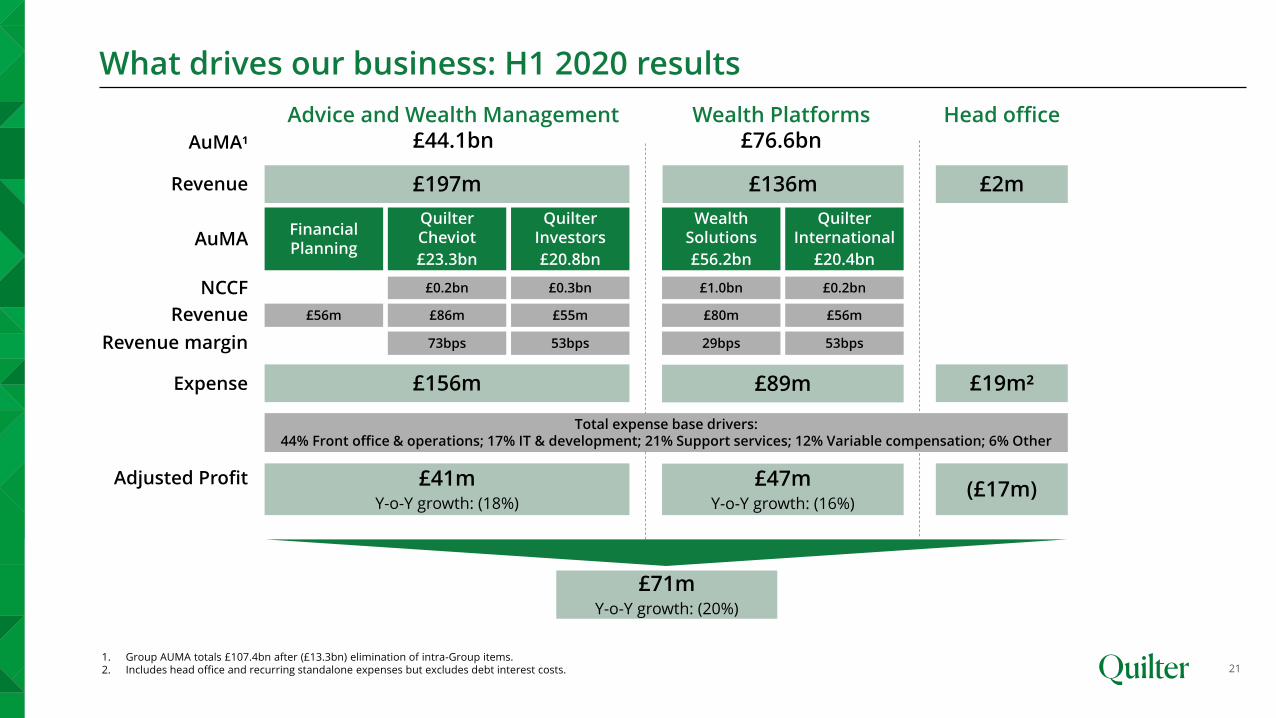
What drives our business: H1 2020 results
21
Financial Planning
£197m £2mRevenue
Advice and Wealth Management£44.1bn
Head office
Quilter Cheviot
£23.3bn
Quilter Investors
£20.8bn
Wealth Solutions
£56.2bn
£136m
Wealth Platforms£76.6bn
Quilter International
£20.4bn
Expense £156m £89m £19m²
Adjusted Profit £41m Y-o-Y growth: (18%)
£47mY-o-Y growth: (16%)
(£17m)
£71mY-o-Y growth: (20%)
1. Group AUMA totals £107.4bn after (£13.3bn) elimination of intra-Group items.2. Includes head office and recurring standalone expenses but excludes debt interest costs.
AuMA
AuMA1
NCCF
Revenue margin
£0.2bn
73bps
£0.3bn
53bps
£1.0bn
29bps
£0.2bn
53bps
£86m £55m £80m £56mRevenue £56m
Total expense base drivers: 44% Front office & operations; 17% IT & development; 21% Support services; 12% Variable compensation; 6% Other
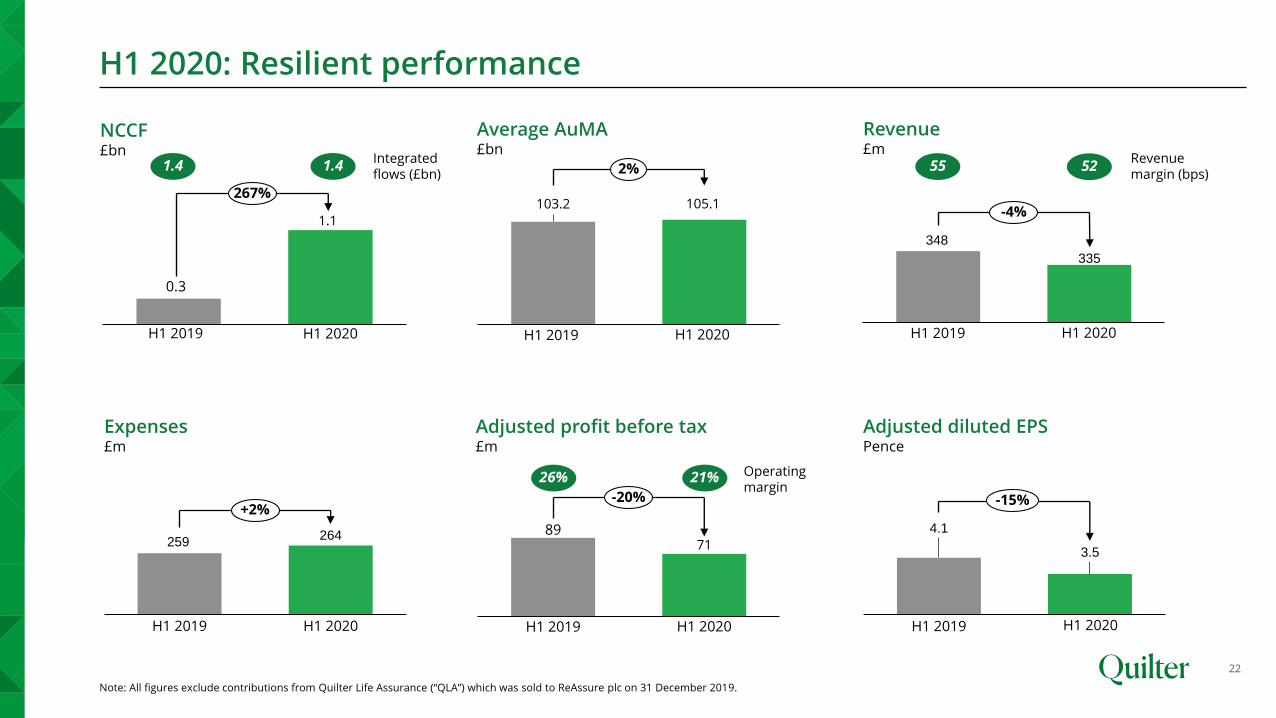
H1 2020: Resilient performance
22
0.3
1.1
H1 2019 H1 2020
267%
NCCF£bn
103.2 105.1
H1 2019 H1 2020
2%
Revenue£m
4.1
3.5
H1 2019 H1 2020
-15%
Adjusted diluted EPSPence
8971
H1 2019 H1 2020
-20%
Average AuMA£bn
Adjusted profit before tax£m
348
335
H1 2019 H1 2020
-4%
259264
H1 2019 H1 2020
+2%
Expenses£m
26% 21% Operating margin
55 52Revenue margin (bps)
1.4 1.4Integrated flows (£bn)
Note: All figures exclude contributions from Quilter Life Assurance (“QLA”) which was sold to ReAssure plc on 31 December 2019.
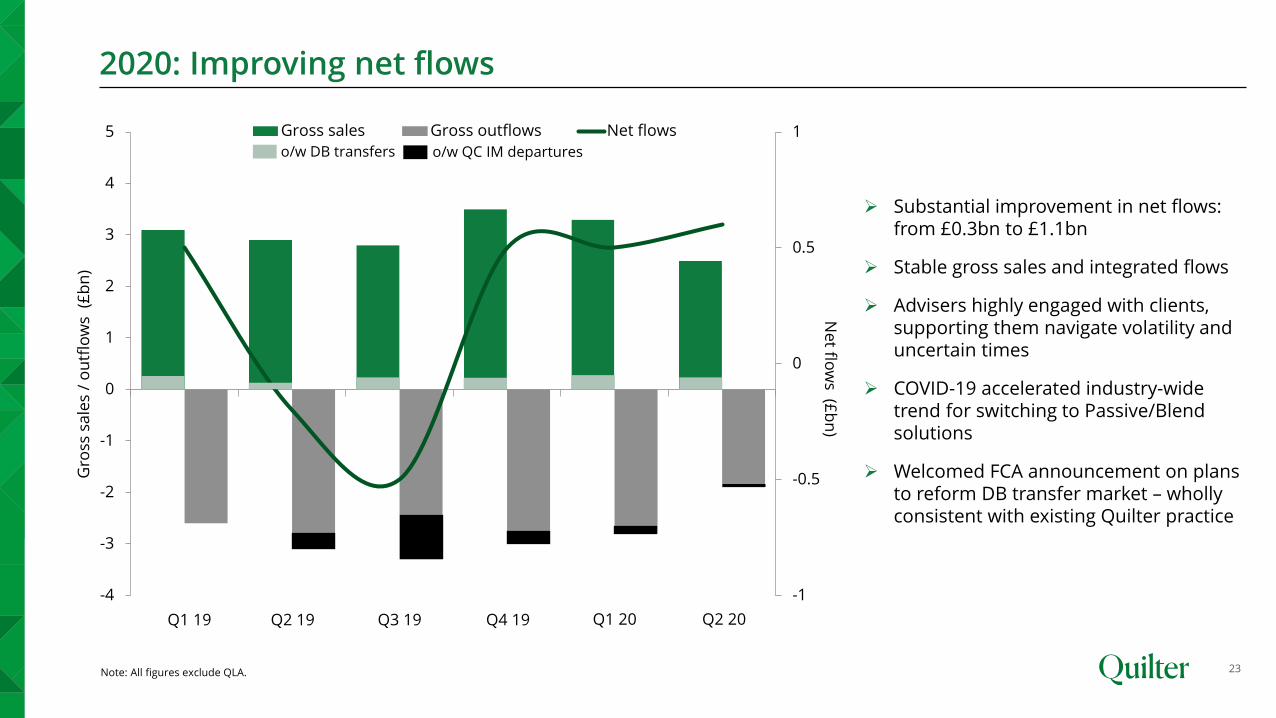
2020: Improving net flows
23
-1
-0.5
0
0.5
1
-4
-3
-2
-1
0
1
2
3
4
5
1 2 3 4 5 6
Gross sales Gross outflows Net flows
Gro
ss s
ale
s /
ou
tflo
ws
(£
bn
)
Ne
t flow
s (£b
n)
Note: All figures exclude QLA.
o/w QC IM departureso/w DB transfers
➢ Substantial improvement in net flows: from £0.3bn to £1.1bn
➢ Stable gross sales and integrated flows
➢ Advisers highly engaged with clients, supporting them navigate volatility and uncertain times
➢ COVID-19 accelerated industry-wide trend for switching to Passive/Blend solutions
➢ Welcomed FCA announcement on plans to reform DB transfer market – wholly consistent with existing Quilter practice
Q1 19 Q2 19 Q3 19 Q4 19 Q1 20 Q2 20

Business initiatives
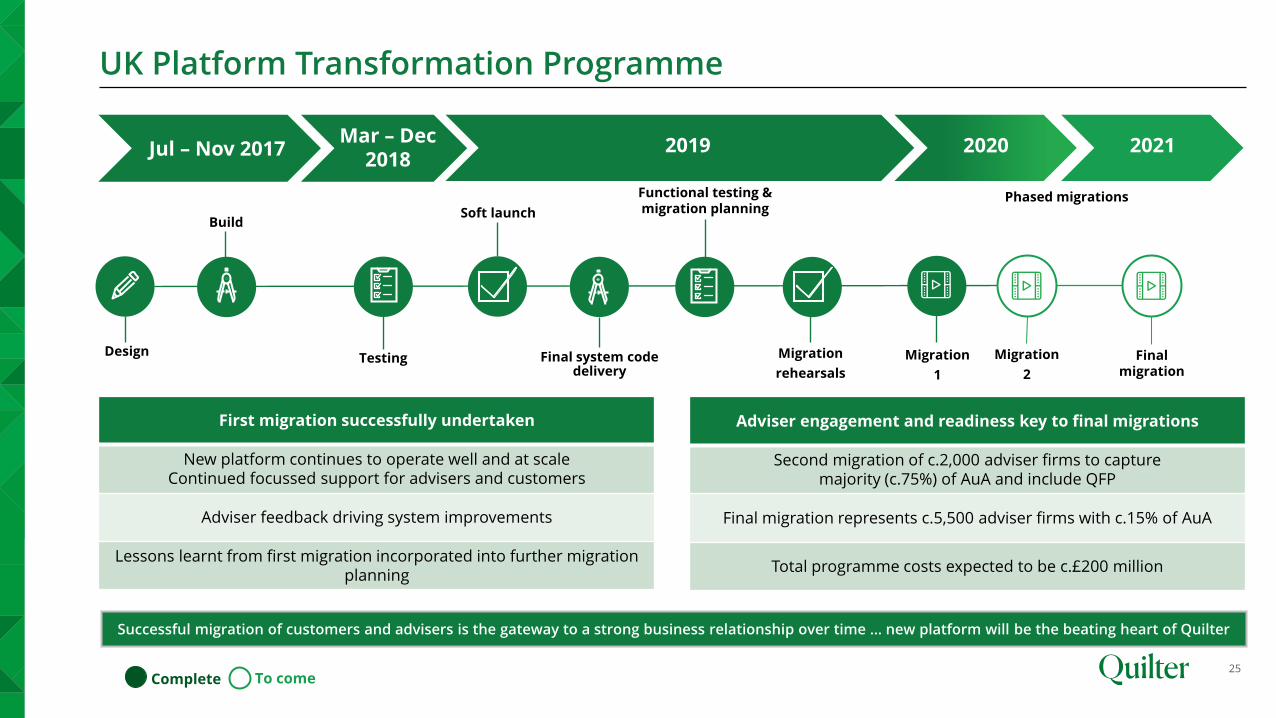
UK Platform Transformation Programme
25
Soft launch
Migration
rehearsals
Phased migrations
Design
Build
Testing
Complete To come
Functional testing & migration planning
Final system code delivery
2019Jul – Nov 2017 Mar – Dec
20182021
Migration
1
2020
Migration
2
Final migration
First migration successfully undertaken
New platform continues to operate well and at scaleContinued focussed support for advisers and customers
Adviser feedback driving system improvements
Lessons learnt from first migration incorporated into further migration planning
Adviser engagement and readiness key to final migrations
Second migration of c.2,000 adviser firms to capture majority (c.75%) of AuA and include QFP
Final migration represents c.5,500 adviser firms with c.15% of AuA
Total programme costs expected to be c.£200 million
Successful migration of customers and advisers is the gateway to a strong business relationship over time … new platform will be the beating heart of Quilter
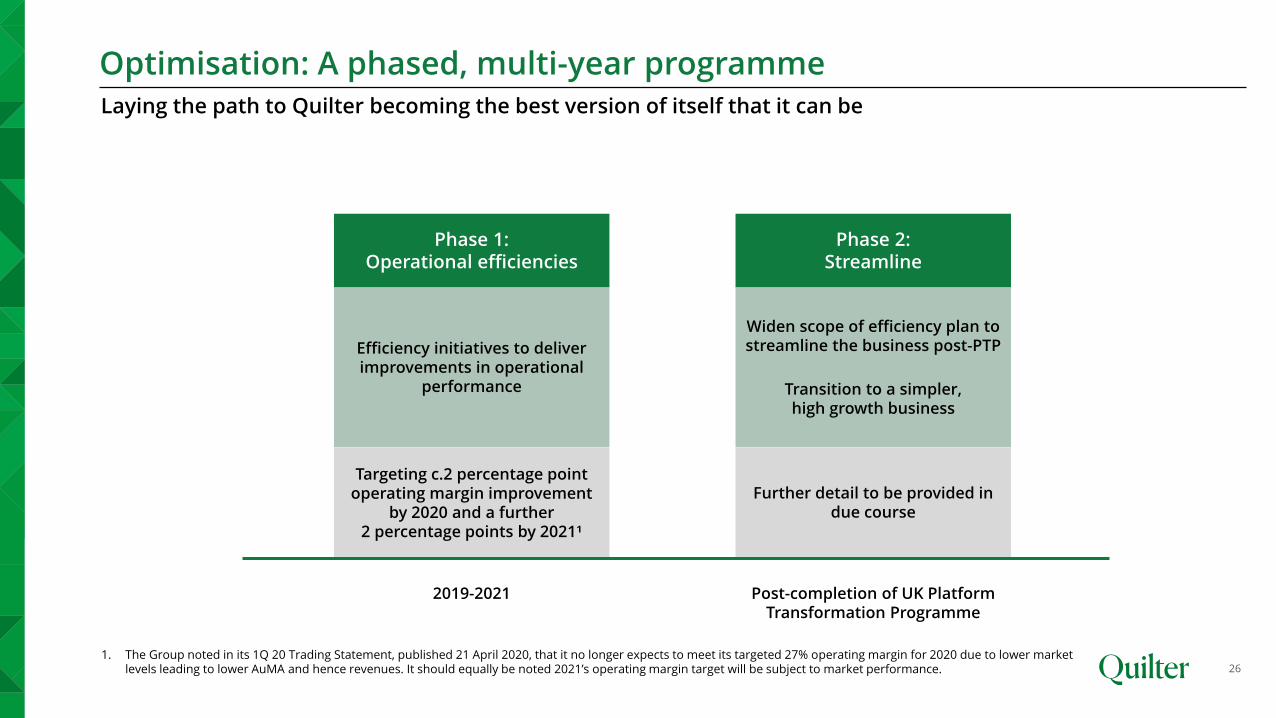
Further detail to be provided in due course
Targeting c.2 percentage point operating margin improvement
by 2020 and a further 2 percentage points by 2021¹
Optimisation: A phased, multi-year programme
26
Laying the path to Quilter becoming the best version of itself that it can be
Phase 2: Streamline
Widen scope of efficiency plan to streamline the business post-PTP
Transition to a simpler, high growth business
Phase 1: Operational efficiencies
Efficiency initiatives to deliver improvements in operational
performance
2019-2021 Post-completion of UK Platform Transformation Programme
1. The Group noted in its 1Q 20 Trading Statement, published 21 April 2020, that it no longer expects to meet its targeted 27% operating margin for 2020 due to lower market levels leading to lower AuMA and hence revenues. It should equally be noted 2021’s operating margin target will be subject to market performance.
2019-2021
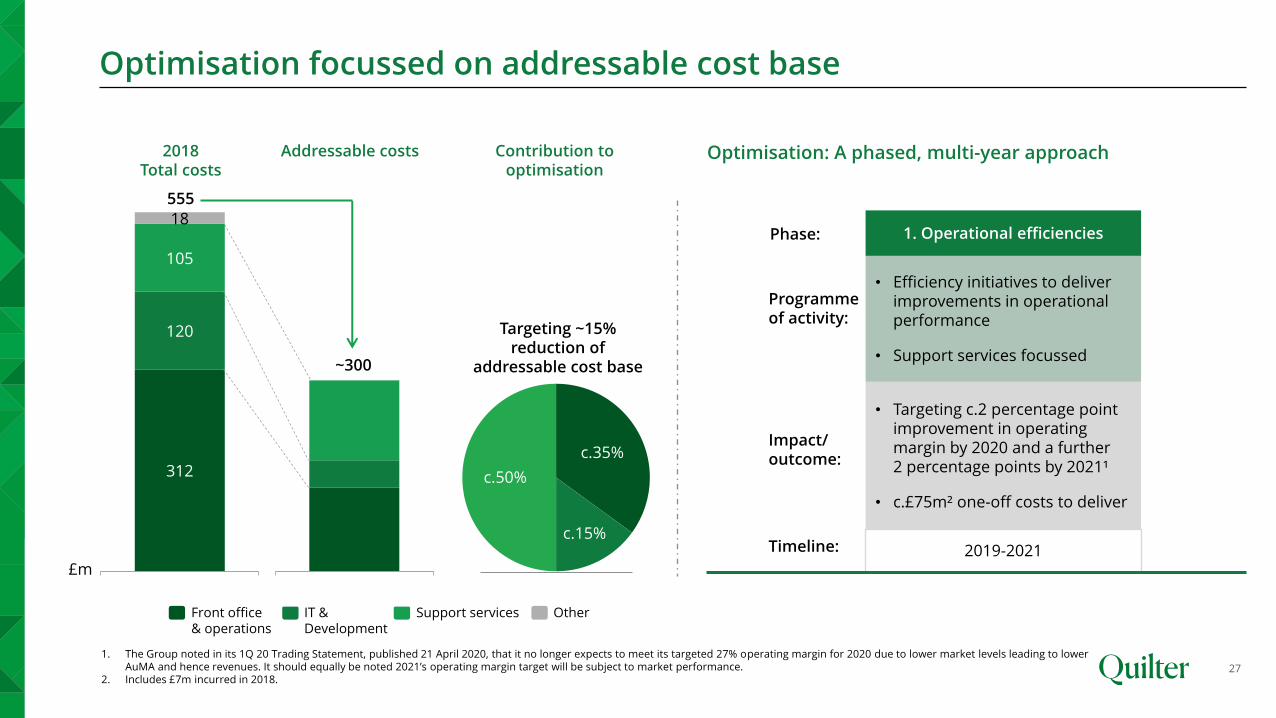
312
120
105
18
2018 expenses
Optimisation focussed on addressable cost base
27
£m
OtherSupport servicesIT & Development
Front office & operations
555
1. Operational efficiencies
• Efficiency initiatives to deliver improvements in operational performance
• Support services focussed
• Targeting c.2 percentage point improvement in operating margin by 2020 and a further 2 percentage points by 2021¹
• c.£75m² one-off costs to deliver
Impact/ outcome:
Programme of activity:
Phase:
Timeline:
Optimisation: A phased, multi-year approach2018 Total costs
1. The Group noted in its 1Q 20 Trading Statement, published 21 April 2020, that it no longer expects to meet its targeted 27% operating margin for 2020 due to lower market levels leading to lower AuMA and hence revenues. It should equally be noted 2021’s operating margin target will be subject to market performance.
2. Includes £7m incurred in 2018.
Targeting ~15% reduction of
addressable cost base
[45%]
[18%]
[37%]
Addressable cost base
~300
c.35%
c.15%
c.50%
Addressable costs Contribution to optimisation
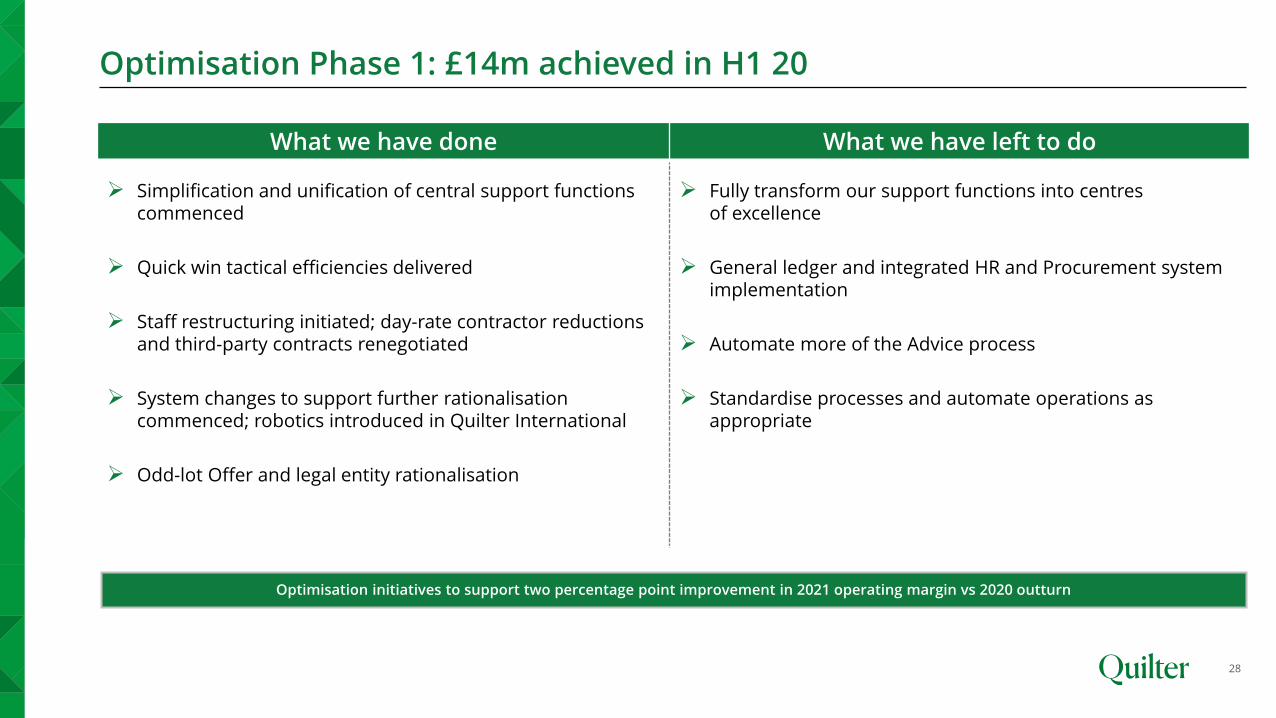
Optimisation Phase 1: £14m achieved in H1 20
28
What we have done What we have left to do
➢ Simplification and unification of central support functions commenced
➢ Quick win tactical efficiencies delivered
➢ Staff restructuring initiated; day-rate contractor reductions and third-party contracts renegotiated
➢ System changes to support further rationalisationcommenced; robotics introduced in Quilter International
➢ Odd-lot Offer and legal entity rationalisation
➢ Fully transform our support functions into centresof excellence
➢ General ledger and integrated HR and Procurement system implementation
➢ Automate more of the Advice process
➢ Standardise processes and automate operations as appropriate
Optimisation initiatives to support two percentage point improvement in 2021 operating margin vs 2020 outturn
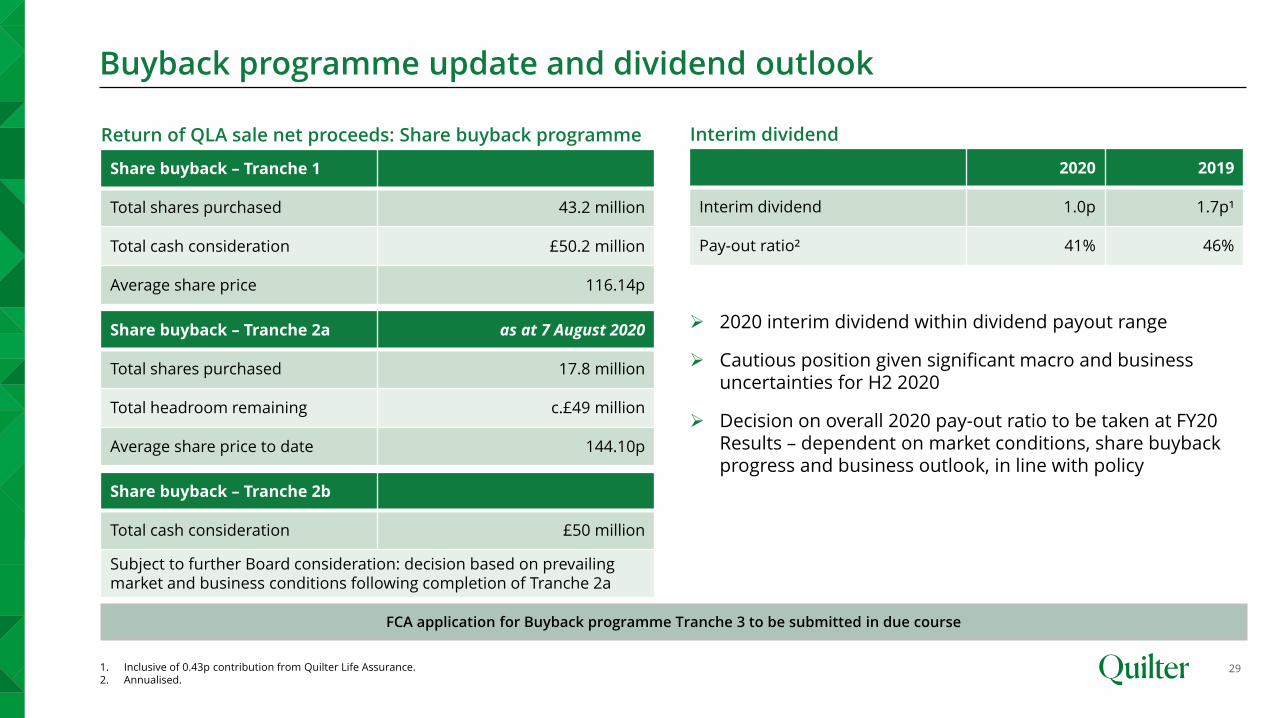
Share buyback – Tranche 2a as at 7 August 2020
Total shares purchased 17.8 million
Total headroom remaining c.£49 million
Average share price to date 144.10p
Buyback programme update and dividend outlook
29
Share buyback – Tranche 1
Total shares purchased 43.2 million
Total cash consideration £50.2 million
Average share price 116.14p
Return of QLA sale net proceeds: Share buyback programme
2020 2019
Interim dividend 1.0p 1.7p¹
Pay-out ratio² 41% 46%
➢ 2020 interim dividend within dividend payout range
➢ Cautious position given significant macro and business uncertainties for H2 2020
➢ Decision on overall 2020 pay-out ratio to be taken at FY20 Results – dependent on market conditions, share buyback progress and business outlook, in line with policy
Interim dividend
1. Inclusive of 0.43p contribution from Quilter Life Assurance.2. Annualised.
FCA application for Buyback programme Tranche 3 to be submitted in due course
Share buyback – Tranche 2b
Total cash consideration £50 million
Subject to further Board consideration: decision based on prevailing market and business conditions following completion of Tranche 2a

Cash and capital
31
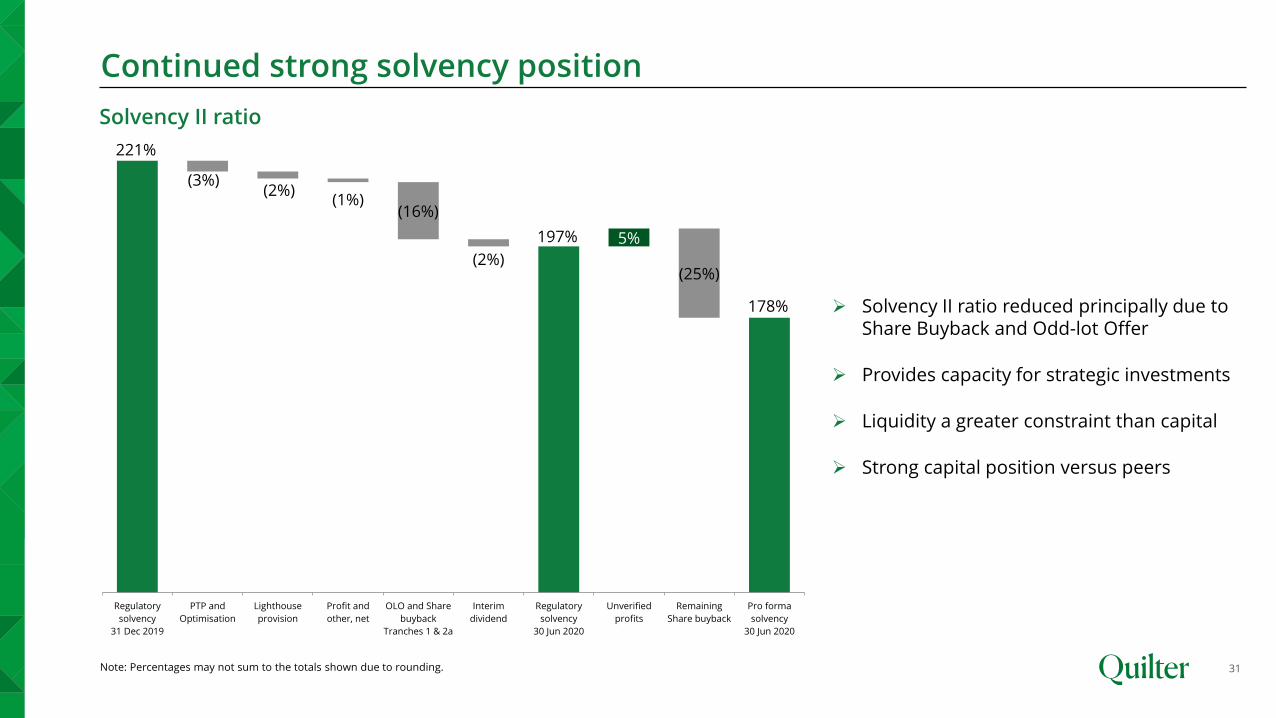
Solvency II ratio
Continued strong solvency position
➢ Solvency II ratio reduced principally due to Share Buyback and Odd-lot Offer
➢ Provides capacity for strategic investments
➢ Liquidity a greater constraint than capital
➢ Strong capital position versus peers
(12%)
221%
197%
178%
(3%)(2%)
(1%)(16%)
(2%)
5%
(25%)
Regulatory
solvency
31 Dec 2019
PTP and
Optimisation
Lighthouse
provision
Profit and
other, net
OLO and Share
buyback
Tranches 1 & 2a
Interim
dividend
Regulatory
solvency
30 Jun 2020
Unverified
profits
Remaining
Share buyback
Pro forma
solvency
30 Jun 2020
Note: Percentages may not sum to the totals shown due to rounding.
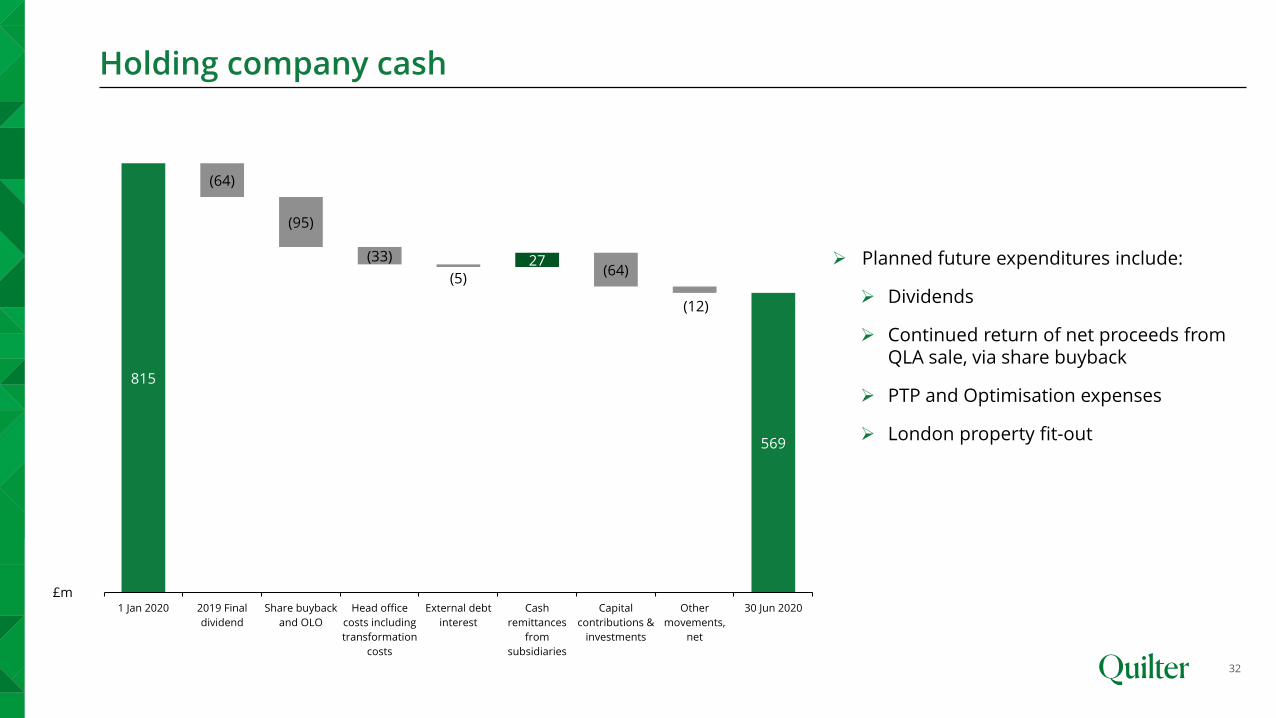
Holding company cash
32
815
569
(64)
(95)
(33)
(5)27
(64)
(12)
1 Jan 2020 2019 Final
dividend
Share buyback
and OLO
Head office
costs including
transformation
costs
External debt
interest
Cash
remittances
from
subsidiaries
Capital
contributions &
investments
Other
movements,
net
30 Jun 2020
£m
➢ Planned future expenditures include:
➢ Dividends
➢ Continued return of net proceeds from QLA sale, via share buyback
➢ PTP and Optimisation expenses
➢ London property fit-out
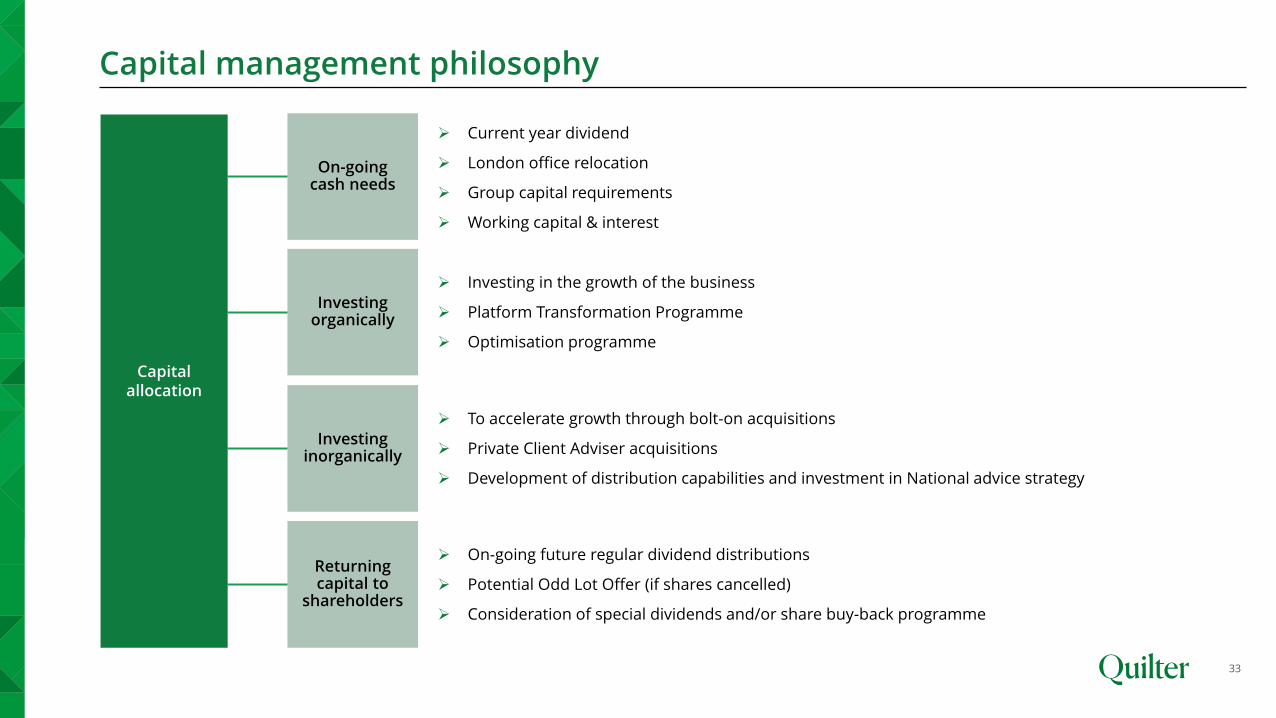
Capital management philosophy
33
Returning capital to
shareholders
Investing inorganically
➢ To accelerate growth through bolt-on acquisitions
➢ Private Client Adviser acquisitions
➢ Development of distribution capabilities and investment in National advice strategy
➢ On-going future regular dividend distributions
➢ Potential Odd Lot Offer (if shares cancelled)
➢ Consideration of special dividends and/or share buy-back programme
Capital allocation
On-going cash needs
Investing organically
➢ Current year dividend
➢ London office relocation
➢ Group capital requirements
➢ Working capital & interest
➢ Investing in the growth of the business
➢ Platform Transformation Programme
➢ Optimisation programme

Investment case and 2020 outlook
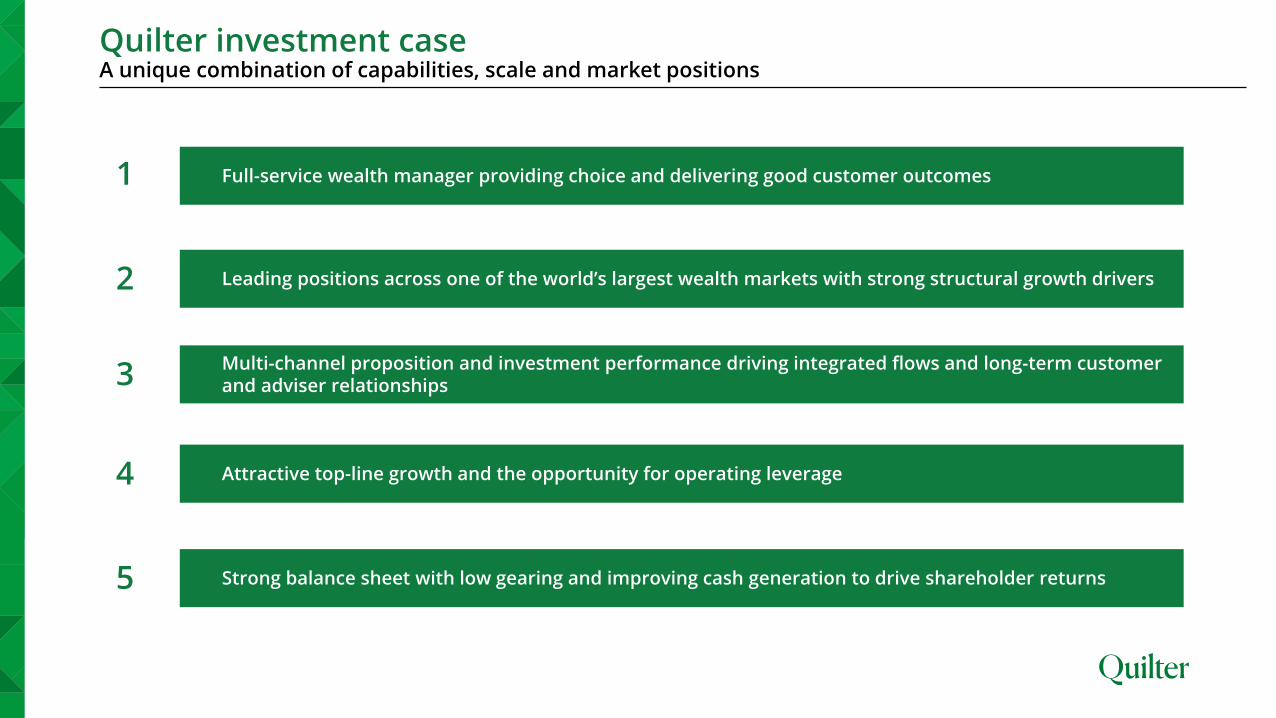
Quilter investment caseA unique combination of capabilities, scale and market positions
Full-service wealth manager providing choice and delivering good customer outcomes
Leading positions across one of the world’s largest wealth markets with strong structural growth drivers
Multi-channel proposition and investment performance driving integrated flows and long-term customer and adviser relationships
Attractive top-line growth and the opportunity for operating leverage
Strong balance sheet with low gearing and improving cash generation to drive shareholder returns
1
2
3
4
5
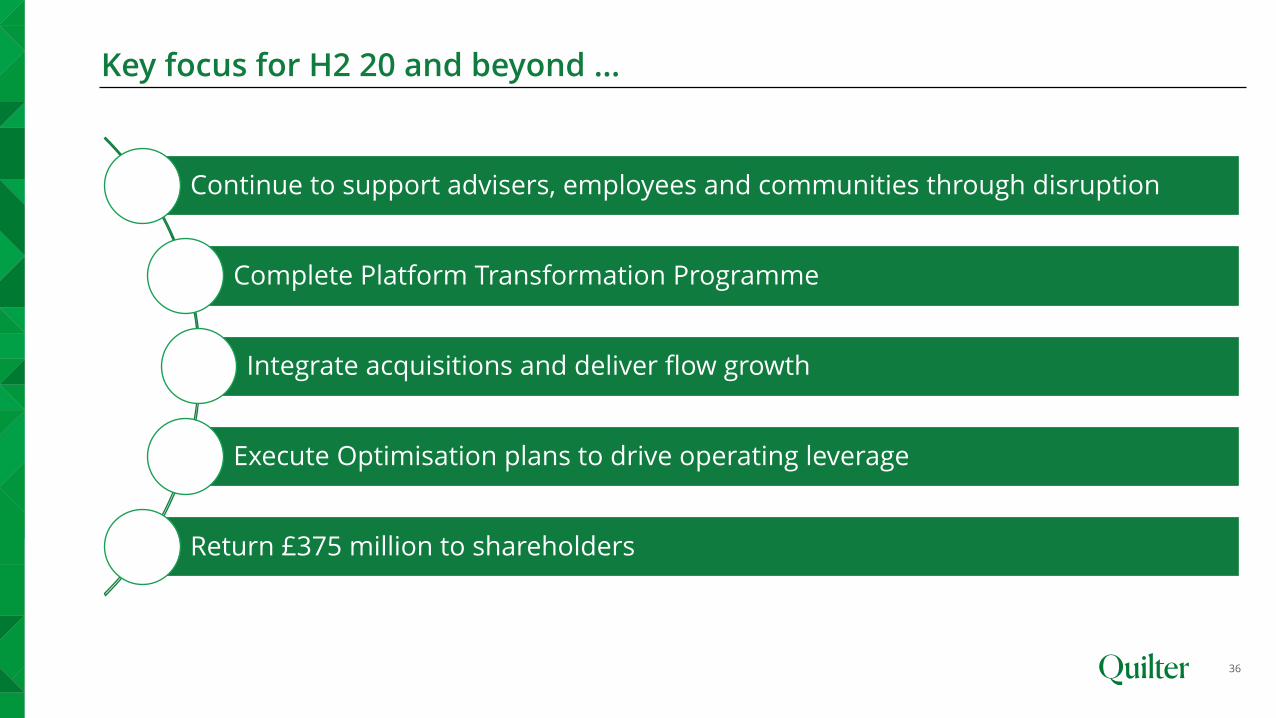
Key focus for H2 20 and beyond …
36
Continue to support advisers, employees and communities through disruption
Complete Platform Transformation Programme
Integrate acquisitions and deliver flow growth
Execute Optimisation plans to drive operating leverage
Return £375 million to shareholders

Appendix
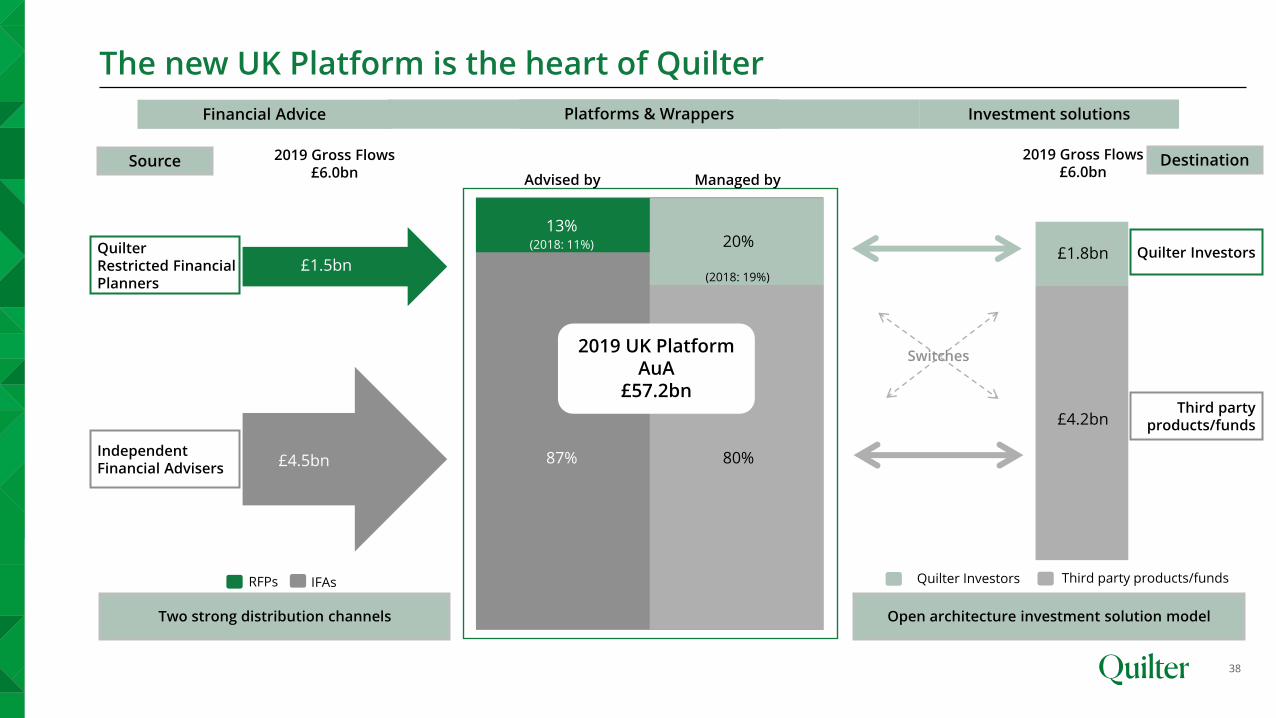
The new UK Platform is the heart of Quilter
38
Quilter Restricted Financial Planners
Third party products/fundsQuilter InvestorsIFAsRFPs
2019 Gross Flows£6.0bn
£1.5bn
Independent Financial Advisers
£4.5bn
Two strong distribution channels Open architecture investment solution model
Source
87% 80%
13%20%
2019 UK Platform AuA
£57.2bn
Advised by Managed by
(2018: 11%)
(2018: 19%)£1.5bn
£4.5bn
2019 Gross Flows£6.0bn
£1.8bn
£4.2bn
Quilter Investors
Third party products/funds
Switches
Destination
Financial Advice Investment solutionsPlatforms & Wrappers
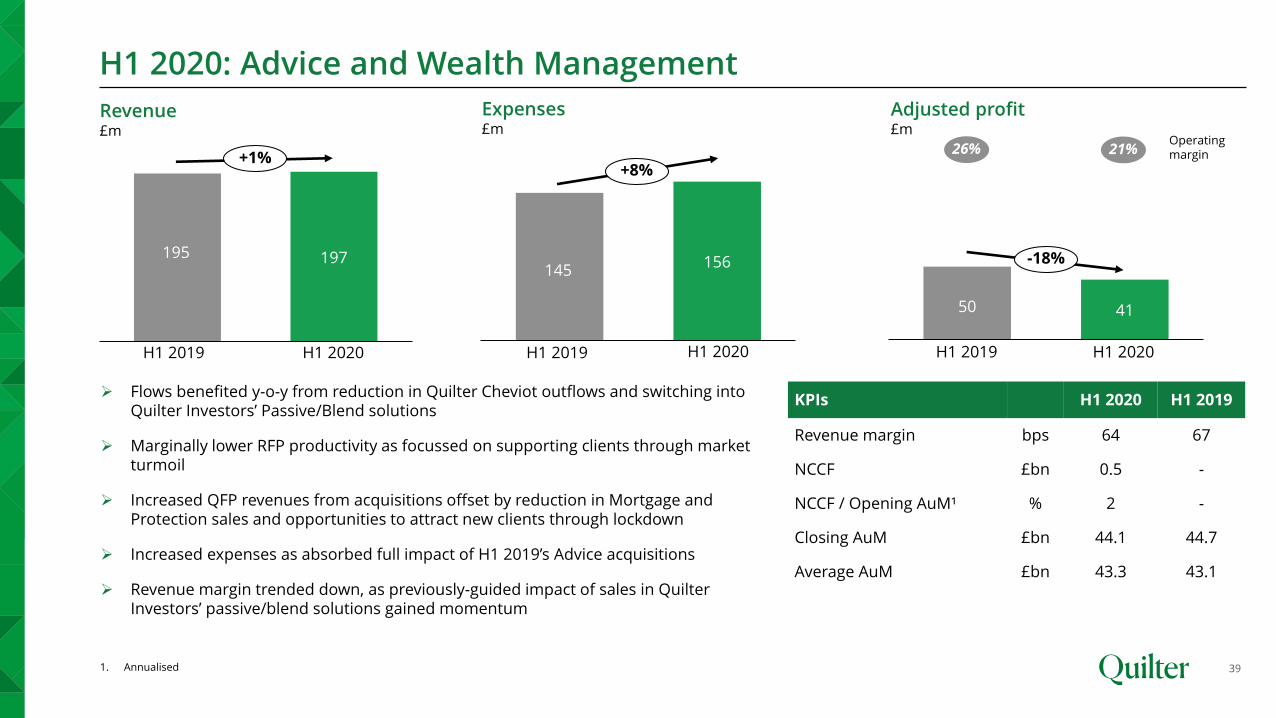
H1 2020: Advice and Wealth Management
39
KPIs H1 2020 H1 2019
Revenue margin bps 64 67
NCCF £bn 0.5 -
NCCF / Opening AuM¹ % 2 -
Closing AuM £bn 44.1 44.7
Average AuM £bn 43.3 43.1
195 197
H1 2019 H1 2020
+1%
145156
H1 2019 H1 2020
+8%
50 41
H1 2019 H1 2020
-18%
Revenue£m
Adjusted profit£m
Expenses£m
Operatingmargin21%26%
➢ Flows benefited y-o-y from reduction in Quilter Cheviot outflows and switching into Quilter Investors’ Passive/Blend solutions
➢ Marginally lower RFP productivity as focussed on supporting clients through market turmoil
➢ Increased QFP revenues from acquisitions offset by reduction in Mortgage and Protection sales and opportunities to attract new clients through lockdown
➢ Increased expenses as absorbed full impact of H1 2019’s Advice acquisitions
➢ Revenue margin trended down, as previously-guided impact of sales in Quilter Investors’ passive/blend solutions gained momentum
1. Annualised
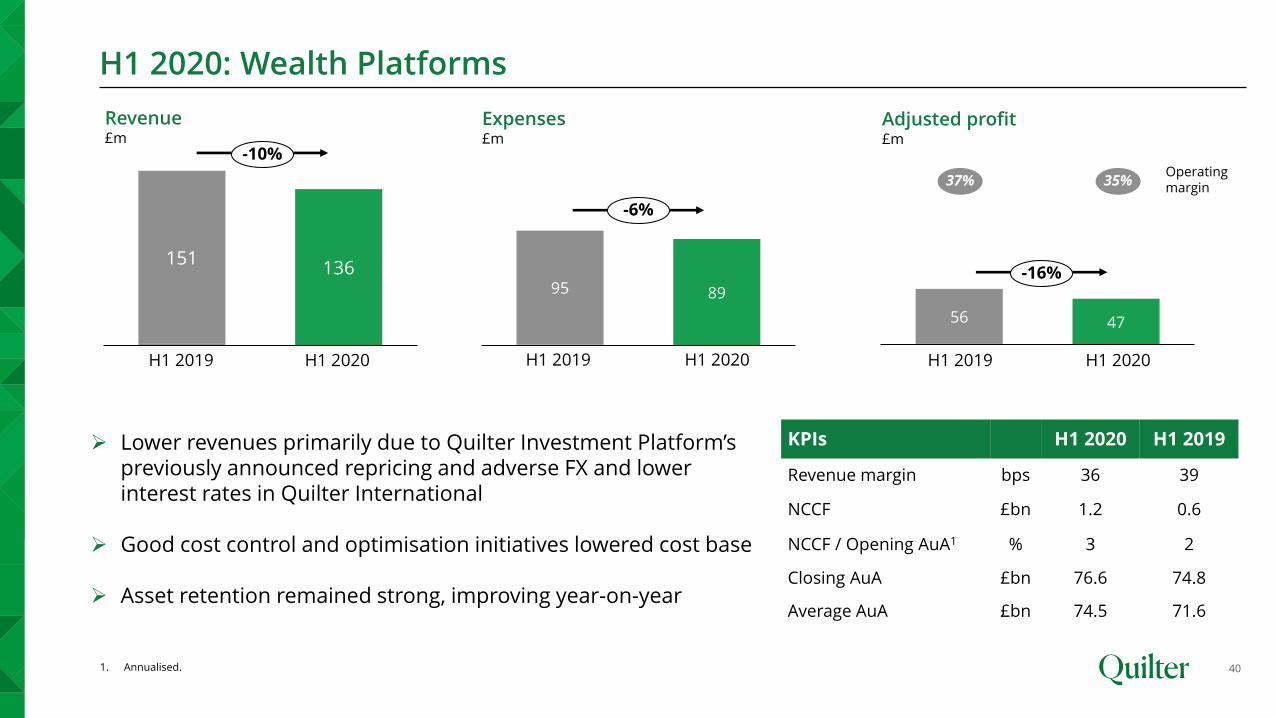
95 89
151136
56 47
H1 2020: Wealth Platforms
40
Revenue£m
Adjusted profit£m
Expenses£m
Operatingmargin
35%37%
H1 2019 H1 2020H1 2020H1 2019 H1 2019 H1 2020
➢ Lower revenues primarily due to Quilter Investment Platform’s previously announced repricing and adverse FX and lower interest rates in Quilter International
➢ Good cost control and optimisation initiatives lowered cost base
➢ Asset retention remained strong, improving year-on-year
-10%
-6%
-16%
KPIs H1 2020 H1 2019
Revenue margin bps 36 39
NCCF £bn 1.2 0.6
NCCF / Opening AuA1 % 3 2
Closing AuA £bn 76.6 74.8
Average AuA £bn 74.5 71.6
1. Annualised.
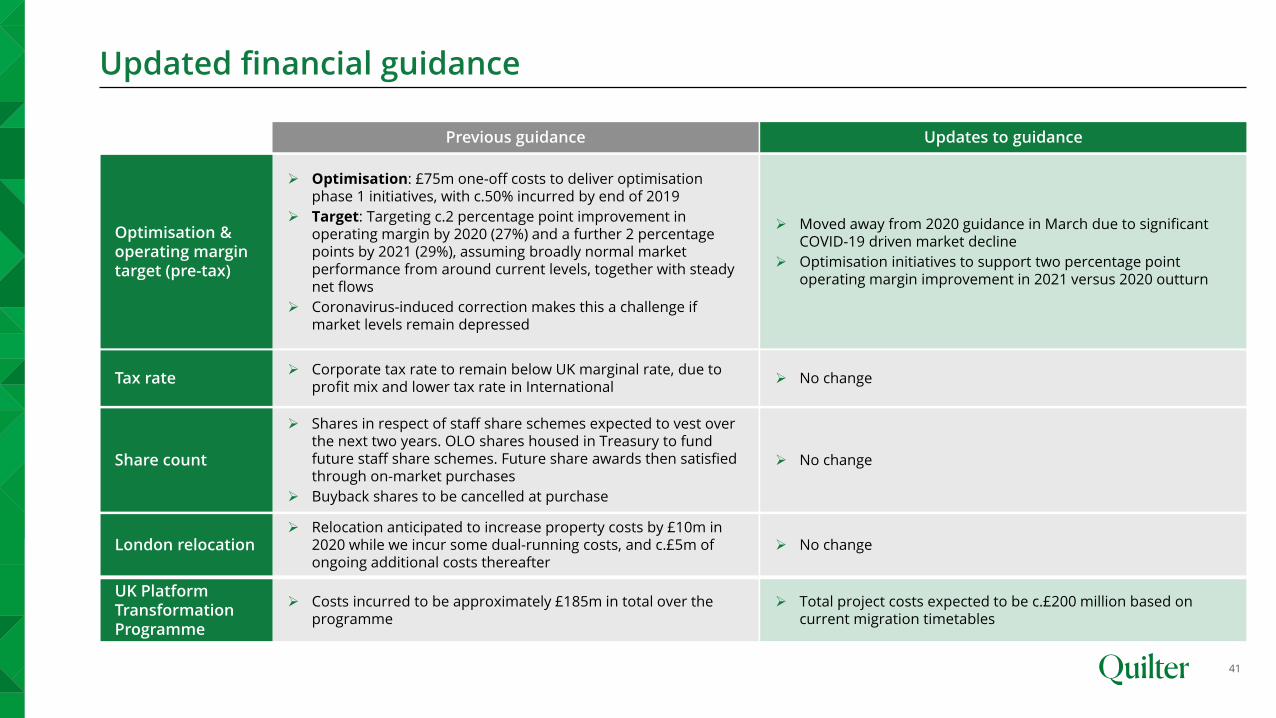
➢ Optimisation: £75m one-off costs to deliver optimisation phase 1 initiatives, with c.50% incurred by end of 2019
➢ Target: Targeting c.2 percentage point improvement in operating margin by 2020 (27%) and a further 2 percentage points by 2021 (29%), assuming broadly normal market performance from around current levels, together with steady net flows
➢ Coronavirus-induced correction makes this a challenge if market levels remain depressed
Optimisation & operating margin target (pre-tax)
➢ Corporate tax rate to remain below UK marginal rate, due to profit mix and lower tax rate in International
Tax rate ➢ No change
Updated financial guidance
41
Previous guidance Updates to guidance
➢ Costs incurred to be approximately £185m in total over the programme
UK Platform Transformation Programme
➢ Total project costs expected to be c.£200 million based on current migration timetables
➢ Shares in respect of staff share schemes expected to vest over the next two years. OLO shares housed in Treasury to fund future staff share schemes. Future share awards then satisfied through on-market purchases
➢ Buyback shares to be cancelled at purchase
Share count ➢ No change
➢ Relocation anticipated to increase property costs by £10m in 2020 while we incur some dual-running costs, and c.£5m of ongoing additional costs thereafter
London relocation ➢ No change
➢ Moved away from 2020 guidance in March due to significant COVID-19 driven market decline
➢ Optimisation initiatives to support two percentage point operating margin improvement in 2021 versus 2020 outturn
Updated financial guidance continued
42
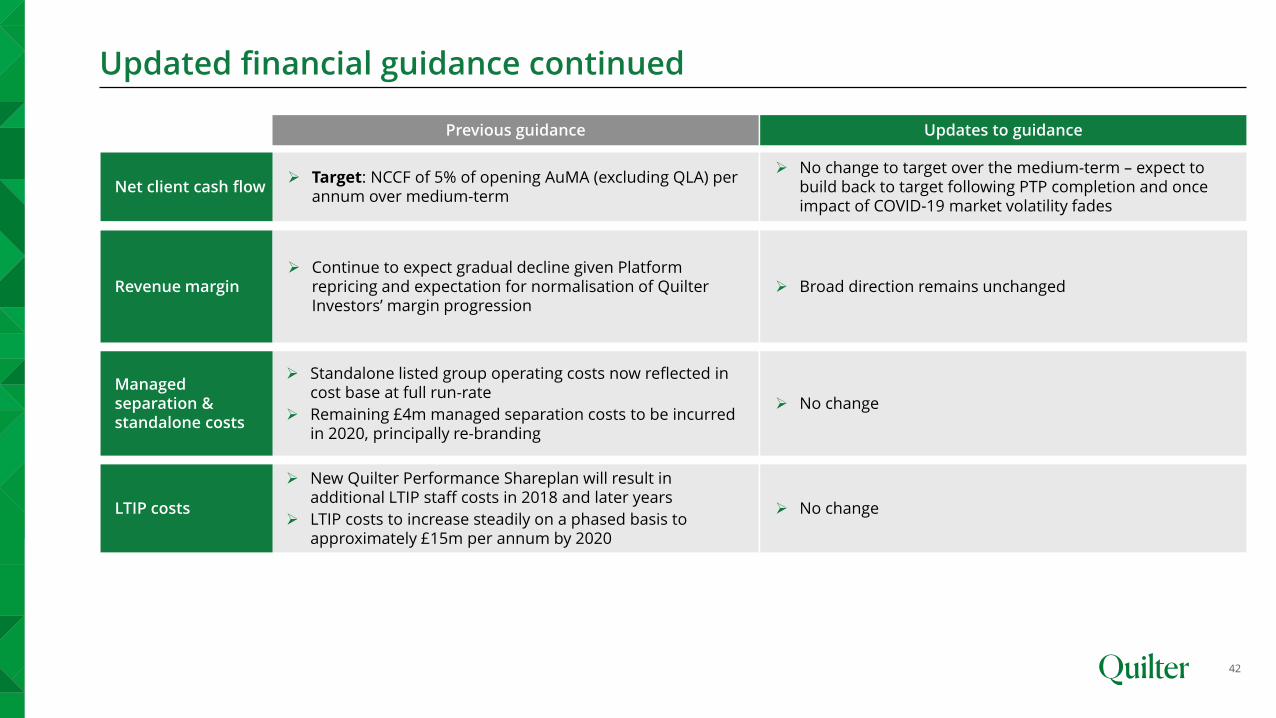
Revenue margin
➢ Standalone listed group operating costs now reflected in cost base at full run-rate
➢ Remaining £4m managed separation costs to be incurred in 2020, principally re-branding
➢ Target: NCCF of 5% of opening AuMA (excluding QLA) per annum over medium-term
Net client cash flow
Managed separation & standalone costs
➢ No change
➢ No change to target over the medium-term – expect to build back to target following PTP completion and once impact of COVID-19 market volatility fades
Previous guidance Updates to guidance
➢ Continue to expect gradual decline given Platform repricing and expectation for normalisation of Quilter Investors’ margin progression
➢ Broad direction remains unchanged
➢ New Quilter Performance Shareplan will result in additional LTIP staff costs in 2018 and later years
➢ LTIP costs to increase steadily on a phased basis to approximately £15m per annum by 2020
LTIP costs ➢ No change
Updated financial guidance continued
43
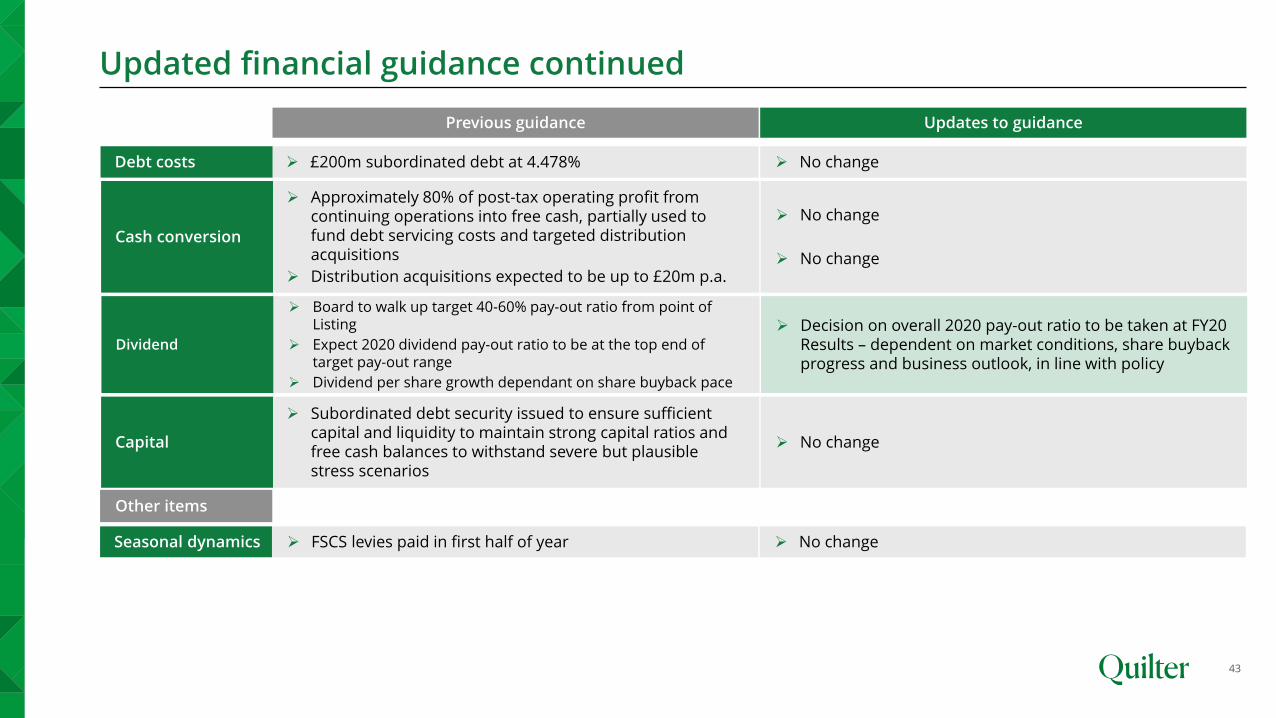
Previous guidance Updates to guidance
➢ £200m subordinated debt at 4.478%Debt costs ➢ No change
➢ Approximately 80% of post-tax operating profit from continuing operations into free cash, partially used to fund debt servicing costs and targeted distribution acquisitions
➢ Distribution acquisitions expected to be up to £20m p.a.
Cash conversion
➢ No change
➢ No change
➢ Subordinated debt security issued to ensure sufficient capital and liquidity to maintain strong capital ratios and free cash balances to withstand severe but plausible stress scenarios
Capital ➢ No change
➢ FSCS levies paid in first half of yearSeasonal dynamics ➢ No change
Other items
➢ Board to walk up target 40-60% pay-out ratio from point of Listing
➢ Expect 2020 dividend pay-out ratio to be at the top end of target pay-out range
➢ Dividend per share growth dependant on share buyback pace
Dividend
➢ Decision on overall 2020 pay-out ratio to be taken at FY20 Results – dependent on market conditions, share buyback progress and business outlook, in line with policy
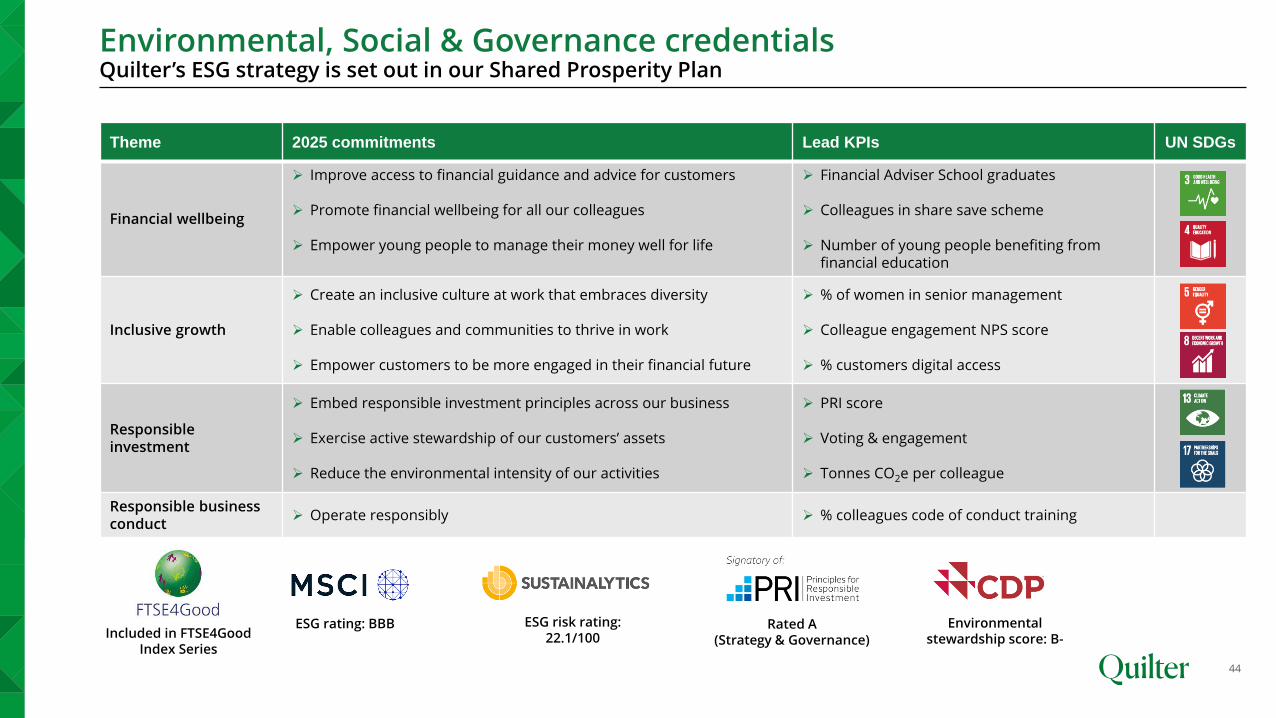
Environmental, Social & Governance credentialsQuilter’s ESG strategy is set out in our Shared Prosperity Plan
44
Theme 2025 commitments Lead KPIs UN SDGs
Financial wellbeing
➢ Improve access to financial guidance and advice for customers
➢ Promote financial wellbeing for all our colleagues
➢ Empower young people to manage their money well for life
➢ Financial Adviser School graduates
➢ Colleagues in share save scheme
➢ Number of young people benefiting from financial education
Inclusive growth
➢ Create an inclusive culture at work that embraces diversity
➢ Enable colleagues and communities to thrive in work
➢ Empower customers to be more engaged in their financial future
➢ % of women in senior management
➢ Colleague engagement NPS score
➢ % customers digital access
Responsible investment
➢ Embed responsible investment principles across our business
➢ Exercise active stewardship of our customers’ assets
➢ Reduce the environmental intensity of our activities
➢ PRI score
➢ Voting & engagement
➢ Tonnes CO2e per colleague
Responsible business conduct
➢ Operate responsibly ➢ % colleagues code of conduct training
Rated A (Strategy & Governance)
Environmental stewardship score: B-
ESG risk rating: 22.1/100
ESG rating: BBB Included in FTSE4Good
Index Series
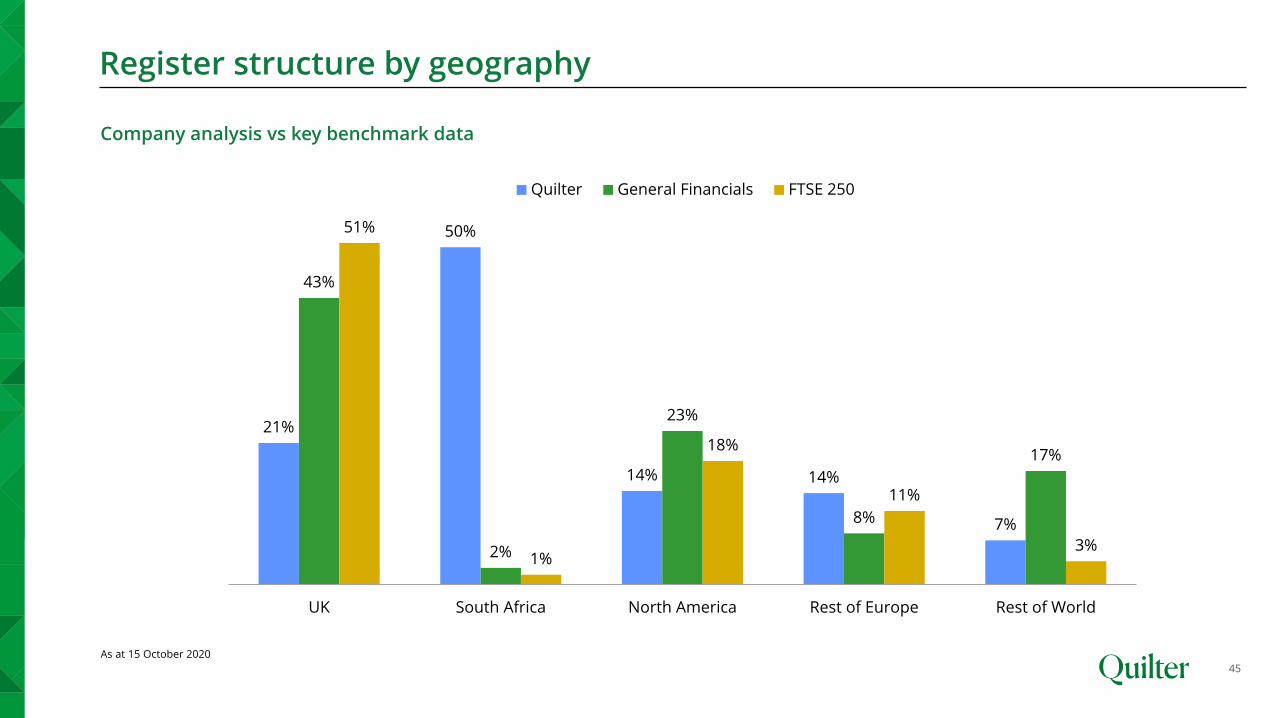
Register structure by geography
45
Company analysis vs key benchmark data
As at 15 October 2020
21%
50%
14% 14%
7%
43%
2%
23%
8%
17%
51%
1%
18%
11%
3%
UK South Africa North America Rest of Europe Rest of World
Quilter General Financials FTSE 250
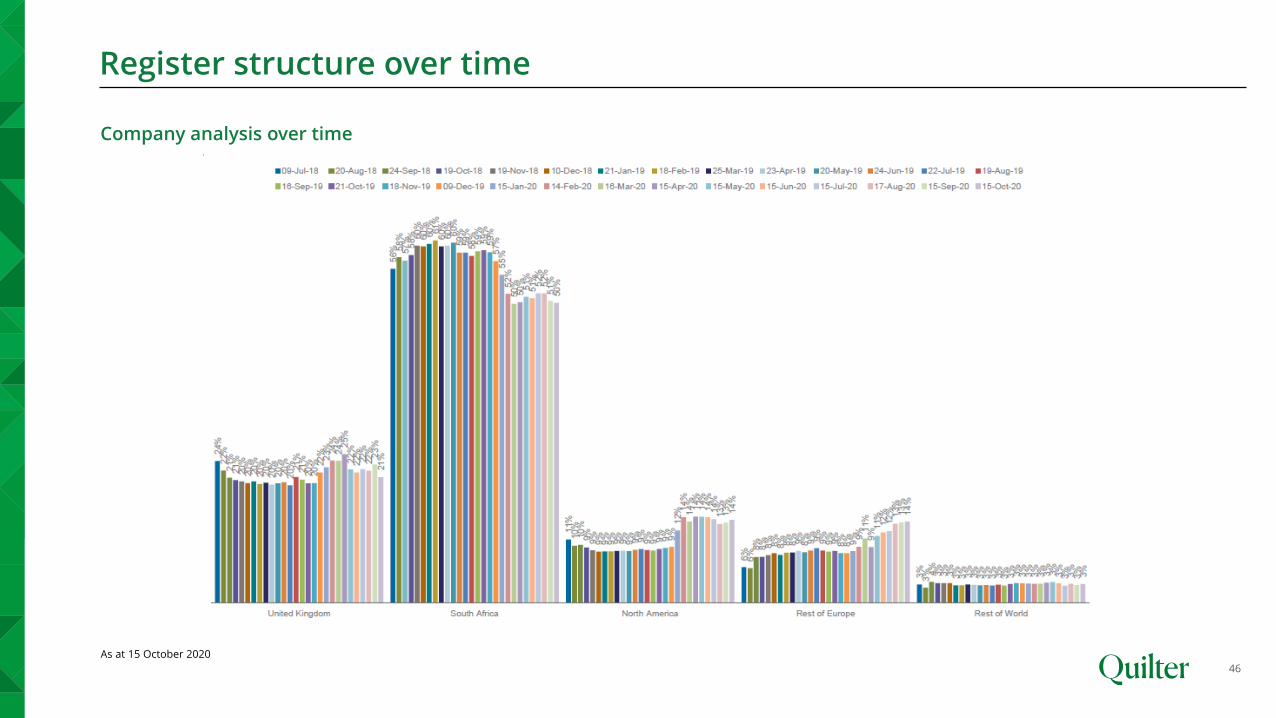
Register structure over time
46
Company analysis over time
As at 15 October 2020
Contacts
47
Investor enquiries
John-Paul Crutchley UK [email protected]
Keilah Codd UK [email protected]
Media enquiries
Jane Goodland UK [email protected]
Tim Skelton-Smith UK [email protected]
Camarco
Geoffrey Pelham-Lane UK +44 203 757 [email protected]
Disclaimer
48
This presentation should be read in conjunction with the announcement published by Quilter plc on 11 August 2020.
This presentation may contain certain forward-looking statements with respect to certain Quilter plc’s plans and its current goalsand expectations relating to its future financial condition, performance and results.
By their nature, all forward-looking statements involve risk and uncertainty because they relate to future events and circumstanceswhich are beyond Quilter plc’s control including amongst other things, international and global economic and business conditions,the implications and economic impact of the COVID-19 pandemic, the implications and economic impact of several scenarios of theUK’s future relationship with the EU in relation to financial services, market related risks such as fluctuations in interest rates andexchange rates, the policies and actions of regulatory authorities, the impact of competition, inflation, deflation, the timing andimpact of other uncertainties of future acquisitions or combinations within relevant industries, as well as the impact of tax andother legislation and other regulations in the jurisdictions in which Quilter plc and its affiliates operate. As a result, Quilter plc’sactual future financial condition, performance and results may differ materially from the plans, goals and expectations set forth inQuilter plc’s forward looking statements.
Quilter plc undertakes no obligation to update the forward-looking statements contained in this presentation or any other forward-looking statements it may make.
Nothing in this presentation should be construed as a profit forecast.
Nothing in this presentation shall constitute an offer to sell or the solicitation of an offer to buy any securities.

Quilter Basic Brand Guidelines Our brand assets 1