Embed Size (px)
Citation preview

www. c- i leas ing .com info@c-i leas ing .com
C&I LEASING PLC Investor & Analyst Presentation
Year Ended December 31, 2017 &
Q1 Ended 31 March 2018

www. c- i leas ing .com info@c-i leas ing .com
DisclaimerThis presentation is based on C&I Leasing Plc’s audited financial results for the year ended 31 December 2017 as well asunaudited results for the period ending 31 March 2018. C&I Leasing Plc has obtained some information in this presentation fromsources it believes to be reliable. Although C&I Leasing Plc has taken all reasonable care to ensure that the information herein isaccurate and correct, C&I Leasing Plc makes no representation or warranty, express or implied, as to the accuracy, correctness orcompleteness of such information.
Furthermore, C&I Leasing Plc makes no representation or warranty, express or implied, that its future operating, financial or other
results will be consistent with results implied, directly or indirectly, by information contained herein or with C&I Leasing Plc’s past
operating, financial or other results. Any information herein is as of the date of this presentation and may change without notice.
C&I Leasing Plc undertakes no obligation to update the information in this presentation. In addition, some of the information in
this presentation may be condensed or incomplete, and this presentation may not contain all material information in respect of
C&I Leasing.
This presentation also contains “forward-looking statements” that relate to, among other things, C&I Leasing Plc’s plans,objectives, goals, strategies, future operations and performance. Such forward-looking statements may be characterised by wordssuch as “estimates,” “aims,” “expects,” “projects,” “believes,” “intends,” “plans,” “may,” “will” and “should” and similar expressions butare not the exclusive means of identifying such statements. Such forward-looking statements involve known and unknown risks,uncertainties and other important factors that could cause C&I Leasing Plc’s operating, financial or other results to be materiallydifferent from the operating, financial or other results expressed or implied by such statements. Although C&I Leasing Plc believesthe basis for such forward-looking statements to be fair and reasonable, C&I Leasing Plc makes no representation or warranty,express or implied, as to the fairness or reasonableness of such forward looking statements.
Furthermore, C&I Leasing Plc makes no representation or warranty, express or implied, that the operating, financial or otherresults anticipated by such forward-looking statements will be achieved. Such forward-looking statements represent, in each case,only one of many possible scenarios and should not be viewed as the most likely or standard scenario. C&I Leasing undertakes noobligation to update the forward-looking statements in this presentation.
2
www. c- i leas ing .com info@c-i leas ing .com
Outline
About C&I Leasing Group
FY 2017 & Q1 2018 Financial Snapshot
Group Financial Performance Review
Strategy & Outlook
1
2
3
4
5
4
12
18
32
Appendix5 35

www. c- i leas ing .com info@c-i leas ing .com
About C&I Leasing Group
Mr Andrew Otike-Odibi, CEO
www. c- i leas ing .com info@c-i leas ing .com
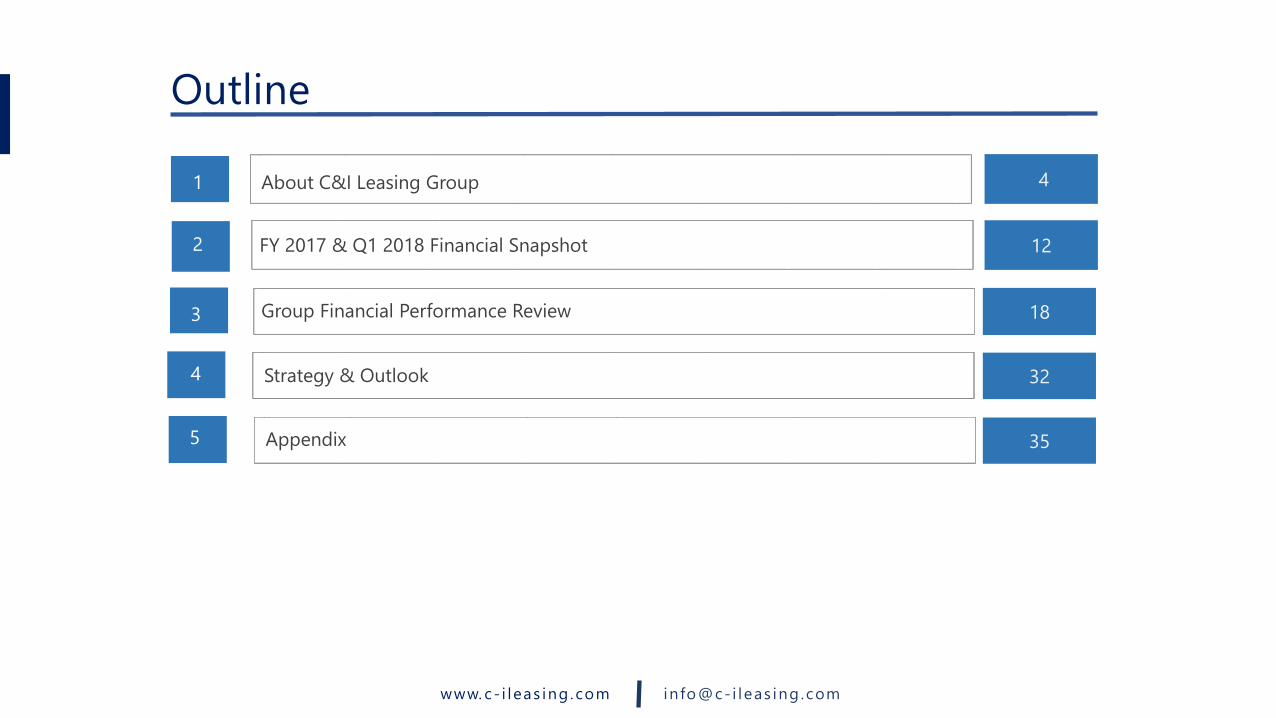
• C & I Leasing was incorporated in 1990
and it was listed on the NSE in 1997
• The fleet management business in
Nigeria reflects consolidated accounts of
fleet management, financial services and
C&I motors which is now discontinued
• Leaseafric Ghana was incorporated in
1992 and is expected to be listed on the
GSE (Ghana Stock Exchange) in the short
term
• EPIC FZE (UAE) was incorporated in 2011
• Total number of customers: 190
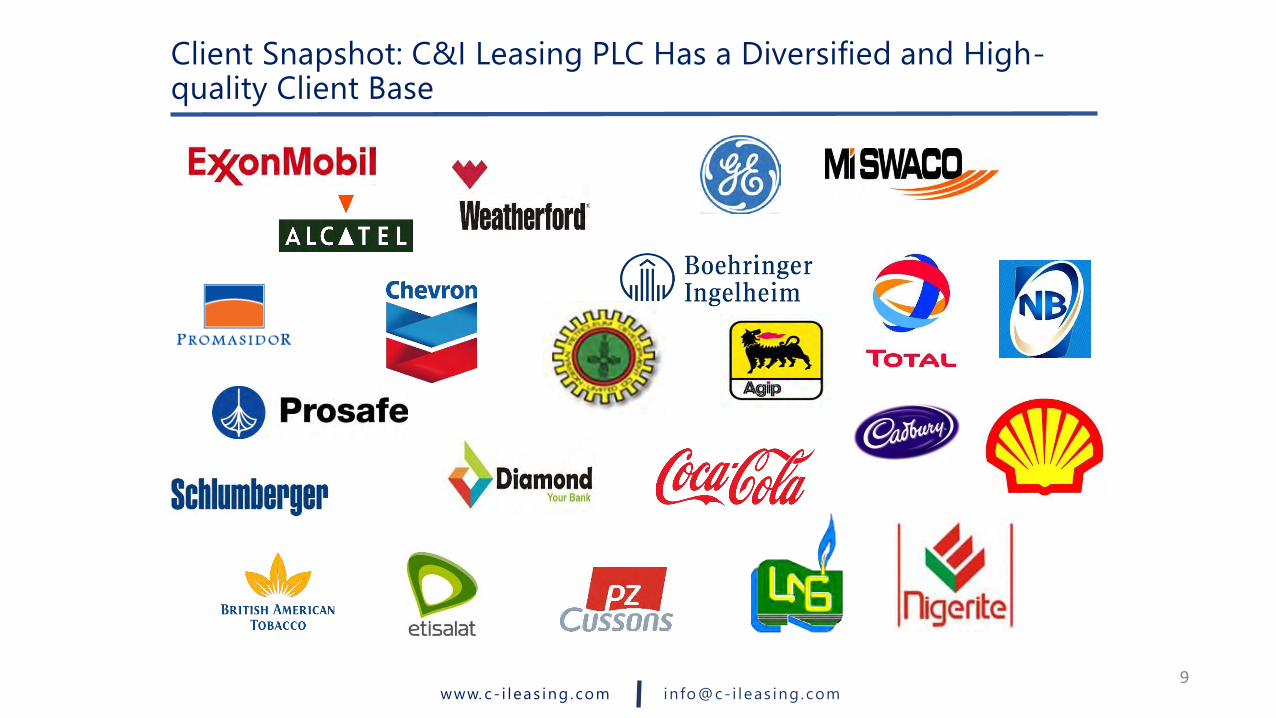
• The Group’s client base includes largely
A-rated clients and spans various
industries such as oil & gas, telecoms,
financial services, power, FMCGs, etc.
• Total staff: Core staff – 553; Outsourced
and Hertz staff – 5,000+
Overview of the C&I Leasing Group Structure
C&I Leasing Group
Ghana: Leasafric
(76%)
(89 staff)
UAE: Epic FZE*
(100%)
Nigeria: C&I
Leasing Plc (100%)
(464 staff)
Fleet Mgt
PBT: N263mm
ROE: 16%
No of customers: 30
Marine
PBT: N493mm
ROE: 22%
No of customers: 2
Fleet Mgt**
PBT: (N599)mm
ROE: (42)%
No of customers: 90
Personnel Outsourcing
PBT: N437mm
ROE: 19%
No of customers: 36
Marine
PBT: N703mm
ROE: 32%
No of customers: 7
Citracks***
PBT: (N18mm)
ROE: (23)%
No of customers: 25
Su
bsi
dia
ries
Bu
sin
ess
Un
its
Pare
nt
Co
mp
an
y
5
*EPIC FZE is incorporated in the free trade zone of UAE for tax benefit purposes. All the
vessels and operations are in Nigeria.
**On a standalone basis, excluding the impact of C&I Motors and financial services, fleet
management recorded PBT of N343.6mm, with ROE of 26%
***Citracks – Exceptional write off of old balances to clean up the portfolio. Business is
profitable on a normalized basis.
(% owned)

www. c- i leas ing .com info@c-i leas ing .com
MarinePersonnel
OutsourcingMarine
Personnel
OutsourcingCitracks*Marine
Personnel
OutsourcingFleet
Management
36 customers7 customers 90 customers 25 customers
A Nigeria Communications
Commission licensed
provider of unique Fleet
Management Solution to suit
various business needs by
providing web-based, end-
to-end tracking and other
fleet management solutions
to both internal and external
clients
Human resource solutions
(personnel management,
human resource outsourcing,
consultancy, personnel
evaluation) for blue chip
organisations in addition to
the SDS training centre which
focuses on training services
Providing Car rental services
with its Hertz Car Rental
franchise, as well as fleet
management services for
light vehicles and heavy duty
automobiles
Leading Nigerian Content
player in the offshore marine
vessel space. It offers a wide
range of marine services to
both onshore and offshore
terminals; leveraging the
opportunities created by the
Nigerian Oil and Gas
Industry Development Act
for indigenous companies
FY 2017 Gross Earnings
N16.3 billion
FY 2017 Profit before tax
N506.9 million
Breakdown of Business Segment for C&I Leasing Plc (Company)
N6.0bn 6.03.9
6.2
0.2
-1,000
-500
0
500
1,000
-599.4
436.7702.9
-18.0mm
6Fleet Management Citracks Marine Services Personnel Outsourcing
*Going forward Citracks will be reported as part of Fleet Management. Loss position in 2017 due to
one-off write off of old balances to clean up the portfolio. Business is profitable on a normalized basis
** On a standalone basis, excluding the impact of C&I Motors and financial services, Fleet
Management recorded PBT of N343.6mn, with ROE of 26%
www. c- i leas ing .com info@c-i leas ing .com
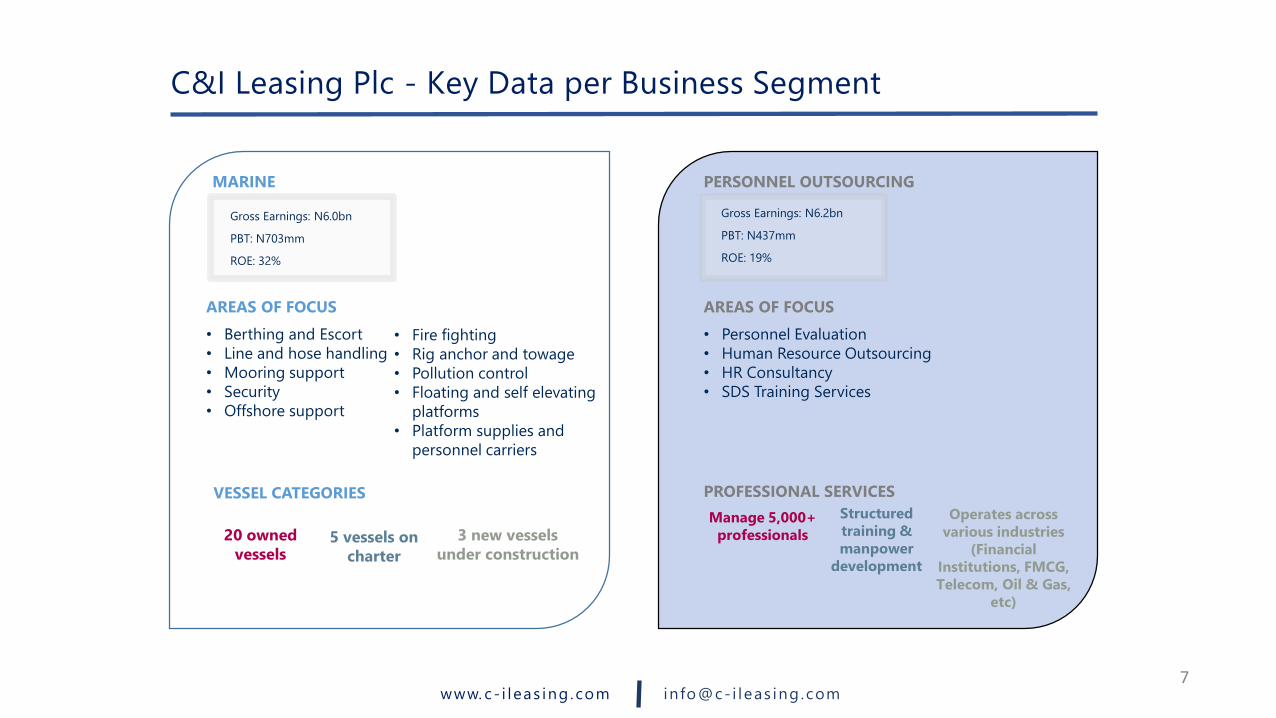
VESSEL CATEGORIES
AREAS OF FOCUS
• Berthing and Escort
• Line and hose handling
• Mooring support
• Security
• Offshore support
3 new vessels
under construction5 vessels on
charter
Gross Earnings: N6.0bn
PBT: N703mm
ROE: 32%
• Fire fighting
• Rig anchor and towage
• Pollution control
• Floating and self elevating
platforms
• Platform supplies and
personnel carriers
MARINE
20 owned
vessels
PROFESSIONAL SERVICES
AREAS OF FOCUS
• Personnel Evaluation
• Human Resource Outsourcing
• HR Consultancy
• SDS Training Services
Operates across
various industries
(Financial
Institutions, FMCG,
Telecom, Oil & Gas,
etc)
Structured
training &
manpower
development
PERSONNEL OUTSOURCING
Manage 5,000+
professionals
Gross Earnings: N6.2bn
PBT: N437mm
ROE: 19%
C&I Leasing Plc - Key Data per Business Segment
7

www. c- i leas ing .com info@c-i leas ing .com
PROFESSIONAL SERVICES
AREAS OF FOCUS
• Daily rentals
• Fleet Management
• Operating Lease
• Equipment rentals
• Airport shuttle
• Pick Up, Drop Off
Gross Earnings: N3.9bn
PBT: (N599mm)*
ROE: (43%)
FLEET MANAGEMENT
PROFESSIONAL SERVICES
AREAS OF FOCUS
• Location Tracking
• Speed monitoring
• Immobiliser
• Scheduled Analytical Reports
• Tamper Alert System
• Data Retention
Speed
Monitoring
Solutions
Fuel
Monitoring
Solutions
CITRACKS***
Tracking Fixed &
Mobile Assets
(haulage, trucks,
SUVs, buses &
power
generators)
Gross Earnings: N211.0mm
PBT: (N18mm)**
ROE: (23%)
Cost effective
operationsReal time fuel
consumption
management
Geo-fencing &
Fleet
Management
alerts
C&I Leasing Plc - Key Data per Business Segment
8*On a standalone basis, excluding the impact of C&I Motors (now discontinued) and financial
services, fleet management recorded PBT of N343.6mm, with ROE of 26%
**Citracks - One-off write off of old balances to clean up the portfolio. Business is profitable on
a normalized basis. ***Going forward Citracks will be reported as part of Fleet Management
www. c- i leas ing .com info@c-i leas ing .com9
Client Snapshot: C&I Leasing PLC Has a Diversified and High-quality Client Base
www. c- i leas ing .com info@c-i leas ing .com
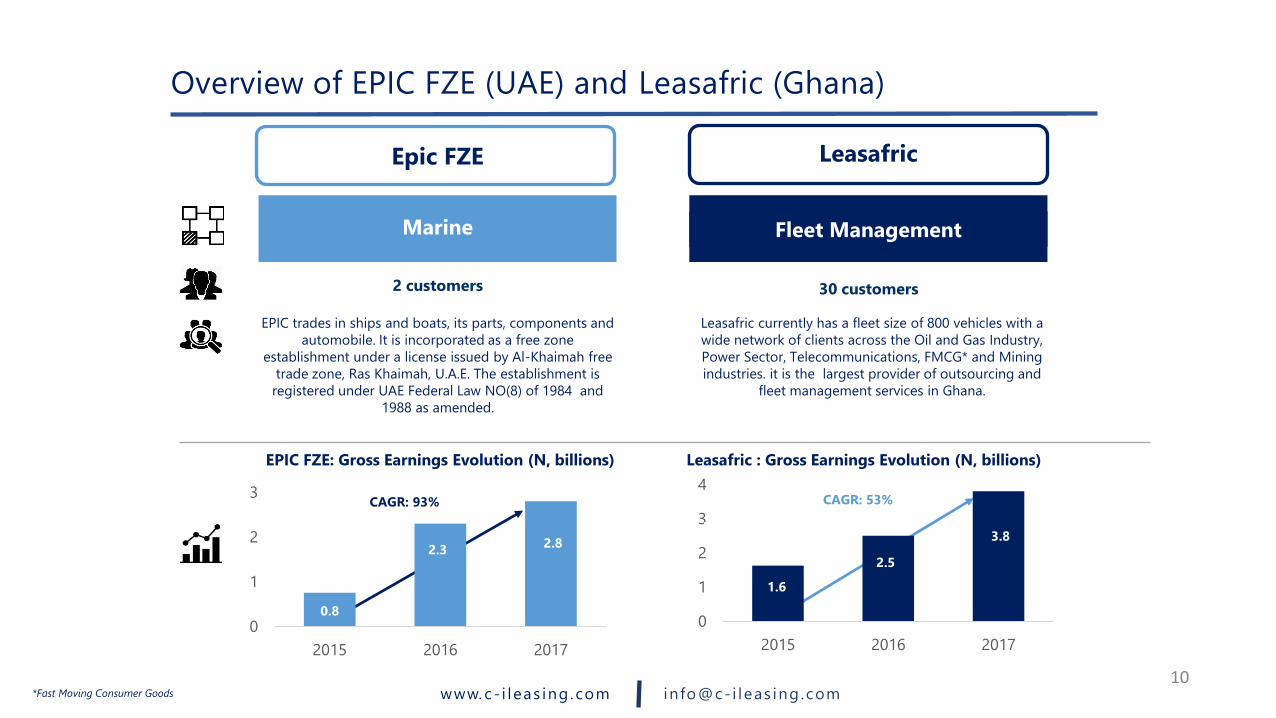
1.6
2.5
3.8
0
1
2
3
4
2015 2016 2017
CAGR: 53%
Marine Fleet Management
2 customers 30 customers
Leasafric currently has a fleet size of 800 vehicles with a
wide network of clients across the Oil and Gas Industry,
Power Sector, Telecommunications, FMCG* and Mining
industries. it is the largest provider of outsourcing and
fleet management services in Ghana.
EPIC trades in ships and boats, its parts, components and
automobile. It is incorporated as a free zone
establishment under a license issued by Al-Khaimah free
trade zone, Ras Khaimah, U.A.E. The establishment is
registered under UAE Federal Law NO(8) of 1984 and
1988 as amended.
Overview of EPIC FZE (UAE) and Leasafric (Ghana)
N6.0bn N3.9bn
N6.2bn
N6.0bn
10
Epic FZE Leasafric
EPIC FZE: Gross Earnings Evolution (N, billions) Leasafric : Gross Earnings Evolution (N, billions)
0.8
2.32.8
0
1
2
3
2015 2016 2017
CAGR: 93%
*Fast Moving Consumer Goods

www. c- i leas ing .com info@c-i leas ing .com
A Solid Investment Proposition Focused on Long-term Growth
11
High quality borrower
Operating in segments
with sound market
potential
Strong and stable
management team
Strong competitive
positioning across all
segments
Significant infrastructure
to grow the business
Good security structure
Predictable cash flows
Able to achieve lower
weighted average cost of
funds than the market
Allows the Group to
continue to expand in a
sustainable and profitable
way
Long-term relationships
with A-rated clients
Transparent structure of
revenue flow from lease
assets to meet specific
repayment obligations of
borrowings used to fund
relevant assets provides
platform for growth
Providing emerging
growth opportunities
Allowing for visibility of
earnings and business
planning
Highlighting strong barrier
to entry to the sector
www. c- i leas ing .com info@c-i leas ing .com
FY 2017 & Q1 2018 Snapshot
Mr Andrew Otike-Odibi, CEO
www. c- i leas ing .com info@c-i leas ing .com
Improving Macroeconomic and Regulatory Environment but Challenges Persist
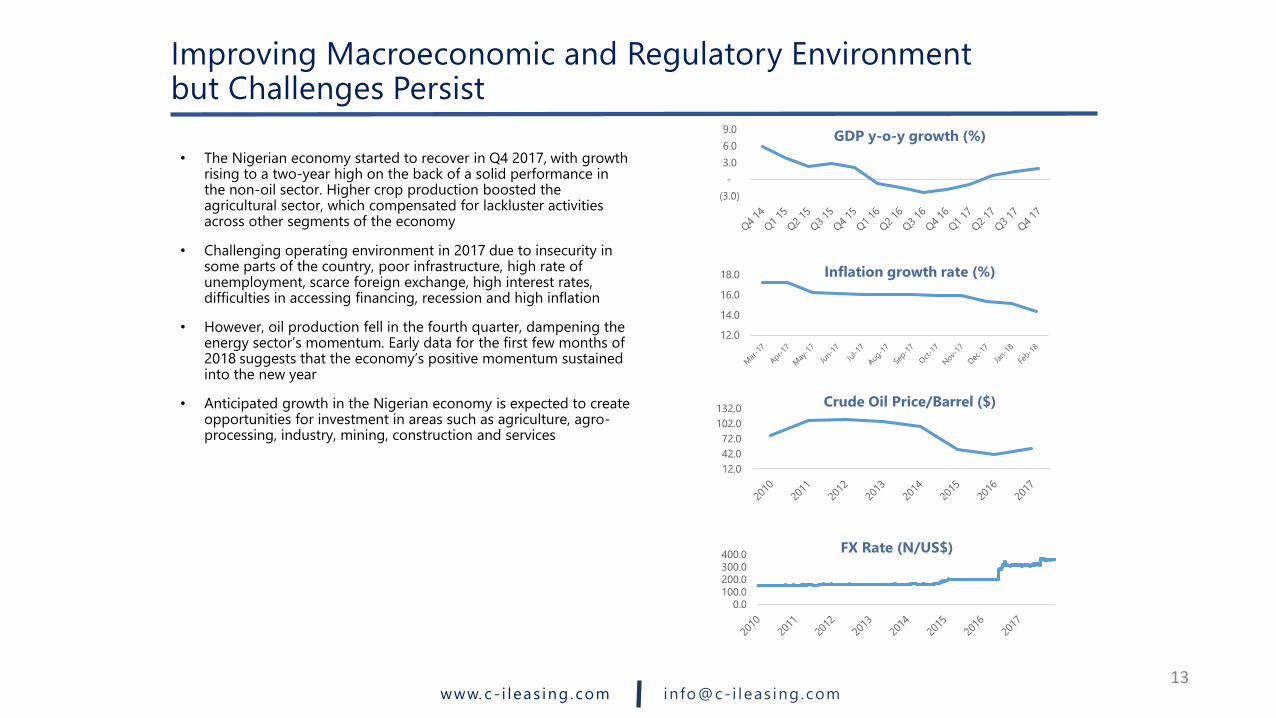
• The Nigerian economy started to recover in Q4 2017, with growth rising to a two-year high on the back of a solid performance in the non-oil sector. Higher crop production boosted the agricultural sector, which compensated for lackluster activities across other segments of the economy
• Challenging operating environment in 2017 due to insecurity in some parts of the country, poor infrastructure, high rate of unemployment, scarce foreign exchange, high interest rates, difficulties in accessing financing, recession and high inflation
• However, oil production fell in the fourth quarter, dampening the energy sector’s momentum. Early data for the first few months of 2018 suggests that the economy’s positive momentum sustained into the new year
• Anticipated growth in the Nigerian economy is expected to create opportunities for investment in areas such as agriculture, agro-processing, industry, mining, construction and services
(3.0)
-
3.0
6.0
9.0GDP y-o-y growth (%)
12.0
14.0
16.0
18.0 Inflation growth rate (%)
12.0
42.0
72.0
102.0
132.0Crude Oil Price/Barrel ($)
13
0.0100.0200.0300.0400.0
FX Rate (N/US$)
www. c- i leas ing .com info@c-i leas ing .com
FY 2017 and Q1 2018 Key Result Highlights
14
FY 2017 Q1 2018
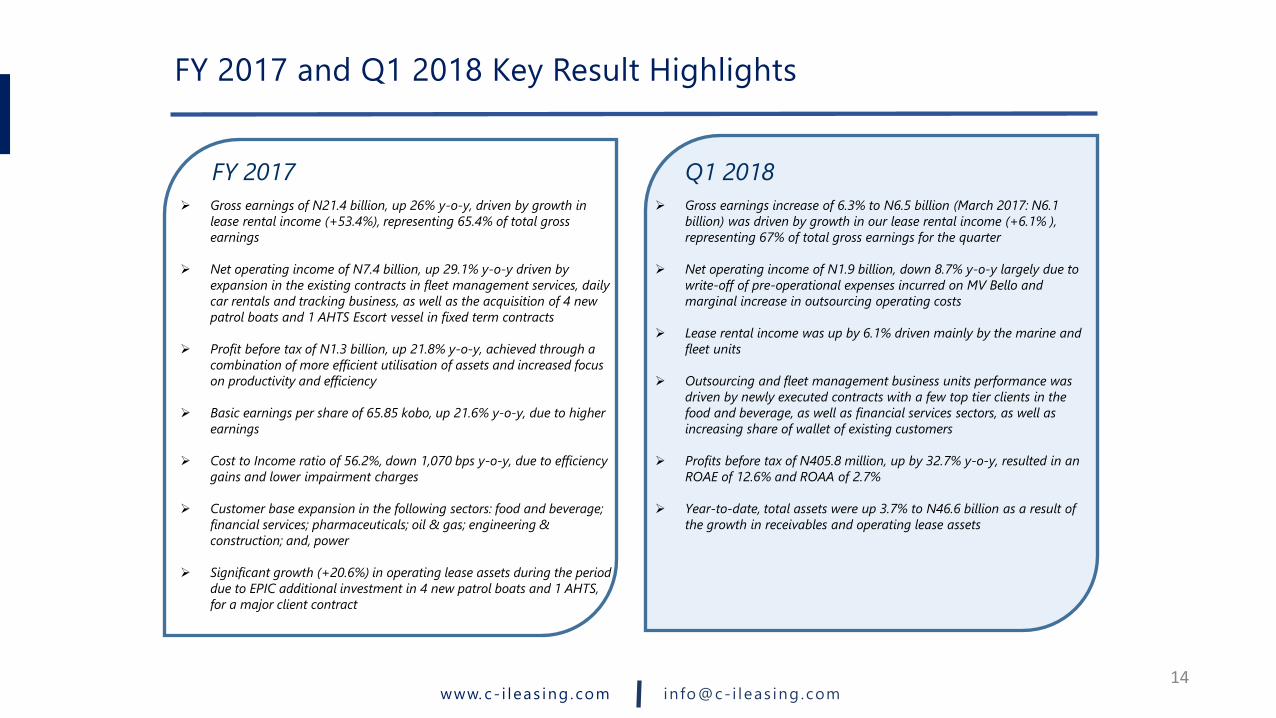
➢ Gross earnings of N21.4 billion, up 26% y-o-y, driven by growth in
lease rental income (+53.4%), representing 65.4% of total gross
earnings
➢ Net operating income of N7.4 billion, up 29.1% y-o-y driven by
expansion in the existing contracts in fleet management services, daily
car rentals and tracking business, as well as the acquisition of 4 new
patrol boats and 1 AHTS Escort vessel in fixed term contracts
➢ Profit before tax of N1.3 billion, up 21.8% y-o-y, achieved through a
combination of more efficient utilisation of assets and increased focus
on productivity and efficiency
➢ Basic earnings per share of 65.85 kobo, up 21.6% y-o-y, due to higher
earnings
➢ Cost to Income ratio of 56.2%, down 1,070 bps y-o-y, due to efficiency
gains and lower impairment charges
➢ Customer base expansion in the following sectors: food and beverage;
financial services; pharmaceuticals; oil & gas; engineering &
construction; and, power
➢ Significant growth (+20.6%) in operating lease assets during the period
due to EPIC additional investment in 4 new patrol boats and 1 AHTS,
for a major client contract
➢ Gross earnings increase of 6.3% to N6.5 billion (March 2017: N6.1
billion) was driven by growth in our lease rental income (+6.1% ),
representing 67% of total gross earnings for the quarter
➢ Net operating income of N1.9 billion, down 8.7% y-o-y largely due to
write-off of pre-operational expenses incurred on MV Bello and
marginal increase in outsourcing operating costs
➢ Lease rental income was up by 6.1% driven mainly by the marine and
fleet units
➢ Outsourcing and fleet management business units performance was
driven by newly executed contracts with a few top tier clients in the
food and beverage, as well as financial services sectors, as well as
increasing share of wallet of existing customers
➢ Profits before tax of N405.8 million, up by 32.7% y-o-y, resulted in an
ROAE of 12.6% and ROAA of 2.7%
➢ Year-to-date, total assets were up 3.7% to N46.6 billion as a result of
the growth in receivables and operating lease assets
www. c- i leas ing .com info@c-i leas ing .com
FY 2017 Key Performance Indicators
15
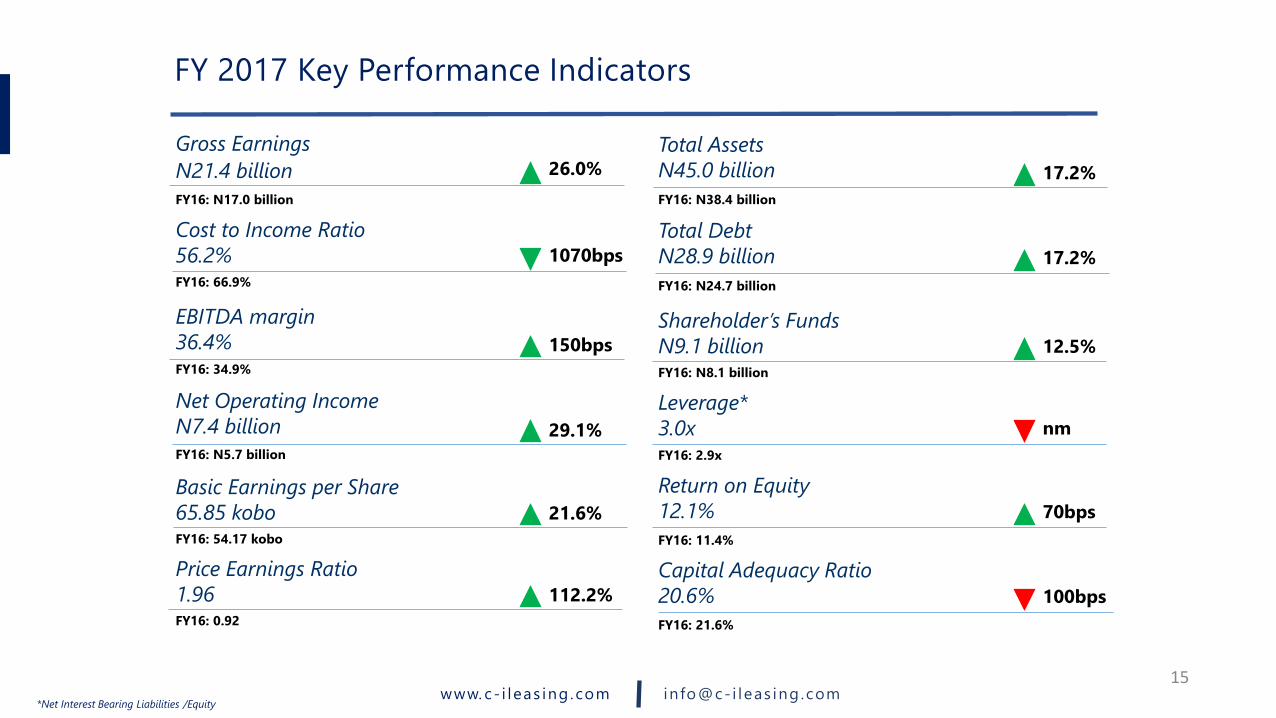
Gross Earnings
N21.4 billion
Total Assets
N45.0 billion
Total Debt
N28.9 billion
Shareholder’s Funds
N9.1 billion
Leverage*
3.0x
26.0% 17.2%
17.2%
12.5%
nm
FY16: N17.0 billion FY16: N38.4 billion
FY16: N24.7 billion
FY16: N8.1 billion
FY16: 2.9x
Cost to Income Ratio
56.2%
EBITDA margin
36.4%
Net Operating Income
N7.4 billion
1070bps
150bps
29.1%
FY16: 66.9%
FY16: 34.9%
FY16: N5.7 billion
Basic Earnings per Share
65.85 kobo 21.6%
FY16: 54.17 kobo
Return on Equity
12.1% 70bps
FY16: 11.4%
Price Earnings Ratio
1.96 112.2%
FY16: 0.92
Capital Adequacy Ratio
20.6% 100bps
FY16: 21.6%
*Net Interest Bearing Liabilities /Equity
www. c- i leas ing .com info@c-i leas ing .com
Q1 2018 Key Performance Indicators
16
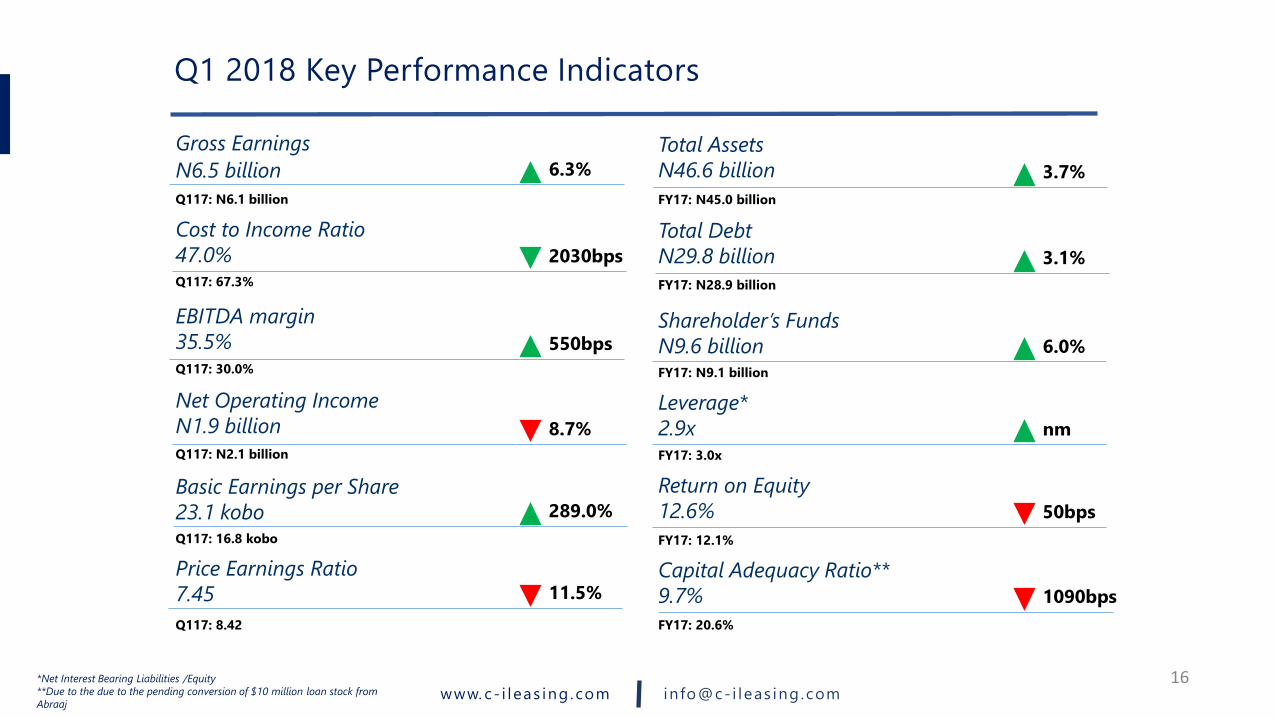
Total Assets
N46.6 billion
Total Debt
N29.8 billion
Shareholder’s Funds
N9.6 billion
Leverage*
2.9x
3.7%
3.1%
6.0%
nm
FY17: N45.0 billion
FY17: N28.9 billion
FY17: N9.1 billion
FY17: 3.0x
Return on Equity
12.6% 50bps
FY17: 12.1%
Capital Adequacy Ratio**
9.7% 1090bps
FY17: 20.6%
*Net Interest Bearing Liabilities /Equity
**Due to the due to the pending conversion of $10 million loan stock from
Abraaj
Gross Earnings
N6.5 billion 6.3%
Q117: N6.1 billion
Cost to Income Ratio
47.0%
EBITDA margin
35.5%
Net Operating Income
N1.9 billion
2030bps
550bps
8.7%
Q117: 67.3%
Q117: 30.0%
Q117: N2.1 billion
Basic Earnings per Share
23.1 kobo 289.0%
Q117: 16.8 kobo
Price Earnings Ratio
7.45 11.5%
Q117: 8.42
www. c- i leas ing .com info@c-i leas ing .com
An Industry with Good Growth Prospects
17
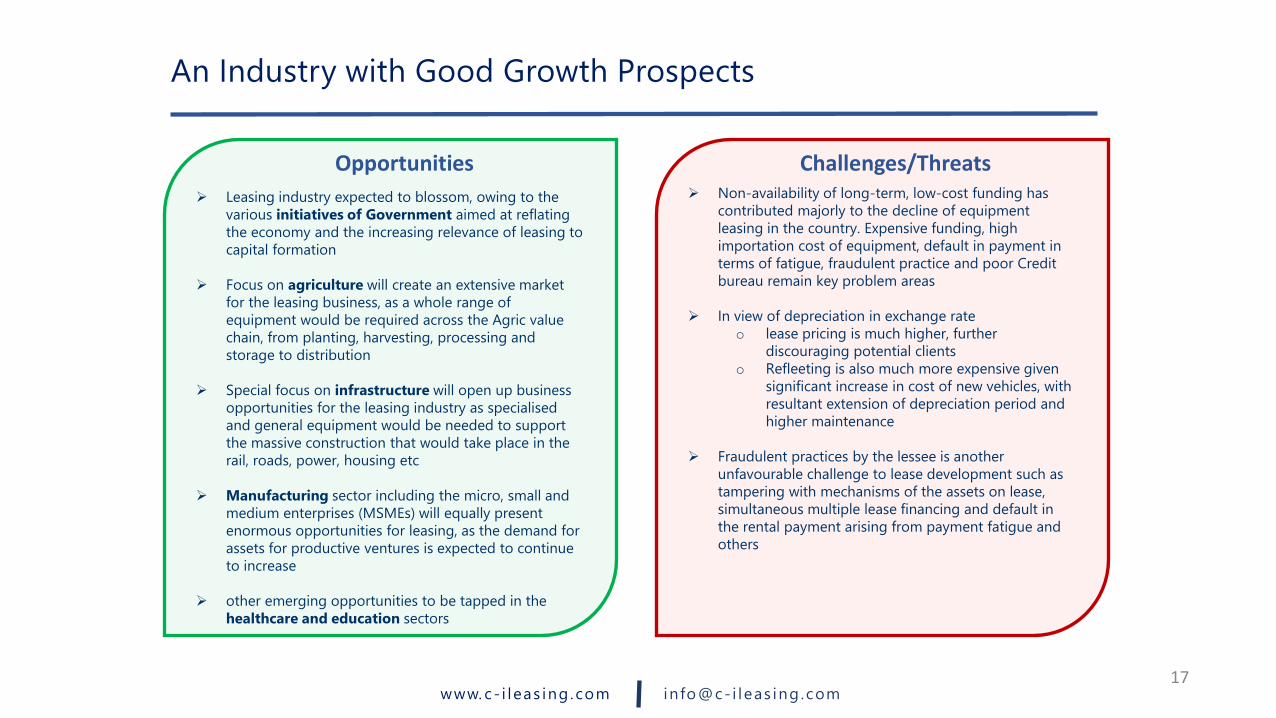
➢ Leasing industry expected to blossom, owing to the
various initiatives of Government aimed at reflating
the economy and the increasing relevance of leasing to
capital formation
➢ Focus on agriculture will create an extensive market
for the leasing business, as a whole range of
equipment would be required across the Agric value
chain, from planting, harvesting, processing and
storage to distribution
➢ Special focus on infrastructure will open up business
opportunities for the leasing industry as specialised
and general equipment would be needed to support
the massive construction that would take place in the
rail, roads, power, housing etc
➢ Manufacturing sector including the micro, small and
medium enterprises (MSMEs) will equally present
enormous opportunities for leasing, as the demand for
assets for productive ventures is expected to continue
to increase
➢ other emerging opportunities to be tapped in the
healthcare and education sectors
➢ Non-availability of long-term, low-cost funding has
contributed majorly to the decline of equipment
leasing in the country. Expensive funding, high
importation cost of equipment, default in payment in
terms of fatigue, fraudulent practice and poor Credit
bureau remain key problem areas
➢ In view of depreciation in exchange rate
o lease pricing is much higher, further
discouraging potential clients
o Refleeting is also much more expensive given
significant increase in cost of new vehicles, with
resultant extension of depreciation period and
higher maintenance
➢ Fraudulent practices by the lessee is another
unfavourable challenge to lease development such as
tampering with mechanisms of the assets on lease,
simultaneous multiple lease financing and default in
the rental payment arising from payment fatigue and
others
Opportunities Challenges/Threats

www. c- i leas ing .com info@c-i leas ing .com
Group Financial Performance
Review Mr Alex Mbakogu, CFO

www. c- i leas ing .com info@c-i leas ing .com
Consistent Top Line Growth Driven by Strong Business
Fundamentals
19
Income Statement Highlights (N’000)
FY 2016
(N’000)
FY 2017
(N’000)% Δ Q1 2017
(N’000)
Q1 2018
(N’000)% Δ
Gross Earnings 17,015,797 21,371,699 26% 6,097,820 6,479,104 6%
Lease Rental Income 9,110,756 13,972,951 53% 4,121,429 4,372,116 6%
Outsourcing Income 5,897,682 6,230,228 6% 1,565,276 1,631,178 4%
Lease Rental Expense (2,741,266) (4,861,802) 77% (1,457,406) (2,022,878) 39%
Indirect Operating
Expenses*(2,527,576) (2,674,293) 6% (833,188) (682,966) -18%
Net Operating
Income 5,711,360 7,375,298 29% 2,121,992 1,937,115 -9%
Profit/loss before tax 1,036,224 1,277,366 22% 305,688 405,753 33%
Profit/loss after tax 920,867 1,114,583 21% 270,791 373,008 38%
• Gross earnings increased by 26% from N17bn in FY2016 to N21bn in FY2017 on the back of
• an increase in operating and finance lease income on marine and fleet management services
• expansion in outsourcing business
• FY 2017 profit after tax increased by 21% y-o-y driven by more efficient asset utilisationand increased focus on productivity
• Notable growth in the fleet management and marine businesses, coupled with benefits and synergies from expansion of the lease rental portfolio
• Top line growth in Q1 2018 was driven by increase in the lease rental income largely from growth in the marine and fleet units
• Net operating income was down 9% as a result of the write-off of pre-operational expenses incurred on the MV Bello vessel and the marginal increase in outsourcing operating costs
• Increase in Profit Before Tax driven by the increase in other operating income from the gain on sale of operating lease assets and rent income from JV operations
*Normalised to exclude FX loss

www. c- i leas ing .com info@c-i leas ing .com
Gross Earnings Bridge (FY 2017 and Q1 2018)
20
6,097.8
6,479.1
250.765.9
(183.3)(31.7) 0.0
279.7
5,800
6,000
6,200
6,400
6,600
Gross earnings
(Q1 2017)
Lease rental
income
Outsourcing
income
Vehicle sales** Tracking income Interest income Other operating
income*
Gross earnings
(Q1 2018)
N, millions
N, millions
17,015.8
21,371.74,862.2 332.5
(386.6) (193.2)
51.4
(346.2)
20.5 15.3
0
6,000
12,000
18,000
24,000
Gross
earnings (FY
2016)
Lease rental
income
Outsourcing
income
Vehicle sales Tracking
income
Interest
income
Other
operating
income
Share of gain
from joint
venture
Profit for the
year from
discontinued
operation
Gross
earnings (FY
2017)
FY 2017
Q1 2018
*Q1 2018 Other operating income includes Gain on disposal of fixed and
operating leased assets, rent income and gain on JV operations . **Vehicle sales
negative contribution relates to the C&I motor discontinued operations.
www. c- i leas ing .com info@c-i leas ing .com
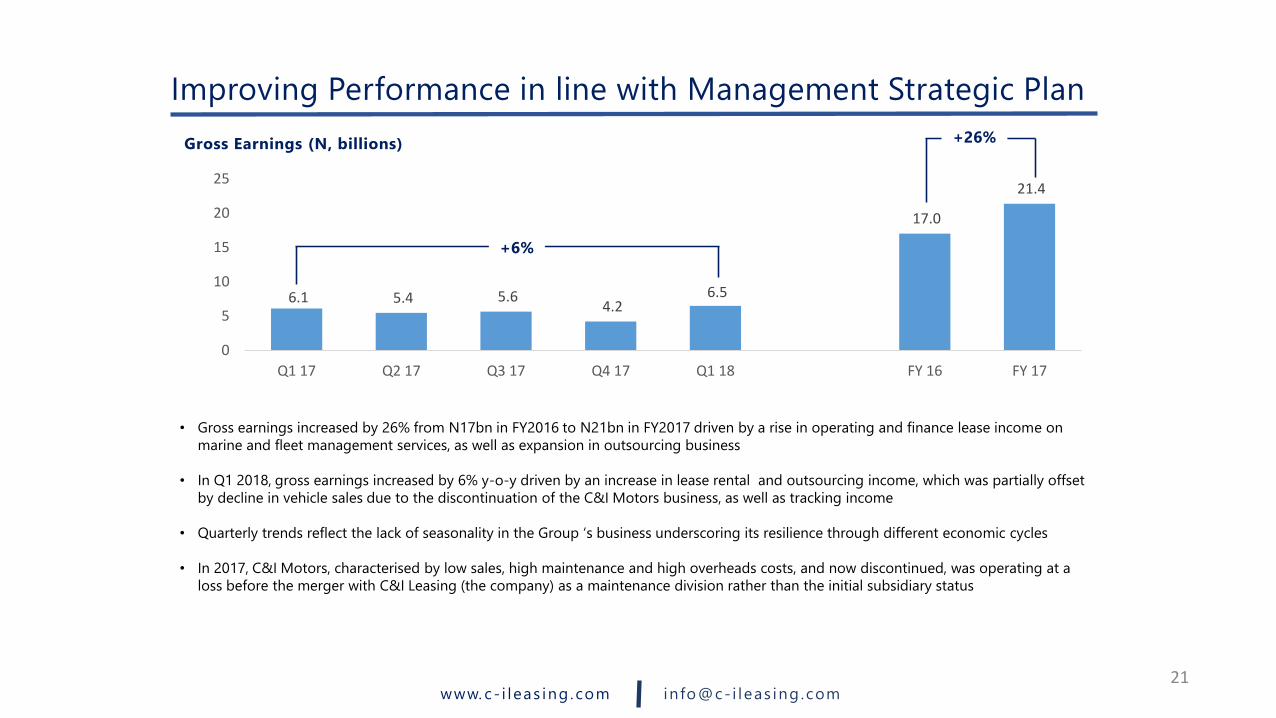
6.1 5.4 5.6 4.2
6.5
17.0
21.4
0
5
10
15
20
25
Q1 17 Q2 17 Q3 17 Q4 17 Q1 18 FY 16 FY 17
Gross Earnings (N, billions)
• Gross earnings increased by 26% from N17bn in FY2016 to N21bn in FY2017 driven by a rise in operating and finance lease income on
marine and fleet management services, as well as expansion in outsourcing business
• In Q1 2018, gross earnings increased by 6% y-o-y driven by an increase in lease rental and outsourcing income, which was partially offset
by decline in vehicle sales due to the discontinuation of the C&I Motors business, as well as tracking income
• Quarterly trends reflect the lack of seasonality in the Group ‘s business underscoring its resilience through different economic cycles
• In 2017, C&I Motors, characterised by low sales, high maintenance and high overheads costs, and now discontinued, was operating at a
loss before the merger with C&I Leasing (the company) as a maintenance division rather than the initial subsidiary status
Improving Performance in line with Management Strategic Plan
21
+6%
+26%
www. c- i leas ing .com info@c-i leas ing .com
Gross Earnings Evenly Distributed Across Business Segments,
with Increasingly Beneficial Geographic Diversification
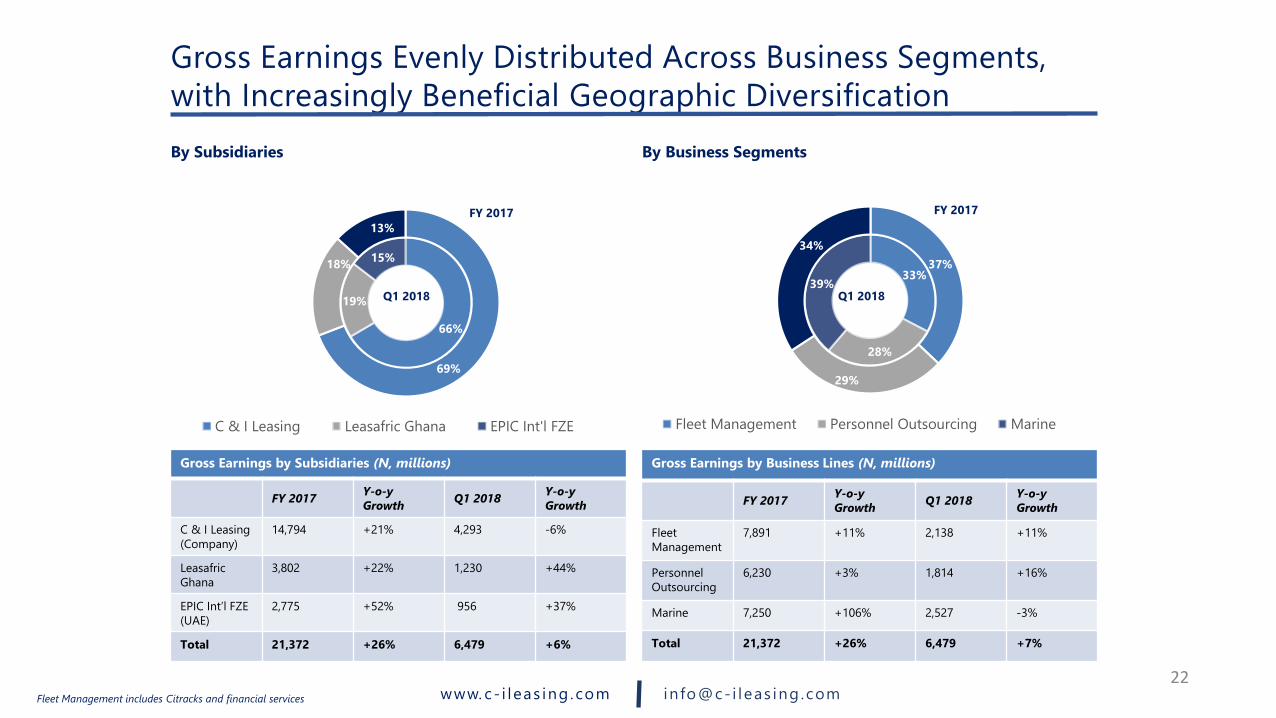
By Subsidiaries By Business Segments
Gross Earnings by Subsidiaries (N, millions)
FY 2017Y-o-y
GrowthQ1 2018
Y-o-y
Growth
C & I Leasing
(Company)
14,794 +21% 4,293 -6%
Leasafric
Ghana
3,802 +22% 1,230 +44%
EPIC Int’l FZE
(UAE)
2,775 +52% 956 +37%
Total 21,372 +26% 6,479 +6%
22
Gross Earnings by Business Lines (N, millions)
FY 2017Y-o-y
GrowthQ1 2018
Y-o-y
Growth
Fleet
Management
7,891 +11% 2,138 +11%
Personnel
Outsourcing
6,230 +3% 1,814 +16%
Marine 7,250 +106% 2,527 -3%
Total 21,372 +26% 6,479 +7%
66%
19%
15%
69%
18%
13%
C & I Leasing Leasafric Ghana EPIC Int'l FZE
Q1 2018
FY 2017
33%
28%
39%
37%
29%
34%
Fleet Management Personnel Outsourcing Marine
Q1 2018
FY 2017
Fleet Management includes Citracks and financial services

www. c- i leas ing .com info@c-i leas ing .com
Gross Earnings to Profit After Tax Bridge (FY 2017 and Q1 2018)
23
6,479.1
373.0
(2,022.9)
(1,455.0)(18.6) (1,045.6)
(35.1) (848.1)(238.2) (409.6) (32.7)
0
2,000
4,000
6,000
8,000
Gross earnings Lease rental
expenses
Outsourcing
expenses
Tracking
expenses
Lease interest
expenses
Impairment
charge
Depreciation
expense
Personnel
expenses
Other operating
expenses
Income tax Profit after Tax
N, millions
N, millions
FY 2017
Q1 2018
21,371.7
1,114.6
(4,861.8)
(5,525.6)
(72.6) (3,500.6)(235.3) (3,018.4)
(1,227.2) (42.2) (1,610.6) (162.8)0
5,000
10,000
15,000
20,000
25,000
Gross earnings Lease rental
expenses
Outsourcing
expenses
Tracking
expenses
Lease interest
expenses
Impairment
charge
Depreciation
expense
Personnel
expenses
Distribution
expenses
Other
operating
expenses
Income tax Profit after Tax
Lease rental expenses appear in the financial statements as direct leasing
expenses.
Direct expenses include: lease rental expenses; outsourcing expenses; tracking
expenses; and, finance lease expenses.
www. c- i leas ing .com info@c-i leas ing .com
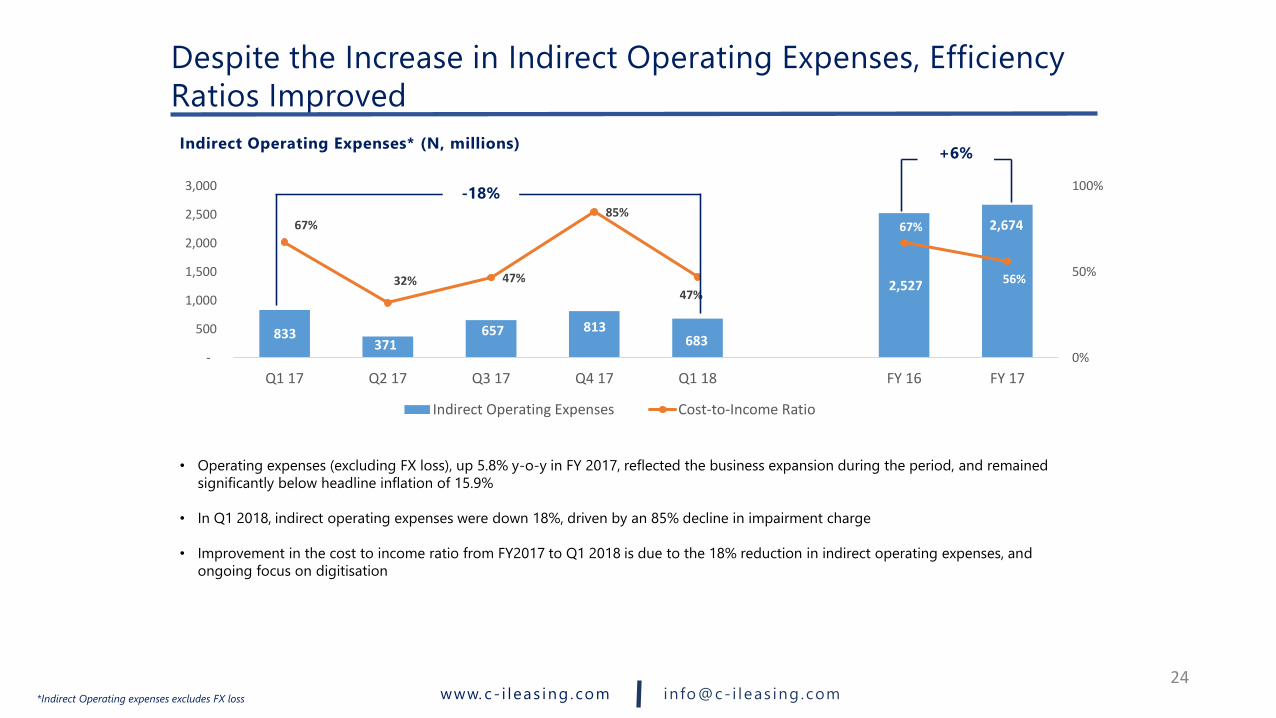
Indirect Operating Expenses* (N, millions)
833 371
657 813 683
2,527
2,674 67%
32% 47%
85%
47%
67%
56%
0%
50%
100%
-
500
1,000
1,500
2,000
2,500
3,000
Q1 17 Q2 17 Q3 17 Q4 17 Q1 18 FY 16 FY 17
Indirect Operating Expenses Cost-to-Income Ratio
• Operating expenses (excluding FX loss), up 5.8% y-o-y in FY 2017, reflected the business expansion during the period, and remained
significantly below headline inflation of 15.9%
• In Q1 2018, indirect operating expenses were down 18%, driven by an 85% decline in impairment charge
• Improvement in the cost to income ratio from FY2017 to Q1 2018 is due to the 18% reduction in indirect operating expenses, and
ongoing focus on digitisation
Despite the Increase in Indirect Operating Expenses, Efficiency
Ratios Improved
24
-18%
+6%
*Indirect Operating expenses excludes FX loss
www. c- i leas ing .com info@c-i leas ing .com
789
1,227
21
42 575
519 605
235
422 185
141
55
178
135
138
162
193
-21
479
979
1,479
1,979
2,479
2,979
3,479
2016 2017Personnel Expenses Distribution Expenses
Other Operating Expenses Impairment Charge
FX Loss Bank Charges
FY Operating Expenses (N, millions)
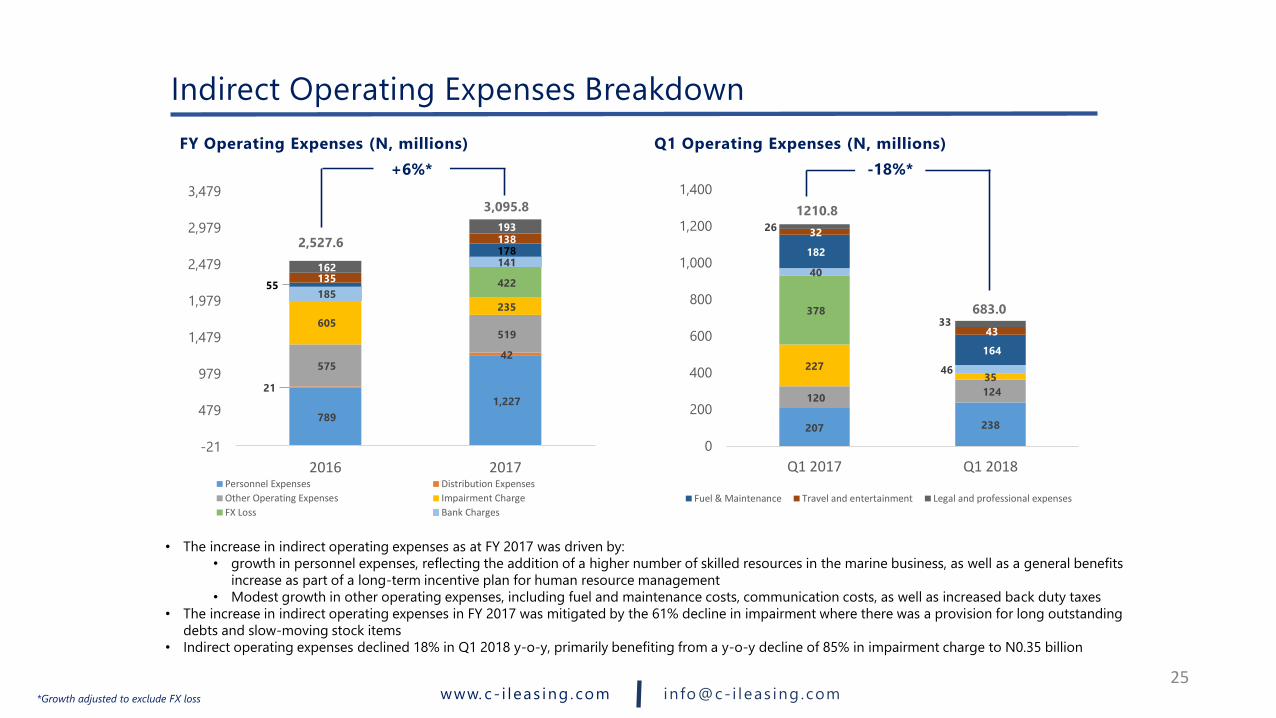
• The increase in indirect operating expenses as at FY 2017 was driven by:
• growth in personnel expenses, reflecting the addition of a higher number of skilled resources in the marine business, as well as a general benefits
increase as part of a long-term incentive plan for human resource management
• Modest growth in other operating expenses, including fuel and maintenance costs, communication costs, as well as increased back duty taxes
• The increase in indirect operating expenses in FY 2017 was mitigated by the 61% decline in impairment where there was a provision for long outstanding
debts and slow-moving stock items
• Indirect operating expenses declined 18% in Q1 2018 y-o-y, primarily benefiting from a y-o-y decline of 85% in impairment charge to N0.35 billion
Indirect Operating Expenses Breakdown
25
3,095.8
2,527.6
207 238
120 124
22735
378
40
46
182
164
32
43
26
33
0
200
400
600
800
1,000
1,200
1,400
Q1 2017 Q1 2018
Fuel & Maintenance Travel and entertainment Legal and professional expenses
Q1 Operating Expenses (N, millions)
1210.8
683.0
+6%* -18%*
*Growth adjusted to exclude FX loss

www. c- i leas ing .com info@c-i leas ing .com
305.7 309.2
542.3
104.8
405.8
1,036.2
1,277.4
0
200
400
600
800
1,000
1,200
1,400
Q1 17 Q2 17 Q3 17 Q4 17 Q1 18 FY 16 FY 17
• PBT of the Group increased by 23% between FY 2016 and FY 2017 due to solid and sustainable momentum in operating performance, and
upside potential from on-going cost efficiency initiatives and synergy, such as digitization and preventive maintenance of vessels to ensure
minimum breakdown
• Positive and stable performance across quarters, with variations attributable to accounting adjustments rather than business seasonality.
Q4 PBT was negatively impacted by a foreign exchange loss of N422 million and N94 million back-duty tax
• The positive trend seen in 2017 also reflects the impact of 4 NLNG Boats that became operational in February 2017 and of MV Bello,
another vessel which became operational in December 2017
Profit Before Tax (N, millions)
Profitability Improves Following Good Operating Performance and Cost Saving Initiatives
26
[y-o-y growth]
+33%
+23%

www. c- i leas ing .com info@c-i leas ing .com
Net Profit and Pre-tax Profit Margin (%)
4.4 5.0
5.5 5.8 5.4 5.1
5.0 5.3
6.7 6.3 6.1 6.0
-
2.0
4.0
6.0
8.0
-
2.0
4.0
6.0
8.0
Q1 17 H1 17 9M 17 Q1 18 FY 16 FY 17
Net Profit Margin Pre-tax Profit Margin
• Net profit margin decreased marginally by 0.2% year-on-year due to the increase in personnel costs and foreign exchange loss of N422 million
• EBITDA margin increased by 150bps from 34.9% in FY2016 to 36.4% in FY2017. Also, increased by 550bps in Q12018 year-on-year
• Pre-tax profit margin decreased slightly by 0.1% between FY2016 and FY2017
• FY 2017 EPS grew by 22% year-on-year, and was up by 292% year on year in Q1 2018, benefitting from other operating income resulting from the sale of lease assets
EBITDA Margin (%)
34.9
30.0 31.2 33.8
36.4 35.5
-
10.0
20.0
30.0
40.0
FY 16 Q1 17 H1 17 9M 17 FY 17 Q1 18
Exceptional Foreign Exchange Losses Impacted Margins
27
Earnings per Share (Kobo)
16.8
35.9
58.8
23.1
54.2
65.9
0.0
15.0
30.0
45.0
60.0
75.0
Q1 17 H1 17 9M 17 Q1 18 FY 16 FY 17

www. c- i leas ing .com info@c-i leas ing .com
Balance Sheet Snapshot
28
Summary Balance Sheet (N’000)
31 Dec
2016
(N’000)
31 Dec
2017
(N’000)
% Δ31 March
2018
(N’000)
% Δ
Total Assets 38,371,700 44,981,305 17% 46,635,506 4%
Operating Lease
Assets22,521,767 27,167,387 21% 27,754,168 2%
Shareholder’s Funds 8,093,027 9,100,691 12% 9,643,474 6%
Interest Bearing
Liabilities24,670,877 28,918,233 19% 29,796,038 3%
Net Interest Bearing
Liabilities / EBITDA 4.0x 3.5x Nm 3.4x Nm
Net Interest Bearing
Liabilities/Equity 2.9x 3.0x Nm 2.9x Nm
Net Interest Bearing
Liabilities/Total
Capitalisation
0.6x 0.6x Nm 0.6x Nm
Total Interest Bearing
Liabilities /Total
Capitalisation
0.6x 0.6x Nm 0.6x Nm
Net Interest Bearing
Liabilities/Operating
Profit
25.7x 24.8x Nm 23.3x Nm
• Operating lease assets as at 31 December 2017 rose by 21% y-o-y, due to EPIC additional investment in 4 new patrol boats and 1 AHTS
• As of 31 December 2017, total debt was up by 19% on the back of the earlier mentioned acquisition of additional operating lease assets in the marine business
• Despite the increase in debt at year end, debt efficiency ratios improved based on better operational and financial performance, as well as scheduled debt repayments. A portion of fleet finance lease facilities is expected to be paid down by the end of 2018
• In Q1 2018, borrowings grew by 3.0% to as a result of the issuance of new Commercial Paper
• Q1 2018 growth in total assets was driven largely by growth in withholding tax credit notes, prepayments and operating lease assets
www. c- i leas ing .com info@c-i leas ing .com
Total Assets (N, billions)
Shareholders’ Funds (N, billions)
38.4
47.9 44.2 44.7 45.0 46.6
0
10
20
30
40
50
60
FY 16 Q1 17 H1 17 9M 17 FY 17 Q1 18
8.1 8.3 8.2
9.0 9.1
9.6
7
8
8
9
9
10
10
FY 16 Q1 17 H1 17 9M 17 FY 17 Q1 18
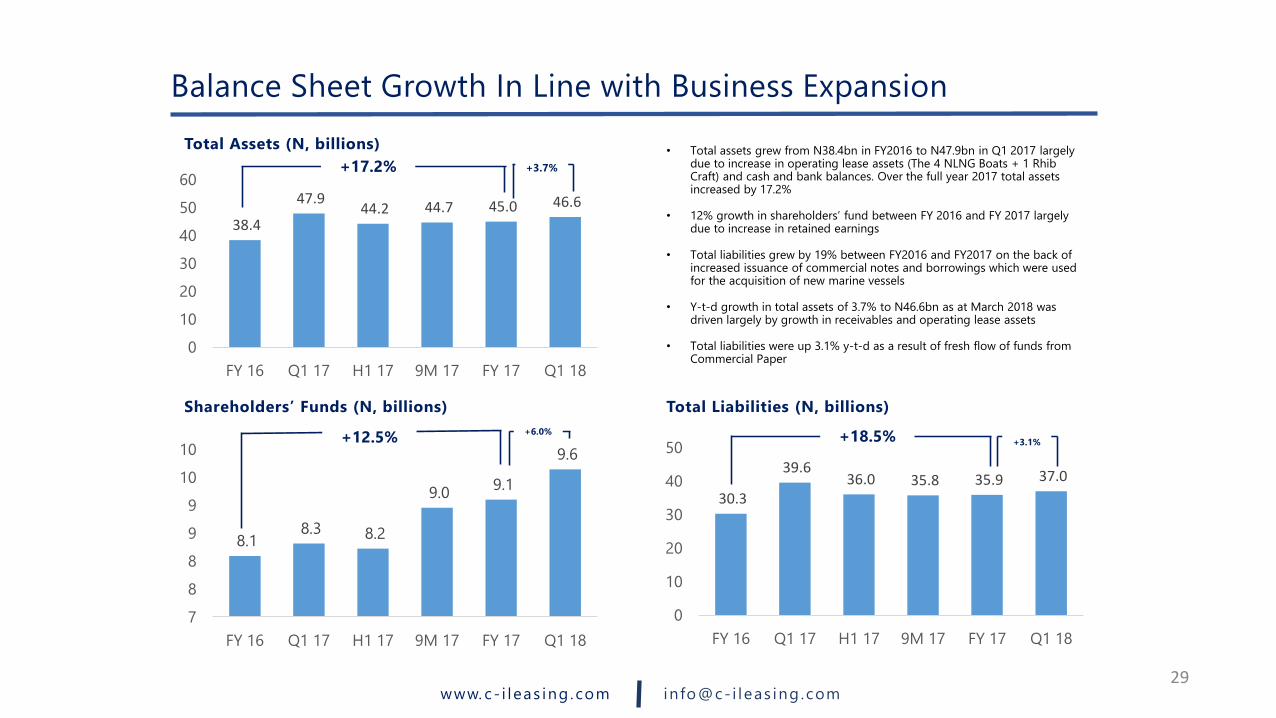
• Total assets grew from N38.4bn in FY2016 to N47.9bn in Q1 2017 largely due to increase in operating lease assets (The 4 NLNG Boats + 1 RhibCraft) and cash and bank balances. Over the full year 2017 total assets increased by 17.2%
• 12% growth in shareholders’ fund between FY 2016 and FY 2017 largely due to increase in retained earnings
• Total liabilities grew by 19% between FY2016 and FY2017 on the back of increased issuance of commercial notes and borrowings which were used for the acquisition of new marine vessels
• Y-t-d growth in total assets of 3.7% to N46.6bn as at March 2018 was driven largely by growth in receivables and operating lease assets
• Total liabilities were up 3.1% y-t-d as a result of fresh flow of funds from Commercial Paper
Total Liabilities (N, billions)
30.3
39.6 36.0 35.8 35.9 37.0
0
10
20
30
40
50
FY 16 Q1 17 H1 17 9M 17 FY 17 Q1 18
Balance Sheet Growth In Line with Business Expansion
29
+17.2%
+12.5% +18.5%
+3.7%
+6.0%+3.1%
www. c- i leas ing .com info@c-i leas ing .com30
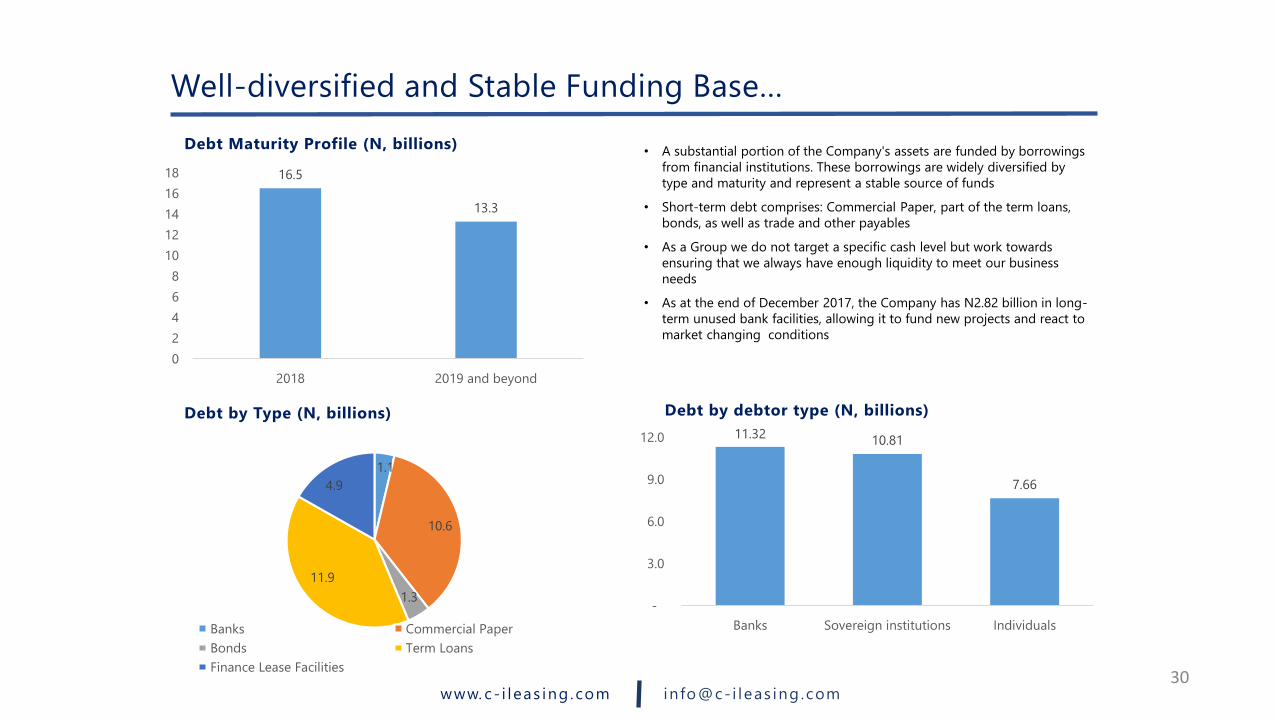
• A substantial portion of the Company's assets are funded by borrowings
from financial institutions. These borrowings are widely diversified by
type and maturity and represent a stable source of funds
• Short-term debt comprises: Commercial Paper, part of the term loans,
bonds, as well as trade and other payables
• As a Group we do not target a specific cash level but work towards
ensuring that we always have enough liquidity to meet our business
needs
• As at the end of December 2017, the Company has N2.82 billion in long-
term unused bank facilities, allowing it to fund new projects and react to
market changing conditions
Well-diversified and Stable Funding Base…
16.5
13.3
0
2
4
6
8
10
12
14
16
18
2018 2019 and beyond
Debt Maturity Profile (N, billions)
Debt by Type (N, billions)
11.3210.81
7.66
-
3.0
6.0
9.0
12.0
Banks Sovereign institutions Individuals
Debt by debtor type (N, billions)
1.1
10.6
1.3
11.9
4.9
Banks Commercial Paper
Bonds Term Loans
Finance Lease Facilities
www. c- i leas ing .com info@c-i leas ing .com
11,730
15,475
22,522
27,167 27,754
-
5,000
10,000
15,000
20,000
25,000
30,000
31-Dec-14 31-Dec-15 31 Dec'16 31 Dec'17 31 Mar'18
CAGR: +32.3%
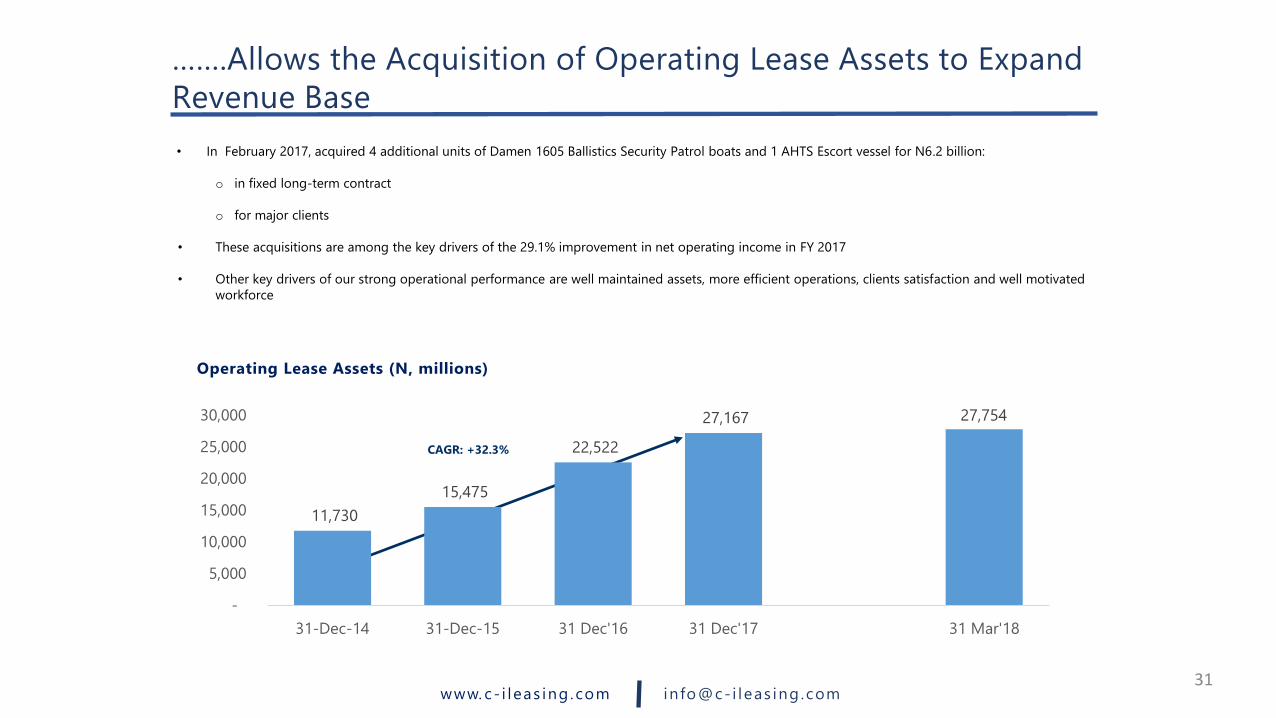
• In February 2017, acquired 4 additional units of Damen 1605 Ballistics Security Patrol boats and 1 AHTS Escort vessel for N6.2 billion:
o in fixed long-term contract
o for major clients
• These acquisitions are among the key drivers of the 29.1% improvement in net operating income in FY 2017
• Other key drivers of our strong operational performance are well maintained assets, more efficient operations, clients satisfaction and well motivated
workforce
…….Allows the Acquisition of Operating Lease Assets to Expand
Revenue Base
31
Operating Lease Assets (N, millions)

www. c- i leas ing .com info@c-i leas ing .com
Strategy & Outlook
Mr Andrew Otike-Odibi
www. c- i leas ing .com info@c-i leas ing .com
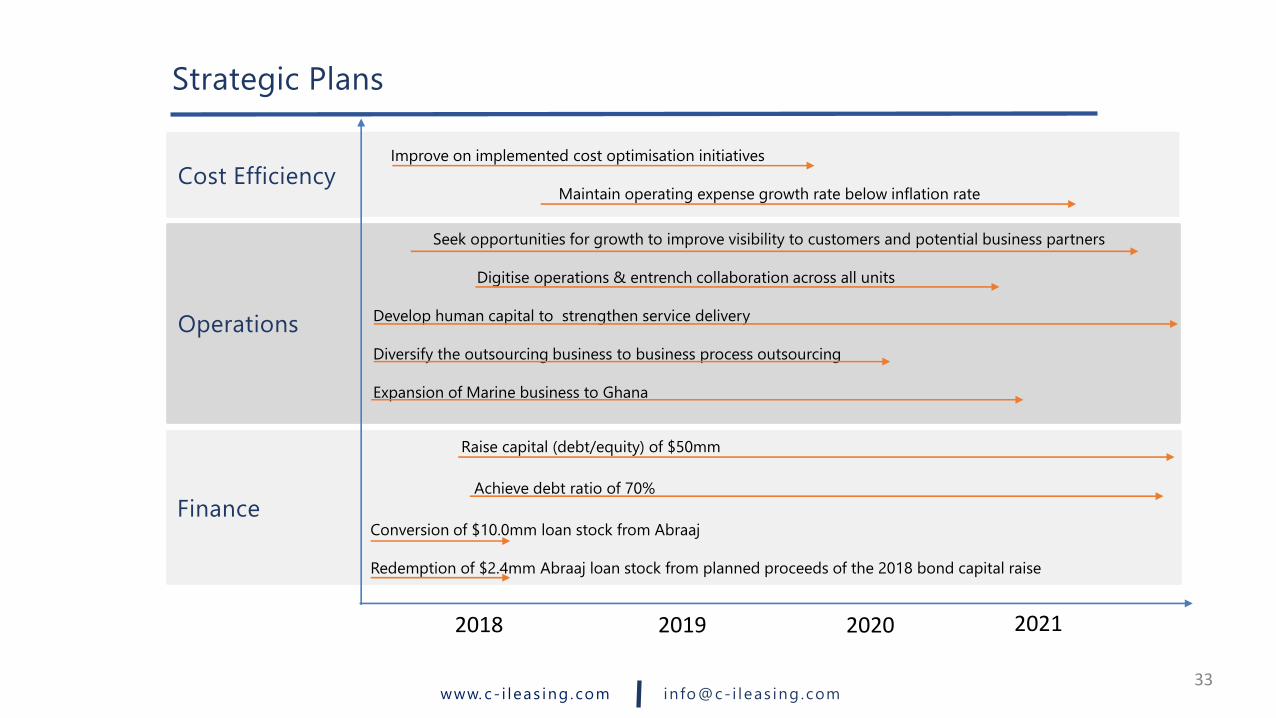
Strategic Plans
33
Improve on implemented cost optimisation initiatives
Maintain operating expense growth rate below inflation rate
Seek opportunities for growth to improve visibility to customers and potential business partners
Digitise operations & entrench collaboration across all units
Develop human capital to strengthen service delivery
Diversify the outsourcing business to business process outsourcing
Expansion of Marine business to Ghana
Cost Efficiency
Operations
Finance
Raise capital (debt/equity) of $50mm
Achieve debt ratio of 70%
Conversion of $10.0mm loan stock from Abraaj
Redemption of $2.4mm Abraaj loan stock from planned proceeds of the 2018 bond capital raise
2018 2019 2020 2021

www. c- i leas ing .com info@c-i leas ing .com
Net Profit
Margin
EBITDA Margin
Return on
Equity
Asset Turnover
ROCE
Metrics FY 2016FY 2017
GuidanceFY 2017
Actual
FY 2018
Guidance
FY 2018 Guidance
34
OPEX growth
Q1 2018
Actual
13% 13% 14%12% 13%
6% 5% 6%5% 6%
35% 36% 36%36% 36%
19% 57% 29%21% 22%
50% 50% 61%51%
15% 15% 14-15%22% -18%*
• No exceptional item
expected to impact
the business
• We do not anticipate
any adverse
movement in foreign
exchange currency.
We are assuming an
FX rate of N330/$
47%
*Growth adjusted to exclude FX loss

www. c- i leas ing .com info@c-i leas ing .com
Appendix

www. c- i leas ing .com info@c-i leas ing .com
CONTACT US
+234 903 777 5833
+234 8034070554
36