Embed Size (px)
Citation preview

INVESTOR PRESENTATION Q2 FY18
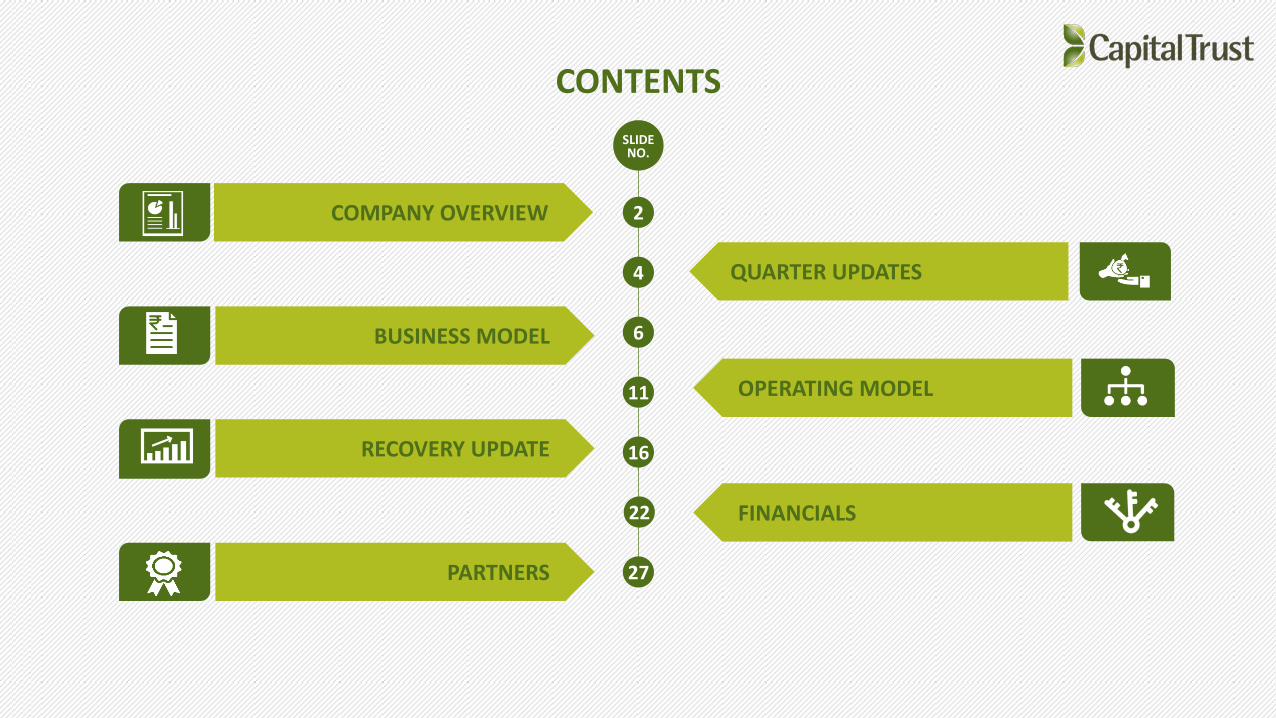
CONTENTS
SLIDE NO.
2
4
6
11
16
22
27
COMPANY OVERVIEW
BUSINESS MODEL
RECOVERY UPDATE
PARTNERS
OPERATING MODEL
FINANCIALS
QUARTER UPDATES

COMPANY OVERVIEW
2
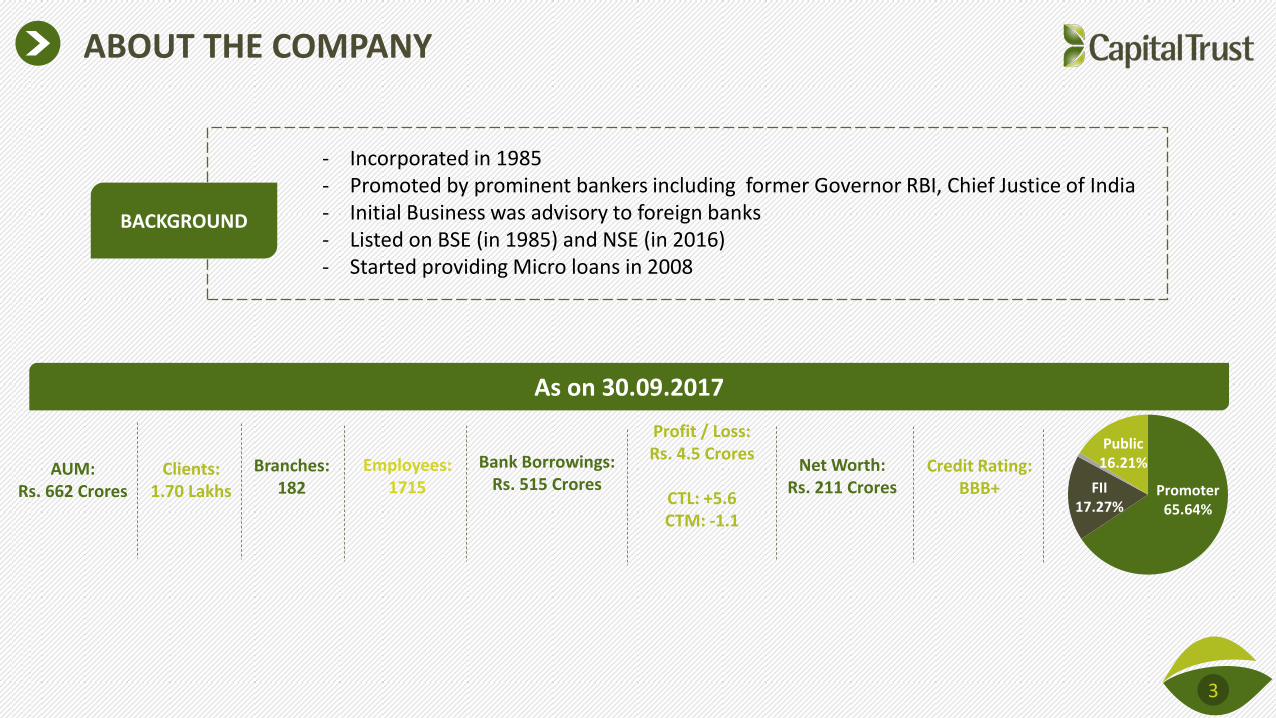
ABOUT THE COMPANY
- Incorporated in 1985 - Promoted by prominent bankers including former Governor RBI, Chief Justice of India - Initial Business was advisory to foreign banks - Listed on BSE (in 1985) and NSE (in 2016) - Started providing Micro loans in 2008
3
AUM: Rs. 662 Crores
Clients: 1.70 Lakhs
Branches:
182
Net Worth: Rs. 211 Crores
As on 30.09.2017
Profit / Loss: Rs. 4.5 Crores
CTL: +5.6 CTM: -1.1
Employees: 1715
Bank Borrowings: Rs. 515 Crores
Credit Rating:
BBB+
Promoter 65.64%
FII 17.27%
Public 16.21%
BACKGROUND

QUARTER UPDATES
4
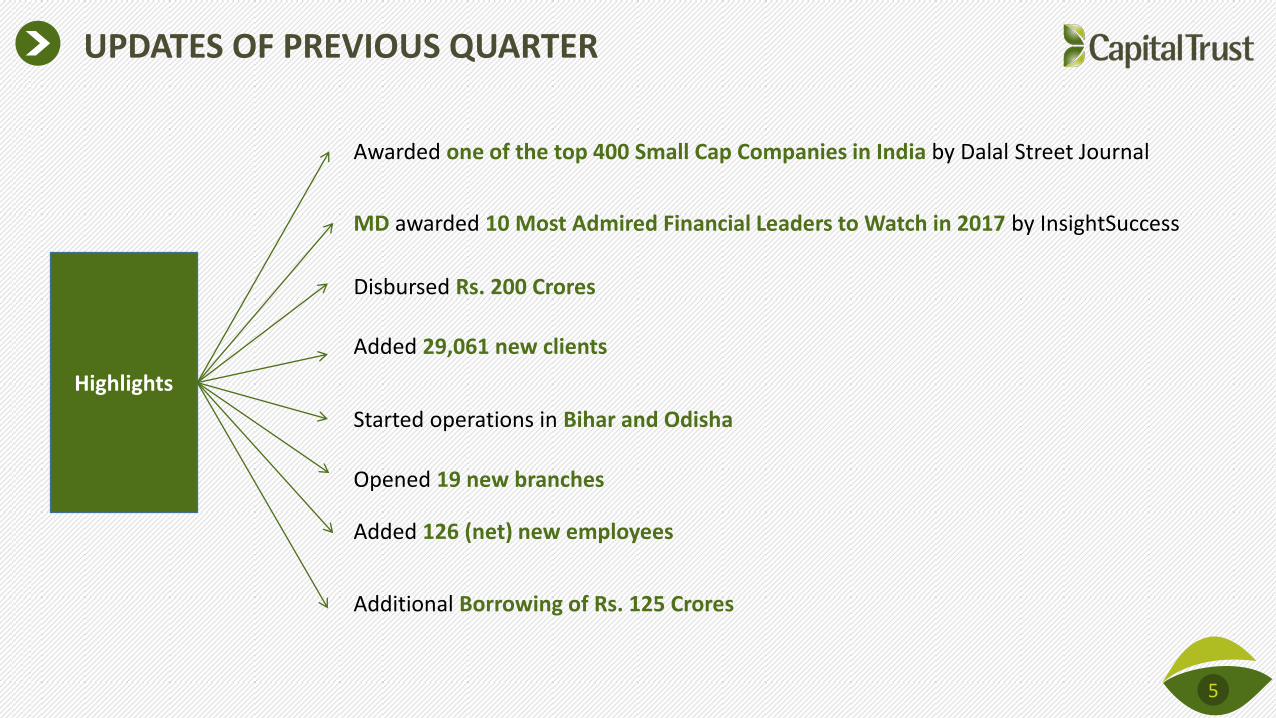
UPDATES OF PREVIOUS QUARTER
5
Highlights
Started operations in Bihar and Odisha
Added 126 (net) new employees
Additional Borrowing of Rs. 125 Crores
MD awarded 10 Most Admired Financial Leaders to Watch in 2017 by InsightSuccess
Opened 19 new branches
Added 29,061 new clients
Disbursed Rs. 200 Crores
Awarded one of the top 400 Small Cap Companies in India by Dalal Street Journal

BUSINESS MODEL
6
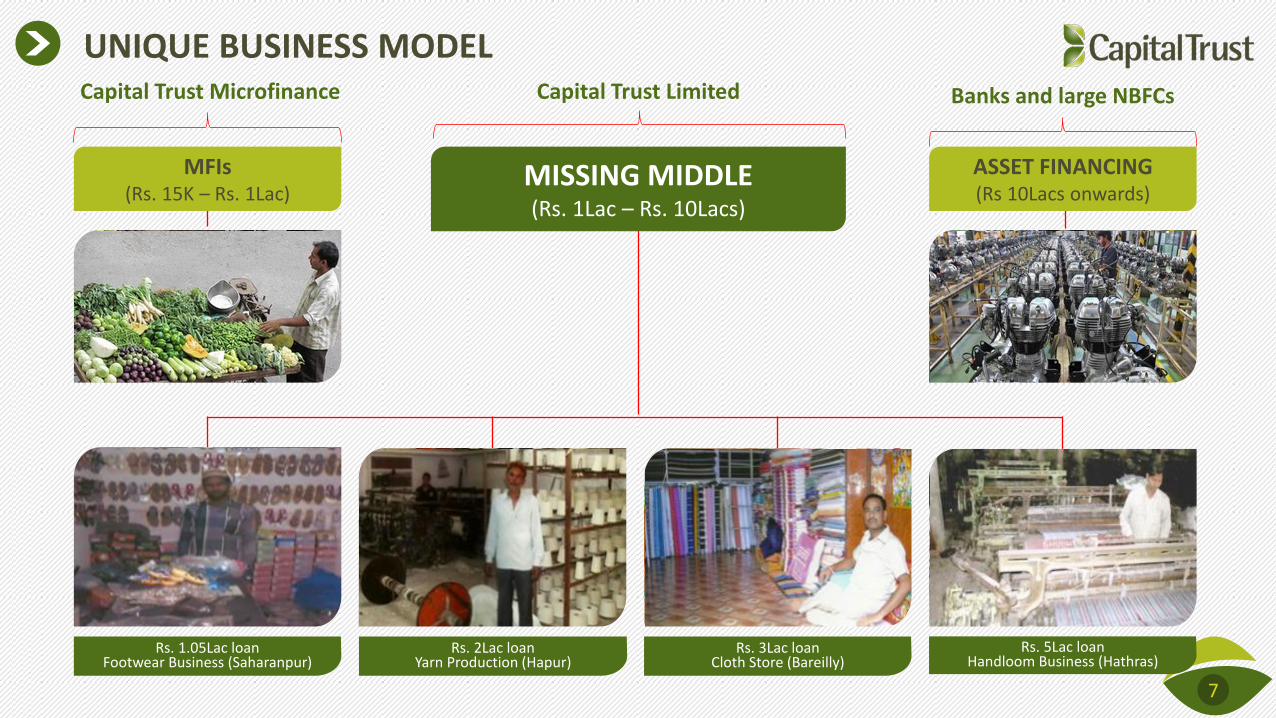
UNIQUE BUSINESS MODEL
Rs. 1.05Lac loan Footwear Business (Saharanpur)
Rs. 2Lac loan Yarn Production (Hapur)
Rs. 3Lac loan Cloth Store (Bareilly)
Rs. 5Lac loan Handloom Business (Hathras)
7
MISSING MIDDLE (Rs. 1Lac – Rs. 10Lacs)
MFIs (Rs. 15K – Rs. 1Lac)
ASSET FINANCING (Rs 10Lacs onwards)
Capital Trust Microfinance Capital Trust Limited Banks and large NBFCs
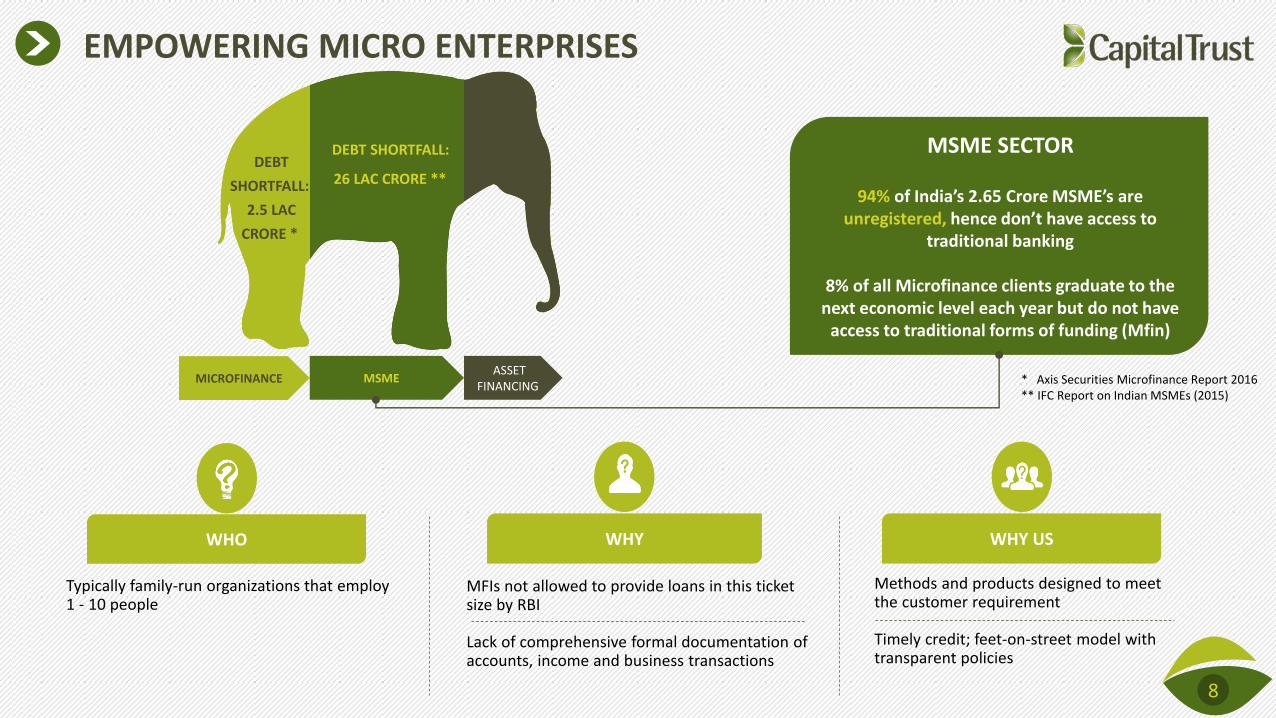
DEBT
SHORTFALL:
2.5 LAC
CRORE *
DEBT SHORTFALL:
26 LAC CRORE **
MICROFINANCE MSME ASSET
FINANCING * Axis Securities Microfinance Report 2016 ** IFC Report on Indian MSMEs (2015)
MSME SECTOR
94% of India’s 2.65 Crore MSME’s are unregistered, hence don’t have access to
traditional banking
8% of all Microfinance clients graduate to the next economic level each year but do not have
access to traditional forms of funding (Mfin)
8
EMPOWERING MICRO ENTERPRISES
WHO WHY WHY US
Typically family-run organizations that employ 1 - 10 people
MFIs not allowed to provide loans in this ticket size by RBI Lack of comprehensive formal documentation of accounts, income and business transactions
Methods and products designed to meet the customer requirement Timely credit; feet-on-street model with transparent policies
LOAN PRODUCTS
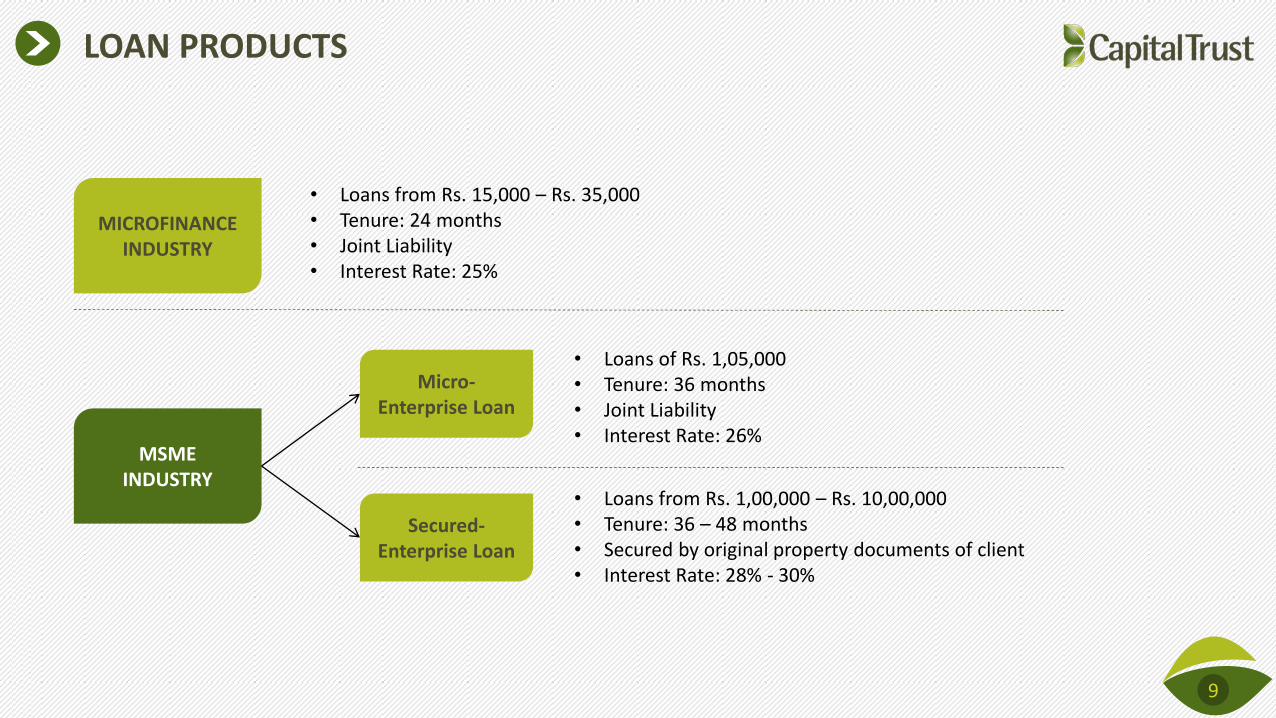
MICROFINANCE INDUSTRY
MSME INDUSTRY
• Loans from Rs. 15,000 – Rs. 35,000 • Tenure: 24 months • Joint Liability • Interest Rate: 25%
Micro-Enterprise Loan
• Loans of Rs. 1,05,000 • Tenure: 36 months • Joint Liability • Interest Rate: 26%
Secured-Enterprise Loan
• Loans from Rs. 1,00,000 – Rs. 10,00,000 • Tenure: 36 – 48 months • Secured by original property documents of client • Interest Rate: 28% - 30%
9
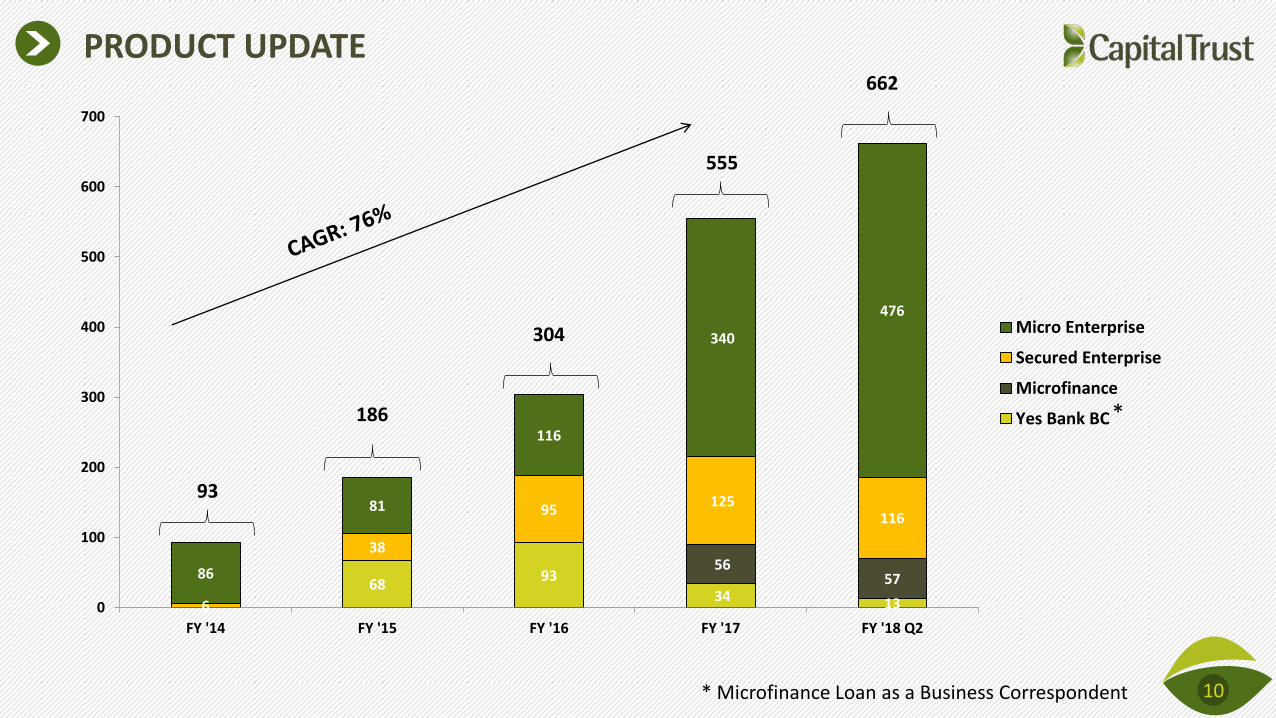
PRODUCT UPDATE
10 * Microfinance Loan as a Business Correspondent
68 93
34 13
56 57
6
38
95 125
116
86
81
116
340
476
0
100
200
300
400
500
600
700
FY '14 FY '15 FY '16 FY '17 FY '18 Q2
Micro Enterprise
Secured Enterprise
Microfinance
Yes Bank BC
93
186
304
555
662
*

OPERATING MODEL
11
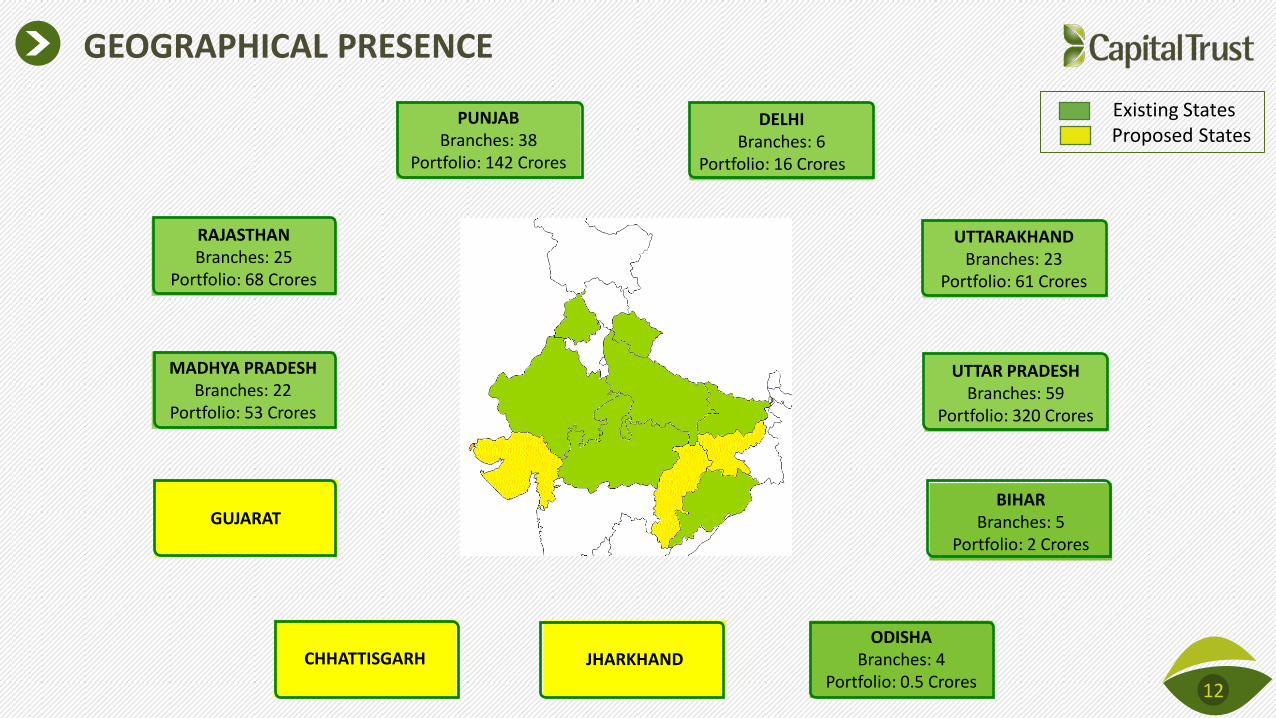
GUJARAT
GEOGRAPHICAL PRESENCE
12
UTTARAKHAND Branches: 23
Portfolio: 61 Crores
Existing States Proposed States
DELHI Branches: 6
Portfolio: 16 Crores
UTTAR PRADESH Branches: 59
Portfolio: 320 Crores
PUNJAB Branches: 38
Portfolio: 142 Crores
RAJASTHAN Branches: 25
Portfolio: 68 Crores
MADHYA PRADESH Branches: 22
Portfolio: 53 Crores
BIHAR Branches: 5
Portfolio: 2 Crores
ODISHA Branches: 4
Portfolio: 0.5 Crores
CHHATTISGARH
JHARKHAND
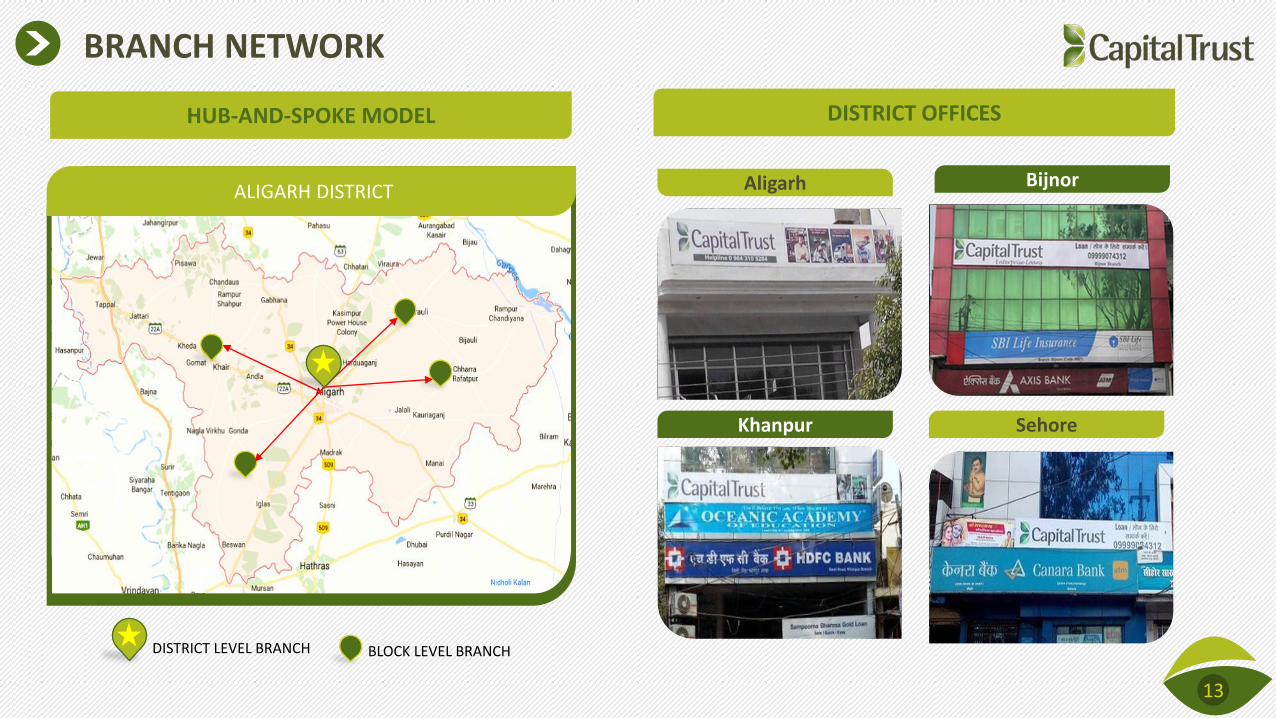
BRANCH NETWORK
ALIGARH DISTRICT
HUB-AND-SPOKE MODEL
DISTRICT LEVEL BRANCH BLOCK LEVEL BRANCH
13
Aligarh Bijnor
Sehore Khanpur
DISTRICT OFFICES
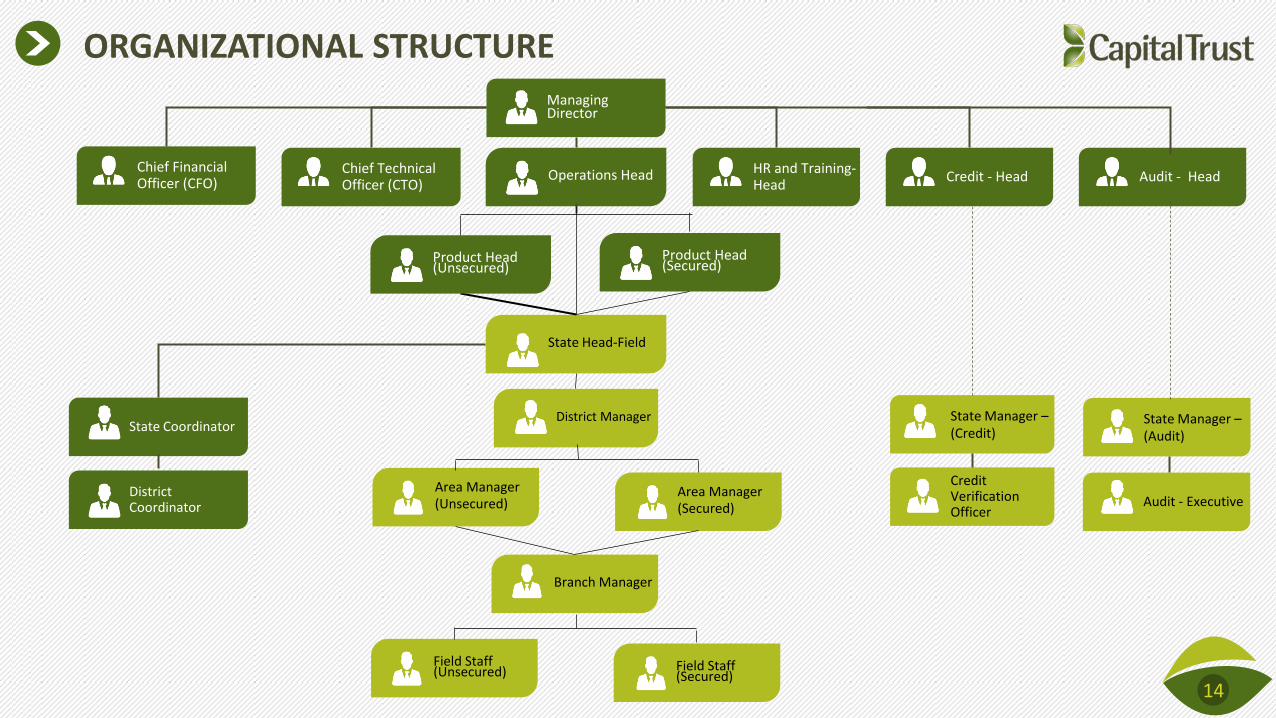
ORGANIZATIONAL STRUCTURE
Managing Director
Operations Head
14
State Head-Field
Branch Manager
HR and Training-Head
Credit - Head Audit - Head Chief Financial Officer (CFO)
Chief Technical Officer (CTO)
State Manager –(Credit)
State Manager –(Audit)
Credit Verification Officer
Audit - Executive
State Coordinator
District Coordinator
District Manager
Product Head (Unsecured)
Product Head (Secured)
Field Staff (Unsecured) Field Staff
(Secured)
Area Manager (Unsecured)
Area Manager (Secured)
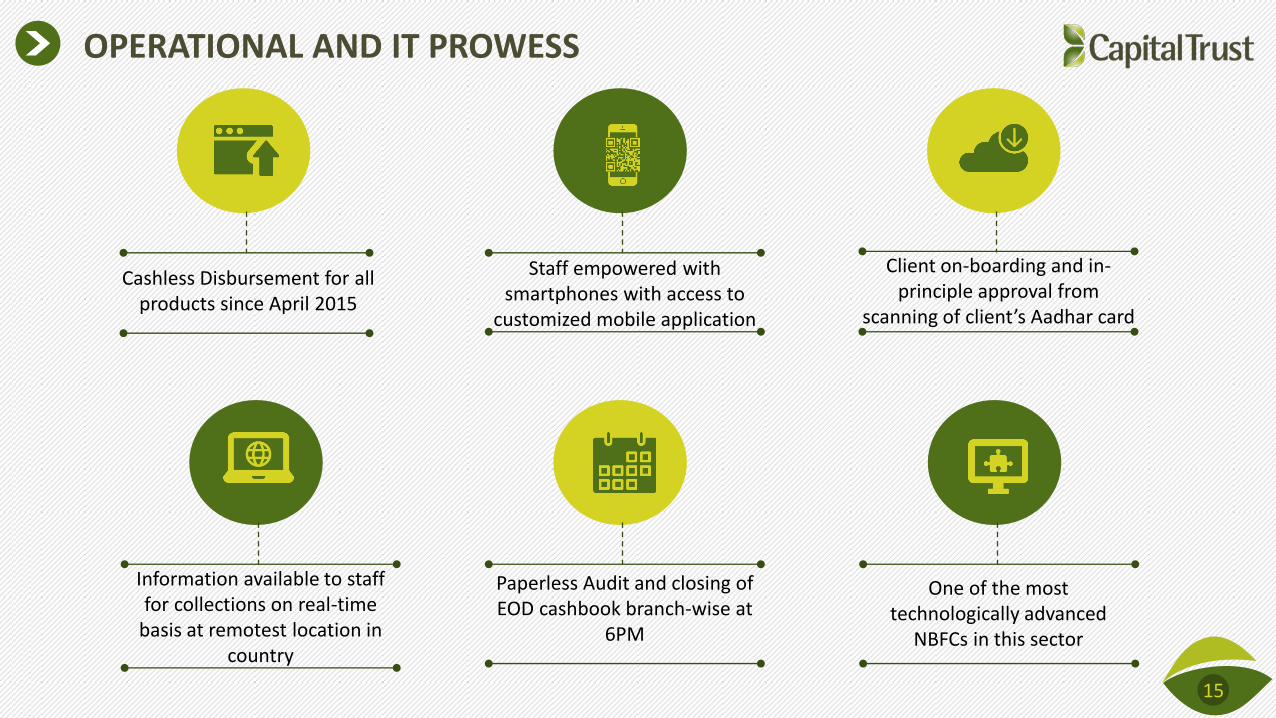
OPERATIONAL AND IT PROWESS
Cashless Disbursement for all products since April 2015
Information available to staff for collections on real-time
basis at remotest location in country
Staff empowered with smartphones with access to
customized mobile application
Client on-boarding and in-principle approval from
scanning of client’s Aadhar card
Paperless Audit and closing of EOD cashbook branch-wise at
6PM
One of the most technologically advanced
NBFCs in this sector
15

RECOVERY UPDATE
16
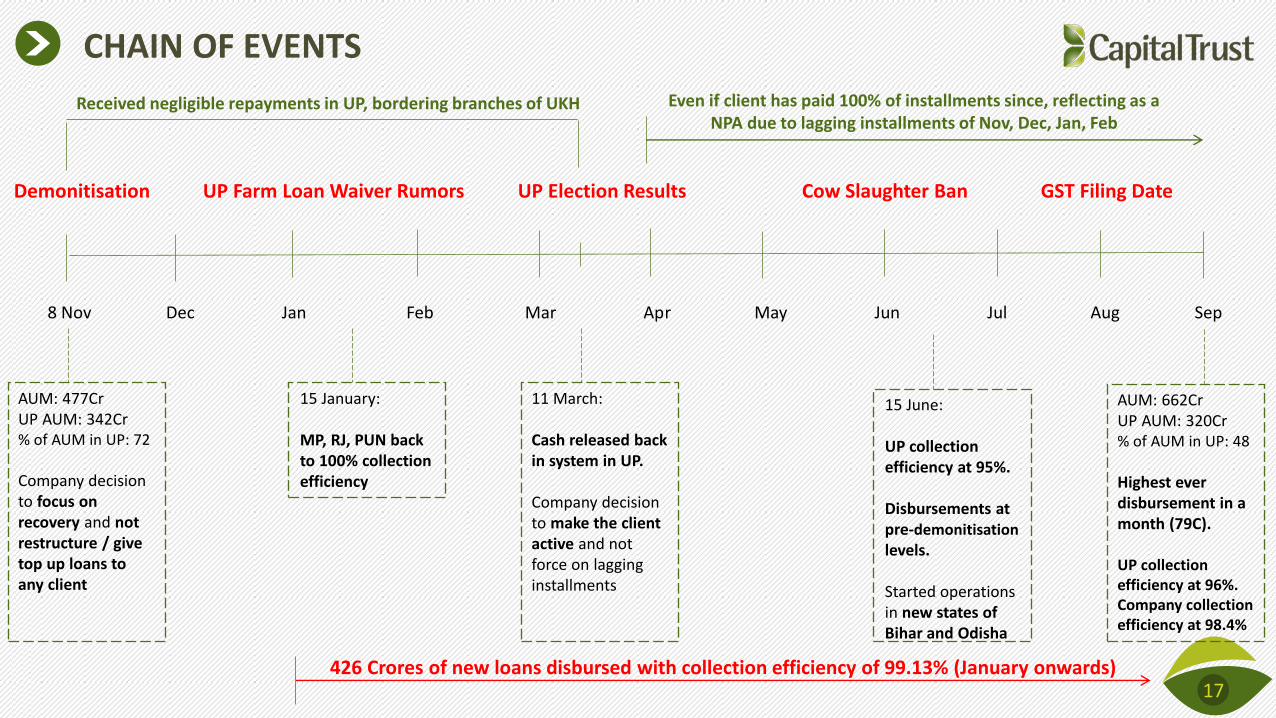
CHAIN OF EVENTS
17
8 Nov Dec Jan Feb Mar Apr May Jun Jul Aug Sep
AUM: 477Cr UP AUM: 342Cr % of AUM in UP: 72 Company decision to focus on recovery and not restructure / give top up loans to any client
Demonitisation UP Farm Loan Waiver Rumors UP Election Results Cow Slaughter Ban GST Filing Date
11 March: Cash released back in system in UP. Company decision to make the client active and not force on lagging installments
AUM: 662Cr UP AUM: 320Cr % of AUM in UP: 48 Highest ever disbursement in a month (79C). UP collection efficiency at 96%. Company collection efficiency at 98.4%
15 January: MP, RJ, PUN back to 100% collection efficiency
Received negligible repayments in UP, bordering branches of UKH Even if client has paid 100% of installments since, reflecting as a NPA due to lagging installments of Nov, Dec, Jan, Feb
15 June: UP collection efficiency at 95%. Disbursements at pre-demonitisation
levels. Started operations in new states of Bihar and Odisha
426 Crores of new loans disbursed with collection efficiency of 99.13% (January onwards)
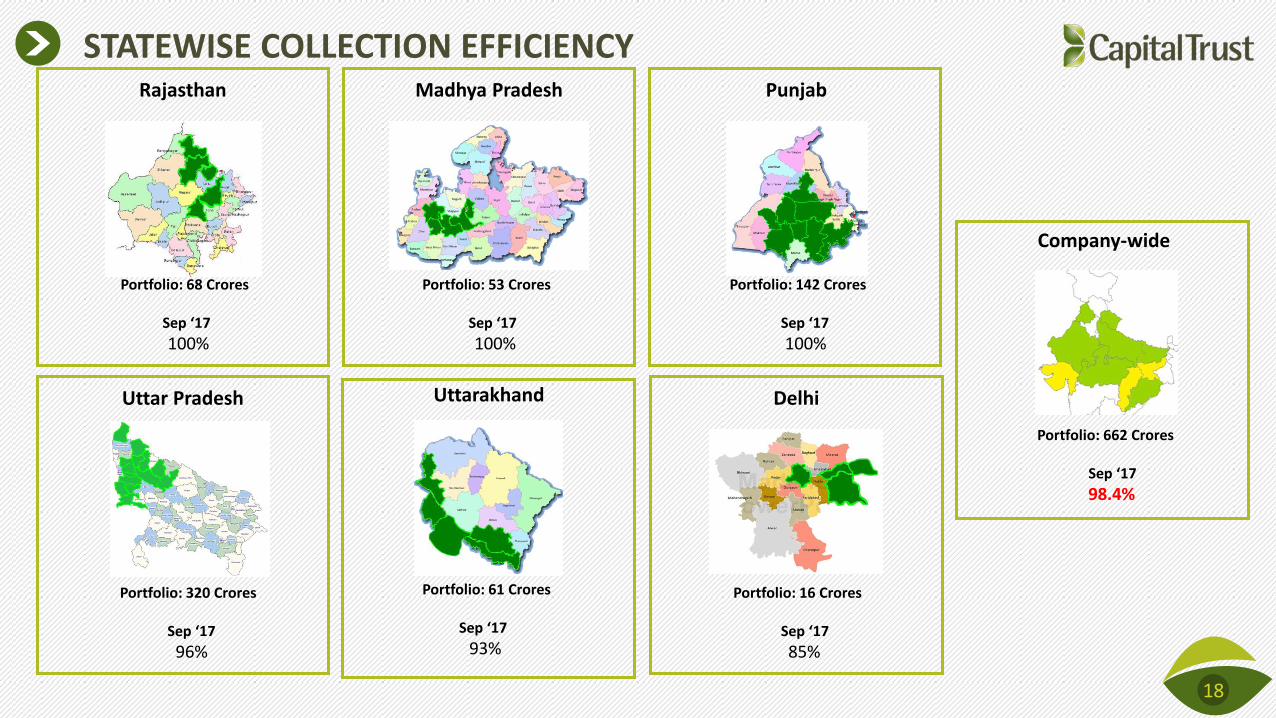
Company-wide
Portfolio: 662 Crores Sep ‘17
98.4%
STATEWISE COLLECTION EFFICIENCY
18
Rajasthan
Portfolio: 68 Crores
Sep ‘17
100%
Madhya Pradesh
Portfolio: 53 Crores
Sep ‘17
100%
Uttarakhand
Portfolio: 61 Crores Sep ‘17
93%
Punjab
Portfolio: 142 Crores Sep ‘17
100%
Uttar Pradesh
Portfolio: 320 Crores Sep ‘17
96%
Delhi
Portfolio: 16 Crores Sep ‘17
85%
CUMULATIVE MONTHLY COLLECTION
19
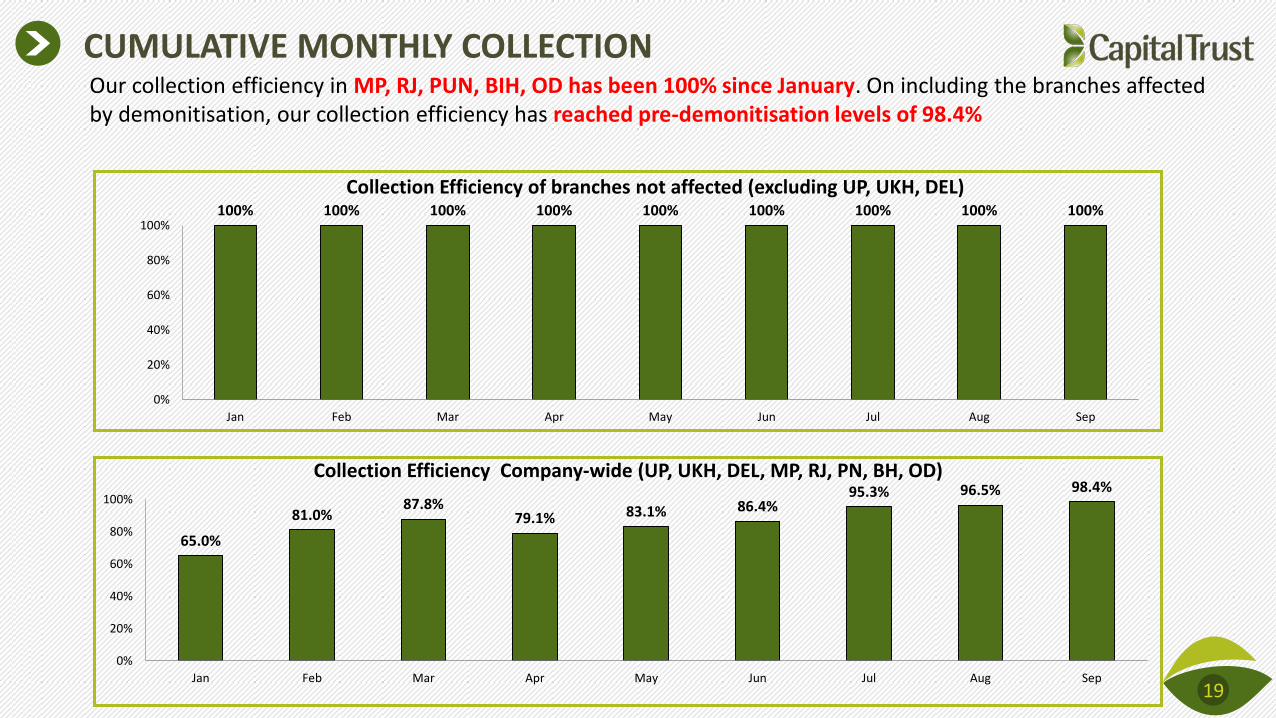
Our collection efficiency in MP, RJ, PUN, BIH, OD has been 100% since January. On including the branches affected by demonitisation, our collection efficiency has reached pre-demonitisation levels of 98.4%
100% 100% 100% 100% 100% 100% 100% 100% 100%
0%
20%
40%
60%
80%
100%
Jan Feb Mar Apr May Jun Jul Aug Sep
Collection Efficiency of branches not affected (excluding UP, UKH, DEL)
65.0%
81.0% 87.8%
79.1% 83.1% 86.4% 95.3% 96.5% 98.4%
0%
20%
40%
60%
80%
100%
Jan Feb Mar Apr May Jun Jul Aug Sep
Collection Efficiency Company-wide (UP, UKH, DEL, MP, RJ, PN, BH, OD)
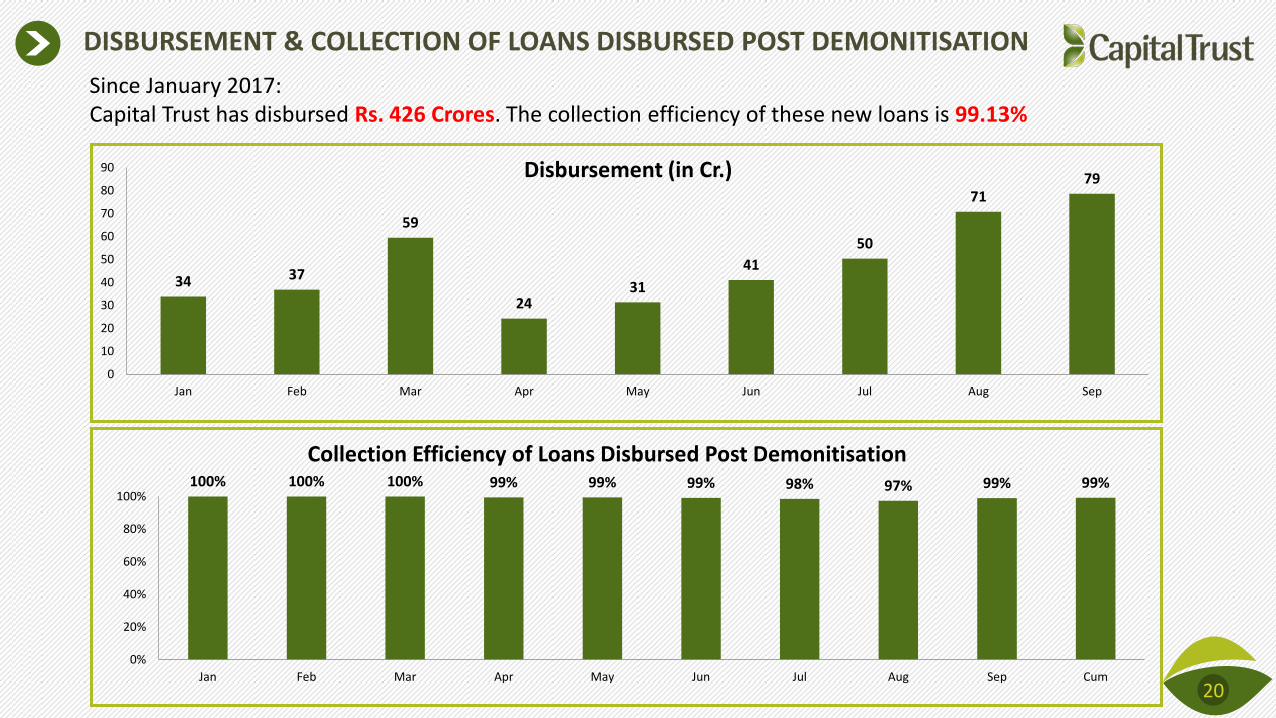
DISBURSEMENT & COLLECTION OF LOANS DISBURSED POST DEMONITISATION
20
34 37
59
24 31
41
50
71 79
0
10
20
30
40
50
60
70
80
90
Jan Feb Mar Apr May Jun Jul Aug Sep
Disbursement (in Cr.)
100% 100% 100% 99% 99% 99% 98% 97% 99% 99%
0%
20%
40%
60%
80%
100%
Jan Feb Mar Apr May Jun Jul Aug Sep Cum
Collection Efficiency of Loans Disbursed Post Demonitisation
Since January 2017: Capital Trust has disbursed Rs. 426 Crores. The collection efficiency of these new loans is 99.13%
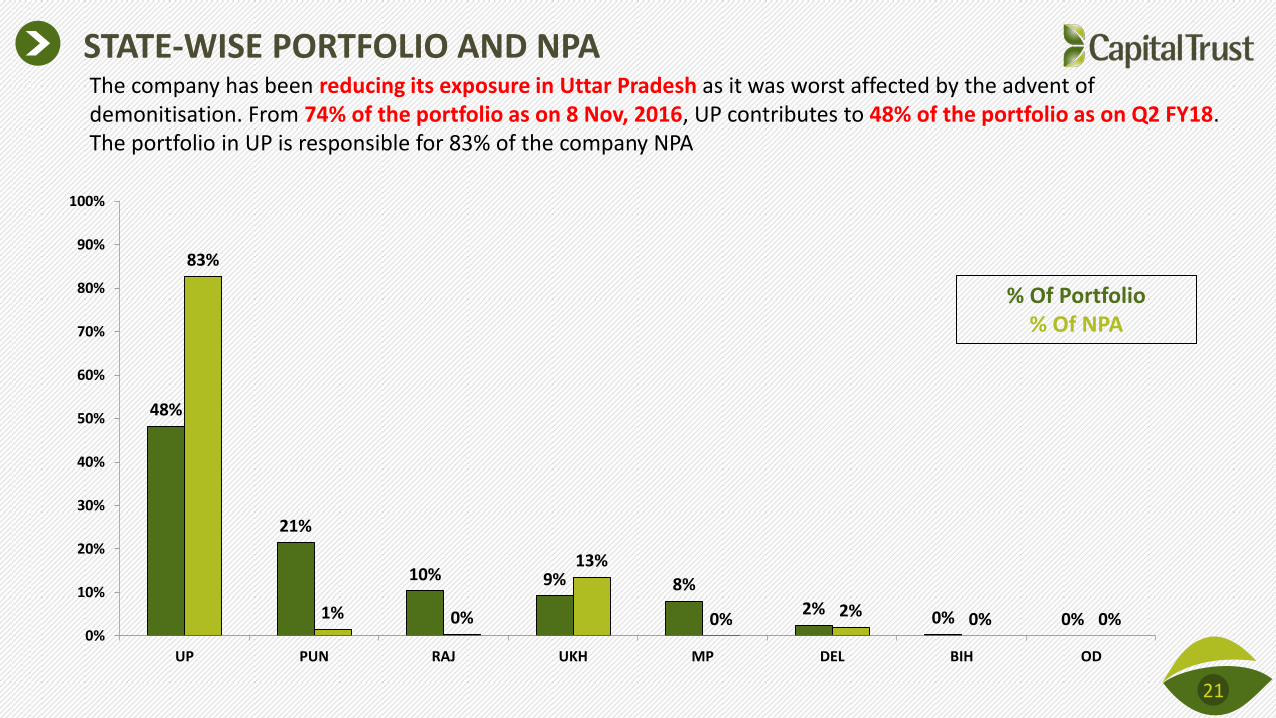
STATE-WISE PORTFOLIO AND NPA
21
48%
21%
10% 9% 8%
2% 0% 0%
83%
1% 0%
13%
0% 2% 0% 0% 0%
10%
20%
30%
40%
50%
60%
70%
80%
90%
100%
UP PUN RAJ UKH MP DEL BIH OD
% Of Portfolio % Of NPA
The company has been reducing its exposure in Uttar Pradesh as it was worst affected by the advent of demonitisation. From 74% of the portfolio as on 8 Nov, 2016, UP contributes to 48% of the portfolio as on Q2 FY18. The portfolio in UP is responsible for 83% of the company NPA

FINANCIALS
22
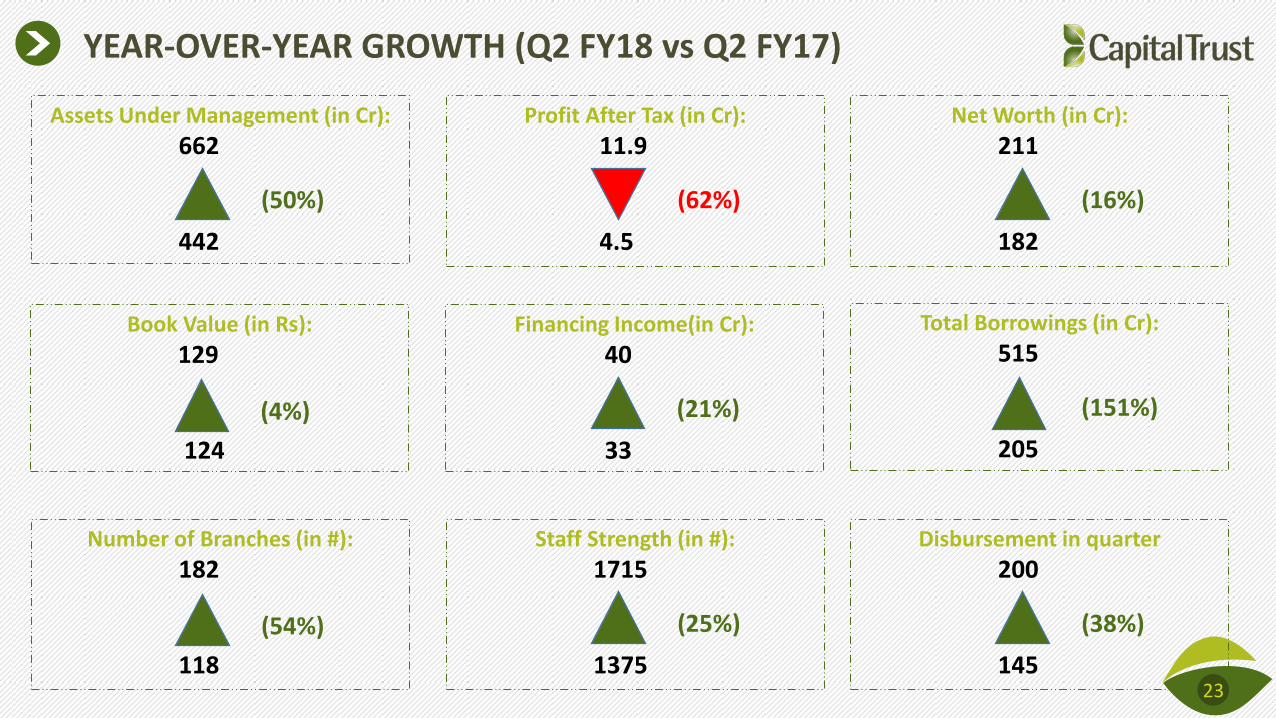
YEAR-OVER-YEAR GROWTH (Q2 FY18 vs Q2 FY17)
Assets Under Management (in Cr):
662 442
(50%)
Book Value (in Rs):
129 124
Number of Branches (in #):
182 118
Profit After Tax (in Cr):
11.9 4.5
Net Worth (in Cr):
211 182
(62%) (16%)
(4%)
(54%)
Financing Income(in Cr):
40 33
Total Borrowings (in Cr):
515 205
(21%) (151%)
Staff Strength (in #):
1715 1375
Disbursement in quarter
200 145
(25%) (38%)
23
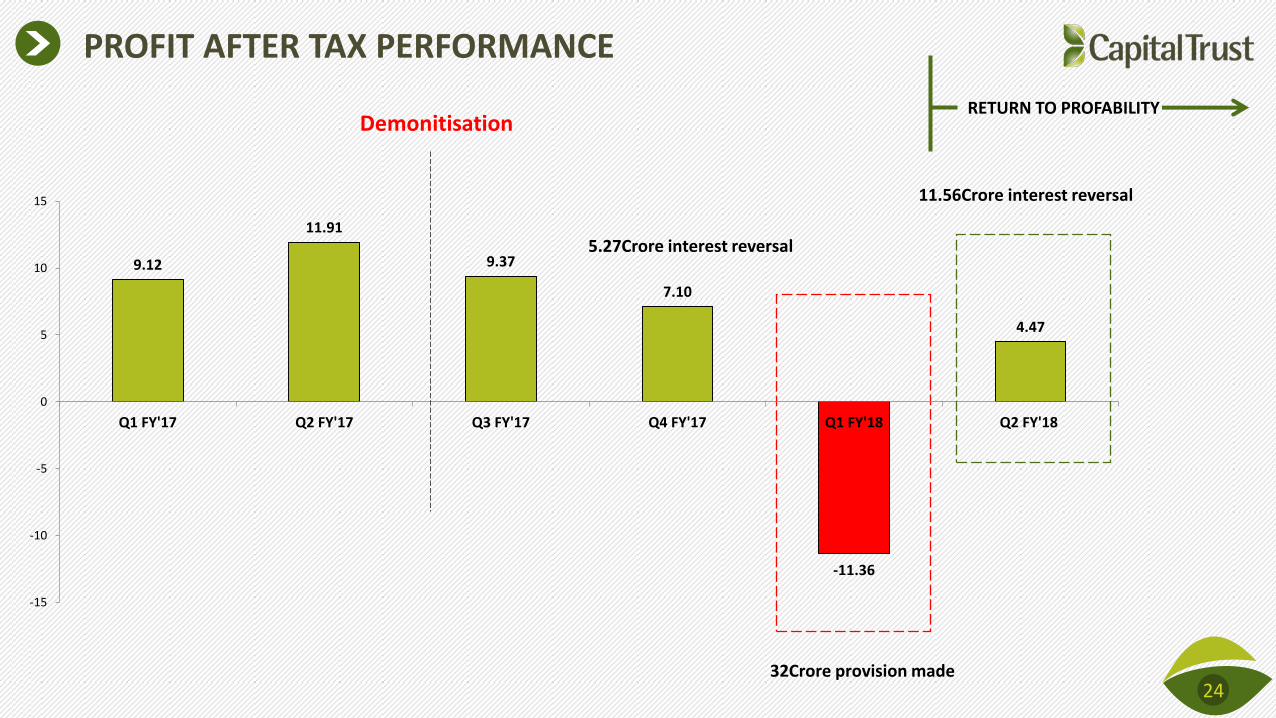
PROFIT AFTER TAX PERFORMANCE
24
9.12
11.91
9.37
7.10
-11.36
4.47
-15
-10
-5
0
5
10
15
Q1 FY'17 Q2 FY'17 Q3 FY'17 Q4 FY'17 Q1 FY'18 Q2 FY'18
Demonitisation
32Crore provision made
11.56Crore interest reversal
RETURN TO PROFABILITY
5.27Crore interest reversal
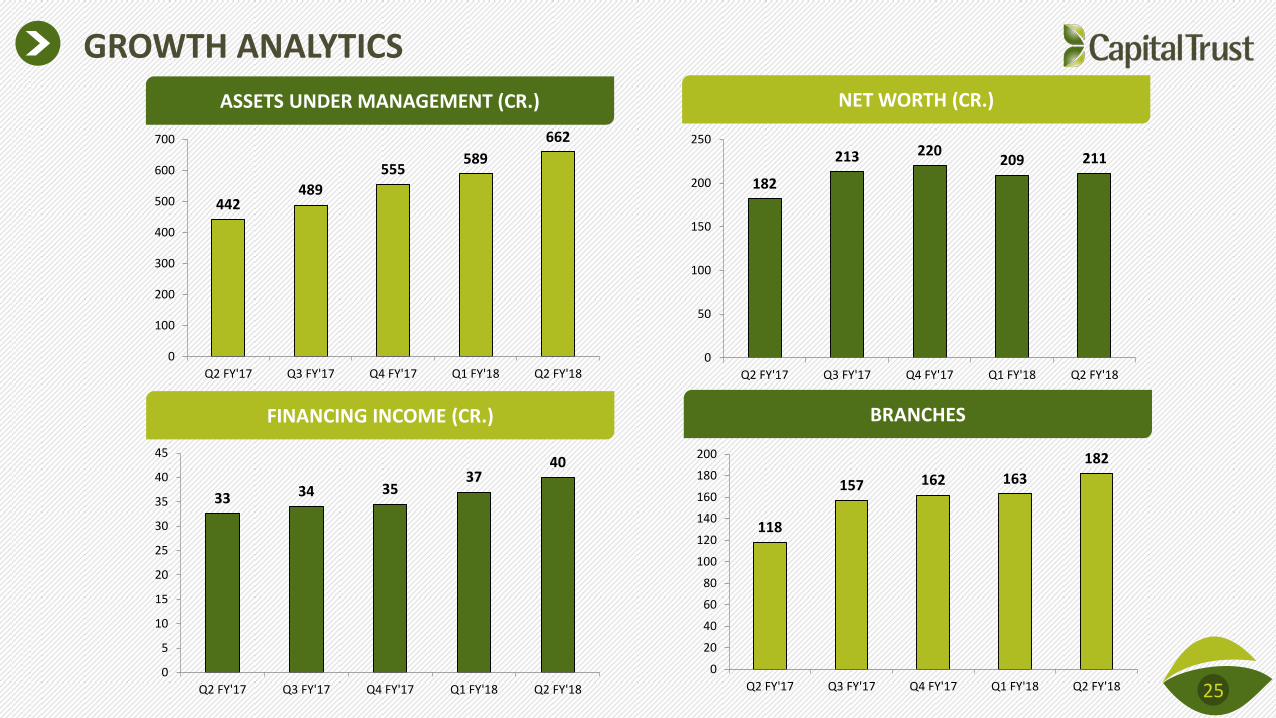
GROWTH ANALYTICS
ASSETS UNDER MANAGEMENT (CR.)
FINANCING INCOME (CR.)
NET WORTH (CR.)
BRANCHES
25
118
157 162 163
182
0
20
40
60
80
100
120
140
160
180
200
Q2 FY'17 Q3 FY'17 Q4 FY'17 Q1 FY'18 Q2 FY'18
33 34 35 37
40
0
5
10
15
20
25
30
35
40
45
Q2 FY'17 Q3 FY'17 Q4 FY'17 Q1 FY'18 Q2 FY'18
182
213 220 209 211
0
50
100
150
200
250
Q2 FY'17 Q3 FY'17 Q4 FY'17 Q1 FY'18 Q2 FY'18
442 489
555 589
662
0
100
200
300
400
500
600
700
Q2 FY'17 Q3 FY'17 Q4 FY'17 Q1 FY'18 Q2 FY'18
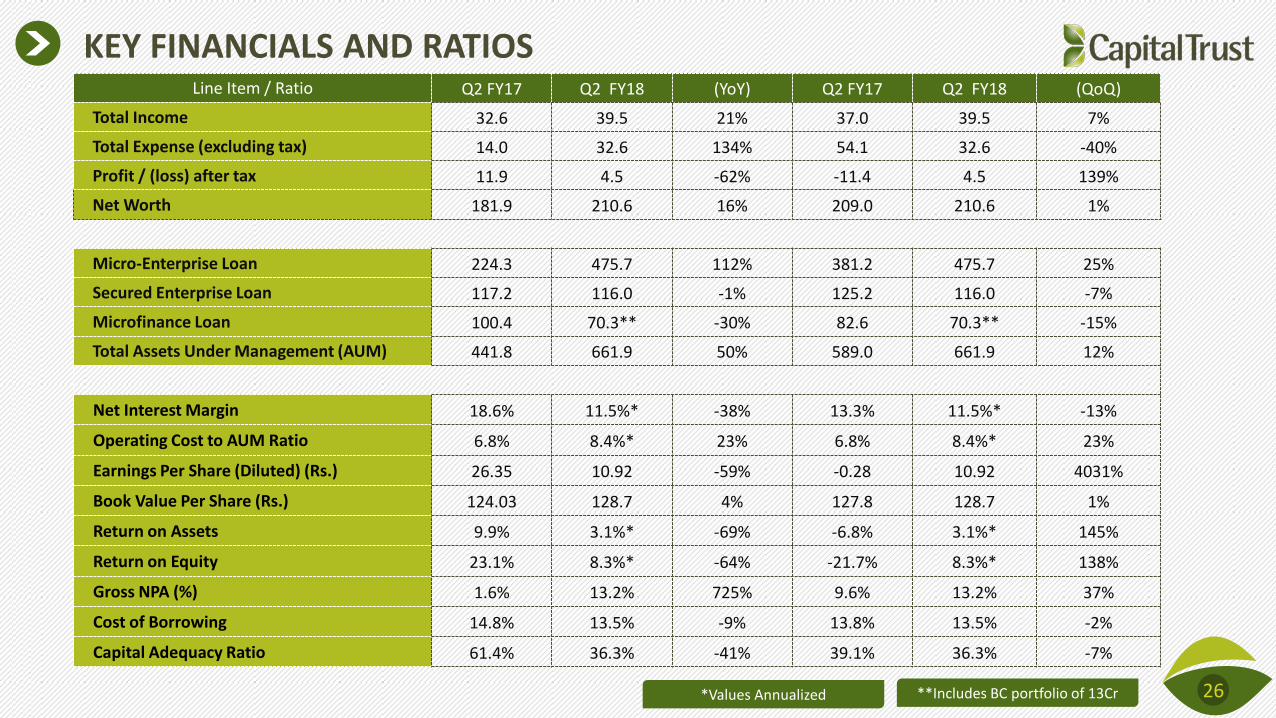
KEY FINANCIALS AND RATIOS Line Item / Ratio Q2 FY17 Q2 FY18 (YoY) Q2 FY17 Q2 FY18 (QoQ)
Total Income 32.6 39.5 21% 37.0 39.5 7%
Total Expense (excluding tax) 14.0 32.6 134% 54.1 32.6 -40%
Profit / (loss) after tax 11.9 4.5 -62% -11.4 4.5 139%
Net Worth 181.9 210.6 16% 209.0 210.6 1%
Micro-Enterprise Loan 224.3 475.7 112% 381.2 475.7 25%
Secured Enterprise Loan 117.2 116.0 -1% 125.2 116.0 -7%
Microfinance Loan 100.4 70.3** -30% 82.6 70.3** -15%
Total Assets Under Management (AUM) 441.8 661.9 50% 589.0 661.9 12%
Net Interest Margin 18.6% 11.5%* -38% 13.3% 11.5%* -13%
Operating Cost to AUM Ratio 6.8% 8.4%* 23% 6.8% 8.4%* 23%
Earnings Per Share (Diluted) (Rs.) 26.35 10.92 -59% -0.28 10.92 4031%
Book Value Per Share (Rs.) 124.03 128.7 4% 127.8 128.7 1%
Return on Assets 9.9% 3.1%* -69% -6.8% 3.1%* 145%
Return on Equity 23.1% 8.3%* -64% -21.7% 8.3%* 138%
Gross NPA (%) 1.6% 13.2% 725% 9.6% 13.2% 37%
Cost of Borrowing 14.8% 13.5% -9% 13.8% 13.5% -2%
Capital Adequacy Ratio 61.4% 36.3% -41% 39.1% 36.3% -7%
**Includes BC portfolio of 13Cr 26 *Values Annualized

PARTNERS
27
PARTNERS
28

THANK YOU
29
30
This presentation has been prepared by and is the sole responsibility of Capital Trust Limited. By accessing this presentation, you are agreeing to be bound by the trailing restrictions. This presentation does not constitute or form part of any offer or invitation or inducement to sell or issue, or any solicitation of any offer or recommendation to purchase or subscribe for, any securities of the Company, nor shall it or any part of it or the fact of its distribution form the basis of, or be relied on in connection with, any contractor commitment therefore. In particular, this presentation is not intended to be a prospectus or offer document under the applicable laws of any jurisdiction, including India. No representation or warranty, express or implied, is made as to, and no reliance should be placed on, the fairness, accuracy, completeness or correctness of the information or opinions contained in this presentation. Such information and opinions are in all events not current after the date of this presentation. There is no obligation to update, modify or amend this communication or to otherwise notify the recipient if information, opinion, projection, forecast or estimate set forth herein, changes or subsequently becomes inaccurate. Certain statements contained in this presentation that are not statements of historical fact constitute “forward-looking statements.” You can generally identify forward-looking statements by terminology such as “aim”, “anticipate”, “believe”, “continue”, “could”, “estimate”, “expect”, “intend”, “may”, “objective”, “goal”, “plan”, “potential”, “project”, “pursue”, “shall”, “should”, “will”, “would”, or other words or phrases of similar import. These forward-looking statements involve known and unknown risks, uncertainties, assumptions and other factors that may cause the Company’s actual results, performance or achievements to be materially different from any future results, performance or achievements expressed or implied by such forward-looking statements or other projections. Important factors that could cause actual results, performance or achievements to differ materially include, among others: (a) material changes in the regulations governing our businesses; (b) the Company's inability to comply with the capital adequacy norms prescribed by the RBI; (c) decrease in the value of the Company's collateral or delays in enforcing the Company's collateral upon default by borrowers on their obligations to the Company; (d) the Company's inability to control the level of NPAs in the Company's portfolio effectively; (e) certain failures, including internal or external fraud, operational errors, systems malfunctions, or cyber security incidents; (f) volatility in interest rates and other market conditions; and(g) any adverse changes to the Indian economy. This presentation is for general information purposes only, without regard to any specific objectives, financial situations or informational needs of any particular person. The Company may alter, modify or otherwise change in any manner the content of this presentation, without obligation to notify any person of such change or changes.
DISCLAIMER