Embed Size (px)
Citation preview

IFGL EXPORTS LIMITED(After amalgamation of IFGL Refractories Limited)
Investor PresentationQ1 FY18
COMMITTED TO CLEAN METAL

2 Safe Harbor
This presentation and the accompanying slides (the “Presentation”), has been prepared by IFGL Exports Limited (the“Company”) (after amalgamation of IFGL Refractories Ltd.) , solely for information purposes and do not constitute any offer,recommendation or invitation to purchase or subscribe for any securities, and shall not form the basis or be relied on inconnection with any contract or binding commitment whatsoever.
This Presentation has been prepared by the Company based on information and data which the Company considers reliable, butthe Company makes no representation or warranty, express or implied, whatsoever, and no reliance shall be placed on, thetruth, accuracy, completeness, fairness and reasonableness of the contents of this Presentation. This Presentation may not beall inclusive and may not contain all of the information that you may consider material. Any liability in respect of the contentsof, or any omission from, this Presentation is expressly excluded.
Certain matters discussed in this Presentation may contain statements regarding the Company’s market opportunity andbusiness prospects that are individually and collectively forward-looking statements. Such forward-looking statements are notguarantees of future performance and are subject to known and unknown risks, uncertainties and assumptions that are difficultto predict. These risks and uncertainties include, but are not limited to, the performance of the Indian economy and of theeconomies of various international markets, the performance of the refractories industry in India and world-wide, competition,the company’s ability to successfully implement its strategy, the Company’s future levels of growth and expansion,technological implementation, changes and advancements, changes in revenue, income or cash flows, the Company’s marketpreferences and its exposure to market risks, as well as other risks. The Company’s actual results, levels of activity, performanceor achievements could differ materially and adversely from results expressed in or implied by this Presentation. The Companyassumes no obligation to update any forward-looking information contained in this Presentation.
3 Index
Industry Overview
Our Performance
About Us

4
Industry Overview

5 Refractories Market to mirror Steel Demand
2016 2021
$45.09 Bn $53.08 Bn
Global Refractories Market size
Growing at CAGR of 3.32%
>60%Iron & Steel to contribute in
Product-Demand in Volume Terms
135 CrDomestic size of
Refractories Market in 2016
15kg/tonne
Average consumption of Refractories per tonne in crude steel
42.5 Mn MT
Source: Industry Reports

6 2017 & 2018 Global Outlook a positive
2017 2018
3.5%
3.6%
2017 2018
2.0% 1.9%
2017 2018
4.6%4.8%
2017 2018
4.0% 3.9%
Emerging Market and Developing Economies World Trade Volumes
Global Economy Advanced Economy
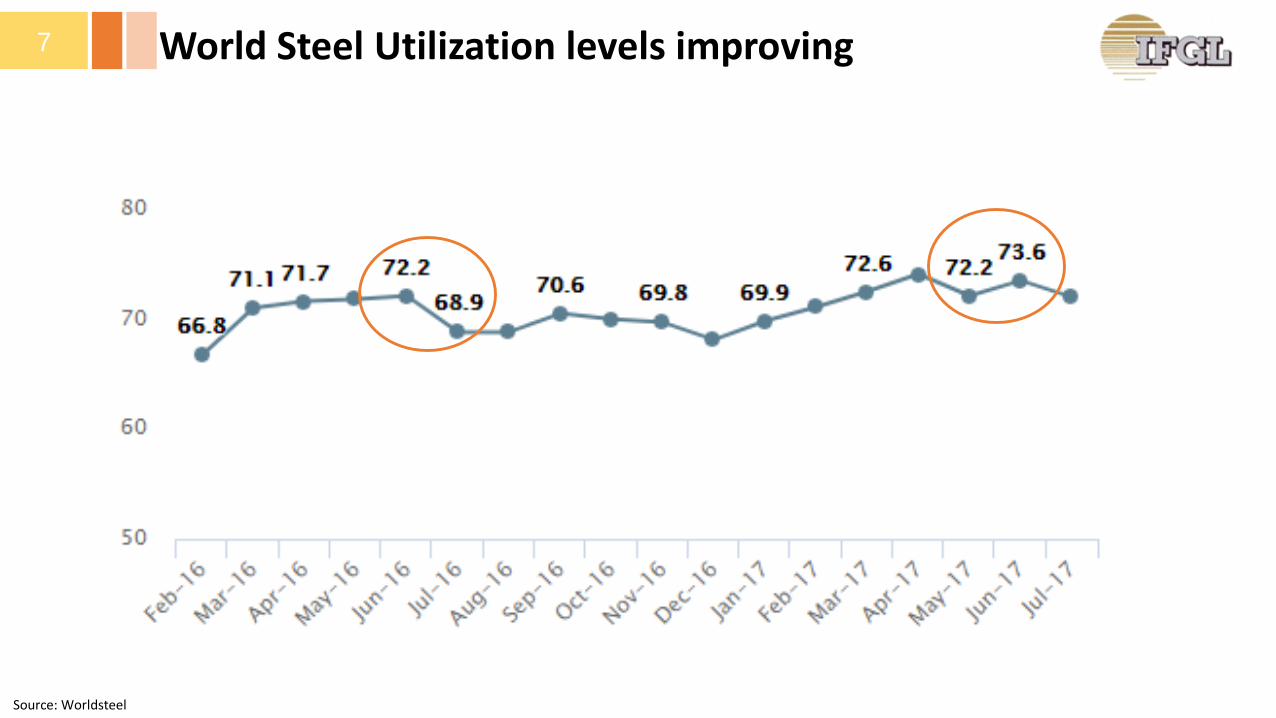
7 World Steel Utilization levels improving
Source: Worldsteel

8 Global Steel Production Growth
55.1
16.5
7.1
22.7
65.659.8
20.5
95.9
58.0
17.9
7.8
24.8
67.6
57.8
23.3
99.6
Other Europe IndiaCIS North America South America
617.2
Asia Ex IndiaAfrica
587.6
Middle East
+3.9%
+13.7%
+5.4%-3.3%
+9.3%
+3.0%
+9.9%
+5.0%
+8.5%
European Union
Jan-Jul 2017Jan-Jul 2016
Source: Worldsteel
Figures in Mn MT

New Steel Policy 2017…9
Targets to achieve 300MT of Steel
Making by 2030
Entire Demand of High grade
automotive steel, electrical steel,
special steels and alloys to be met ‘DOMESTICALLY’
Adoption of energy efficient technologies in
the MSME steel sector to improve
productivity
Increase per capita Steel Consumption
to 160Kgs from current level of
60Kg by 2030
To facilitate R&D in the sector via setting up Steel
Research and Technology
Mission of India (SRTMI).
…to bring fresh impetus to Indian Steel

10 Favorable Government Policies aiding Indian Steel
Source: IBEF
Imposition of CVD for 5 years on import of certain Stainless steel products will
boost domestic production
Make in India and preference to Locally
produced Steel in Projects
Increased focus and Budgetary
allocation towards R&D & Innovation
Reductionin Customs Duty on Plant & Equipment
100% FDI through automatic route in Indian Steel
Increasing Domestic Demand for Steel has been recognized by Indian Government by way of Sector friendly policies benefitting manufacturers of Refractories
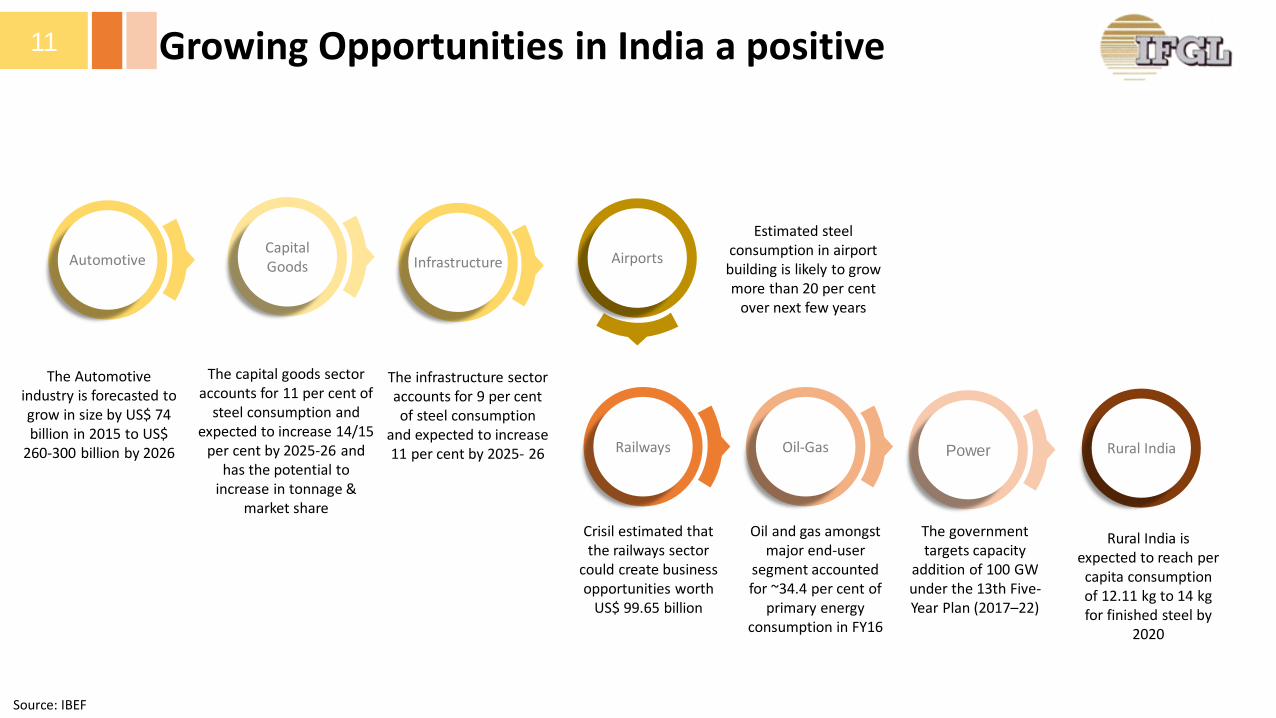
11 Growing Opportunities in India a positive
AutomotiveCapital Goods Infrastructure Airports
Railways Oil-Gas Rural India
The Automotive industry is forecasted to grow in size by US$ 74 billion in 2015 to US$
260-300 billion by 2026 Power
The capital goods sector accounts for 11 per cent of
steel consumption and expected to increase 14/15
per cent by 2025-26 and has the potential to
increase in tonnage & market share
The infrastructure sector accounts for 9 per cent of steel consumption
and expected to increase 11 per cent by 2025- 26
Estimated steel consumption in airport building is likely to grow more than 20 per cent
over next few years
Crisil estimated that the railways sector
could create business opportunities worth
US$ 99.65 billion
Oil and gas amongst major end-user
segment accounted for ~34.4 per cent of
primary energy consumption in FY16
The government targets capacity
addition of 100 GW under the 13th Five-Year Plan (2017–22)
Rural India is expected to reach per
capita consumption of 12.11 kg to 14 kg for finished steel by
2020
Source: IBEF
12
Our Performance
Merger of IFGL Refractories with IFGL Exports13
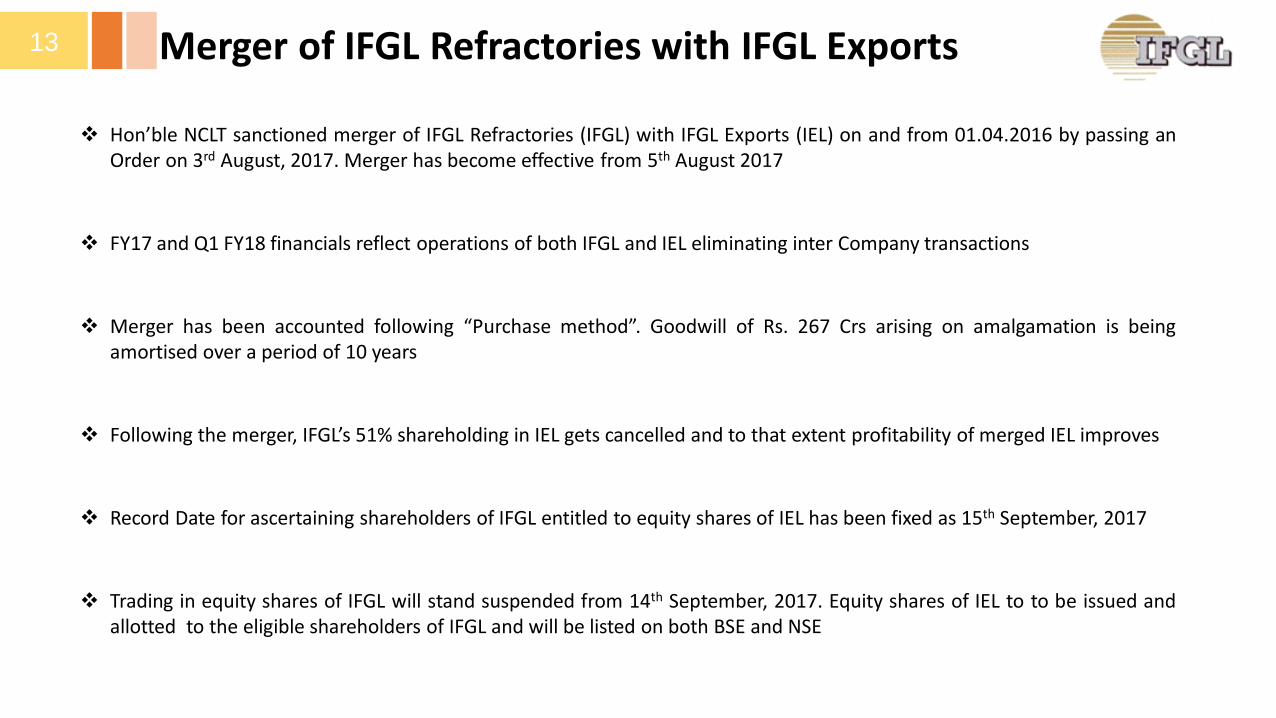
❖ Hon’ble NCLT sanctioned merger of IFGL Refractories (IFGL) with IFGL Exports (IEL) on and from 01.04.2016 by passing anOrder on 3rd August, 2017. Merger has become effective from 5th August 2017
❖ FY17 and Q1 FY18 financials reflect operations of both IFGL and IEL eliminating inter Company transactions
❖ Merger has been accounted following “Purchase method”. Goodwill of Rs. 267 Crs arising on amalgamation is beingamortised over a period of 10 years
❖ Following the merger, IFGL’s 51% shareholding in IEL gets cancelled and to that extent profitability of merged IEL improves
❖ Record Date for ascertaining shareholders of IFGL entitled to equity shares of IEL has been fixed as 15th September, 2017
❖ Trading in equity shares of IFGL will stand suspended from 14th September, 2017. Equity shares of IEL to to be issued andallotted to the eligible shareholders of IFGL and will be listed on both BSE and NSE

Consolidated Profit & Loss14
Particulars [Rs. Crs] Q1 FY18 # Q1 FY17 # Growth %
Total Income 202.4 186.9 8.3%
Raw Material 100.8 89.2
Employee Expenses 32.6 31.0
Other Expenses 43.8 44.4
EBITDA 25.3 22.4 13.1%
EBITDA % 12.5% 12.0%
Depreciation 4.0 3.9
Goodwill written off* 6.7 6.7
Finance Cost 1.1 1.1
Profit before Tax 13.6 10.7 27.2%
Tax 2.3 1.7
Profit after Tax 11.2 9.0 24.6%
Earnings Per Share 3.1 2.5
Cash Profit 21.9 19.7 11.6%
Cash Earnings Per Share 6.1 5.5
* Goodwill on account of Merger is being written off over a period of 10 years# After giving effect of Merger & IndAS adjustments
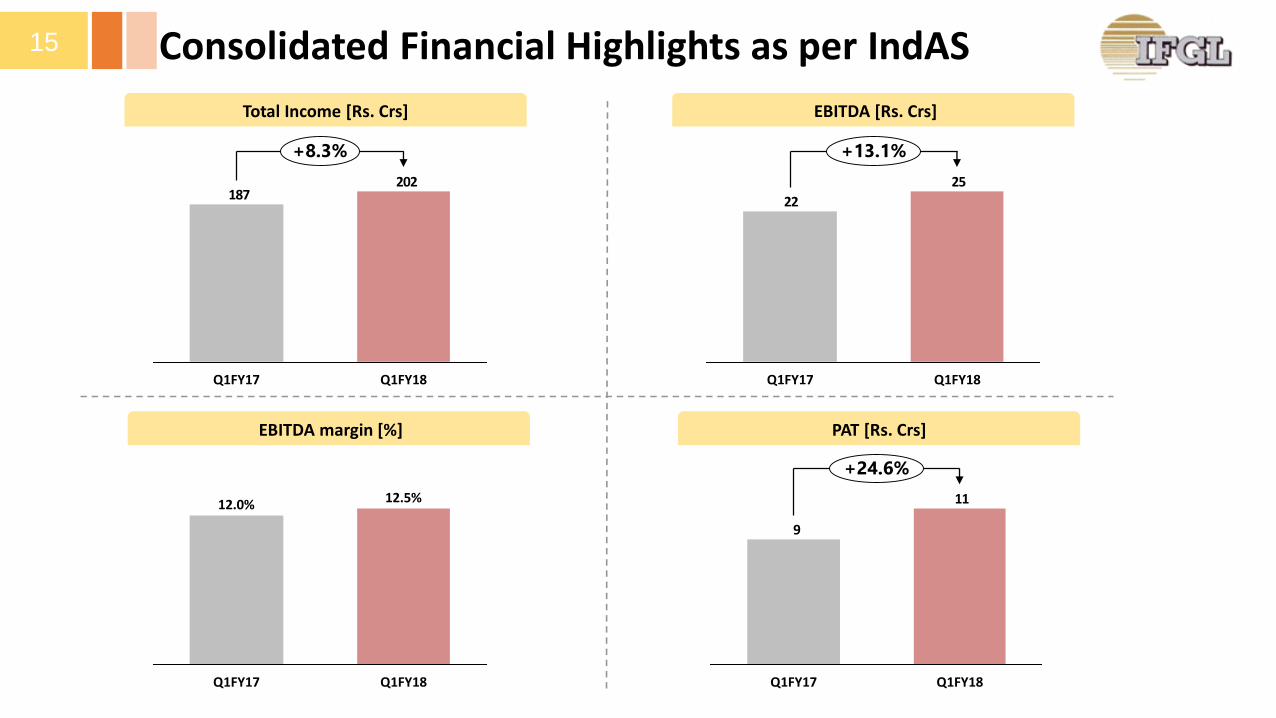
Consolidated Financial Highlights as per IndAS15
Total Income [Rs. Crs] EBITDA [Rs. Crs]
EBITDA margin [%] PAT [Rs. Crs]
202187
Q1FY17 Q1FY18
+8.3%
25
22
Q1FY18Q1FY17
+13.1%
11
9
Q1FY18Q1FY17
+24.6%
Q1FY18
12.5%
Q1FY17
12.0%

Subsidiaries Performance16
Monocon Group [GBP mn]
Hofmann Ceramic [Euro mn]
EI Ceramics [$ mn]
IFGL Standalone* [Rs. Crs]
0.70.8
0.40.5
4.7
4.5
Q1FY17 Q1FY18
EBITDA
Revenue
PAT
16.914.1
6.15.0
Q1FY18
106.4
87.2
Q1FY17
0.0
0.3
0.0
0.2
Q1FY18
2.7
Q1FY17
2.6
0.40.3 0.3
0.2
5.5
6.1
Q1FY17 Q1FY18
* IFGL Exports (after merger of IFGL Refractories)

Ongoing Capex in FY18 to boost performance 17
Hofmann Germany Plant
IFGL Odisha Plant
IFGL KandlaPlant
~Euro 2mn Capex: Capacity Increase AutomationEfficiency Enhancement
~Rs. 10Cr Capex: To augment SGR & Zirconia Nozzles manufacturing facilities
~10Cr Capex: To increase the present capacity of ISO products from 160,000 pcs p.a. to 240,000 pcs p.a.
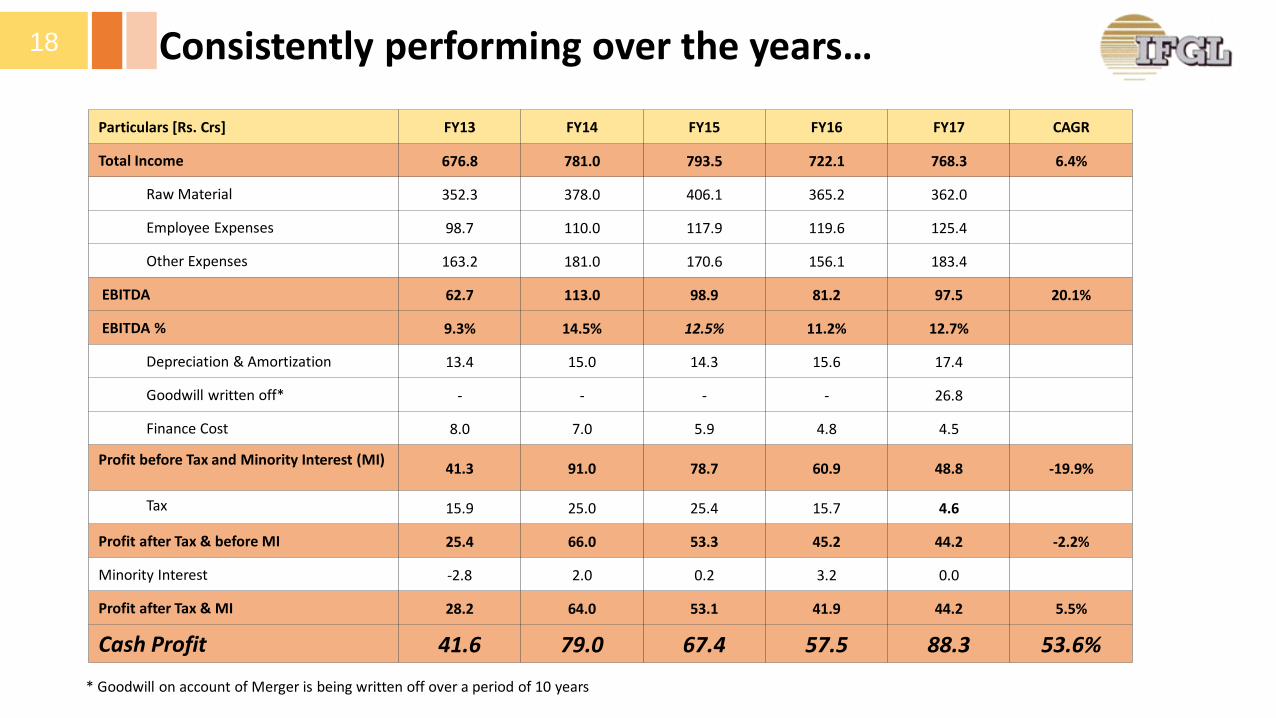
Consistently performing over the years…18
Particulars [Rs. Crs] FY13 FY14 FY15 FY16 FY17 CAGR
Total Income 676.8 781.0 793.5 722.1 768.3 6.4%
Raw Material 352.3 378.0 406.1 365.2 362.0
Employee Expenses 98.7 110.0 117.9 119.6 125.4
Other Expenses 163.2 181.0 170.6 156.1 183.4
EBITDA 62.7 113.0 98.9 81.2 97.5 20.1%
EBITDA % 9.3% 14.5% 12.5% 11.2% 12.7%
Depreciation & Amortization 13.4 15.0 14.3 15.6 17.4
Goodwill written off* - - - - 26.8
Finance Cost 8.0 7.0 5.9 4.8 4.5
Profit before Tax and Minority Interest (MI)41.3 91.0 78.7 60.9 48.8 -19.9%
Tax 15.9 25.0 25.4 15.7 4.6
Profit after Tax & before MI 25.4 66.0 53.3 45.2 44.2 -2.2%
Minority Interest -2.8 2.0 0.2 3.2 0.0
Profit after Tax & MI 28.2 64.0 53.1 41.9 44.2 5.5%
Cash Profit 41.6 79.0 67.4 57.5 88.3 53.6%
* Goodwill on account of Merger is being written off over a period of 10 years

Consolidated Balance Sheet19
Particulars [Rs. Crs] FY17 *
Non-current assets 496
Fixed assets^ 372
Goodwill on Consolidation 109
Long-term loans and advances 15
Non-current investments 1
Other Non Current Assets 0
Current assets 402
Current Investments 11
Inventories 94
Trade receivables 228
Cash and bank balances 56
Short-term loans and advances 9
Other current assets 4
Total Assets 897
Particulars [Rs. Crs] FY17 *
Shareholders Fund 684
Share capital # 36
Reserves & Surplus 648
Minority Interest 0
Non-current liabilities 21
Long term borrowings 14
Deferred Tax Liabilities (net) 6
Long-term provisions 0
Current Liabilities 192
Short term borrowings 61
Trade Payables 119
Other current liabilities 11
Short-term provisions 0
Total Liabilities 897
* Audited Balance sheet post Merger # Includes FV of Equity shares to be allotted to the shareholders of IFGL Refractories^ Includes GW arisen on merger of Rs. 247 crs after write off of Rs. 27 Cr in FY17

…with steady overseas subsidiaries performance…20EB
ITD
AR
OC
E
Monocon Group [GBP mn] EI Ceramics [$ mn]Hofmann Ceramic [Euro mn]
8.6%
5.1%
FY13 FY17
10.4%
5.1%
FY13 FY17
15.9%
13.6%
FY13 FY17
10.3%
7.6%
FY13 FY17
6.8%
5.1%
FY13 FY17
19.0%
25.5%
FY13 FY17

…to create sustainable shareholder value…21
Gross Debt (Rs.Cr) Net Debt : Equity [x] Net Debt : EBITDA [x]
0.0
0.1
0.2
0.3
FY15FY14 FY17*FY13
0.5
FY16
0.0
0.4
0.70.8
1.9
FY14 FY15FY13 FY16 FY17*
67.469.5
95.798.2
114.2
FY14 FY17*FY16FY15FY13
* FY17 figures as per Audited Balance sheet post Merger

…with consistent Payout22
Particulars (Rs.) FY13 FY14 FY15 FY16 FY17
Consolidated Book Value per Share 70.9 95.1 99.6 111.7 189.9
Consolidated Earning Per Share 7.9 18.3 15.1 12.1 12.6
Dividend Per Share 1.5 1.75 2.00 2.00 2.00
FY17FY16FY15FY14
17.5%
20.0%
15.0%
FY13
15.0%
20.0%
* Subject to approval, on enhanced share capital

23
About Us

24 A Global MNC…
Mono Ceramics Inc
Michigan, US
E I Ceramics,
Cincinnati, US
Monocon , UK
Tianjin Monocon
Tianjin, China
Hofmann Ceramic,
Germany
IFGL, Kandla SEZ

…with proven management…25
Mr. S.K. Bajoria -Chairman
• Promoter of S K Bajoria Group based at Kolkata engaged in diversified business activities
• Has been President of the Indian Chamber of Commerce, Director of West Bengal Industrial Development Corporation Ltd and Industrial Promotion & Investment Corporation of Orissa Ltd
• Associated with IFGL from the very early days of Indo Flogates, even before the start of production in 1984. Has been Director & Chief Executive of erstwhile Indo Flogates Ltd.
• More than 30 years of experience of Refractory Industry and has been involved in various capacities in Indian Refractories Makers Association
Mr. P. Bajoria -Managing Director

…serving the specialized refractory segment…26
Isostatic Refractories Slide Gate Refractories & Systems
Tube Changer Refractories & System Purging System & Refractories
Cast Products & Zirconia Nozzles Foundry Ceramics
…to reputed names in the Global Steel Industry27

For further information, please contact:
Company : Investor Relations Advisors :
IFGL Exports Ltd. (after amalgamation of IFGL Refractories Ltd.)CIN - U51909WB2007PLC118407Mr. Rajesh [email protected]
www.ifglref.com
Strategic Growth Advisors Pvt. Ltd.CIN - U74140MH2010PTC204285Mr. Shogun Jain / Mr. Pratik R. [email protected] / [email protected]+91 7738377756 / +91 9769260769www.sgapl.net