Embed Size (px)
Citation preview
April 2013 INVESTOR PRESENTATION
Gold producer focused on organic growth in the Philippines
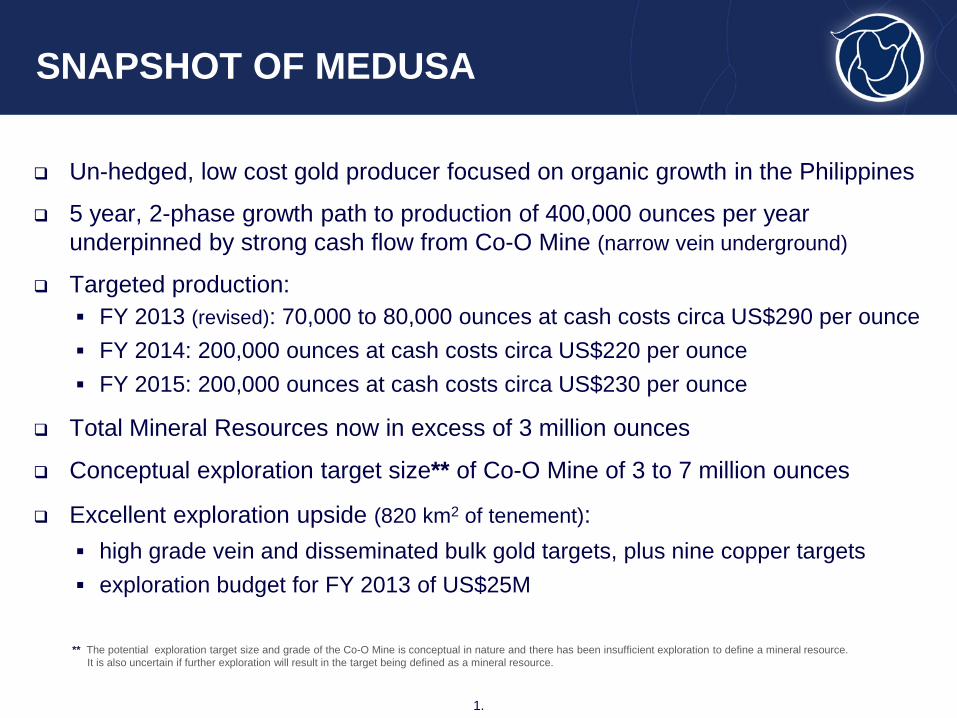
Un-hedged, low cost gold producer focused on organic growth in the Philippines
5 year, 2-phase growth path to production of 400,000 ounces per year underpinned by strong cash flow from Co-O Mine (narrow vein underground)
Targeted production: FY 2013 (revised): 70,000 to 80,000 ounces at cash costs circa US$290 per ounce FY 2014: 200,000 ounces at cash costs circa US$220 per ounce FY 2015: 200,000 ounces at cash costs circa US$230 per ounce
Total Mineral Resources now in excess of 3 million ounces
Conceptual exploration target size** of Co-O Mine of 3 to 7 million ounces
Excellent exploration upside (820 km2 of tenement): high grade vein and disseminated bulk gold targets, plus nine copper targets exploration budget for FY 2013 of US$25M
SNAPSHOT OF MEDUSA
1.
** The potential exploration target size and grade of the Co-O Mine is conceptual in nature and there has been insufficient exploration to define a mineral resource. It is also uncertain if further exploration will result in the target being defined as a mineral resource.
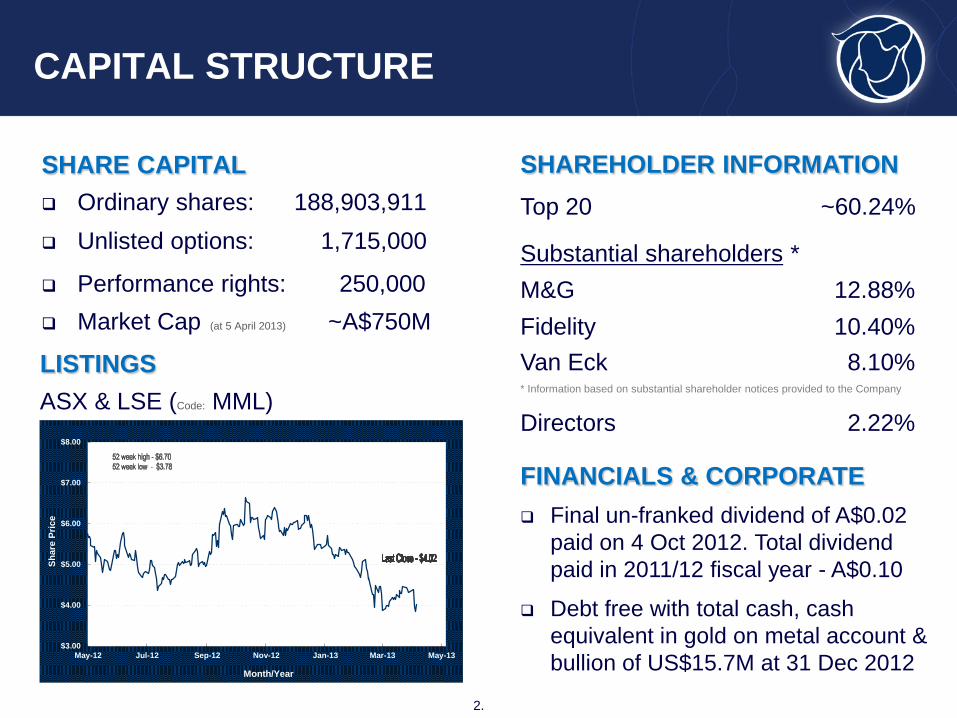
SHARE CAPITAL Ordinary shares: 188,903,911 Unlisted options: 1,715,000
Performance rights: 250,000 Market Cap (at 5 April 2013) ~A$750M
CAPITAL STRUCTURE
2.
SHAREHOLDER INFORMATION Top 20 ~60.24%
Substantial shareholders * M&G 12.88% Fidelity 10.40% Van Eck 8.10% * Information based on substantial shareholder notices provided to the Company
Directors 2.22%
LISTINGS ASX & LSE (Code: MML)
FINANCIALS & CORPORATE Final un-franked dividend of A$0.02
paid on 4 Oct 2012. Total dividend paid in 2011/12 fiscal year - A$0.10
Debt free with total cash, cash equivalent in gold on metal account & bullion of US$15.7M at 31 Dec 2012
$3.00
$4.00
$5.00
$6.00
$7.00
$8.00
May-12 Jul-12 Sep-12 Nov-12 Jan-13 Mar-13 May-13
Shar
e Pr
ice
Month/Year
FINANCIAL AND PRODUCTION STATISTICS
3.
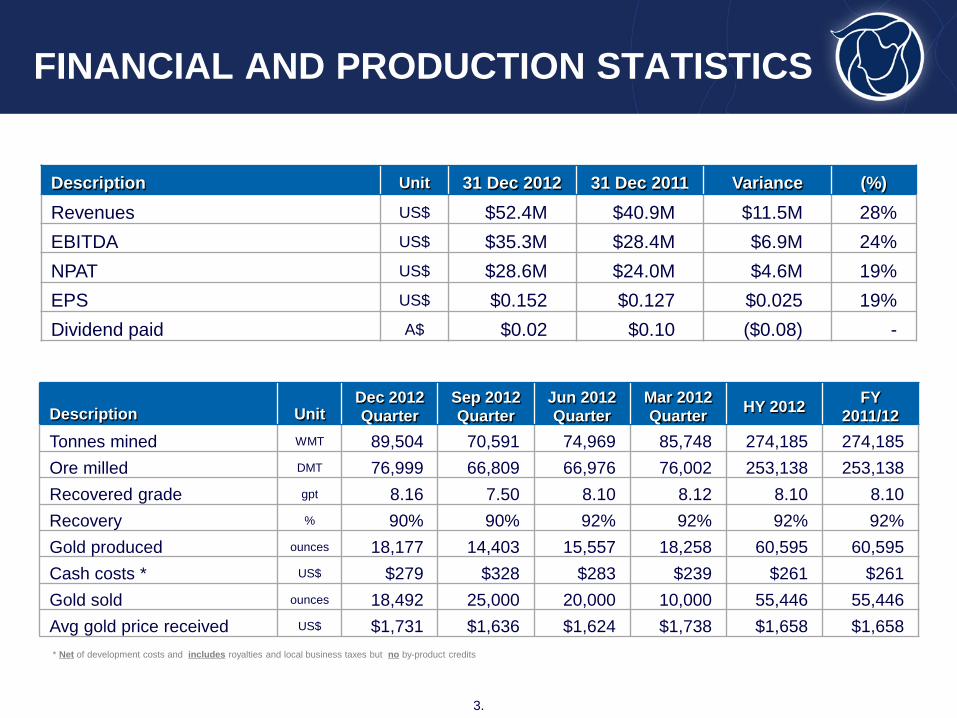
Description Unit 31 Dec 2012 31 Dec 2011 Variance (%)
Revenues US$ $52.4M $40.9M $11.5M 28% EBITDA US$ $35.3M $28.4M $6.9M 24% NPAT US$ $28.6M $24.0M $4.6M 19% EPS US$ $0.152 $0.127 $0.025 19% Dividend paid A$ $0.02 $0.10 ($0.08) -
Description Unit Dec 2012 Quarter
Sep 2012 Quarter
Jun 2012 Quarter
Mar 2012 Quarter HY 2012 FY
2011/12 Tonnes mined WMT 89,504 70,591 74,969 85,748 274,185 274,185 Ore milled DMT 76,999 66,809 66,976 76,002 253,138 253,138 Recovered grade gpt 8.16 7.50 8.10 8.12 8.10 8.10 Recovery % 90% 90% 92% 92% 92% 92% Gold produced ounces 18,177 14,403 15,557 18,258 60,595 60,595 Cash costs * US$ $279 $328 $283 $239 $261 $261 Gold sold ounces 18,492 25,000 20,000 10,000 55,446 55,446 Avg gold price received US$ $1,731 $1,636 $1,624 $1,738 $1,658 $1,658 * Net of development costs and includes royalties and local business taxes but no by-product credits
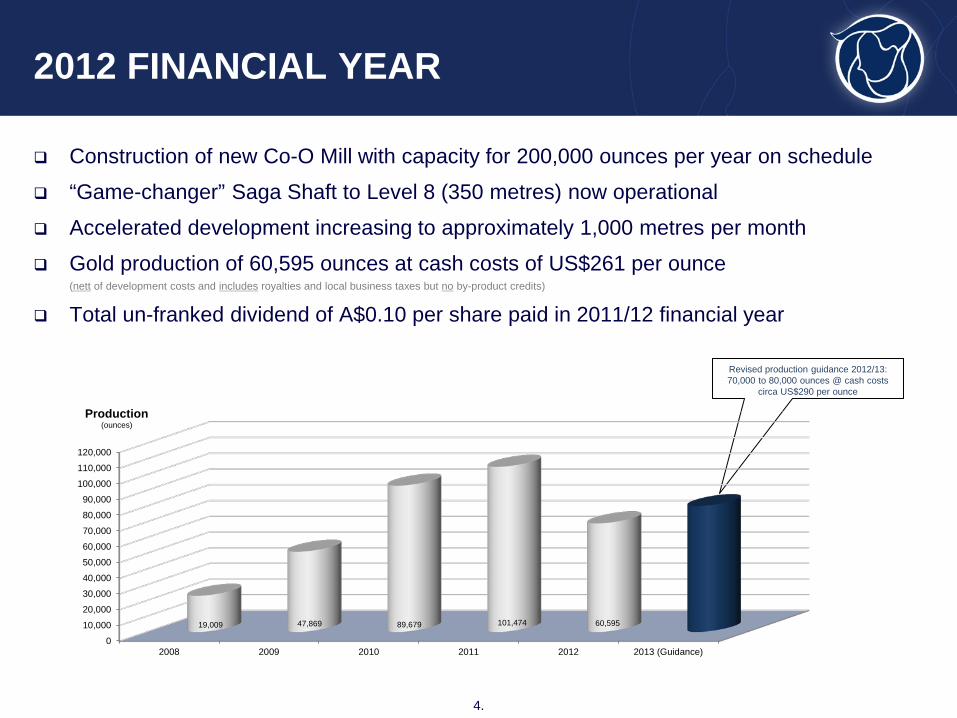
Construction of new Co-O Mill with capacity for 200,000 ounces per year on schedule
“Game-changer” Saga Shaft to Level 8 (350 metres) now operational
Accelerated development increasing to approximately 1,000 metres per month
Gold production of 60,595 ounces at cash costs of US$261 per ounce (nett of development costs and includes royalties and local business taxes but no by-product credits)
Total un-franked dividend of A$0.10 per share paid in 2011/12 financial year
2012 FINANCIAL YEAR
4.
Revised production guidance 2012/13: 70,000 to 80,000 ounces @ cash costs
circa US$290 per ounce
0
10,000
20,000
30,000
40,000
50,000
60,000
70,000
80,000
90,000
100,000
110,000
120,000
2008 2009 2010 2011 2012 2013 (Guidance)
19,009 47,869 89,679 101,474 60,595
Production (ounces)
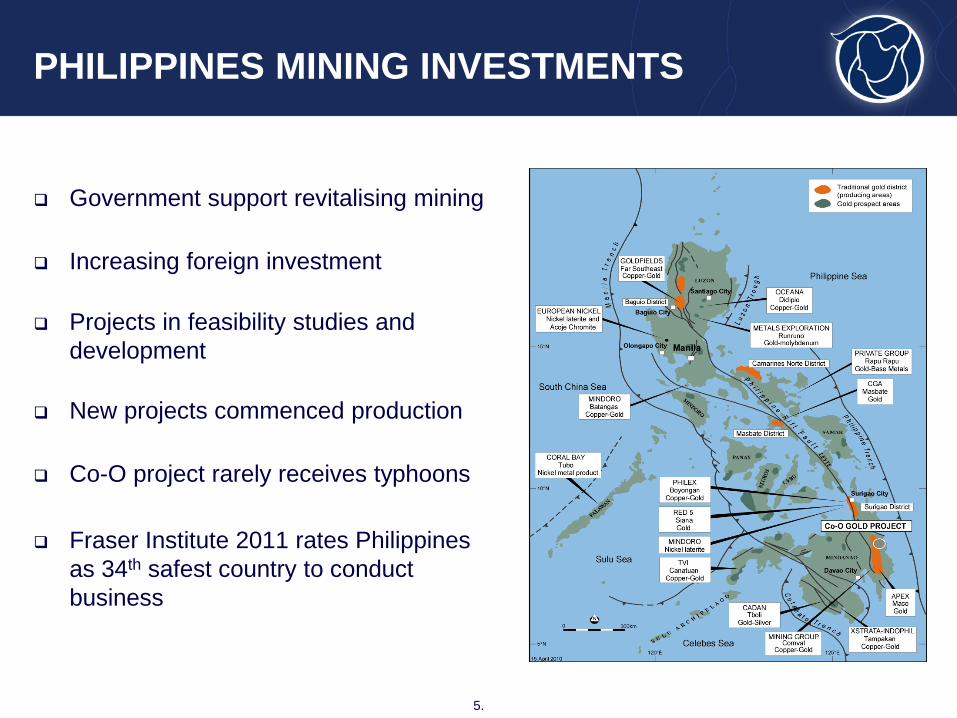
Government support revitalising mining
Increasing foreign investment
Projects in feasibility studies and development
New projects commenced production Co-O project rarely receives typhoons Fraser Institute 2011 rates Philippines
as 34th safest country to conduct business
PHILIPPINES MINING INVESTMENTS
5.
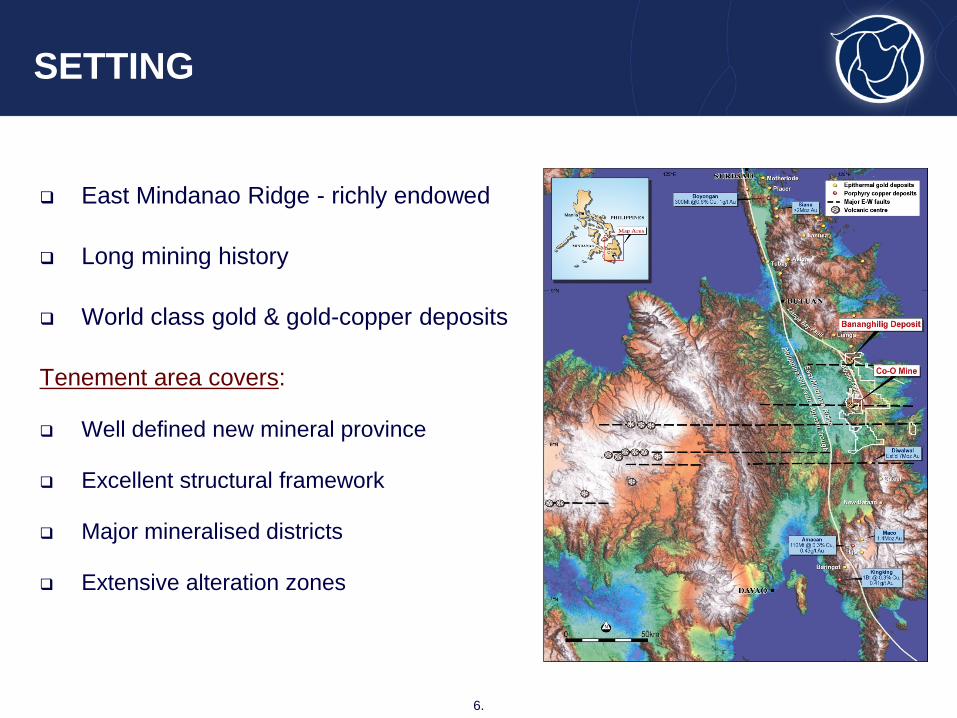
East Mindanao Ridge - richly endowed
Long mining history
World class gold & gold-copper deposits
Tenement area covers:
Well defined new mineral province
Excellent structural framework
Major mineralised districts
Extensive alteration zones
SETTING
6.
CORPORATE STRATEGY
7.
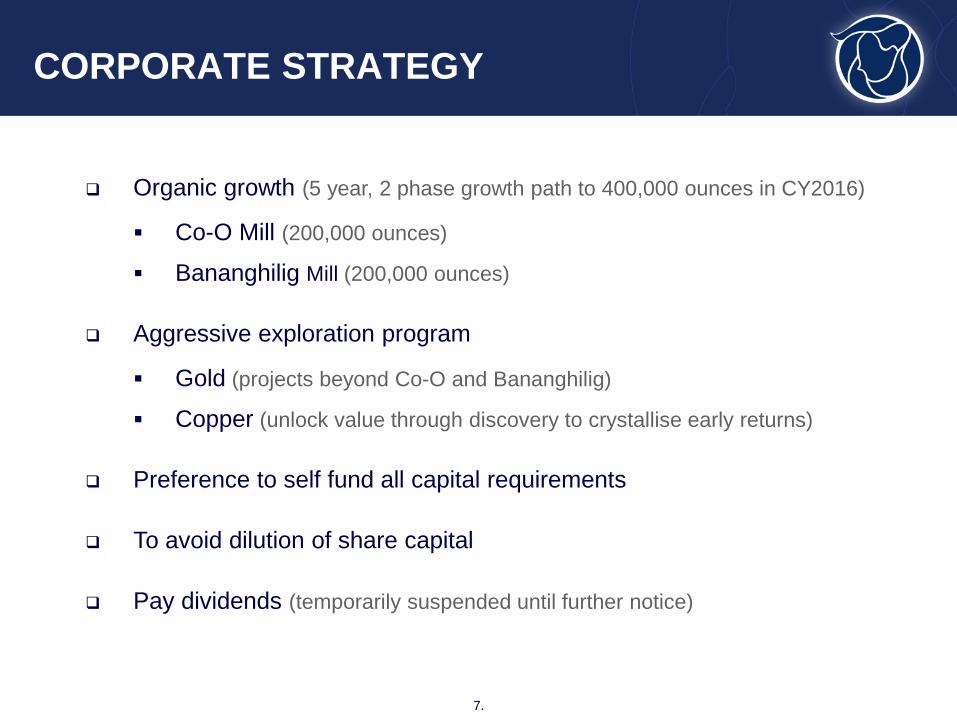
Organic growth (5 year, 2 phase growth path to 400,000 ounces in CY2016)
Co-O Mill (200,000 ounces)
Bananghilig Mill (200,000 ounces)
Aggressive exploration program
Gold (projects beyond Co-O and Bananghilig)
Copper (unlock value through discovery to crystallise early returns)
Preference to self fund all capital requirements
To avoid dilution of share capital
Pay dividends (temporarily suspended until further notice)
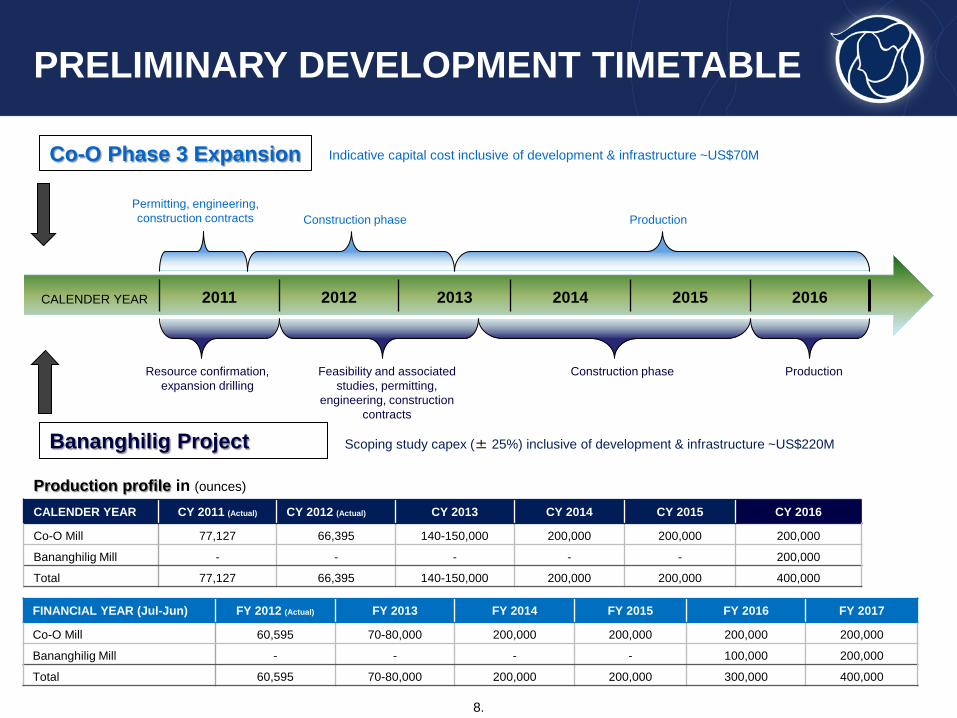
CALENDER YEAR 2011 2012 2013 2014 2015 2016
Co-O Phase 3 Expansion
Construction phase Production Permitting, engineering, construction contracts
Construction phase Production Resource confirmation, expansion drilling
Feasibility and associated studies, permitting,
engineering, construction contracts
CALENDER YEAR CY 2011 (Actual) CY 2012 (Actual) CY 2013 CY 2014 CY 2015 CY 2016
Co-O Mill 77,127 66,395 140-150,000 200,000 200,000 200,000
Bananghilig Mill - - - - - 200,000
Total 77,127 66,395 140-150,000 200,000 200,000 400,000
Bananghilig Project
Production profile in (ounces)
PRELIMINARY DEVELOPMENT TIMETABLE
Indicative capital cost inclusive of development & infrastructure ~US$70M
Scoping study capex (± 25%) inclusive of development & infrastructure ~US$220M
8.
FINANCIAL YEAR (Jul-Jun) FY 2012 (Actual) FY 2013 FY 2014 FY 2015 FY 2016 FY 2017
Co-O Mill 60,595 70-80,000 200,000 200,000 200,000 200,000
Bananghilig Mill - - - - 100,000 200,000
Total 60,595 70-80,000 200,000 200,000 300,000 400,000
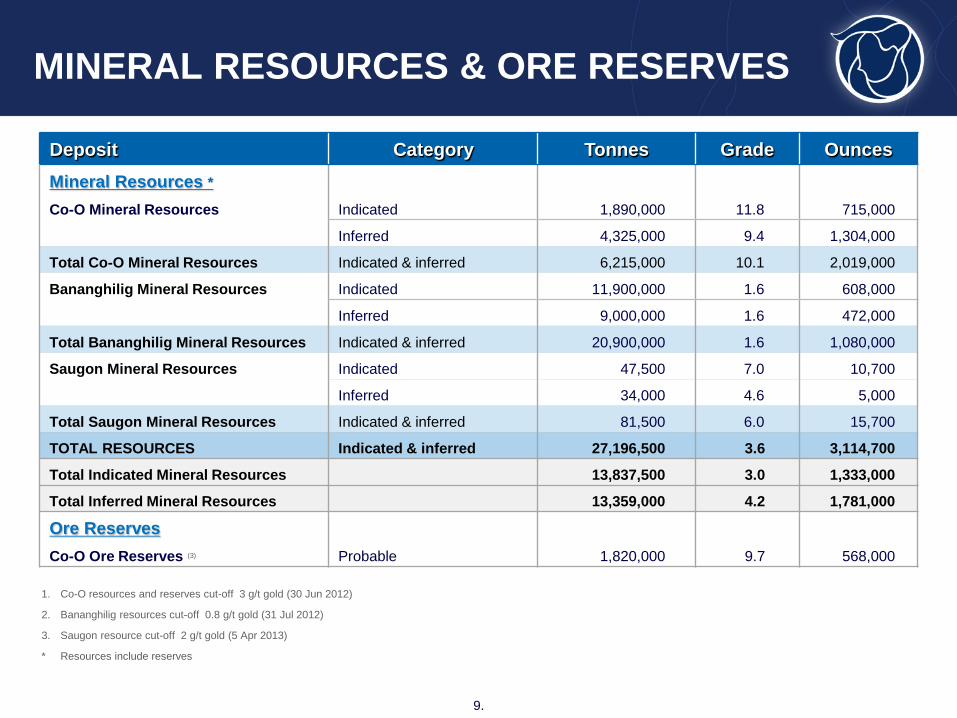
MINERAL RESOURCES & ORE RESERVES
9.
1. Co-O resources and reserves cut-off 3 g/t gold (30 Jun 2012)
2. Bananghilig resources cut-off 0.8 g/t gold (31 Jul 2012)
3. Saugon resource cut-off 2 g/t gold (5 Apr 2013)
* Resources include reserves
Deposit Category Tonnes Grade Ounces Mineral Resources *
Co-O Mineral Resources Indicated 1,890,000 11.8 715,000
Inferred 4,325,000 9.4 1,304,000
Total Co-O Mineral Resources Indicated & inferred 6,215,000 10.1 2,019,000
Bananghilig Mineral Resources Indicated 11,900,000 1.6 608,000
Inferred 9,000,000 1.6 472,000
Total Bananghilig Mineral Resources Indicated & inferred 20,900,000 1.6 1,080,000
Saugon Mineral Resources Indicated 47,500 7.0 10,700
Inferred 34,000 4.6 5,000
Total Saugon Mineral Resources Indicated & inferred 81,500 6.0 15,700
TOTAL RESOURCES Indicated & inferred 27,196,500 3.6 3,114,700
Total Indicated Mineral Resources 13,837,500 3.0 1,333,000
Total Inferred Mineral Resources 13,359,000 4.2 1,781,000
Ore Reserves Co-O Ore Reserves (3) Probable 1,820,000 9.7 568,000
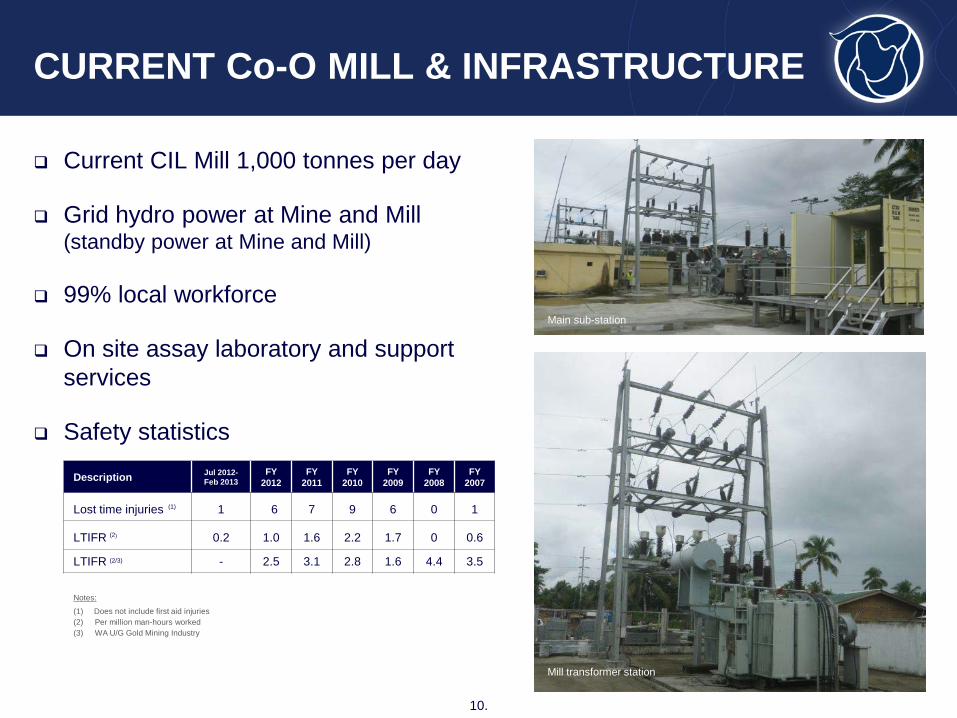
Current CIL Mill 1,000 tonnes per day
Grid hydro power at Mine and Mill (standby power at Mine and Mill)
99% local workforce
On site assay laboratory and support services
Safety statistics
CURRENT Co-O MILL & INFRASTRUCTURE
10.
Co-O Mill - Crushing Circuit
Co-O Laboratory
Description Jul 2012-Feb 2013
FY 2012
FY 2011
FY 2010
FY 2009
FY 2008
FY 2007
Lost time injuries (1) 1 6 7 9 6 0 1
LTIFR (2) 0.2 1.0 1.6 2.2 1.7 0 0.6
LTIFR (2/3) - 2.5 3.1 2.8 1.6 4.4 3.5
Notes:
(1) Does not include first aid injuries (2) Per million man-hours worked (3) WA U/G Gold Mining Industry
Construction of Crusher
Mine management team
New main sub-station
Mine transformer station
Main sub-station
Mill transformer station
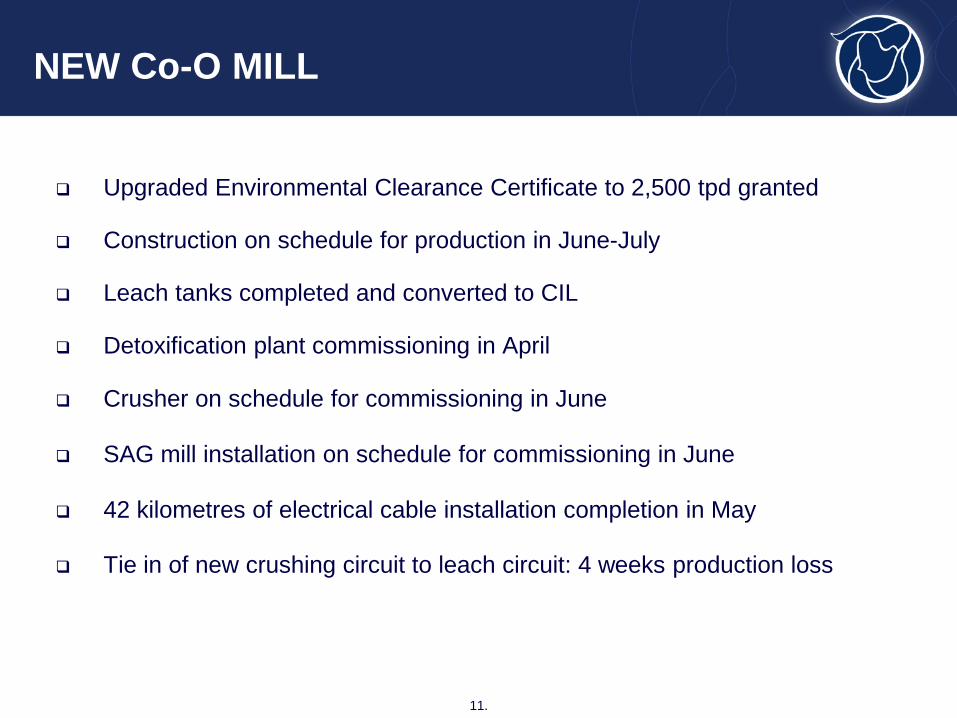
Upgraded Environmental Clearance Certificate to 2,500 tpd granted
Construction on schedule for production in June-July
Leach tanks completed and converted to CIL
Detoxification plant commissioning in April
Crusher on schedule for commissioning in June
SAG mill installation on schedule for commissioning in June
42 kilometres of electrical cable installation completion in May
Tie in of new crushing circuit to leach circuit: 4 weeks production loss
NEW Co-O MILL
11.
Co-O Laboratory
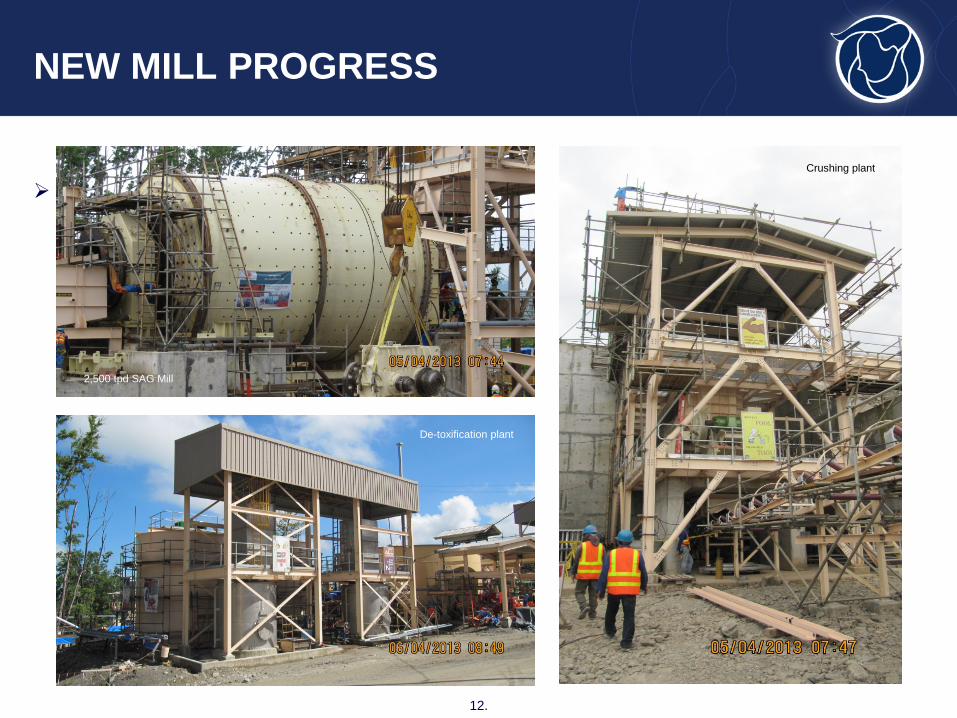
NEW MILL PROGRESS
12.
Photos of SAG mill and crusher, maybe something else 2,500 tpd SAG Mill
De-toxification plant
Crushing plant
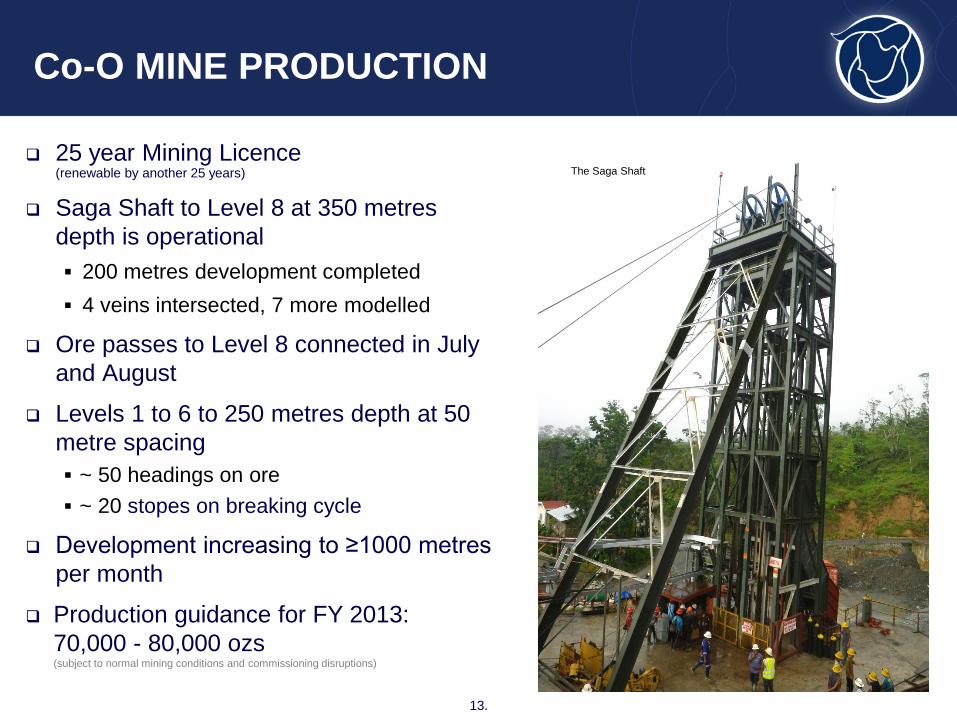
25 year Mining Licence (renewable by another 25 years)
Saga Shaft to Level 8 at 350 metres depth is operational 200 metres development completed 4 veins intersected, 7 more modelled
Ore passes to Level 8 connected in July and August
Levels 1 to 6 to 250 metres depth at 50 metre spacing ~ 50 headings on ore ~ 20 stopes on breaking cycle
Development increasing to ≥1000 metres per month
Production guidance for FY 2013: 70,000 - 80,000 ozs (subject to normal mining conditions and commissioning disruptions)
Co-O MINE PRODUCTION
13.
New Mine Office at Co-O
Saga Shaft temporary headframe
Construction of SAGA shaft Saga Shaft
The Saga Shaft
Text here
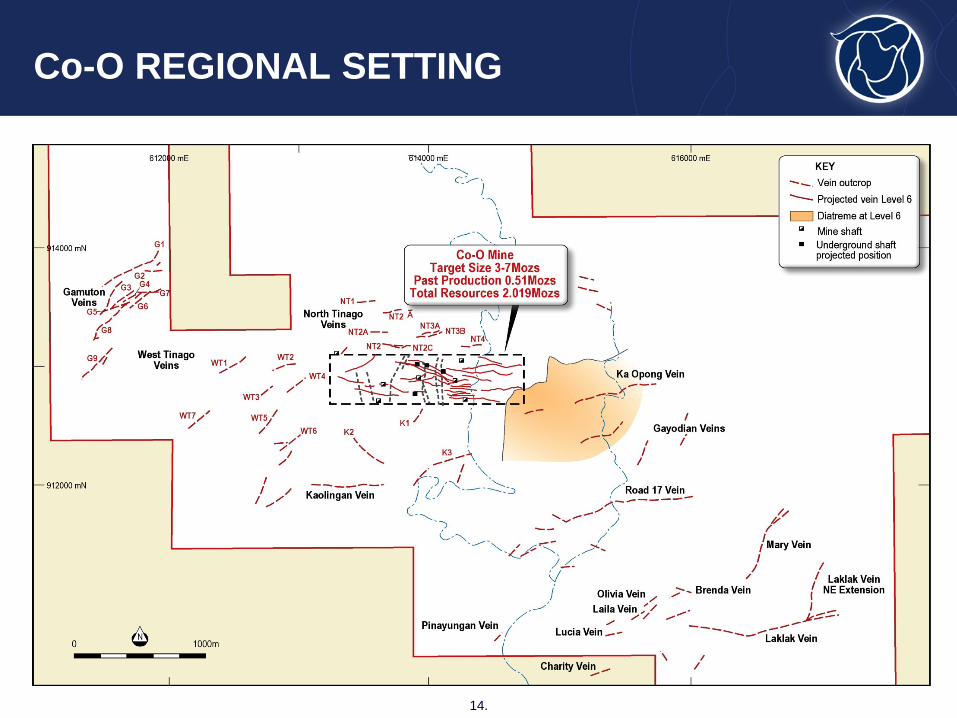
Co-O REGIONAL SETTING
14.
The potential exploration target size and grade of the Co-O Mine is conceptual in nature and there has been insufficient exploration to define a mineral resource. It is also uncertain if further exploration will result in the target being defined as a mineral resource.
Text here
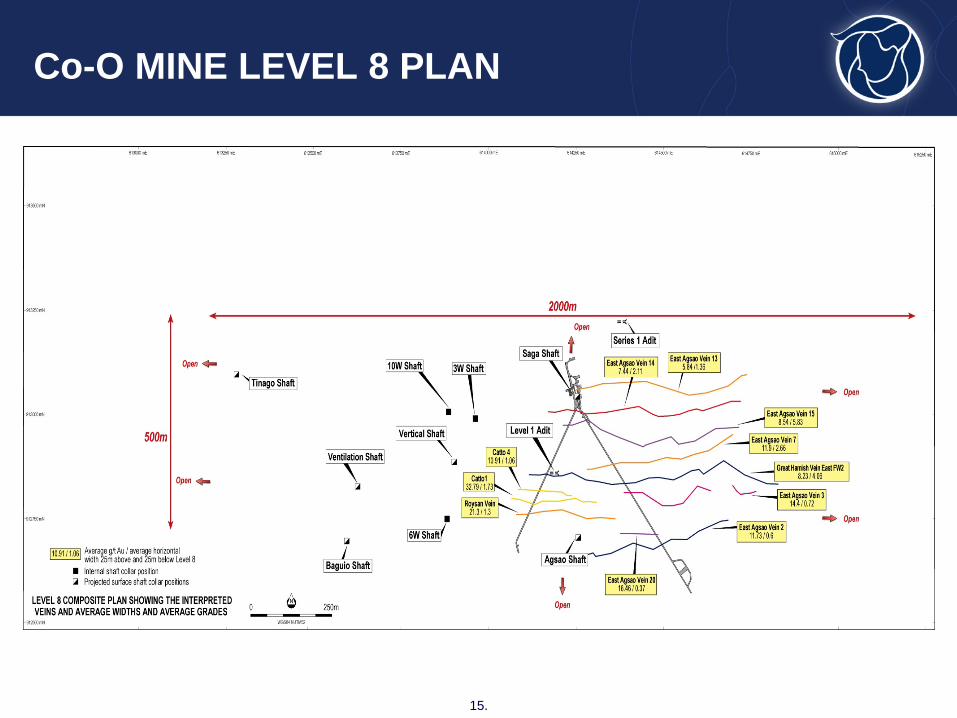
Co-O MINE LEVEL 8 PLAN
15.
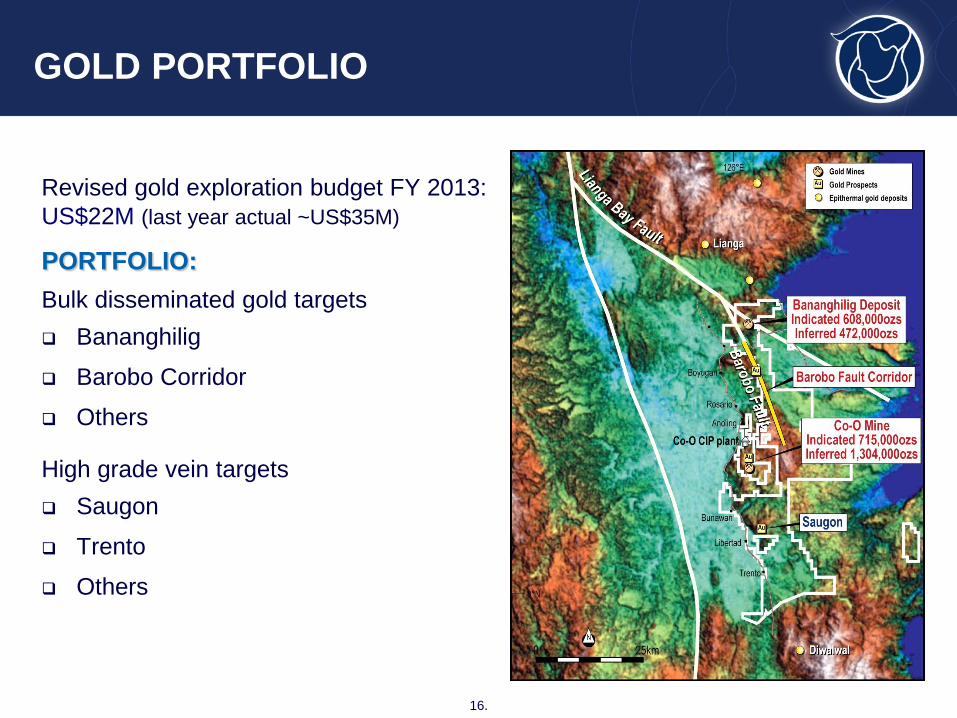
Revised gold exploration budget FY 2013: US$22M (last year actual ~US$35M)
PORTFOLIO: Bulk disseminated gold targets Bananghilig
Barobo Corridor
Others High grade vein targets Saugon
Trento
Others
GOLD PORTFOLIO
16.
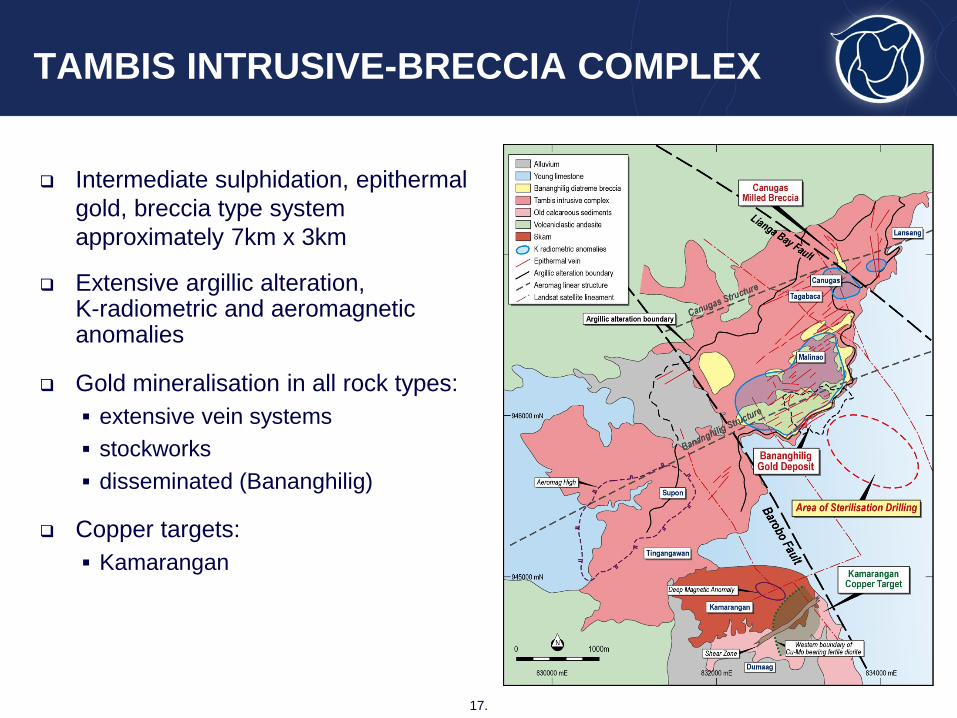
Intermediate sulphidation, epithermal gold, breccia type system approximately 7km x 3km
Extensive argillic alteration, K-radiometric and aeromagnetic anomalies
Gold mineralisation in all rock types: extensive vein systems stockworks disseminated (Bananghilig)
Copper targets: Kamarangan
TAMBIS INTRUSIVE-BRECCIA COMPLEX
17.
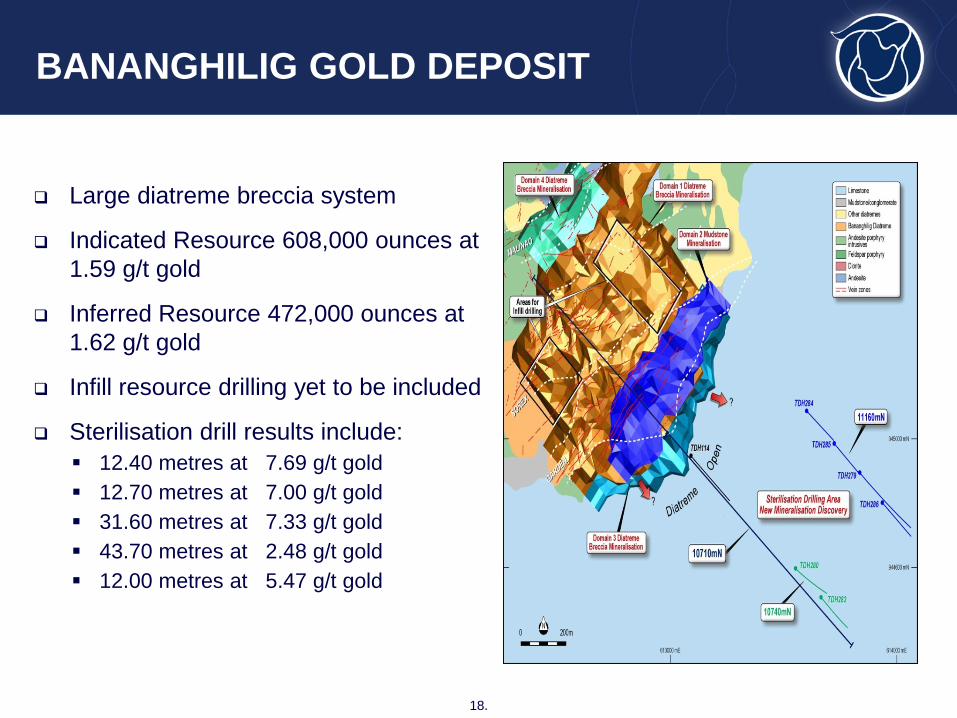
Large diatreme breccia system
Indicated Resource 608,000 ounces at 1.59 g/t gold
Inferred Resource 472,000 ounces at 1.62 g/t gold
Infill resource drilling yet to be included
Sterilisation drill results include: 12.40 metres at 7.69 g/t gold 12.70 metres at 7.00 g/t gold 31.60 metres at 7.33 g/t gold 43.70 metres at 2.48 g/t gold 12.00 metres at 5.47 g/t gold
BANANGHILIG GOLD DEPOSIT
18.
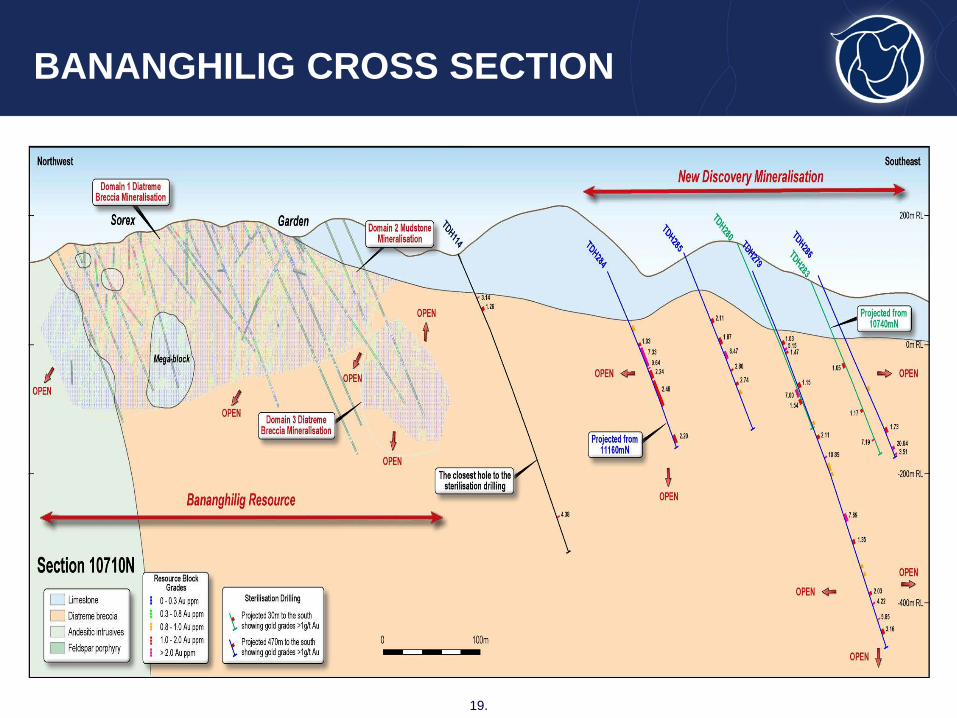
Text here
BANANGHILIG CROSS SECTION
19.
BANANGHILIG SCOPING STUDY
20.
Key parameters ±25% Mill size: ~ 5,000,000 tonnes per annum for 200,000 annualised ounces CAPEX: US$220M comprising, Mill US$170M Associated infrastructure including tailings storage US$50M
Mill OPEX: US$12 per tonne Metallurgical recovery: 80% CIL with potential to increase to 90% with flotation + oxidation
processing routes at a later stage Indicative mining costs: US$10.50 per tonne/ore Indicative recovered head grade: 1.3 g/t gold Indicative waste to ore strip ratio: 4:1(after pre-strip) Indicative cash costs: US$565 per ounce (excluding royalties)
Additional information Resource upgrade on incorporation of 14 infill holes and re-estimation of the resources and
reserves in Sep quarter 2013 New mill site being prepared for sterilisation drilling Strong community support indicated from comprehensive community consultation Application for an Environmental Clearance Certificate in preparation Feasibility to ±15% accuracy by external consultants to be completed in Sep quarter 2013
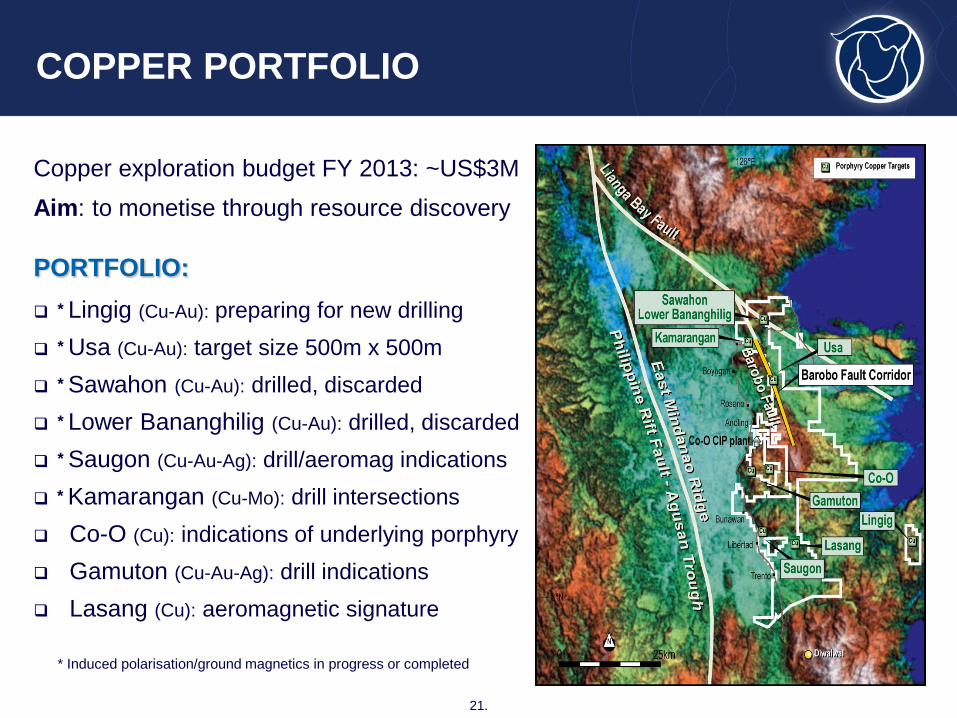
Copper exploration budget FY 2013: ~US$3M Aim: to monetise through resource discovery
PORTFOLIO: * Lingig (Cu-Au): preparing for new drilling * Usa (Cu-Au): target size 500m x 500m * Sawahon (Cu-Au): drilled, discarded * Lower Bananghilig (Cu-Au): drilled, discarded * Saugon (Cu-Au-Ag): drill/aeromag indications * Kamarangan (Cu-Mo): drill intersections Co-O (Cu): indications of underlying porphyry Gamuton (Cu-Au-Ag): drill indications Lasang (Cu): aeromagnetic signature
COPPER PORTFOLIO
21.
* Induced polarisation/ground magnetics in progress or completed
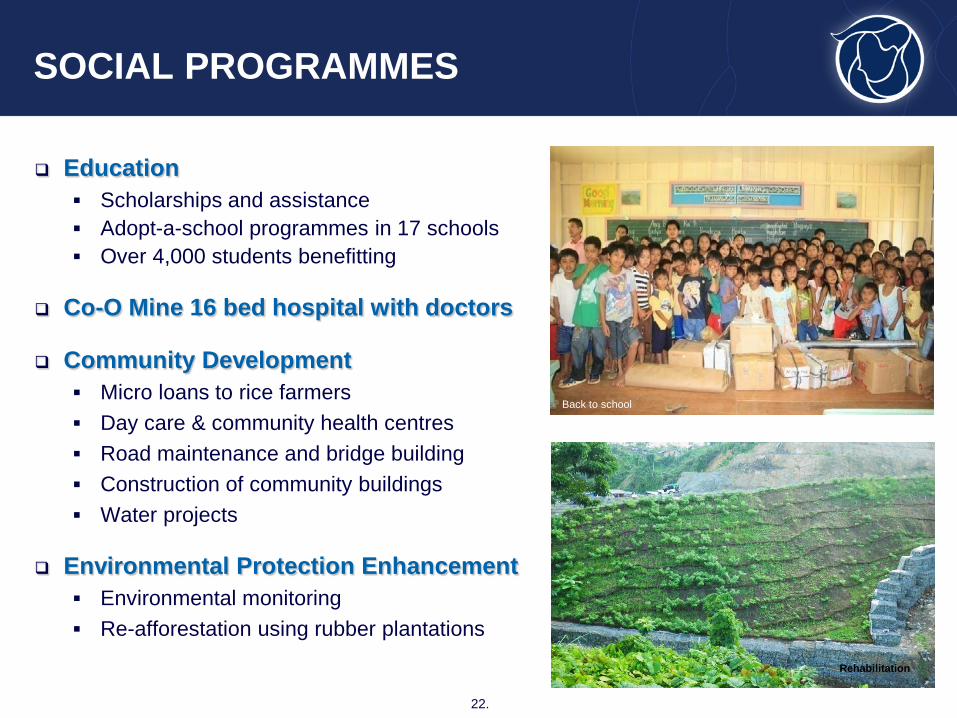
Education Scholarships and assistance Adopt-a-school programmes in 17 schools Over 4,000 students benefitting
Co-O Mine 16 bed hospital with doctors
Community Development Micro loans to rice farmers Day care & community health centres Road maintenance and bridge building Construction of community buildings Water projects
Environmental Protection Enhancement Environmental monitoring Re-afforestation using rubber plantations
SOCIAL PROGRAMMES
22.
Back to school
Sponsored rice farming Tailings dam rehabilitation Tailings dam rehabilitation Rehabilitation
Un-hedged, low cost, dividend paying gold producer
Self-funded growth path to production of 400,000 ounces per year underpinned by strong cash-flow generated from the Co-O Mine
Potential for long mine life at the Co-O Mine (Conceptual exploration target size (**) of 3 to 7 million ounces)
Un-explored new mineral field offering excellent upside for: Increasing resource base high grade gold veins disseminated gold deposits porphyry copper-gold deposits
Exploration budget of US$25M on 820 km2 of tenements to unlock value
WHY MEDUSA!!
23.
(**) The potential exploration target size and grade of the Co-O Mine is conceptual in nature and there has been insufficient exploration to define a mineral resource. It is also uncertain if further exploration will result in the target being defined as a mineral resource.
This presentation contains only a brief overview of Medusa Mining Limited and its associated entities (“Medusa”) and their respective activities and operations. The contents of this presentation (including matters relating to the geology of Medusa’s projects), may rely on various assumptions and subjective interpretations which is not possible to detail in this presentation and which have not been subject to any independent verification.
This presentation contains a number of forward-looking statements. Known and unknown risks and uncertainties, as well as factors outside of Medusa’s control, may cause the actual results, performance and achievements of Medusa to differ materially from those expressed or implied in this presentation. Medusa does not warrant the accuracy, currency or completeness of the information with respect to forward-looking statements contained in this presentation, nor the future performance of Medusa.
To the maximum extent permitted by law, Medusa and its officers, employees and advisers are not liable for any loss or damage (including, without limitation, any direct, indirect or consequential loss or damage) suffered by any person directly or indirectly as a result of relying on this presentation or otherwise in connection with it.
This presentation is not intended to be an offer for subscription, invitation, solicitation or recommendation with respect to securities in Medusa in any jurisdiction including the United States. No securities in Medusa have been nor will be registered under the US Securities Act of 1933,(USA) as amended. This presentation does not constitute an advertisement for an offer or proposed offer of securities under Australian law, US law or any other law and is for general information purposes only.
The information contained in this presentation is not a substitute for detailed investigation or analysis of any particular issue and has been prepared without consideration of your objectives and needs and financial position. Current and potential investors and shareholders should seek independent advice before making any investment decision in regard to Medusa or its activities.
IMPORTANT NOTICE
24.
JORC COMPLIANCE - CONSENT OF COMPETENT PERSONS
Information in this report relating to Exploration Results has been reviewed and is based on information compiled by Mr Geoffrey Davis, who is a member of The Australian Institute of Geoscientists. Mr Davis is the Non-Executive Chairman of Medusa Mining Limited and has sufficient experience which is relevant to the style of mineralisation and type of deposits under consideration and to the activity which he is undertaking to qualify as a “Competent Person” as defined in the 2004 Edition of the “Australasian Code for Reporting of Exploration Results, Mineral Resources and Ore Reserves”. Mr Davis consents to the inclusion in the report of the matters based on his information in the form and context in which it appears.
Information in this report relating to Mineral Resources has been estimated and compiled by Mr Mark Zammit of Cube Consulting Pty Ltd of Perth, Western Australia. Mr Zammit is a member of The Australasian Institute of Mining & Metallurgy and has sufficient experience that is relevant to the style of mineralisation and type of deposit under consideration and to the activity which he is undertaking to qualify as a Competent Person as defined in the 2004 Edition of the “Australasian Code for Reporting of Exploration Results, Mineral Resources and Ore Reserves”. Mr Zammit consents to the inclusion in the report of the matters based on his information in the form and context in which it appears.
Information in this report relating to Ore Reserves is based on information compiled by Dr Spero Carras, FAusIMM of Carras Mining Pty Ltd. Dr Carras has 30 years of experience which is relevant to the style of mineralisation and type of deposit under consideration and to the activity which they are undertaking to qualify as Competent Persons as defined in the 2004 Edition of the “Australasian Code for Reporting of Exploration Results, Mineral Resources and Ore Reserves”. Dr Carras consents to the inclusion in the report of the matters based on his information in the form and context in which it appears.
Board of Directors: Geoffrey Davis (Non-Executive Chairman)
Peter Hepburn-Brown (Managing Director/CEO)
Raul Villaneuva (Executive Director)
Robert Weinberg (Non-Executive Director)
Andrew Teo (Non-Executive Director)
Ciceron Angeles (Non-Executive Director)
Gary Powell (Non-Executive Director)
Address and Contact Details: Unit 7, 11 Preston Street
Como WA 6152
Australia
Telephone: +618 9367 0601
Facsimile: +618 9367 0602
Email: [email protected]