Embed Size (px)
Citation preview

1
Investor Presentation
March 2017

PwC
Forward-Looking Information
This management presentation (the “presentation”) was prepared as a summary overview of current information about Fortune Minerals Limited (the “Company”) only and is not a prospectus or other offering document intended to provide investors with the information required to make investment decisions. This presentation does not purport to contain full and complete information about the Company and its operations and recipients of this information are advised to review the Company’s public disclosure, available on SEDAR at www.sedar.com under the Corporate Profiles heading for full and complete information about the Company.
This presentation contains certain information and statements that constitute “forward-looking statements” or “forward-looking information” including “financial outlook”, as such terms are defined under applicable Canadian and United States securities laws. These statements are subject to certain risks and uncertainties that could cause actual results to differ materially from those included in the forward-looking information and financial outlook. All statements or information other than statements or information of historical fact may constitute forward-looking information and financial outlook. These statements and information are only predictions.
Actual events or results may differ materially. In addition, this presentation may contain forward-looking information attributed to third party industry sources. Undue reliance should not be placed on the forward-looking information and financial outlook, as there can be no assurance that the plans, intentions or expectations upon which this information is based will occur. By its nature, forward-looking information (which includes financial outlook) involves numerous assumptions, known and unknown risks and uncertainties, both general and specific, that contribute to the possibility that the predictions, forecasts, projections made will not occur.
Specific forward-looking information contained in this presentation includes, among others, statements regarding: the anticipated timing of production at the NICO Project; metal recoveries and products to be generated by the Company’s Saskatchewan Metals Processing Plant (the “SMPP”); the expected capital and operating costs for the NICO Project and the SMPP; Company’s anticipated revenues and internal rate of return from the NICO Project; and the Company’s future developments plans for, and anticipated mine life of, the Arctos Anthracite Project and the Company’s strategy with respect to the development and potential expansion of its projects. The financial outlook with respect to the NICO Project and the Arctos Anthracite Project contained in this presentation, respectively, is derived from the feasibility report included in the Micon Technical Report and the feasibility report included in the Marston Technical Report, respectively, each of which was prepared for strategic planning purposes, and is not appropriate for any other purpose.
With respect to forward-looking information and financial outlook contained in this presentation, the Company has made assumptions (including those assumptions set forth in certain pages of this presentation regarding, among other things: the Company’s ability to develop and operate the NICO Project; expected production and associated costs being in line with estimates; the Company’s ability to expand production in the future; the ability to increase capital spending as necessary in the circumstances; and the production potential of its properties and properties to be acquired being consistent with its expectations.
Some of the risks that could affect the Company’s future results and could cause results to differ materially from those expressed in the Company’s forward-looking information and financial outlook include: the inherent risks involved in the exploration and development of mineral properties and in the mining industry in general; the risk that the Company may not be able to arrange the necessary financing to develop, construct and operate the NICO Project and the SMPP; uncertainties with respect to the timing of, or the ability to repurchase the Arctos coal deposits; uncertainties with respect to the receipt or timing of required permits for the development of the NICO Project, the SMPP and the Arctos Anthracite Project; the possibility of delays in the commencement of production from the NICO Project; the risk that the operating and/or capital costs for any of the Company’s projects may be materially higher than anticipated; the risk of decreases in the market prices of the metals to be produced by the Company’s projects; loss of key personnel; discrepancies between actual and estimated production; discrepancies between actual and estimated mineral resources or between actual and estimated metallurgical recoveries; uncertainties associated with estimating mineral resources and even if such resources prove accurate the risk that such resources may not be converted into mineral reserves, once economic conditions are applied; labour shortages; mining accidents; the cost and timing of expansion activities; changes in applicable laws or regulations; competition for, among other things, capital and skilled personnel; unforeseen geological, technical, drilling and processing problems; compliance with and liabilities under environmental laws and regulations; changes to the Company’s current business strategies and objectives; and other factors, many of which are beyond the Company’s control. In addition, the risk factors described or referred to in the Company’s Annual Information Form for the year ended December 31, 2015, which is available on the SEDAR website under the heading Corporate Profiles, should be reviewed in conjunction with the information contained in this presentation.
The financial outlook and forward-looking information contained herein, speak only as of the date of this presentation. Except as required by law, the Company and its subsidiaries do not intend, and do not assume any obligation, to update the financial outlook and forward-looking information contained herein.
This presentation does not constitute an offer to sell or a solicitation of an offer to buy nor shall there be any sale of any of the securities in any jurisdiction in which such offer, solicitation or sale would be unlawful. The Company’s securities have not been and will not be registered under the United States Securities Act of 1933, as amended (the "U.S. Securities Act"), or the securities laws of any state of the United States and will not be offered or sold within the United States or to or for the account or benefit of a U.S. Person or a person in the United States (as such terms are defined in Regulation S under the U.S. Securities Act) unless registered under the U.S. Securities Act and applicable state securities laws or pursuant to an exemption from such registration requirements.

PwC
Technical Information
The scientific and technical information with respect to the NICO Project contained in this presentation is based on the technical report dated May 5, 2014 prepared by Micon International entitled “Technical Report on the Feasibility Study for the Nico Gold-Cobalt-Bismuth-Copper Project, Northwest Territories, Canada” (the “Micon Technical Report”) prepared by Harry Burgess, P.Eng., Richard M. Gowans, P.Eng., B. Terrence Hennessey, P.Geo., Christopher R. Lattanzi, P.Eng. and Eugene Puritch, P.Eng., the qualified persons for the purposes of NI 43-101, a copy of which is available for review on SEDAR at www.sedar.com under the Company’s profile.
Except as other wise set forth herein, the scientific and technical information with respect to the Arctos Anthracite Project contained in this presentation is based on the technical report dated November 28, 2012 prepared by Golder Associates entitled “Technical Report on the 2012 update of the Arctos Anthracite Project Mine Feasibility Study” prepared by Edward H. Minnes, P.E., the qualified person for purposes of NI 43-101, a copy of which is available for review on SEDAR at www.sedar.com under the Company’s profile.
Mineral resources referred to herein are not mineral reserves and do not have demonstrated economic viability. There is no certainty that all or any part of the mineral resources estimated will be converted into mineral reserves. The mineral resource estimates include inferred mineral resources that are normally considered too speculative geologically to have economic considerations applied to them that would enable them to be categorized as mineral reserves. There is also no certainty that inferred mineral resources will be converted to measured and indicated categories through further drilling, or into mineral reserves, once economic considerations are applied. Mineral resource tonnage and contained metal as disclosed herein have been rounded to reflect the accuracy of the estimate, and numbers may not add due to rounding.
The disclosure of scientific and technical information contained in this presentation has been approved by Robin Goad, M.Sc., P.Geo., President and Chief Executive Officer of Fortune Minerals Limited, who is a “Qualified Person” under NI 43-101
This document may contain information obtained from third parties, including ratings from credit ratings agencies such as Standard & Poor’s. Reproduction and distribution of third party content in any form is prohibited except with the prior written permission of the related third party. Third party content providers do not guarantee the accuracy, completeness, timeliness or availability of any information, including ratings, and are not responsible for any errors or omissions (negligent or otherwise), regardless of the cause, or for the results obtained from the use of such content.
THIRD PARTY CONTENT PROVIDERS GIVE NO EXPRESS OR IMPLIED WARRANTIES, INCLUDING, BUT NOT LIMITED TO, ANY WARRANTIES OF MERCHANTABILITY OR FITNESS FOR A PARTICULAR PURPOSE OR USE. THIRD PARTY CONTENT PROVIDERS SHALL NOT BE LIABLE FOR ANY DIRECT, INDIRECT, INCIDENTAL, EXEMPLARY, COMPENSATORY, PUNITIVE, SPECIAL OR CONSEQUENTIAL DAMAGES, COSTS, EXPENSES, LEGAL FEES, OR LOSSES (INCLUDING LOST INCOME OR PROFITS AND OPPORTUNITY COSTS OR LOSSES CAUSED BY NEGLIGENCE) IN CONNECTION WITH ANY USE OF THEIR CONTENT, INCLUDING RATINGS.
Credit ratings are statements of opinions and are not statements of fact or recommendations to purchase, hold or sell securities. They do not address the suitability of securities or the suitability of securities for investment purposes, and should not be relied on as investment advice.”
S&P Global – Markert Intelligence

Corporate Information
Listings: TSX (Canada): FT
OTC QX (USA): FTMDF
Share Price C$0.22
Shares Out – Basic 298.0
Shares Out – Fully Diluted 401.9
Market Cap – Basic C$65.6
Cash & Equivalents (Q3 2016) C$1.0
Total Assets (Q3 2016) C$69.1
All amounts in M or CDN$M except per share amountsC$6.45M Bought Deal Financing closed Mar 8, 2017
Analyst Coverage
Dealer Date Rating Target
David DavidsonParadigm Capital
Jul 6, 2015 Under Review NA
Siddharth RajeevFundamental Research Corp.
Jan 26, 2017 Buy $0.85
Ownership
Directors, Officers & Insiders 15%
As of Mar 8, 2017
4
Share Performance

100% Owned NICO Cobalt-Gold-Bismuth-Copper Project
Vertically Integrated Shovel-Ready Project
Mine & Concentrator in NWT
Refinery in Saskatchewan
$116 Million invested
33 Million Tonne (Mt) 21-Year Reserve
Test Mining Validation of deposit grade & geometry
Pilot Plant Validation of process & products
FEED Engineering, Positive Feasibility Study & Peer Review
Environmental Assessment (EA) approvals & Major Mine Permits in place
Canadian Primary Cobalt Project independent of Congo, China, & Nickel & Copper mining
Satellite Sue-Dianne Copper-Silver-Gold deposit
Proven Management Team
5

Cobalt Sulphate
Bismuth Ingot
Proven Flow Sheet to produce High Value Metals & Chemicals
Cobalt: Average annual production 1,615 tonnes in Cobalt Sulphate Heptahydrate (>20.9% Co)
Gold: Average annual production 41,360 ozs in Doré bars
Bismuth: Average annual production 1,750 tonnes in Ingots & Needles (>99.995% Bi) & Bismuth Oxide (89.7% Bi)
Copper: Average annual production 265 tonnes of Metal (~90% Cu)
Gold
6Bismuth Needles Bismuth Oxide
Copper Cement

~105,000 tpa market in 2015 with 20 year ~6% CAGR
Rechargeable Batteries 49% of market - Used to power Portable Electronic Devices, Electric Vehicles (EVs) & Stationary Storage Cells up from 1% of market in mid-1990’s
CRU forecasts growing Deficit & ~7% CAGR to 2020
Exane BNP Paribas forecasts Cobalt Demand will double to ~200,000 t by 2022
Supply Chain Concerns:
>60% of Mine Production in Congo
52% of Refinery Production in China
With Kokkola acquisition, 84% of Refined Chemical Production controlled by China
By-product of copper & nickel mining where primary metals dictate production
Responsible Sourcing & Supply Chain Transparency - US Dodd Frank & EU Conflict Minerals Legislation
Pressure from Electronics Industry Citizens Coalition
7

8
Battery Structure
Positive Electrode (Cathode) = Li-Metal-OxideMetal typically cobalt +/- other metals
Negative Electrode (Anode) = Graphite (Carbon)
Electrolyte (Li Salt)
Battery Chemical Reaction
During charging, Li in positive electrode ionized &moves through electrolyte from layer to layer tonegative electrode to store energy
During discharge ions move back to positiveelectrode & return to original compoundreleasing energy

Li-Ion Batteries (orange histograms) have greater Specific Energy over other rechargeable batteries
Cobalt cathodes (LCO, NMC & NCA [highest]) deliver greatest Energy Density for Power, Performance & Charge Life
Lithium-Cobalt Oxide
Lithium-Nickel-Manganese-Cobalt Oxide
Lithium-Nickel-Cobalt-Aluminum-Oxide
Cobalt Chemicals also in Cathodes of Nickel-Cadmium& Nickel Metal Hydride Batteries
Major Li-Ion Battery producers confirm cobalt-based chemistries will remain Industry Standard for foreseeable future
Darton Commodities forecasts 11% CAGR Battery demand for Cobalt to 2022
9
Specific Energy in Watt-Hour/Kilogram By Battery Type
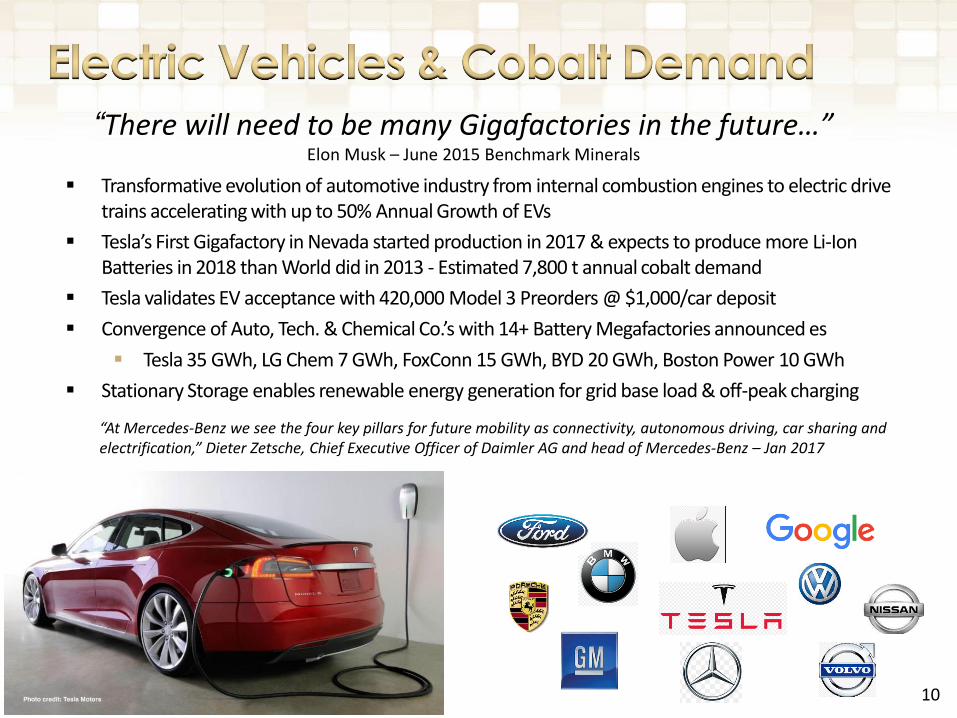
Transformative evolution of automotive industry from internal combustion engines to electric drive trains accelerating with up to 50% Annual Growth of EVs
Tesla’s First Gigafactory in Nevada started production in 2017 & expects to produce more Li-Ion Batteries in 2018 than World did in 2013 - Estimated 7,800 t annual cobalt demand
Tesla validates EV acceptance with 420,000 Model 3 Preorders @ $1,000/car deposit
Convergence of Auto, Tech. & Chemical Co.’s with 14+ Battery Megafactories announced es
Tesla 35 GWh, LG Chem 7 GWh, FoxConn 15 GWh, BYD 20 GWh, Boston Power 10 GWh
Stationary Storage enables renewable energy generation for grid base load & off-peak charging
10
“There will need to be many Gigafactories in the future…”Elon Musk – June 2015 Benchmark Minerals
“At Mercedes-Benz we see the four key pillars for future mobility as connectivity, autonomous driving, car sharing and electrification,” Dieter Zetsche, Chief Executive Officer of Daimler AG and head of Mercedes-Benz – Jan 2017

11
0
200
400
600
800
1,000
1,200
1,400
1,600
1,800
2,000
2010 2011 2012 2013 2014 2015 2016 2017 2018 2019 2020
US$
/kW
h
Lithium-ion Battery Automotive System Stationary Energy System
Source: Deutsche Bank, Tesla, Visual Capitalist, Bloomberg New Energy Finance, Seeking Alpha and PwCCF Analysis
Average Price of Li-ion Batteries continues to decrease
Electric Vehicle Market is expected to Continue Growing
Goal $100/kWh
$240/kWh competitive @
$3/gallon gas
0.0%
0.5%
1.0%
1.5%
2.0%
2.5%
3.0%
0
2
4
6
8
10
12
14
16
18
2014 2015 2016 2017 2018 2019 2020 2021 2022 2023 2024 2025%
of
Glo
bal
Mar
ket
Glo
bal
Car
Sal
es (
$ m
illio
ns)
Full EV - Passenger Full EV - Commercial Plug-in Hybrid Hybrid Full EV as a % of global market
EVs at US$240/kWh for Li-ion batterycomparable to US$3/gallon gas
Tesla & other EV Co.’s targetingUS$100/kWh battery to becomemore affordable
Battery cost of US$6,000/carcompares with average engine cost of US$5,500 before savings fromeliminating fuel tank, exhaust & otherparts
EV sales already strong despitelimited supply with sales growing 40 - 50%/annum since 2011
Market adoption growing as moremanufacturers offer EV’s with largerscale production
EVs expected to account for 2.5%of global car market by 2025

12Source: S&P Global – Market Intelligence, USGS, Darton Commodities & Company Management
2015 World Rank
General Mine Life Primary Commodity Production - Cobalt (tonnes)
Project Project Location Current Controlling Company(s) Start End Mineral
2014 Production
(tonnes) 2010 2011 2012 2013 2014 20151 Mutanda Dem. Rep. Congo Glencore Plc, Fleurette Properties Limited 2004 2029 Copper 197,100 8,900 7,900 8,500 13,700 14,400 16,500
2 Tenke Fungurume Dem. Rep. Congo China Molybdenum Co. Ltd., Lundin Mining Corp., Gecamines SARL
2009 2056 Copper 202,648 9,072 11,340 11,793 12,751 13,334 16,013
3 Ruashi-Etoile Dem. Rep. Congo Jinchuan Grp Intl Rsrc Co. Ltd, Gecamines SARL 2007 2032 Copper 35,056 3,588 3,678 3,000 3,045 3,885 4,344
4 Moa Bay Cuba Sherritt International Corp., Cubaniquel 1959 N/A Nickel 32,910 3,706 3,853 3,792 3,320 3,210 3,734
5 Ambatovy Madagascar Sherritt International Corp., Sumitomo Corp., Korea Resources Corp., Daewoo Corp., STX Corp
2012 2038 Nickel 37,053 0 0 493 2,083 2,915 3,464
6 Kamoto Dem. Rep. Congo Katanga Mining Ltd., Gecamines SARL 2003 2026 Copper 158,026 3,437 2,433 2,129 2,297 2,784 2,901
7 Murrin Murrin Australia Glencore Plc 1990 2046 Nickel 36,400 1,976 2,100 2,400 2,700 2,700 2,800
8 Taganito* Philippines Nickel Asia Corp., Pacific Metals Co. Ltd., Sojitz Corp.
1987 2043 Nickel 21,000 0 0 0 500 1,851 2,600
9 Jinchuan* China Jinchuan Group Co. Ltd. 1963 2034 Nickel 60,000 1,944 1,974 2,543 2,543 2,543 2,543
10 Ramu Papua New Guinea Metallurgical Corp. of CN Ltd. 2012 2031 Nickel 20,987 0 0 469 1,013 2,134 2,505
11 Goro New Caledonia Vale S.A. 2010 2044 Nickel 18,700 0 245 385 1,117 1,384 2,391
12 Polar Division* Russia PJSC MMC Norilsk Nickel 1939 2037 Copper 297,552 1,742 1,714 2,001 2,009 2,045 2,076
13 Etoile* Dem. Rep. Congo Shalina Resources Ltd 2006 2032 Copper 15,223 1,088 2,155 1,278 1,170 2,006 2,000
14 Sorowako* Indonesia PT Vale Indonesia Tbk. 1978 2035 Nickel 78,726 1,100 1,100 1,100 1,100 840 1,770
15 Konkola* Zambia Vedanta Resources Plc, ZCCM Investments Holdings Plc
1957 N/A Copper 72,428 2,000 2,400 1,600 1,950 1,750 1,750
16 Bou-Azzer* Morocco Managem S.A. 1928 2018 Nickel 200 1,582 1,788 1,314 1,353 1,391 1,722
17 Rio Tuba* Philippines Nickel Asia Corp., Pacific Metals Co. Ltd., SojitzCorp.
1975 2026 Nickel 24,000 1,368 1,404 2,269 1,500 1,500 1,500
18 Tocantins* Brazil Votorantim S.A. 1990 N/A Nickel 25,000 1,420 1,400 1,400 1,400 1,400 1,400
19 Nkomati* South Africa African Rainbow Minerals Ltd., Government of Botswana
1997 2027 Nickel 22,000 667 513 998 1,159 1,096 1,116
20 Punta Gorda* Cuba Cubaniquel 1988 N/A Nickel 30,000 842 908 839 777 933 995
22 Voisey's Bay Canada Vale S.A. 2005 2032 Nickel 48,300 524 1,585 1,221 1,256 952 849
25 Sudbury Operations Canada Glencore Plc 1929 N/A Nickel 51,900 341 473 330 700 800 800
Other Mines 25,082 22,567 20,413 18,266 9,503 8,322
Total Production 70,379 71,530 70,267 77,709 75,356 84,095Estimated Artisanal Production† 15,000Global Recycling† 5,000Total Supply 70,379 71,530 70,267 77,709 75,356 104,095Other Sources of Reported ProductionSNL Total Estimated World Production N/A 75,462 76,691 81,865 79,863 90,042USGS Total Estimated World Production 79,254 82,247 77,189 85,904 91,754 98,113Darton Total Estimated World Production 78,071 80,278 79,898 86,298 91,070 92,877

13Source: Dundee Capital Markets, CRU, Company Websites and Bloomberg New Energy Finance
-10%
-5%
0%
5%
10%
15%
-70,000
-50,000
-30,000
-10,000
10,000
30,000
50,000
70,000
90,000
110,000
2010 2011 2012 2013 2014 2015 2016E 2017E 2018E
Bal
ance
(as
a %
of
Sup
ply
)
Ref
ined
Co
bal
t(To
nn
es)
Refined Cobalt Supply & Demand
Refined Cobalt Supply Refined Cobalt Demand Balance
Demand
Supply
Global cobalt supply entered a deficit in 2016 & expected to continue to drive prices until there is new supply
With dominant world mine supply in politically unstable country & 85% of supply from mines primarily producing copper or nickel, supply expected to remain constrained
Supply further constrained by China’s dominance of cobalt chemical supply
Few primary cobalt mines identified globally & even fewer positioned to enter production within 3 years
No way to mitigate uncertainty associated with supply from most existing mines
Cobalt’s ability to increase energy density expected to continue its role in cathode chemistry
EVs provide compelling story for cobalt, before even considering the growing demand in consumer electronics & stationary storage
CRU predicts a 250% increase in demand for Li-ion batteries for EVs & 75% across other applications
Bloomberg New Energy Finance estimates 35% of all vehicles by 2040 will be electric, up from 1% in 2015

Highly liquid co-product typically countercyclical to other metals
Asian physical demand rapidly expanding
Central Banks continue to buy
Geopolitical Stress & Global Debt Crisis
Peak Gold Production in 2015 – No significant new discoveries & declining production
14
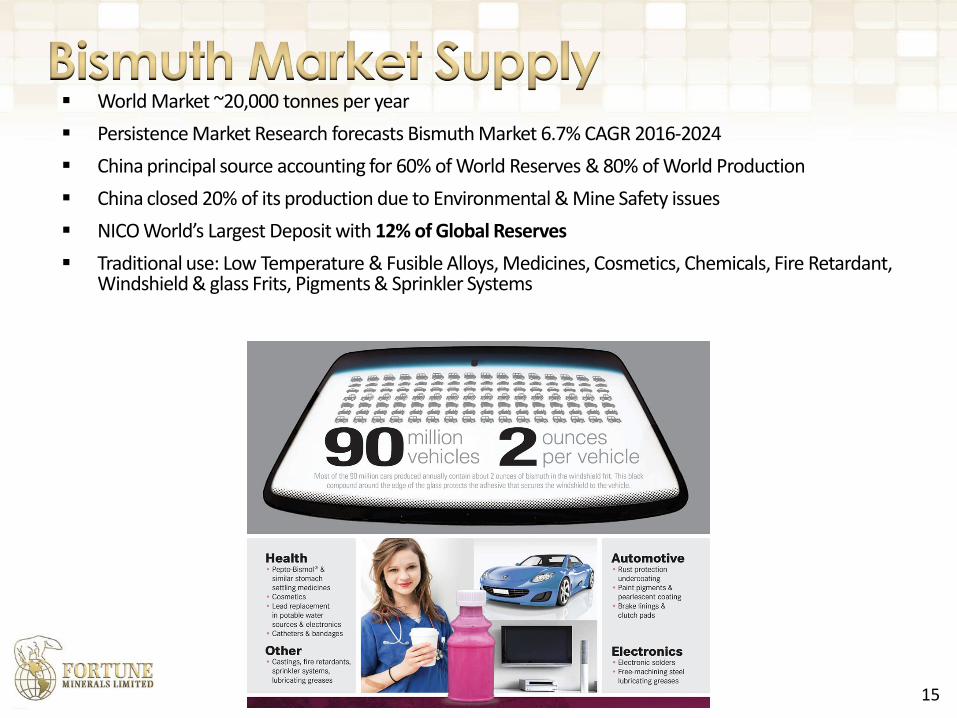
World Market ~20,000 tonnes per year
Persistence Market Research forecasts Bismuth Market 6.7% CAGR 2016-2024
China principal source accounting for 60% of World Reserves & 80% of World Production
China closed 20% of its production due to Environmental & Mine Safety issues
NICO World’s Largest Deposit with 12% of Global Reserves
Traditional use: Low Temperature & Fusible Alloys, Medicines, Cosmetics, Chemicals, Fire Retardant, Windshield & glass Frits, Pigments & Sprinkler Systems
*
15

New Markets focus on Non-Toxic, Environmentally Safe replacement for Lead in Plumbing & Electronic Solders, Brass, Steel & Aluminum, Ceramic Glazes, Hot-Dip Galvanizing, Lead-Free Pigments, Automotive Anti-Corrosion Coatings & Pearlescent Paints
Global framework to eliminate Lead expected to drive Increased Bismuth Consumption
European REACH & RoHS Legislation to eliminate lead in Electronics & Consumer Goods
Lead Banned in US from wetted surfaces of Potable Drinking Water Sources (pipes, fixtures & Solders)
Growing Number of Applications
16
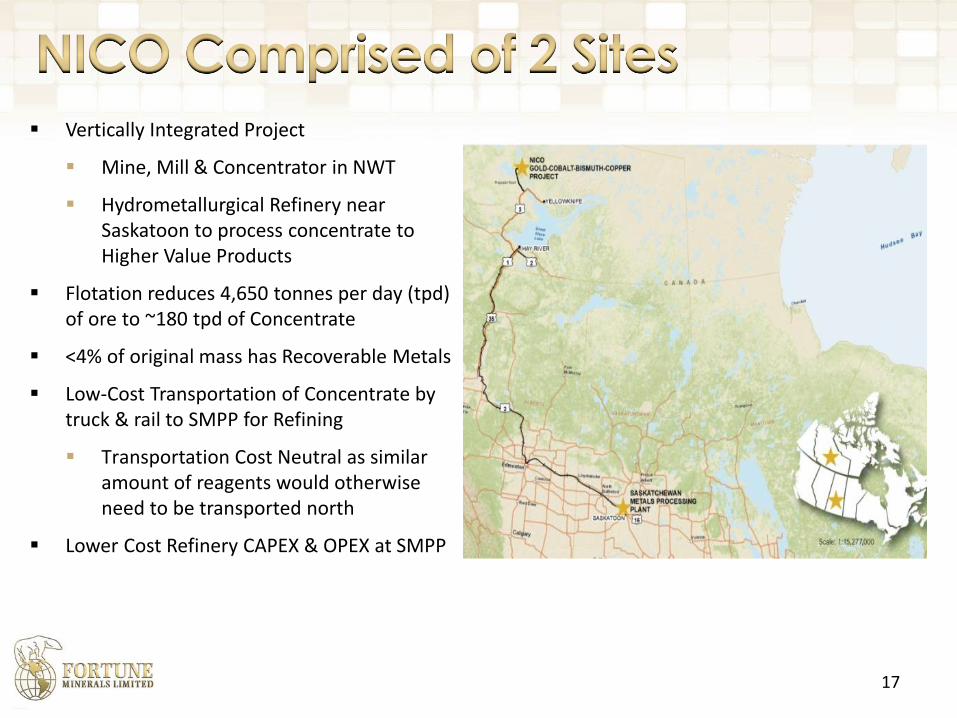
Vertically Integrated Project
Mine, Mill & Concentrator in NWT
Hydrometallurgical Refinery near Saskatoon to process concentrate to Higher Value Products
Flotation reduces 4,650 tonnes per day (tpd) of ore to ~180 tpd of Concentrate
<4% of original mass has Recoverable Metals
Low-Cost Transportation of Concentrate by truck & rail to SMPP for Refining
Transportation Cost Neutral as similar amount of reagents would otherwise need to be transported north
Lower Cost Refinery CAPEX & OPEX at SMPP
17

5,140 Ha leases in Southern NWT
160 km from City of Yellowknife
Winter Ice Road Access
Federal & NWT Government funding for 94 km All-Season Public Highway to Whati
Construction Start planned in 2018
Fortune permitted to build 50 km Spur Road from Whati to Mine
Truck haulage of Concentrate to Hay River for railway transport to SMPP
22 km from Snare Hydro & Lower-Cost Hydro Power Supply
Settled Land Claim with Tlicho Government who support project
18

NICO Mineral Reserves Based on 327 drill holes, Surface Trenches & Underground Test Mining
Iron Oxide Copper Gold (IOCG) (Olympic Dam-type) deposit
Ore hosted in 3 Stratabound Breccia Lenses up to 1.3 km long, 550 wide, & 70 m thick
Significant Exploration Potential to extend Orebody with additional drilling of large geophysical anomalies & surface mineralization
Satellite Sue-Dianne Copper-Silver-Gold deposit
Green = Upper Ore Zone, Blue = Middle Ore Zone, Red = Lower Ore Zone
Brown = Open Pit, Cyan = Underground Development and Stopes
19

Underground Mineral ReservesTonnes
(Thousands)Au
(g/t)Co (%)
Bi (%)
Cu (%)
Proven 282 4.93 0.14 0.27 0.03
Probable 295 5.00 0.07 0.07 0.01
Total 577 4.96 0.10 0.17 0.02
Open Pit Mineral ReservesTonnes
(Thousands)Au
(g/t)Co (%)
Bi(%)
Cu (%)
Proven 20,453 0.92 0.11 0.15 0.04
Probable 12,047 1.03 0.11 0.13 0.04
Total 32,500 0.96 0.11 0.14 0.04
Combined Mineral ReservesTonnes
(Thousands)Au
(g/t)Co (%)
Bi (%)
Cu (%)
Proven 20,735 0.97 0.11 0.15 0.04
Probable 12,342 1.13 0.11 0.13 0.04
Total 33,077 1.03 0.11 0.14 0.04
Metal Contained 1.11 Moz 82.3 Mlb 102.1 Mlb 27.2 Mlb
Sums of the combined reserves may not exactly equal sums of the underground and open pit reserves due to rounding error
20

Test Mining completed to confirm Deposit geometry & grades
~$20 million Pre-Production Development already completed - 2 Km of Underground Workings
Large Bulk Samples collected for Pilot Plant Testing Confirming Process, Recoveries & Products
Premium Battery-Grade Cobalt Sulphate produced to support Off-Take Negotiations
Front-End Engineering & Design (FEED) Completed with ~30% of Detailed Engineering
Post-FEED Engineering by Hatch
Execution Plan in Place for Project Delivery
3rd Party Due-Diligence on all aspects of Project
21

22
Primarily Open Pit Mining
Underground Mining & Open Pit in 1st 2 years
Early Access to High Grade improves Project Economics
Co-mingled waste rock & mill tailings
Plant Site
Crusher, Mill & Flotation Concentrator
Camp & ancillary buildings
Access road
180 to 270 Employees

Hydrometallurgical Refinery to be built on land already owned 27 km north of Saskatoon
Process NICO Concentrate to High Value Metals & Chemicals in Low-Cost Jurisdiction
Low-Cost Power (~5.7 cents kWh) Skilled commutable Labour Pool mitigates Staff Turnover Risk (~100 employees) Proximity to reagents & services 5-Year Tax Holiday
Process Technology Proven & Flow Sheet Piloted – Samples of Product sent to potential customers
Secondary flotation to Gold-bearing Cobalt & Bismuth concentrates Cobalt recovery by Pressure Acid Leach, Solvent Extraction & sulphate crystal precipitation Bismuth recovery by acid leach, electro-winning & smelting Gold recovery by cyanidation & Merrill Crowe precipitation
Additional business opportunities with toll processing & diversification into metals recycling

Positive Feasibility Study with strong economics
Based on previous MOU with China CAMC Engineering & Procon for development, FEED Engineering & construction quotes
Capital Costs of C$ 589 Million
Negative Cash Cost for Products Net of By-Product Credits
50% Margins >$90 million annual EBITDA
Metal Recoveries Verified From Pilot Plants;
Gold Recovery Ranges from 56 to 85%, with an Average ~73.7%
Cobalt Recovery ~84%
Bismuth Recovery ~72%
Copper Recovery ~41%
Feasibility Study Highlights
Mine Type Open Pit with Underground in 2nd year
Strip Ratio Waste to Ore 3.0 : 1
Processing Rate (tonnes/day) 4,650 tpd Mill; 180 tpd Refinery
Mine Life 21 years (potential for additional 3.2)
Economics Base case 6-Yr trailing cycle
Levered Pre-Tax NPV (7%) C$ 254 million C$ 543 million
Levered Post-Tax NPV (7%) C$ 224 million C$ 505 million
Levered Pre-Tax IRR 15.6% 23.6%
Levered Post-Tax IRR 15.1% 23.2%
Capital Costs C$ 589 million + Working Capital
LOM Average Base case Revenue/yr
C$ 196 million
LOM Average OperatingCost/yr
C$ 98 million
Cobalt Operating Cost (net of credits)
Negative US$ 5.03/lb at Base Case
24
The Feasibility Study reflected in the Micon Technical Report uses Base Case Price assumptions are US$1,350/troy ounce (“oz”) for gold, US$16/pound (“lb”) for cobalt (US$19.04/lb in sulphate), US$10.50/lb for bismuth (US$12.64/lb bismuth in average production of ingot, needles and oxide), and US$2.38/lb for copper at an exchange rate of C$1=US$0.88; Cycle price sensitivity analysis uses US$1200 to US$1900/oz gold, US$ 12-30/lb cobalt, US$ 7-19/lb bismuth & US$3-4.50/lb copper

Reliable Canadian-based producer of strategic Energy & Eco Metals & Chemicals + Gold
Annual ProductionMetals Contained
3,560,400 lbs 41,360 oz 3,824,400 lbs 582,500 lbs
% of Revenue 39% 33% 27% 1%
25
$76
$63
$55
$2
0
10
20
30
40
50
60
70
80
90
100
Cobalt Sulphate Gold Bismuth Copper
Average Annual C$ Revenues by Metal - Base Case
C$
M

CAPEX/OPEX Validation: Micon (Feasibility Report), Procon/CAMCE & Hatch (NICO & SMPP CAPEX/OPEX Reports), EBA (NICO Project Access Road)
Production Validation: Micon (Feasibility Report), Hatch (Detailed Engineering), Procon(Underground Production), P&E (Reserves, Open Pit &Underground Production), Golder Associates (Waste Rock & Tailings Disposal, Environmental & Geotechnical Technical Reports), SGS (Metallurgical Tests, Pilot Plant, Flow Sheet & Product Samples), Jacobs (FEED Study), EBA (Road), DMA (Bismuth)
Market Validation: CRU, Darton, Skybeco, Falso & Ian (Formerly MCP Metal Specialists)
26

Reserves & Plant Capacity allow for acceleration of production for greater Economies of Scale
Potential Expansion of Reserves with additional drilling & exploration
Feasibility Study US$ : CAD$ 0.88 FX now 0.75 & Oil prices, Engineering & Construction Costs lower
Reduce CAPEX with Asian Procurement Strategy
Develop nearby Sue-Dianne Copper-Silver-Gold Deposit
Extend Mine Life with 5 Mt Low-Grade Stockpile when metal prices permit
Custom Toll Processing concentrates from other mines & diversification of plant with Metals Recycling
Cobalt Price higher & potential upside from DRC supply disruptions & closure of high-cost Ni-Co Laterites
Bismuth Price Upside from growing consumption with reliable Canadian supply &/or Chinese Mine Closures
Use of Gold in Project Financing to lower CAPEX
Product Diversification – Copper Sulphate, Bismuth Low Melting Temp. Alloys & other Cobalt Chemicals
27

Key Permits Secured EA’s completed for mine & SMPP Land Use Permit & Type A Water License Approvals Received
Advanced relationships with NWT & Tlicho Governments 20 year active Community Engagement with Tlicho First Nation Settled Land Claim Co-operative Relationship Agreement with Tlicho Government
Infrastructure, Socio-Economic & Participation Agreements near completion
Project Financing & Development $5.7 Million Bought Deal Financing Feasibility Study Refresh planned Complete Zoning of Refinery Engaged PwC as Financial Advisor for Project Finance
Project Financing Structure to be Arranged Concurrently
Strategic Project Equity &/or Offtake Partner Project & Equipment Financed Debt Gold Hedge or Royalty Stream Corporate Equity
28

Directors
Mahendra Naik, B Comm, CPA, CA Chairman, Director CFO Fundeco - Founding director & former CFO of IAMGOLD
Robin Goad, MSc, PGeo President & CEO, Director Geologist - 30 yrs mining & exploration experience
Carl L. Clouter Director Commercial pilot - Former owner of charter airline in NT
Shou Wu (Grant) Chen, MSc, MBA Director Geologist – Former Deputy Chairman & CEO, China Mining Resources Group
David Ramsay, BA Director Business consultant – Former Government of NWT Cabinet Minister
Glen Koropchuk, BSc, MSc Director Mining Engineer - ~30 yrs global operations & project development experience
predominantly with Anglo American & De Beers
Ed Yurkowski, BASc Director Civil Engineer & former CEO of Procon Mining & Tunneling
Management
Robin Goad, MSc, PGeo President & CEO, Director Geologist - 30 yrs mining & exploration experience
Dave Massola, BAcc Vice President Finance & CFO Accountant – 30 yrs international mine finance & accounting experience with BHP-
Billiton, De Beers Canada & GlobeStar
David Knight, BA, LLB Corporate Secretary Partner, Norton Rose Fulbright Canada LLP specializing in securities & mining law
Dustin Reinders, BSc, PEng Projects Engineer Mining Engineer with 7 yrs of industry experience
Richard Schryer, PhD Director Regulatory &
Environmental Affairs
Aquatic Scientist –20+ yrs experience in mine permitting & environmental
assessments
Troy Nazarewicz, CIM, CPIR Investor Relations Manager 20 yrs investment industry experience
Patricia Penney, B Comm, CPA, CA Financial & Accounting Manager 15 yrs accounting & audit experience
29