Embed Size (px)
Citation preview

KCA Deutag is a leading international
drilling and engineering company
working onshore and offshore with
a focus on safety, quality and
operational performance
Investor Presentation
SECOND QUARTER 2019
0
Disclaimer
1
The distribution of this presentation in certain jurisdictions may be restricted by law.Persons into whose possession this presentation comes are required to informthemselves about and to observe any such restrictions.
This presentation contains forward-looking statements concerning KCADeutag. These forward-looking statements are based on management’s currentexpectations, estimates and projections. They are subject to a number ofassumptions and involve known and unknown risks, uncertainties and other factorsthat may cause actual results and developments to differ materially from any futureresults and developments expressed or implied by such forward-lookingstatements. KCA Deutag has no obligation to periodically update or release anyrevisions to the forward-looking statements contained in this presentation to reflectevents or circumstances after the date of this presentation.
Agenda
2
Second Quarter Investor Presentation
1 Q2 Key Highlights
2 Operational Highlights
3 Business Update
4 Business Unit Financials
5 Group Results
6 Summary

Q2 Key Highlights
3
Q2 2019 revenue of $395.1m (Q2 2018: $292.8m) and EBITDA of $74.4m (Q2 2018: $50.3m)
Bentec successfully delivered the final 3 rigs for our customer in Ukraine
Operational integration of the former Dalma business now complete with synergies of $27.6m identified
and 89% of these already secured
4 Land Drilling awarded a number of new contracts in the Middle East, Russia, Europe and Africa
Contract backlog of $5.4bn (at 1 August 2019) across a blue chip customer base
Significant progress made on our technology initiative, Well of Innovation, with launch in September
Financial results noted above include results from the Dalma business which was acquired 30 April 2018
2018 results restated in compliance with IFRS 16
1
2
3
4
5
6

KCA Deutag Operations are Diversified Across Global Markets
London Bad Bentheim
Tyumen
Nizwa
St. Johns
Bergen
Dubai
Land Drilling Offshore Services RDS offices BentecRegional offices
Aberdeen (HQ)
North Sea
/Norway
18 Plat
Europe &
Caspian
7 Rigs
Caspian
7 Plat
Russia
17 Rigs
Middle
East
41 Rigs
Angola
2 Plat
Africa
11 Rigs
Brunei
1 Rig
Canada
1 Plat
Map shows position at 1 August 2019
(1) The % split of LTM EBITDA is calculated using total KCAD group Q2 2019 LTM Proforma EBITDA of $306m (after corporate
costs of $16m)
Russia
Sakhalin
3 Plat
PRESENCE IN KEY AREAS
131
60 5545
20
0
30
60
90
120
150
Europe North Africa Middle East North Sea Russia
Ye
ars
4
Geographical EBITDA Split(1)
Baku

Market Outlook By Business Unit
5
Business Units Outlook
Land Drilling
New contract awards and extensions in Middle East, Russia, Europe and Africa
Tendering has levelled out though remains steady
Pricing remains competitive
Utilisation levels steadily increasing
Bentec Tendering activity continues in a very competitive and difficult market
Offshore Services Activity remains steady with some reactivation discussions
RDS
New Greenfield and Brownfield tendering opportunities but very slow conversion rates
Greater investment in the industry required to provide meaningful uptick
Targeting diversification in the FPSO, Subsea, Wind and Decommissioning sectors
• Recent decline in oil price and continued volatility driven by concerns around a global
slowdown with continued uncertainty
• A very challenging landscape where our customers continue to maintain a low pricing
environment coupled with ongoing local cost pressures
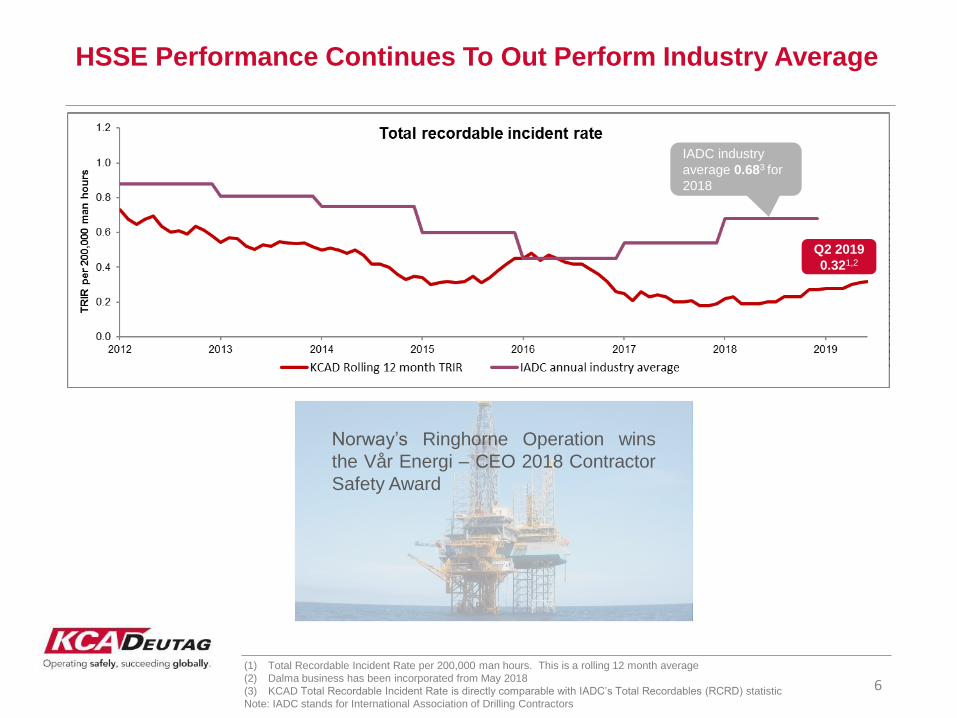
HSSE Performance Continues To Out Perform Industry Average
6
(1) Total Recordable Incident Rate per 200,000 man hours. This is a rolling 12 month average
(2) Dalma business has been incorporated from May 2018
(3) KCAD Total Recordable Incident Rate is directly comparable with IADC’s Total Recordables (RCRD) statistic
Note: IADC stands for International Association of Drilling Contractors
Q2 2019
0.321,2
IADC industry
average 0.683 for
2018
Norway’s Ringhorne Operation wins
the Vår Energi – CEO 2018 Contractor
Safety Award
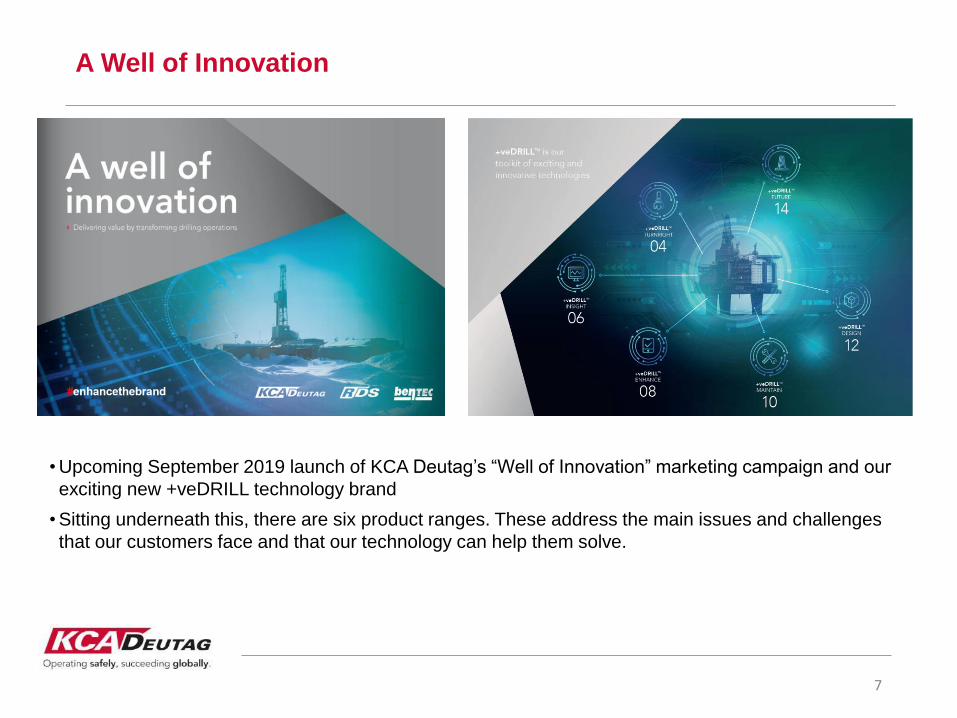
A Well of Innovation
7
• Upcoming September 2019 launch of KCA Deutag’s “Well of Innovation” marketing campaign and our
exciting new +veDRILL technology brand
• Sitting underneath this, there are six product ranges. These address the main issues and challenges
that our customers face and that our technology can help them solve.
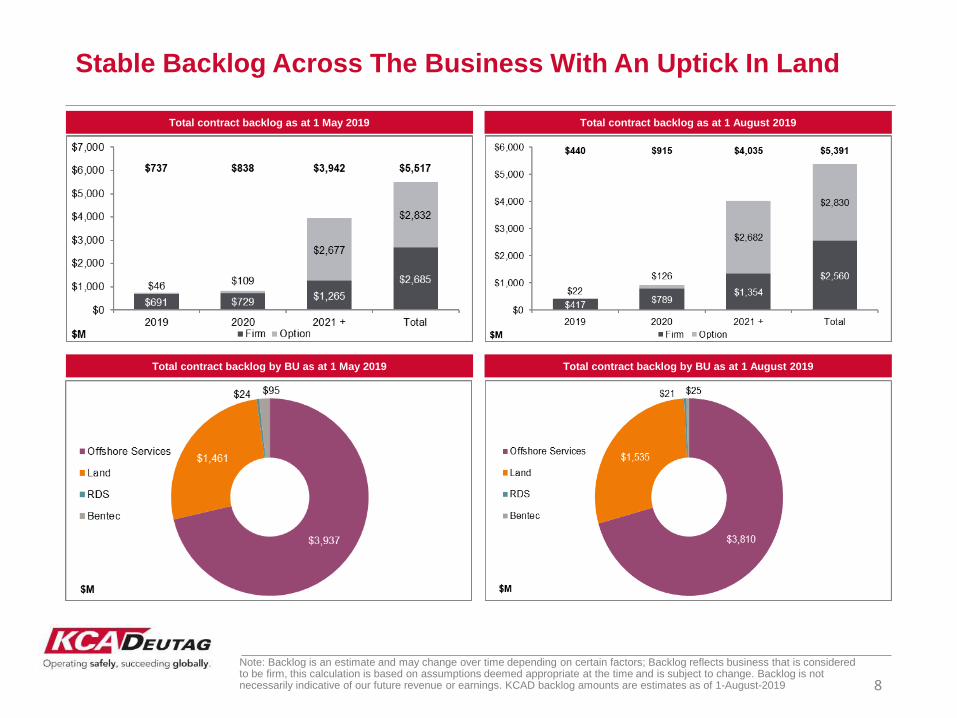
Stable Backlog Across The Business With An Uptick In Land
Note: Backlog is an estimate and may change over time depending on certain factors; Backlog reflects business that is considered to be firm, this calculation is based on assumptions deemed appropriate at the time and is subject to change. Backlog is not necessarily indicative of our future revenue or earnings. KCAD backlog amounts are estimates as of 1-August-2019 8
Total contract backlog as at 1 August 2019
Total contract backlog by BU as at 1 August 2019
Total contract backlog as at 1 May 2019
Total contract backlog by BU as at 1 May 2019

Long Term Offshore Services Contract Backlog(1)
9
(1) Contract and rig status shown as at 1 August 2019
Firm
Options
Not Disclosed
Contract Platform
Client Country Assets Q1 Q2 Q3 Q4 Q1 Q2 Q3 Q4 Q1 Q2 Q3 Q4 end date status #
Exxon Canada Hebron Mar-46 Operating 1
Equinor (Statoil) Norway CAT J (2) May-36 Operating 2
Equinor (Statoil) Norway Oseberg's (4) & Kvitebjorn Oct-28 Operating / Stacked 3/2
AIOC Azerbaijan Azeris, SD, DWG, Cop & Chirag Apr-26 Operating 7
Vår Energi Norway Ringhorne Dec-25 Operating 1
Enquest UK Thistle, Heather & Magnus Dec-25 Operating / Stacked 1/2
CNOOC UK Scott Feb-25 Operating 1
Exxon Angola Kizomba (2) Jan-24 Stacked 2
Total UK Alwyn / Dunbar May-23 Operating / Stacked 1/1
Chrysaor (COP) UK Britannia Nov-22 Stacked 1
Equinor (Statoil) Norway Pipe pool management Nov-22 Active mgmt. contract
CNR UK Ninian's (2) Tiffany Nov-21 Operating / Stacked 1/2
SEIC Russia LA, PA & PB May-21 Operating 3
2019 2020 2021
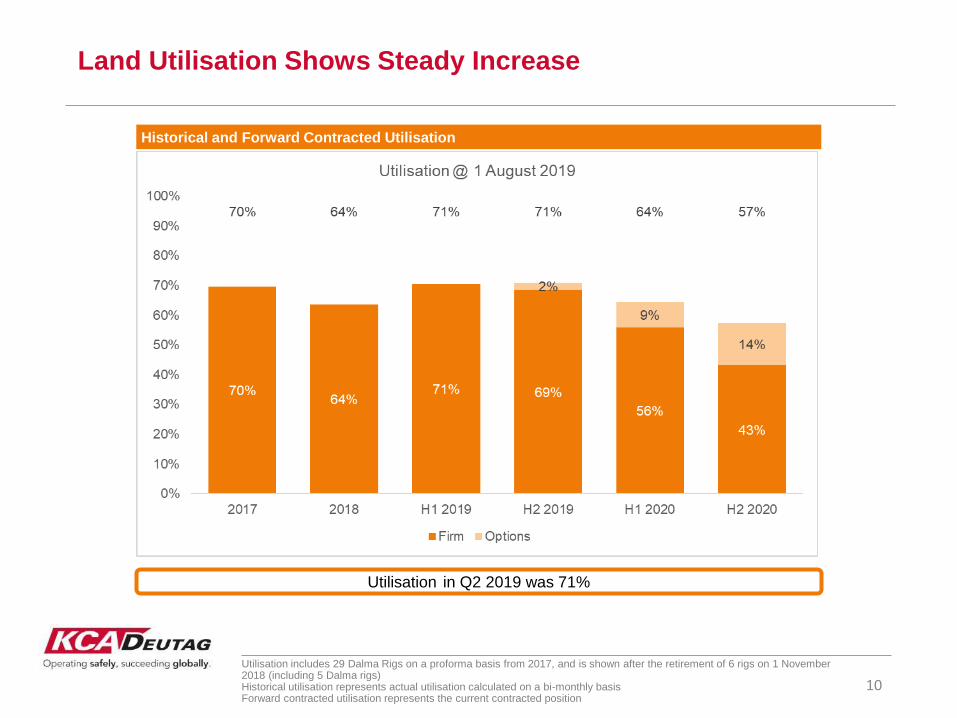
Utilisation includes 29 Dalma Rigs on a proforma basis from 2017, and is shown after the retirement of 6 rigs on 1 November 2018 (including 5 Dalma rigs)Historical utilisation represents actual utilisation calculated on a bi-monthly basisForward contracted utilisation represents the current contracted position
Land Utilisation Shows Steady Increase
10
Historical and Forward Contracted Utilisation
Utilisation in Q2 2019 was 71%
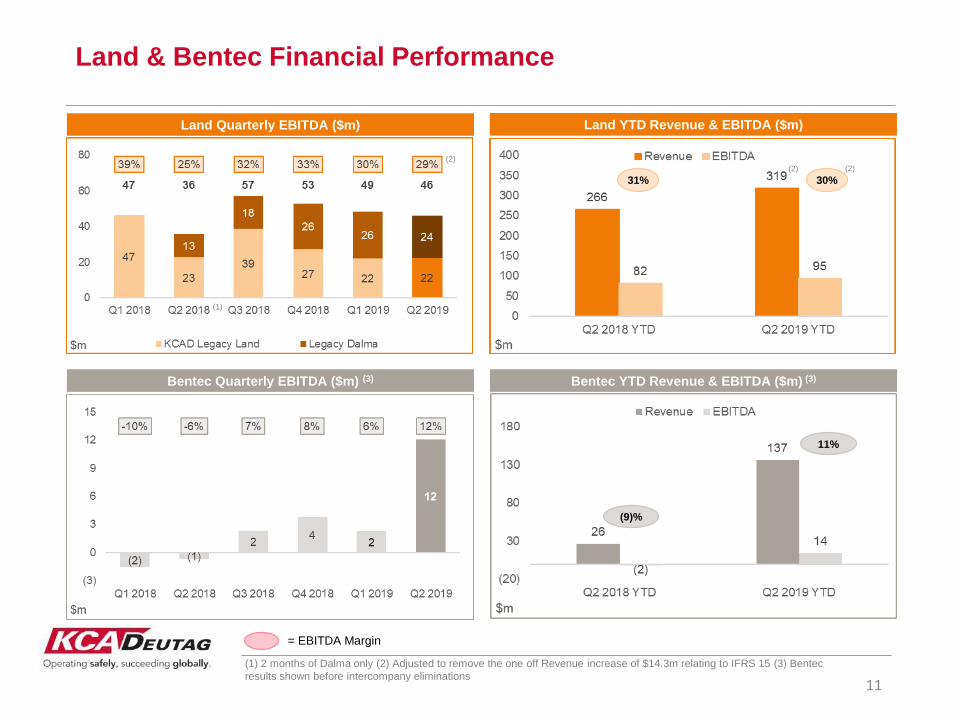
(1) 2 months of Dalma only (2) Adjusted to remove the one off Revenue increase of $14.3m relating to IFRS 15 (3) Bentec
results shown before intercompany eliminations11
Land & Bentec Financial Performance
Land Quarterly EBITDA ($m)
Bentec Quarterly EBITDA ($m) (3)
= EBITDA Margin
Land YTD Revenue & EBITDA ($m)
Bentec YTD Revenue & EBITDA ($m) (3)
31% 30%
(9)%
(1)
11%
(2)
(2)(2)
12
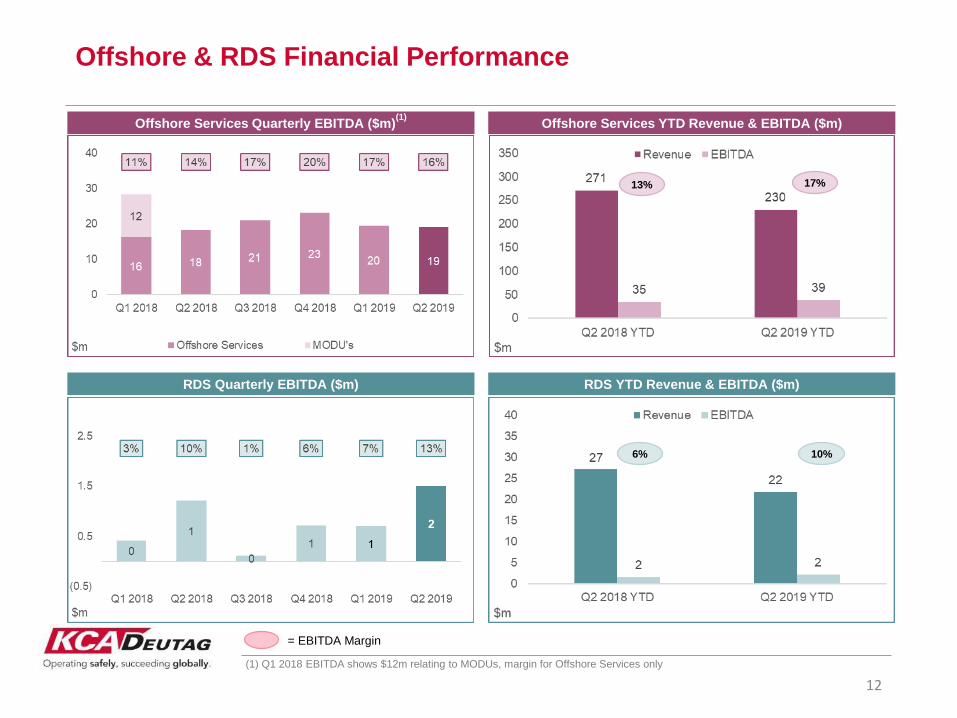
Offshore & RDS Financial Performance
Offshore Services Quarterly EBITDA ($m)(1)
RDS Quarterly EBITDA ($m)
(1) Q1 2018 EBITDA shows $12m relating to MODUs, margin for Offshore Services only
Offshore Services YTD Revenue & EBITDA ($m)
RDS YTD Revenue & EBITDA ($m)
13% 17%
6% 10%
= EBITDA Margin
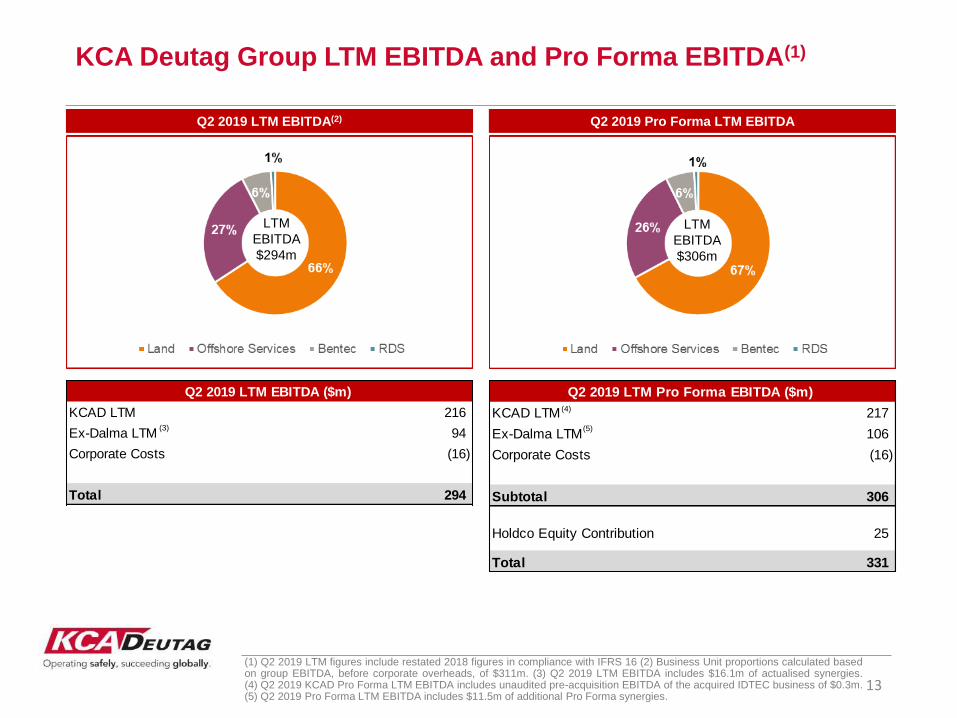
KCAD LTM 216
Ex-Dalma LTM 94
Corporate Costs (16)
Total 294
Q2 2019 LTM EBITDA ($m)
KCAD LTM 217
Ex-Dalma LTM 106
Corporate Costs (16)
Subtotal 306
Holdco Equity Contribution 25
Total 331
Q2 2019 LTM Pro Forma EBITDA ($m)
KCA Deutag Group LTM EBITDA and Pro Forma EBITDA(1)
13
Q2 2019 LTM EBITDA(2)
LTM
EBITDA
$294m
Q2 2019 Pro Forma LTM EBITDA
LTM
EBITDA
$306m
(1) Q2 2019 LTM figures include restated 2018 figures in compliance with IFRS 16 (2) Business Unit proportions calculated basedon group EBITDA, before corporate overheads, of $311m. (3) Q2 2019 LTM EBITDA includes $16.1m of actualised synergies.(4) Q2 2019 KCAD Pro Forma LTM EBITDA includes unaudited pre-acquisition EBITDA of the acquired IDTEC business of $0.3m.(5) Q2 2019 Pro Forma LTM EBITDA includes $11.5m of additional Pro Forma synergies.
(3)
(4)
(5)

Q2 2019 Q1 2019 Q2 2018 2019 YTD 2018 YTD
$'m $'m $'m $'m $'m
Cash generated from operations 102.1 26.0 14.9 128.1 80.5
Tax paid (6.4) (12.5) (9.7) (18.9) (17.8)
Cash flow from operating activities 95.7 13.5 5.2 109.2 62.7
Capital expenditure (13.0) (18.2) (12.4) (31.2) (21.8)
Acquisition of Holdco rig 0.0 (25.0) 0.0 (25.0) 0.0
Proceeds from sale of Fixed Assets 0.0 0.1 (0.1) 0.1 0.7
Interest received 6.5 6.6 5.7 13.1 11.7
Dalma acquistion 0.0 0.0 (440.2) 0.0 (440.2)
Other (0.1) 0.4 0.0 0.3 0.0
Cash flow from investing activities (6.6) (36.1) (447.0) (42.7) (449.6)
Interest paid (83.8) (18.8) (62.8) (102.6) (76.7)
Foreign exchange 0.6 0.2 (3.5) 0.8 (7.9)
Dividend paid to minority shareholders (0.2) (0.3) 0.0 (0.5) (0.3)
Lease payments (3.6) (5.8) (5.5) (9.4) (9.6)
2.1 (47.3) (513.6) (45.2) (481.4)
(19.3) (5.4) 432.1 (24.7) 426.8
Increase in loan from parent company 0.0 25.0 0.0 25.0 0.0
Net cash flow (17.2) (27.7) (81.5) (44.9) (54.6)
Net Cash flow before debt
drawdown/(repayment)
Drawdown/(repayment) of debt and debt
redemption/issuance costs
Cash Flow and Working Capital
14
9
9
(1) 2018 results restated in compliance with IFRS 16 (2) Denotes the effect of foreign exchange rate changes on
cash and bank overdrafts (3) Deltas denote quarterly working capital movement
(2)
Free Cash Flow (1) Working Capital (3)

Amount Utilised Coupon Maturity Facility Rating Leverage
Revolver Cash ($215m) 168 L+400 Mar-22 Caa1/B- 0.51x
Senior Secured Term Loan 411 L+675 Feb-23 Caa1/B- 1.24x
Oman Term Loan 24 L+400 Dec-20 - 0.07x
Total Bank Debt 603 1.82x
Senior Secured Notes 2021 375 7.250% May-21 Caa1/B- 1.13x
Senior Secured Notes 2022 535 9.875% Apr-22 Caa1/B- 1.62x
Senior Secured Notes 2023 400 9.625% Apr-23 Caa1/B- 1.21x
Total Institutional Debt 1,913 5.78x
Other debt 6
Gross Debt 1,920 5.80x
Cash 147 0.44x
Net Debt 1,773 5.36x
Finance lease liabilites 59 0.18x
Net Debt per balance sheet 1,832 5.54x
Capital Structure
15
Net leverage as at 30 June 2019
(1) PF LTM EBITDA adjusted for unaudited LTM EBITDA of the acquired IDTEC business of $0.3m and synergies of the acquired
Dalma businesses of $11.5m. (2) Q1 & Q2 2019 LTM EBITDA includes the second $25m Holdco equity contribution, as defined in the
Amended Credit Agreement. (3) In addition to the $215m Revolver Cash facility, we also have $115m of guarantee facilities
Net Debt Evolution
306
(1)
(3)
(2)
(3)
295
2525
(2)

Closing Remarks
16
• Bentec successfully delivered the final 3 rigs for our customer in Ukraine
• Land Drilling awarded a number of new contracts in the Middle East, Russia, Europe and Africa
• Q2 2019 revenue of $395.1m and EBITDA of $74.4m
• Contract backlog of $5.4bn (at 1 August 2019) across a blue chip customer base
• Significant progress made on our technology initiative, Well of Innovation, with launch in
September
• Operational integration of the forma Dalma business now complete with synergies of $27.6m
identified and 89% of these already secured

Integration of Dalma Energy LLC
18
Target synergies ($28m EBITDA & $3m capex)
EBITDA synergies by type
Integration plan complete
• Expectation of run rate EBITDA synergies increased slightly
from $27.4m (Q1 2019) to $27.6m (Q2 2019)
• Synergy target more than double original estimate of c.$11m
• Capex synergies increased from $2m to $3m
• Monthly run rate achievement in June 2019 of $2.0m, being
89%1 of total savings identified
• Close to full run rate synergy realisation
• Small additional supply chain synergies identified in both
Oman and Saudi Arabia(1)
(1) Run rate synergy achievement based on 30 June 2019 actual achievement