Embed Size (px)
Citation preview

1July 2018
Investor PresentationJuly 2018
2July 2018
Disclaimer
• Presentation includes forward looking statements about events and financial results
• Actual events or results may be materially different
• Risks are described in the company’s filings with the SEC
• Statements are made subject to “safe harbor” provisions of Private Securities Reform Act of 1995
• Full disclaimer and reconciliation of Non-GAAP financial measures to GAAP measures are at the end of this presentation
Presentation is subject to safe harbor laws
3July 2018
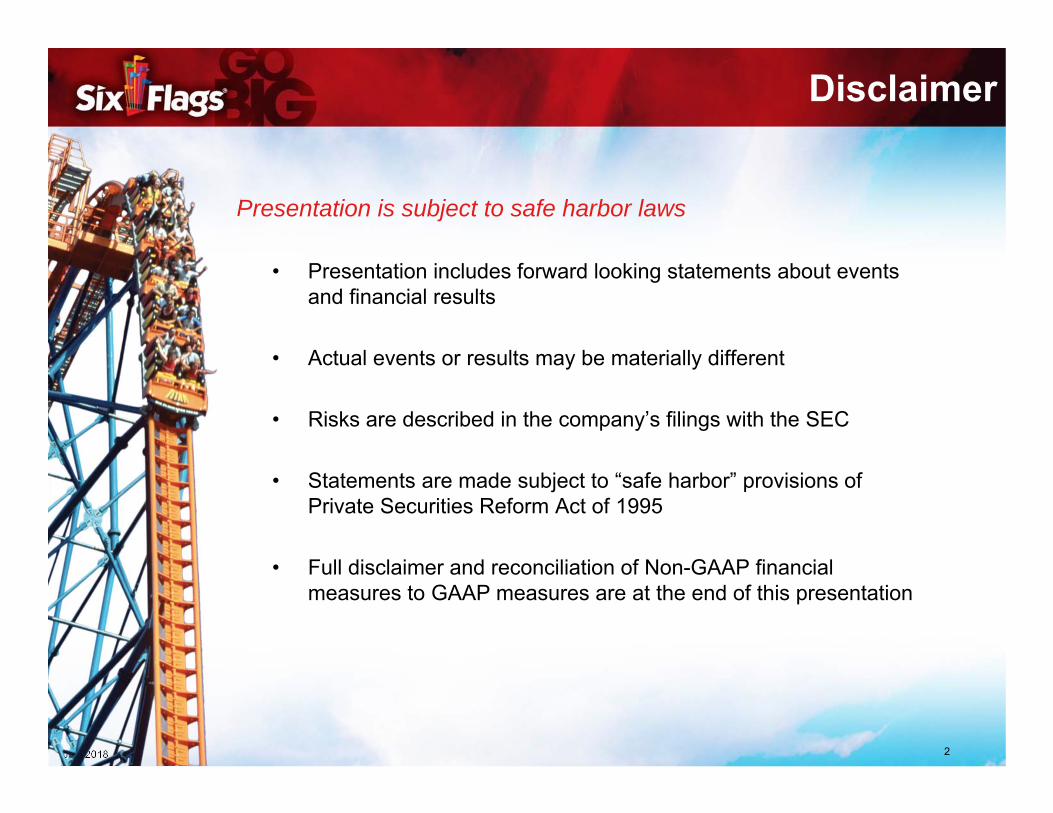
223
323379
416444
477520 545 558 579
750
2009 2010 2011 2012 2013 2014 2015 2016 2017 2018Q2
LTM
2020Project
750
Adjusted EBITDA Modified EBITDA
Overview of Six Flags
• Exceptional brand & business foundation
• Substantial growth opportunitieso Base businesso International licensing
• Strong, recurring cash flowo Industry-leading EBITDA and
EBITDA less CAPEX marginso Efficient CAPEX
• Excellent Growth and Yield stocko ~10% Mod. EBITDA CAGR
through 2020 o ~5% Dividend yield (>2x S&P 500)
(1) Excludes SFKK as discontinued operation(2) 2009 Modified EBITDA calculation includes revenue from Six Flags Great Escape Lodge and Indoor Water Park so it is consistent with future periods(3) Project 750 is an aspirational goal set by the company in October 2016 to achieve $750MM of Modified EBITDA by calendar year 2020
Ongoing Growth Opportunity
(1)(2)
$MM $MM
(3)
Global leader in an attractive industry
4July 2018
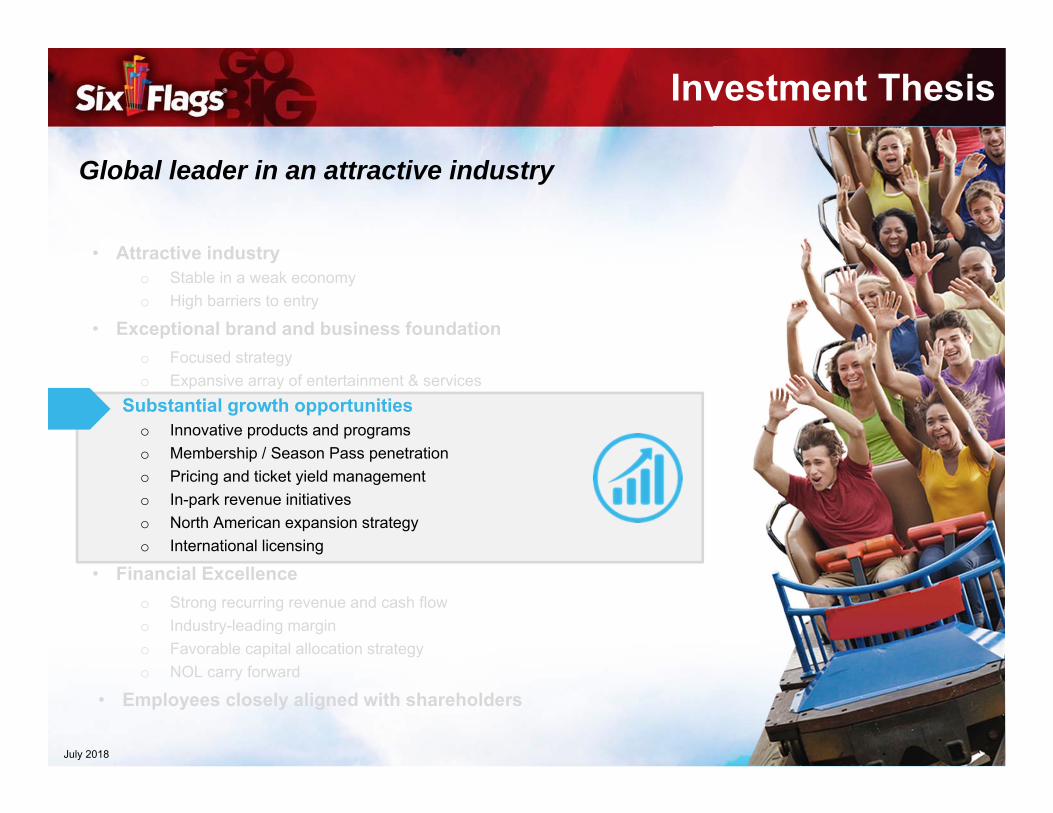
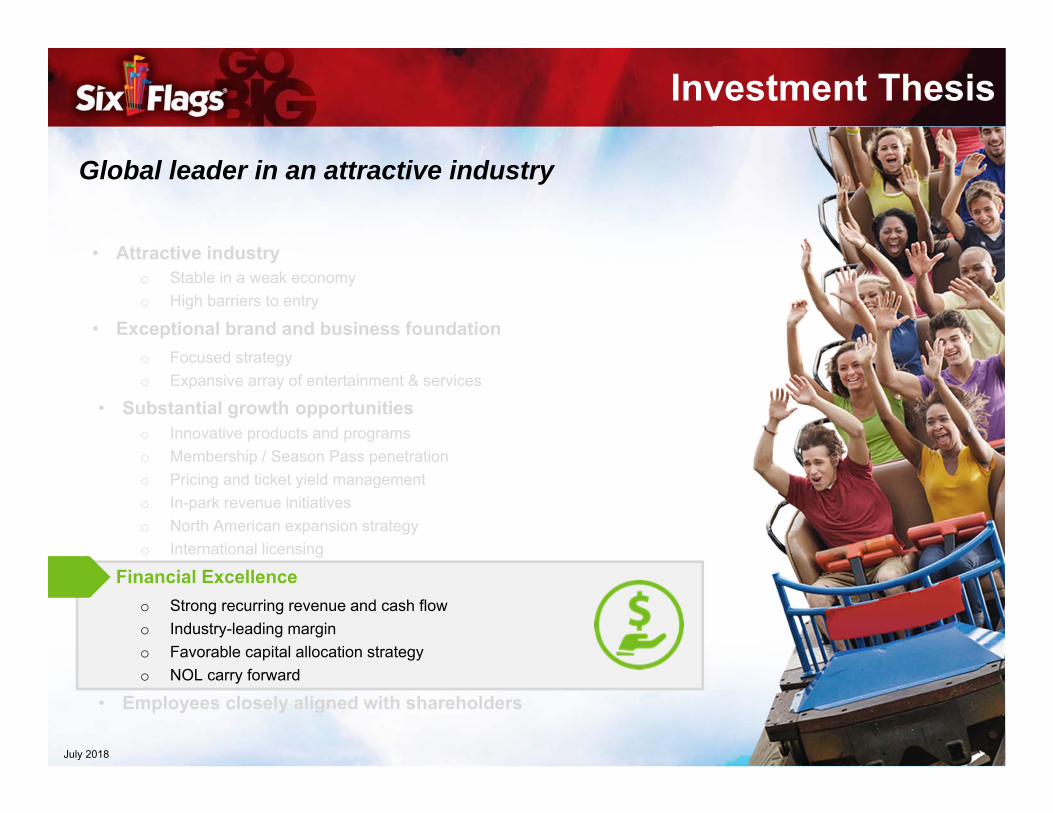
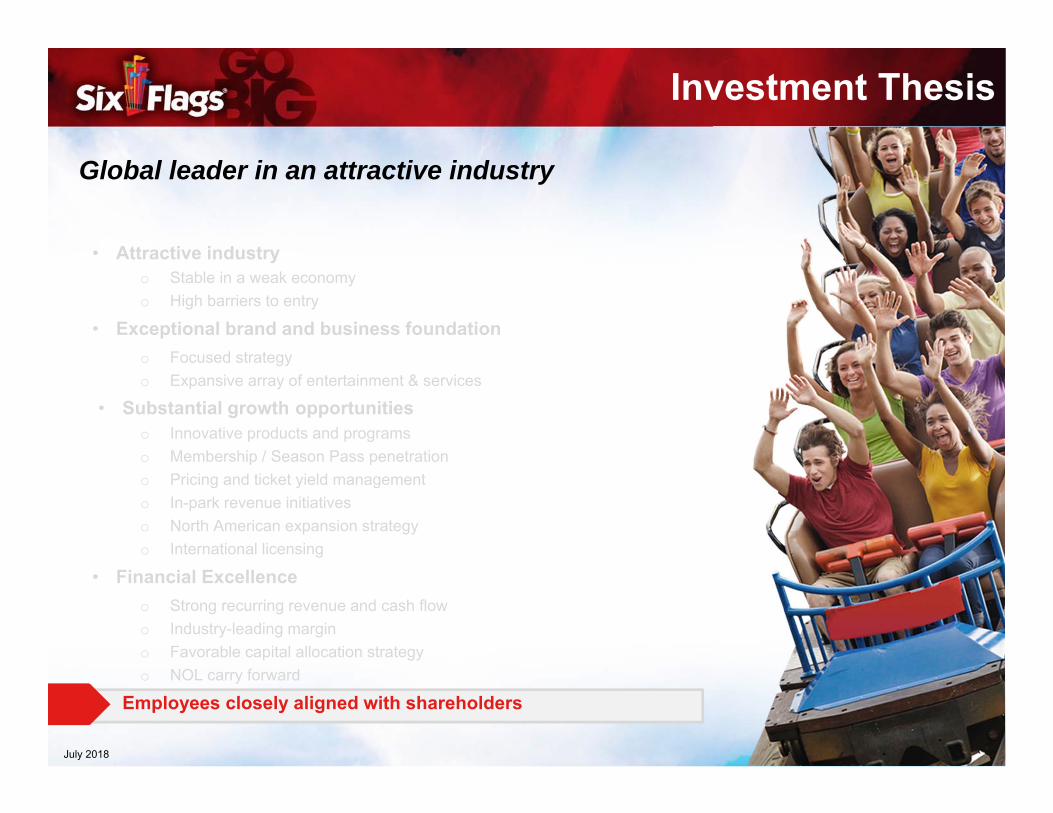
Investment Thesis
• Attractive industryo Stable in a weak economyo High barriers to entry
• Exceptional brand and business foundationo Focused strategyo Expansive array of entertainment & services
• Substantial growth opportunitieso Innovative products and programso Membership / Season Pass penetrationo Pricing and ticket yield managemento In-park revenue initiativeso North American expansion strategyo International licensing
• Financial Excellenceo Strong recurring revenue and cash flowo Industry-leading margino Favorable capital allocation strategyo NOL carry forward
• Employees closely aligned with shareholders
Global leader in an attractive industry
5July 2018
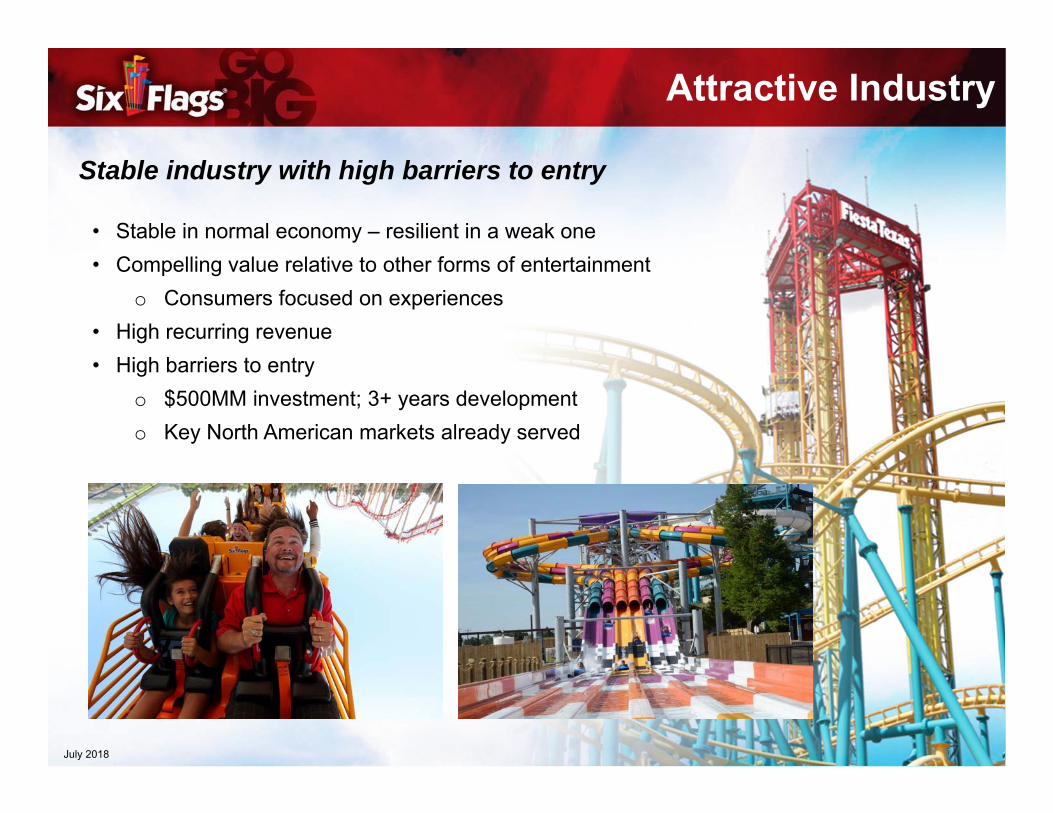
Attractive Industry
• Stable in normal economy – resilient in a weak one• Compelling value relative to other forms of entertainment
o Consumers focused on experiences• High recurring revenue• High barriers to entry
o $500MM investment; 3+ years developmento Key North American markets already served
Stable industry with high barriers to entry
6July 2018
Investment Thesis
Global leader in an attractive industry
• Attractive industryo Stable in a weak economyo High barriers to entry
• Exceptional brand and business foundationo Focused strategyo Expansive array of entertainment & services
• Substantial growth opportunitieso Innovative products and programso Membership / Season Pass penetrationo Pricing and ticket yield managemento In-park revenue initiativeso North American expansion strategyo International licensing
• Financial Excellenceo Strong recurring revenue and cash flowo Industry-leading margino Favorable capital allocation strategyo NOL carry forward
• Employees closely aligned with shareholders
7July 2018
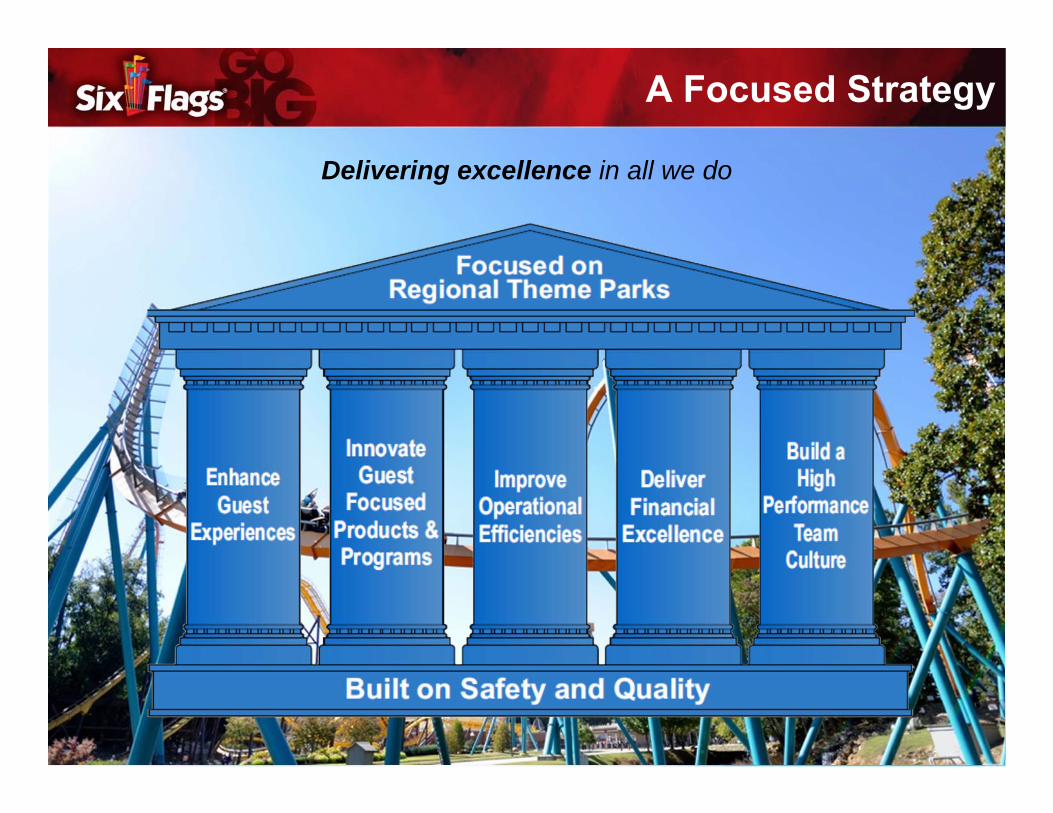
A Focused Strategy
Delivering excellence in all we do
8July 2018
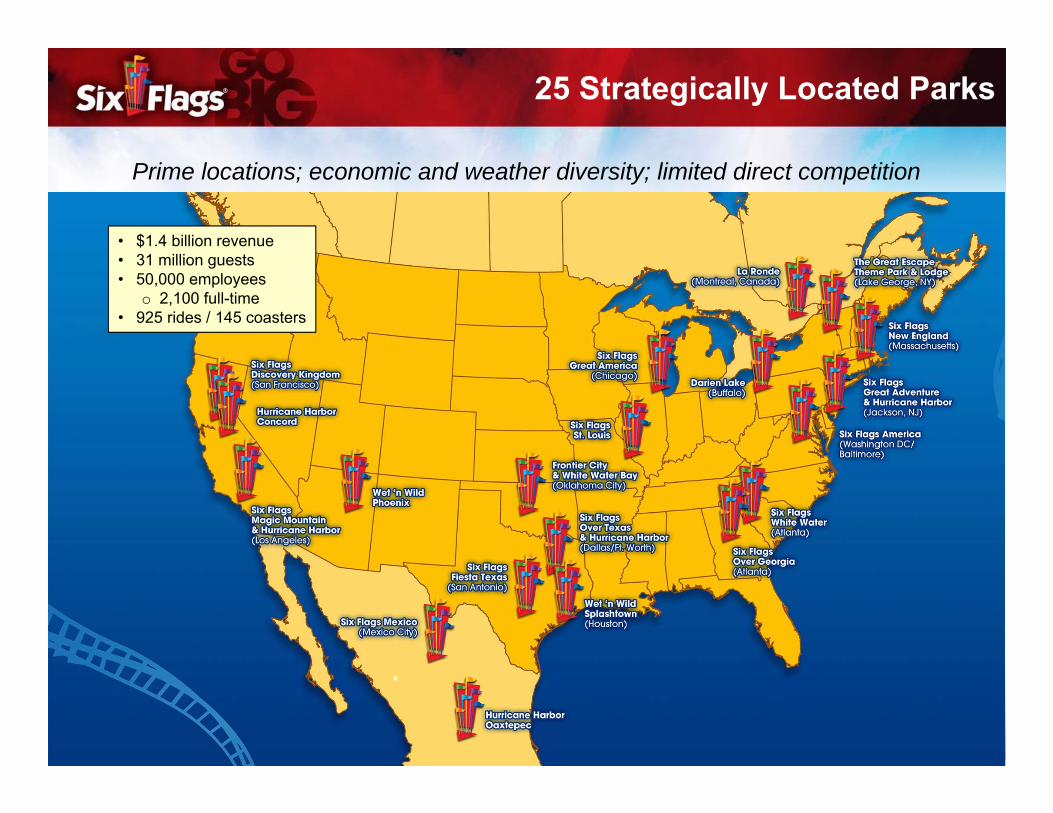
25 Strategically Located Parks
Prime locations; economic and weather diversity; limited direct competition
*
• $1.4 billion revenue• 31 million guests• 50,000 employees
o 2,100 full-time• 925 rides / 145 coasters

9July 2018
Home to many of the top coasters and rides
Top Rated Rides
USA Today Best New Attraction World’s tallest, fastest roller coaster41 story drop at 91 miles per hour
Industry’s Best New Attraction 2015Immersive interactive ride
World’s First 4D Free Fly CoasterFlip head over heels
World’s Tallest Swing Carousel Ride400 ft. aerial swing ride
World’s tallest and steepest wooden coaster

10July 2018
AnimalsFamily Coasters
Waterparks
More than coasters… we provide thrills and entertainment for all ages
Expansive Array of Entertainment
Games Concerts & Shows
Events
11July 2018
Global leader in an attractive industry
• Attractive industryo Stable in a weak economyo High barriers to entry
• Exceptional brand and business foundationo Focused strategyo Expansive array of entertainment & services
• Substantial growth opportunitieso Innovative products and programso Membership / Season Pass penetrationo Pricing and ticket yield managemento In-park revenue initiativeso North American expansion strategyo International licensing
• Financial Excellenceo Strong recurring revenue and cash flowo Industry-leading margino Favorable capital allocation strategyo NOL carry forward
• Employees closely aligned with shareholders
Investment Thesis
12July 2018
913976
1,0131,070
1,1101,176
1,2641,319
1,3591,412
2009 2010 2011 2012 2013 2014 2015 2016 2017 2018Q2
LTM
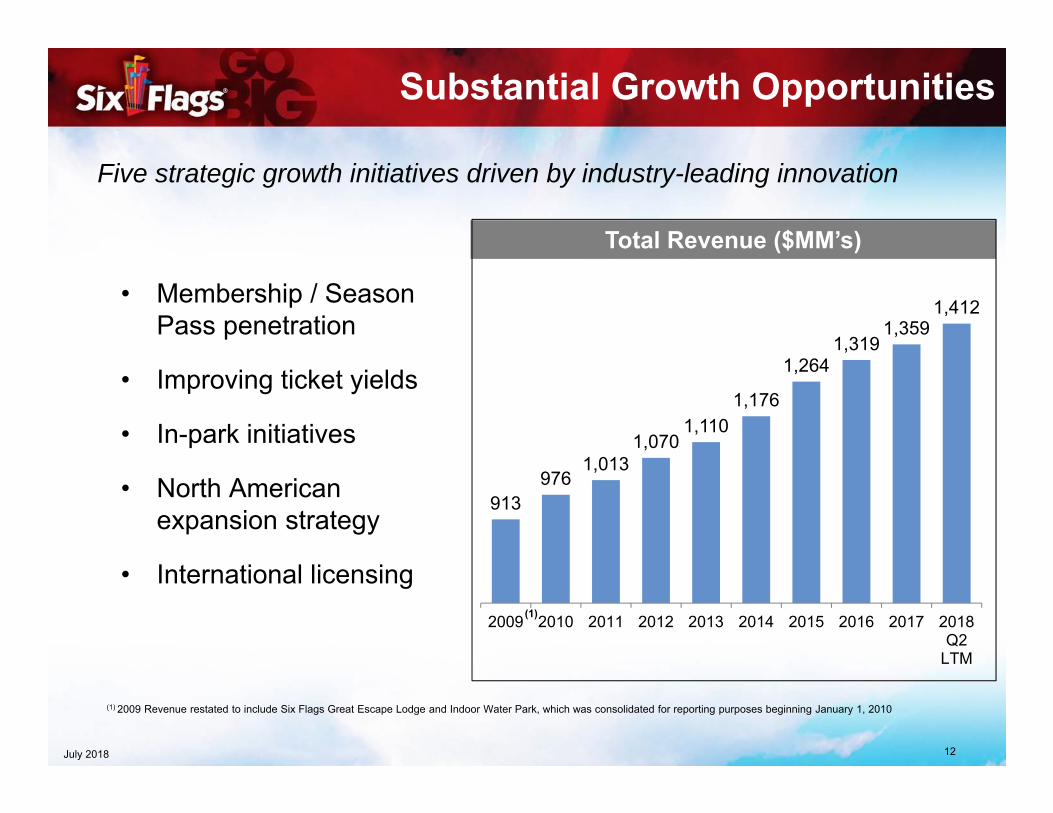
Substantial Growth Opportunities
Five strategic growth initiatives driven by industry-leading innovation
Total Revenue ($MM’s)
(1) 2009 Revenue restated to include Six Flags Great Escape Lodge and Indoor Water Park, which was consolidated for reporting purposes beginning January 1, 2010
(1)
• Membership / Season Pass penetration
• Improving ticket yields
• In-park initiatives
• North American expansion strategy
• International licensing
13July 2018
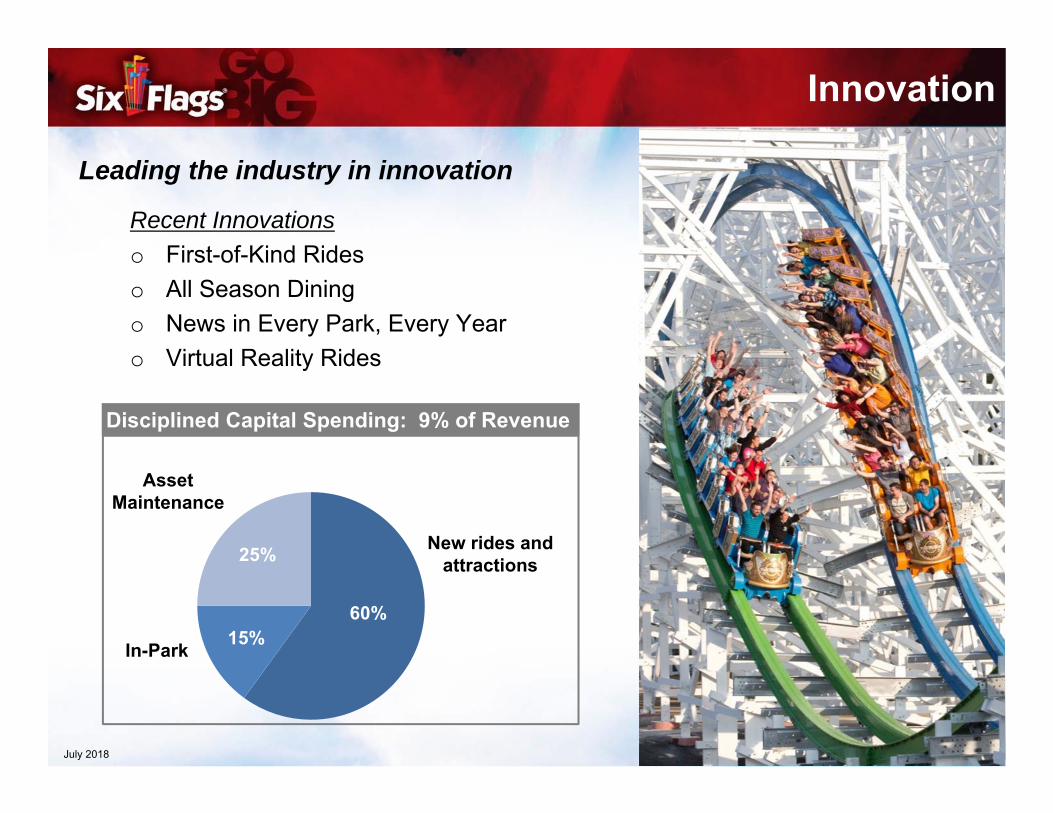
Disciplined Capital Spending: 9% of Revenue
60%15%
25% New rides and attractions
AssetMaintenance
In-Park
Innovation
Recent Innovationso First-of-Kind Rideso All Season Diningo News in Every Park, Every Yearo Virtual Reality Rides
Leading the industry in innovation

14July 2018
2018 Ride Innovation
2018 brings something new in every park and5 record-breaking rides
15July 2018
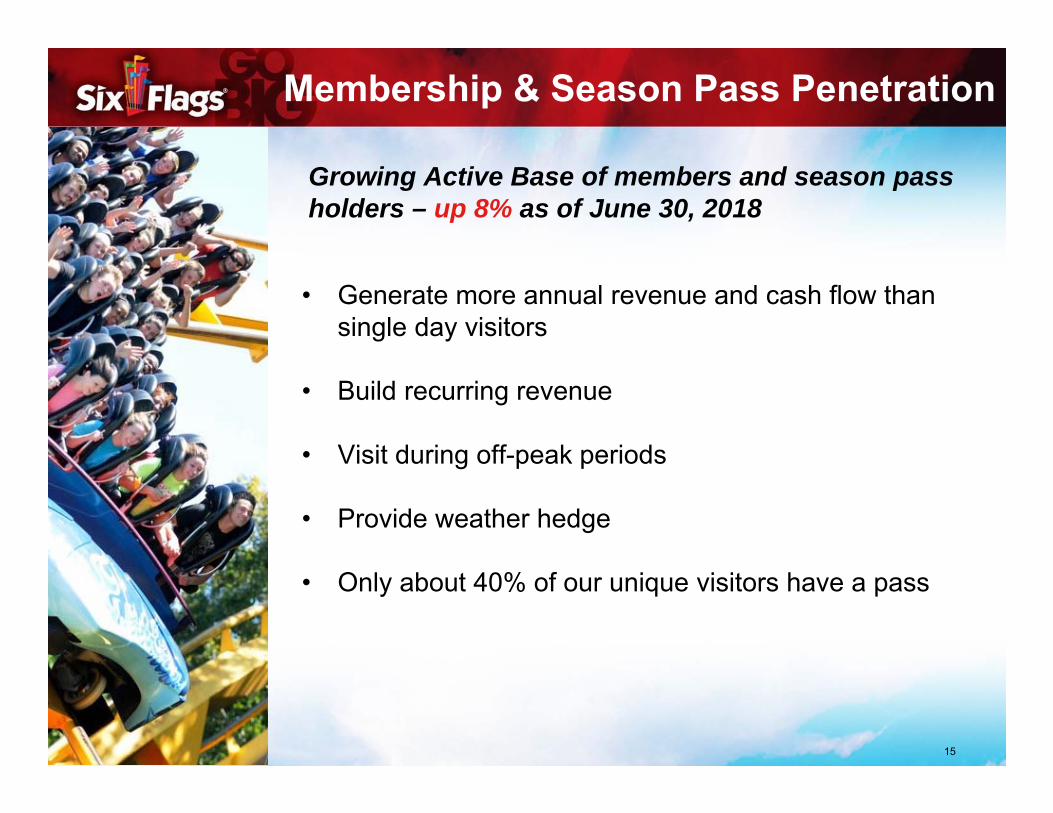
• Generate more annual revenue and cash flow than single day visitors
• Build recurring revenue
• Visit during off-peak periods
• Provide weather hedge
• Only about 40% of our unique visitors have a pass
Growing Active Base of members and season pass holders – up 8% as of June 30, 2018
Membership & Season Pass Penetration
16July 2018
Premium-tiered Membership Program
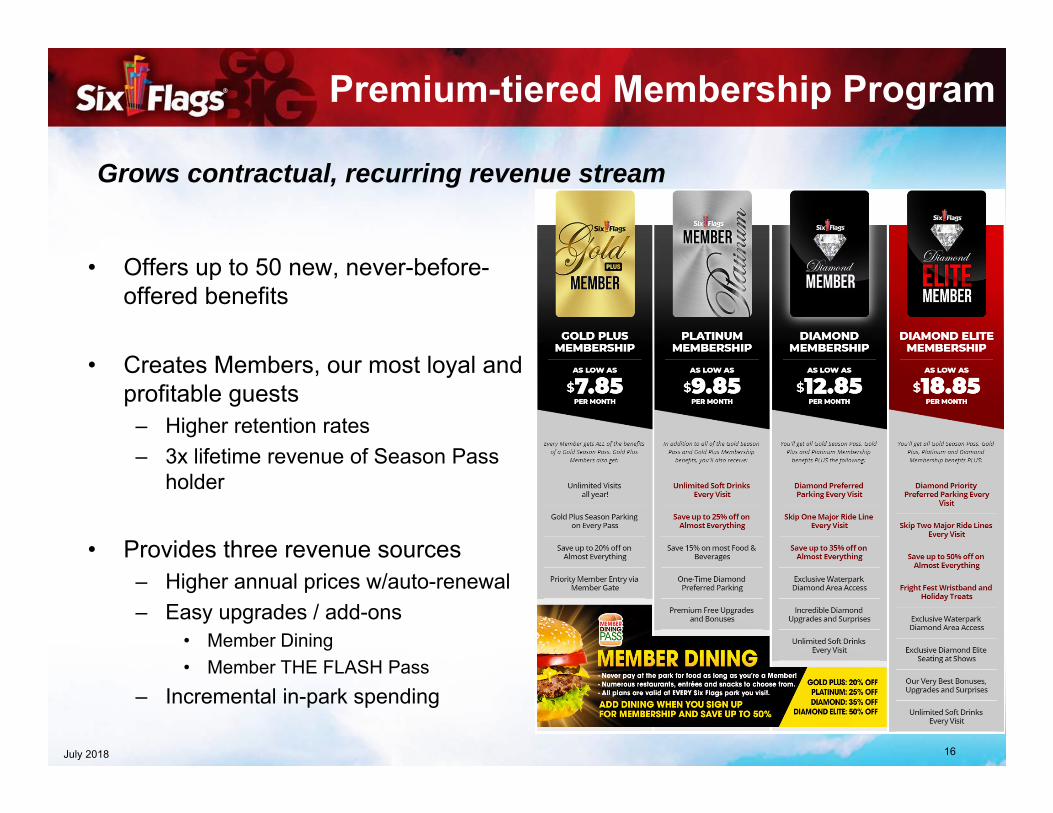
• Offers up to 50 new, never-before-offered benefits
• Creates Members, our most loyal and profitable guests
– Higher retention rates– 3x lifetime revenue of Season Pass
holder
• Provides three revenue sources– Higher annual prices w/auto-renewal– Easy upgrades / add-ons
• Member Dining• Member THE FLASH Pass
– Incremental in-park spending
Grows contractual, recurring revenue stream
17July 2018
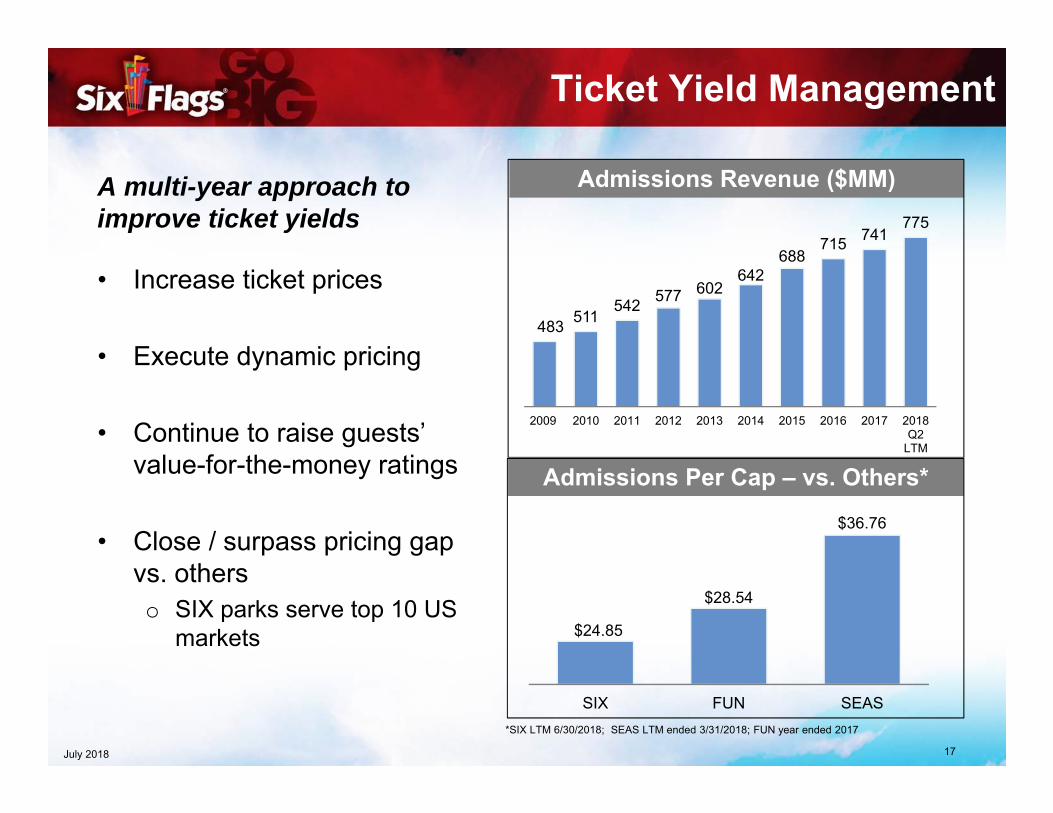
$24.85
$28.54
$36.76
SIX FUN SEAS
Ticket Yield Management
• Increase ticket prices
• Execute dynamic pricing
• Continue to raise guests’ value-for-the-money ratings
• Close / surpass pricing gap vs. otherso SIX parks serve top 10 US
markets
A multi-year approach to improve ticket yields
483 511542 577 602
642688
715 741775
2009 2010 2011 2012 2013 2014 2015 2016 2017 2018Q2
LTM
Admissions Revenue ($MM)
Admissions Per Cap – vs. Others*
*SIX LTM 6/30/2018; SEAS LTM ended 3/31/2018; FUN year ended 2017
18July 2018
In-Park Revenue Initiatives
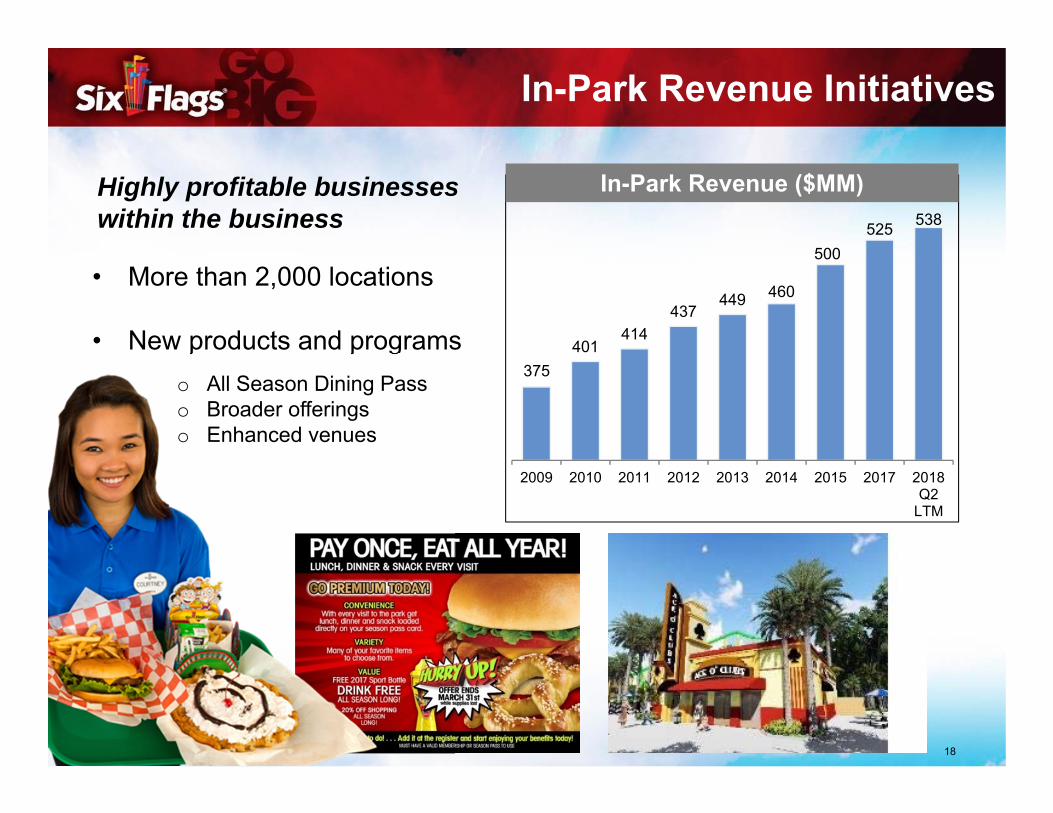
• More than 2,000 locations
• New products and programs
Highly profitable businesses within the business
o All Season Dining Passo Broader offeringso Enhanced venues
375401
414437
449 460
500525 538
2009 2010 2011 2012 2013 2014 2015 2017 2018Q2
LTM
In-Park Revenue ($MM)
19July 2018
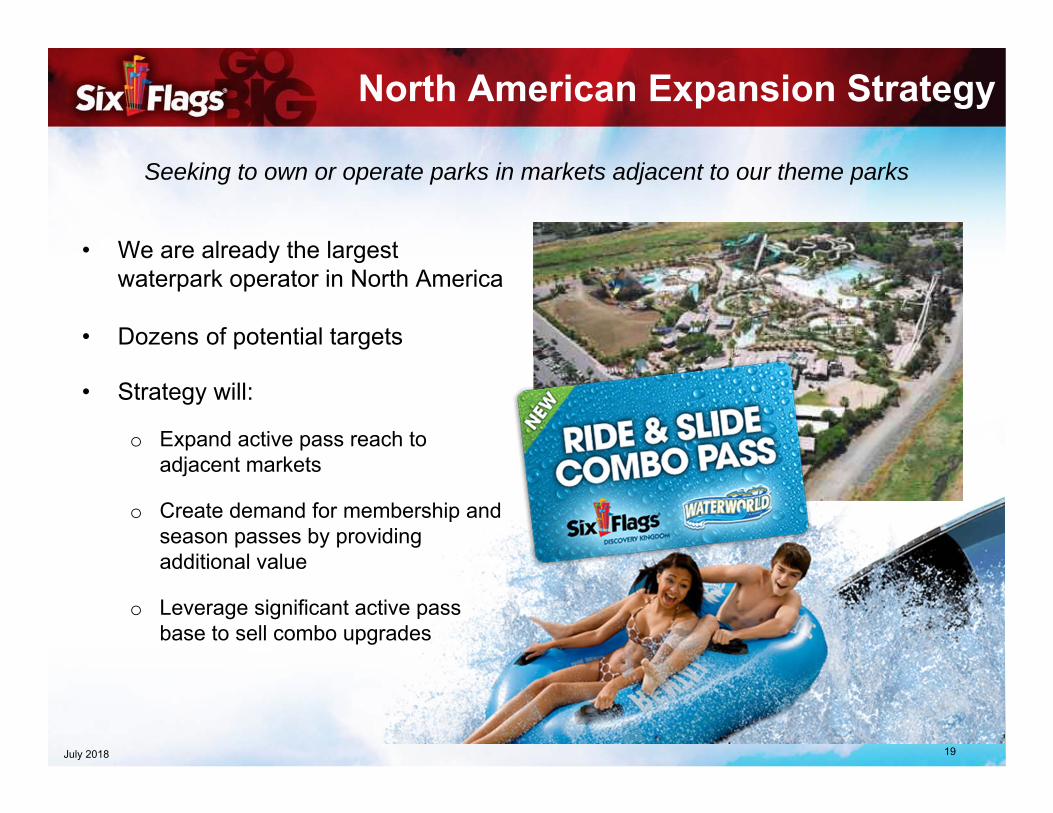
• We are already the largest waterpark operator in North America
• Dozens of potential targets
• Strategy will:
o Expand active pass reach to adjacent markets
o Create demand for membership and season passes by providing additional value
o Leverage significant active pass base to sell combo upgrades
Seeking to own or operate parks in markets adjacent to our theme parks
North American Expansion Strategy
20July 2018
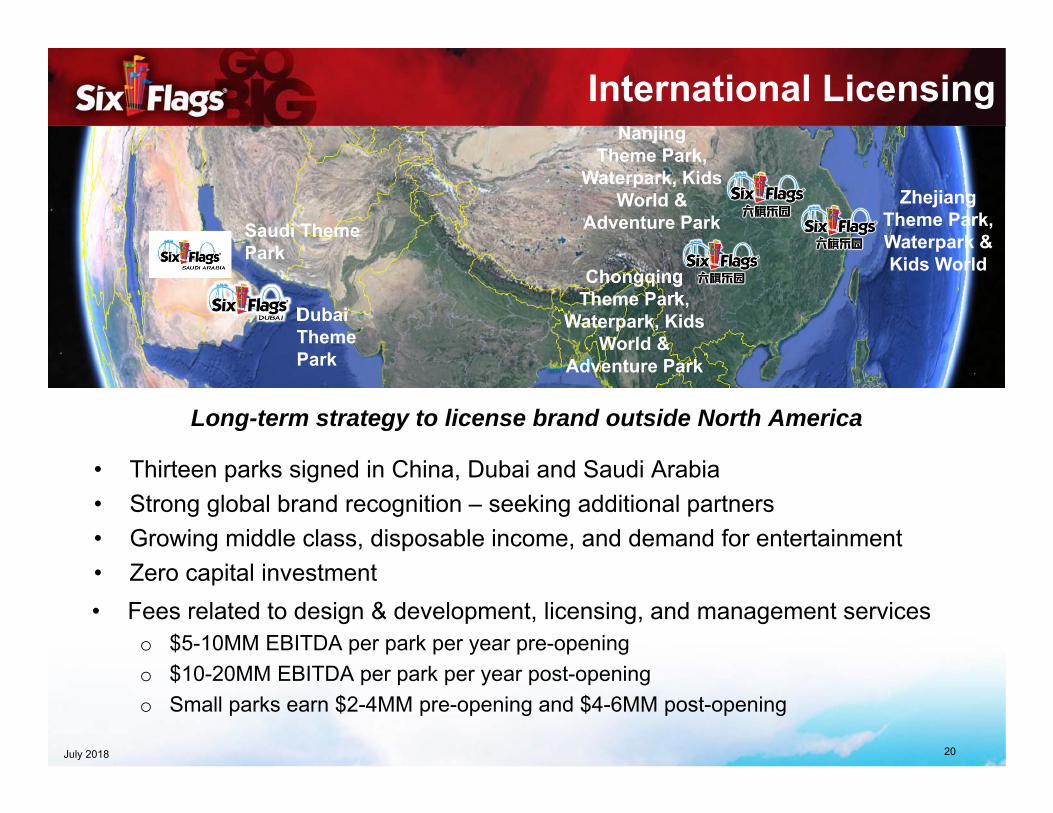
International Licensing
• Thirteen parks signed in China, Dubai and Saudi Arabia • Strong global brand recognition – seeking additional partners• Growing middle class, disposable income, and demand for entertainment• Zero capital investment
Long-term strategy to license brand outside North America
• Fees related to design & development, licensing, and management serviceso $5-10MM EBITDA per park per year pre-openingo $10-20MM EBITDA per park per year post-openingo Small parks earn $2-4MM pre-opening and $4-6MM post-opening
Dubai Theme Park
Zhejiang Theme Park, Waterpark & Kids WorldChongqing
Theme Park, Waterpark, Kids
World &Adventure Park
Saudi Theme Park
Nanjing Theme Park,
Waterpark, Kids World &
Adventure Park
21July 2018
Investment Thesis
Global leader in an attractive industry
• Attractive industryo Stable in a weak economyo High barriers to entry
• Exceptional brand and business foundationo Focused strategyo Expansive array of entertainment & services
• Substantial growth opportunitieso Innovative products and programso Membership / Season Pass penetrationo Pricing and ticket yield managemento In-park revenue initiativeso North American expansion strategyo International licensing
• Financial Excellenceo Strong recurring revenue and cash flowo Industry-leading margino Favorable capital allocation strategyo NOL carry forward
• Employees closely aligned with shareholders
22July 2018
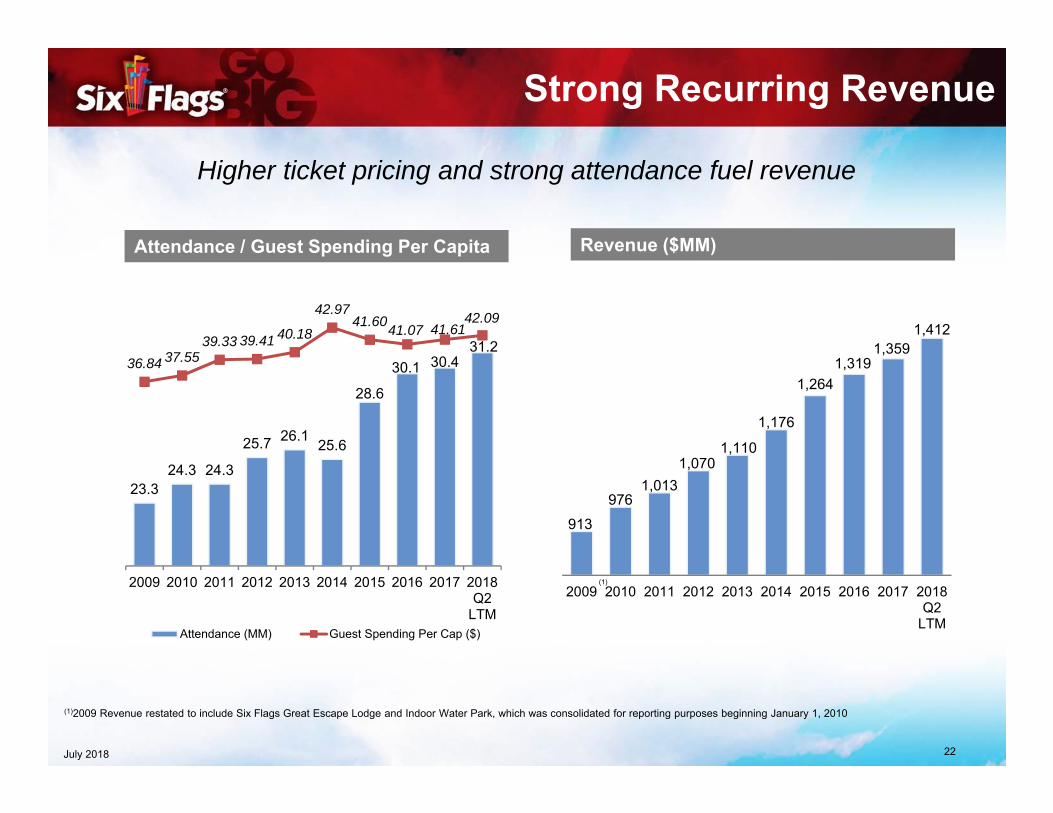
Higher ticket pricing and strong attendance fuel revenue
Strong Recurring Revenue
Revenue ($MM)
(1)
(1)2009 Revenue restated to include Six Flags Great Escape Lodge and Indoor Water Park, which was consolidated for reporting purposes beginning January 1, 2010
913976
1,0131,070
1,110
1,176
1,2641,319
1,3591,412
2009 2010 2011 2012 2013 2014 2015 2016 2017 2018Q2
LTM
(1)
Attendance / Guest Spending Per Capita
23.324.3 24.3
25.7 26.1 25.6
28.6
30.1 30.431.2
36.84 37.5539.33 39.41 40.18
42.9741.6041.07 41.61
42.09
2009 2010 2011 2012 2013 2014 2015 2016 2017 2018Q2
LTMAttendance (MM) Guest Spending Per Cap ($)
23July 2018
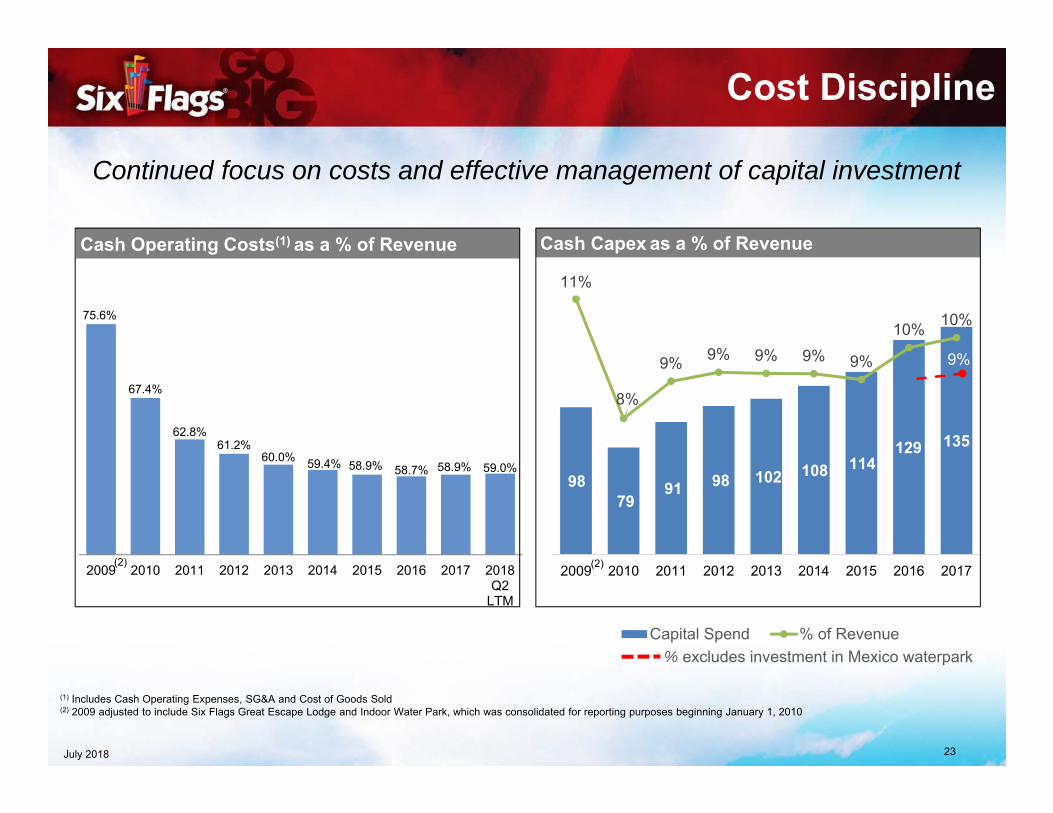
98 79
91 98 102 108 114 129 135
11%
8%
9% 9% 9% 9% 9%
10% 10%
2009 2010 2011 2012 2013 2014 2015 2016 2017
Capital Spend % of Revenue
Cost Discipline
75.6%
67.4%
62.8%61.2%
60.0% 59.4% 58.9% 58.7% 58.9% 59.0%
2009 2010 2011 2012 2013 2014 2015 2016 2017 2018Q2
LTM
Continued focus on costs and effective management of capital investment
Cash Operating Costs(1) as a % of Revenue
(1) Includes Cash Operating Expenses, SG&A and Cost of Goods Sold(2) 2009 adjusted to include Six Flags Great Escape Lodge and Indoor Water Park, which was consolidated for reporting purposes beginning January 1, 2010
(2)
Cash Capex as a % of Revenue
(2)
% excludes investment in Mexico waterpark
9%
24July 2018
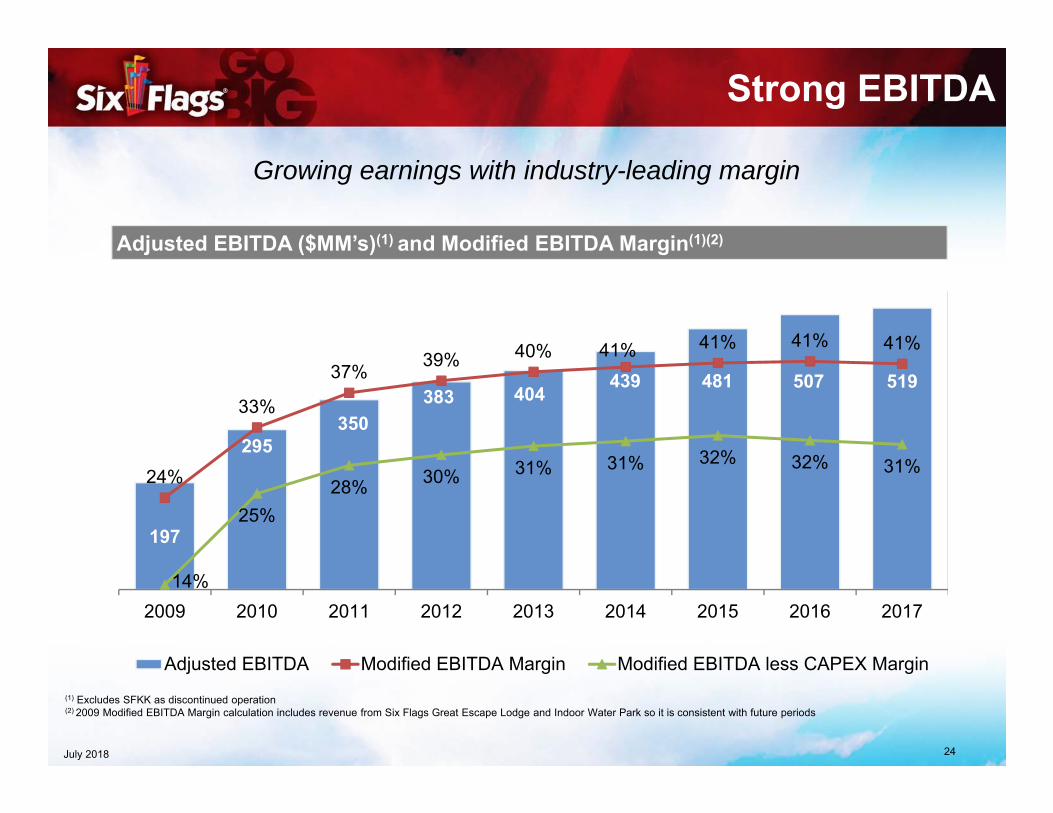
197
295350
383 404 439 481 507 519
24%
33%
37% 39% 40% 41% 41% 41% 41%
14%
25%28% 30% 31% 31% 32% 32% 31%
2009 2010 2011 2012 2013 2014 2015 2016 2017
Adjusted EBITDA Modified EBITDA Margin Modified EBITDA less CAPEX Margin
Strong EBITDA
Growing earnings with industry-leading margin
(1) Excludes SFKK as discontinued operation(2) 2009 Modified EBITDA Margin calculation includes revenue from Six Flags Great Escape Lodge and Indoor Water Park so it is consistent with future periods
Adjusted EBITDA ($MM’s)(1) and Modified EBITDA Margin(1)(2)
25July 2018
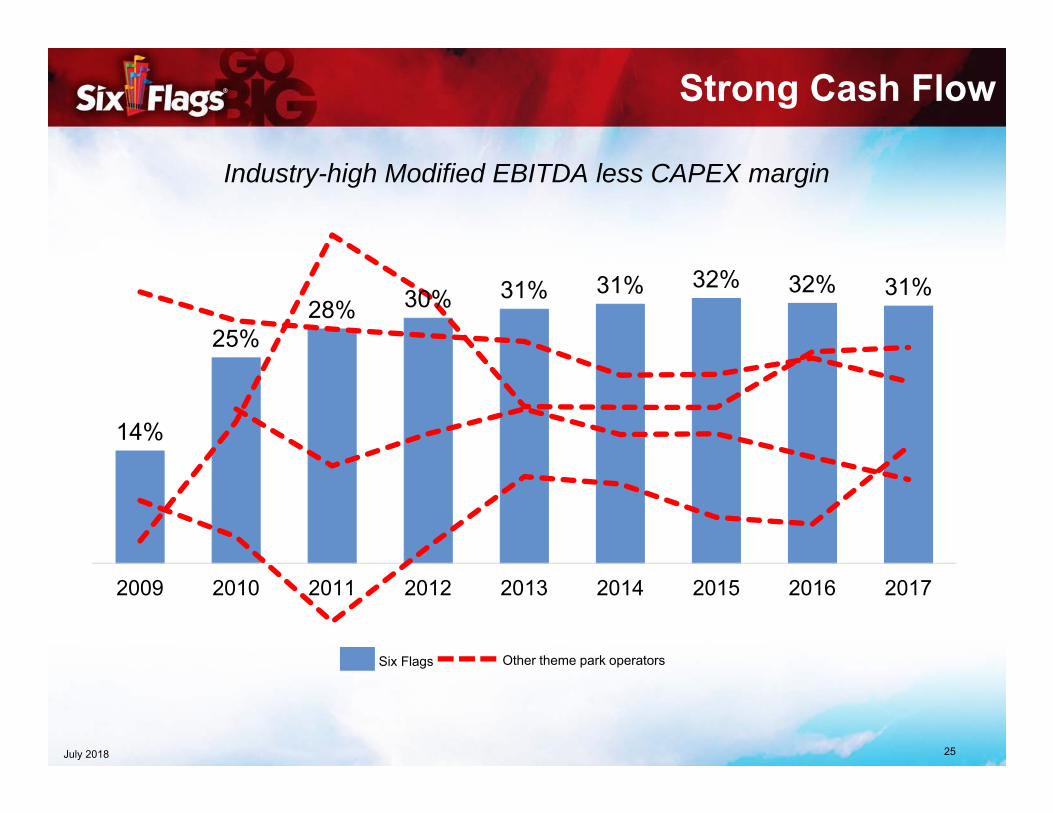
Strong Cash Flow
Industry-high Modified EBITDA less CAPEX margin
14%
25%28% 30% 31% 31% 32% 32% 31%
2009 2010 2011 2012 2013 2014 2015 2016 2017
Six Flags Other theme park operators
26July 2018
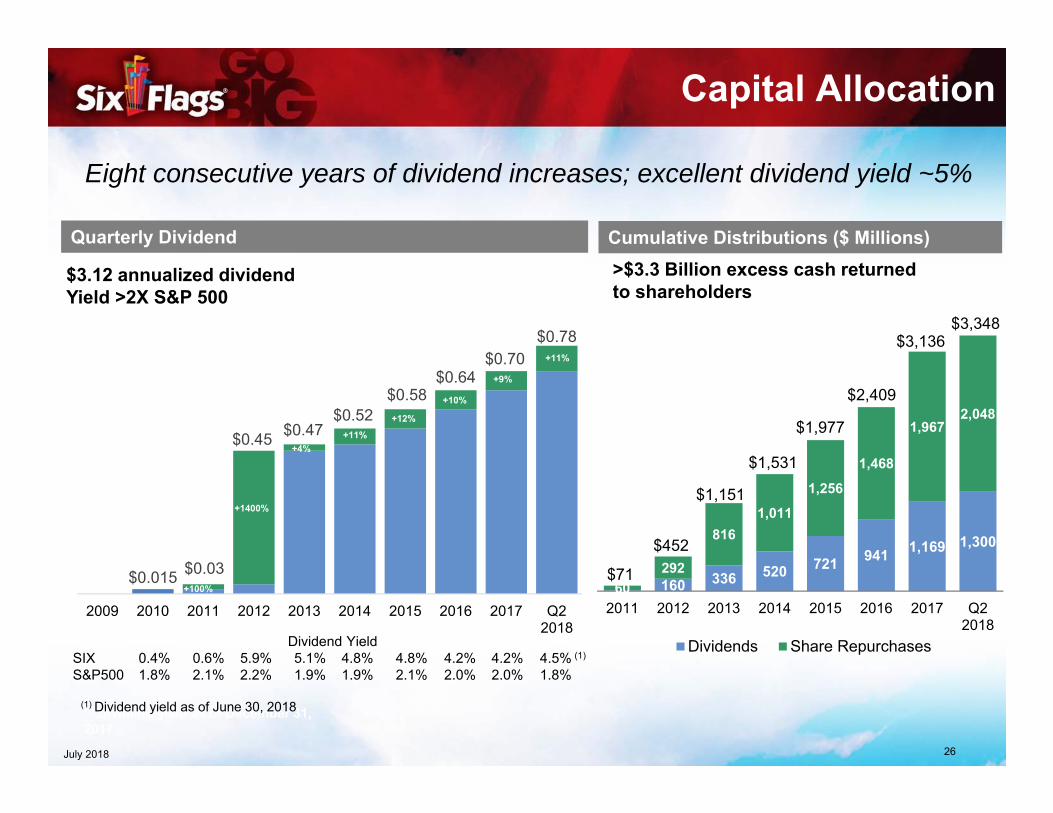
$0.015 $0.03
$0.45 $0.47$0.52
$0.58$0.64
$0.70$0.78
2009 2010 2011 2012 2013 2014 2015 2016 2017 Q22018
+9%
Capital Allocation
Eight consecutive years of dividend increases; excellent dividend yield ~5%
Cumulative Distributions ($ Millions)
160 336 520 721 941 1,169 1,300
60292
8161,011
1,2561,468
1,9672,048
2011 2012 2013 2014 2015 2016 2017 Q22018
Dividends Share Repurchases
$1,151
$1,531
$1,977
$2,409
$3,136
>$3.3 Billion excess cash returned to shareholders
(1) Dividend yield as of December 31, 2017
Quarterly Dividend
$3.12 annualized dividend Yield >2X S&P 500
Dividend YieldSIX 0.4% 0.6% 5.9% 5.1% 4.8% 4.8% 4.2% 4.2% 4.5% (1)
S&P500 1.8% 2.1% 2.2% 1.9% 1.9% 2.1% 2.0% 2.0% 1.8%
(1) Dividend yield as of June 30, 2018
+1400%
+100%
+4%+11%
+12%
+10%
+11%
$452
$71
$3,348
27July 2018
Investment Thesis
Global leader in an attractive industry
• Attractive industryo Stable in a weak economyo High barriers to entry
• Exceptional brand and business foundationo Focused strategyo Expansive array of entertainment & services
• Substantial growth opportunitieso Innovative products and programso Membership / Season Pass penetrationo Pricing and ticket yield managemento In-park revenue initiativeso North American expansion strategyo International licensing
• Financial Excellenceo Strong recurring revenue and cash flowo Industry-leading margino Favorable capital allocation strategyo NOL carry forward
• Employees closely aligned with shareholders
28July 2018
558
223
323379 416 444 477
750
520 545579
2009 2010 2011 2012 2013 2014 2015 2016 2017 2018Q2 LTM
2020Project 750
Adjusted EBITDA Modified EBITDA
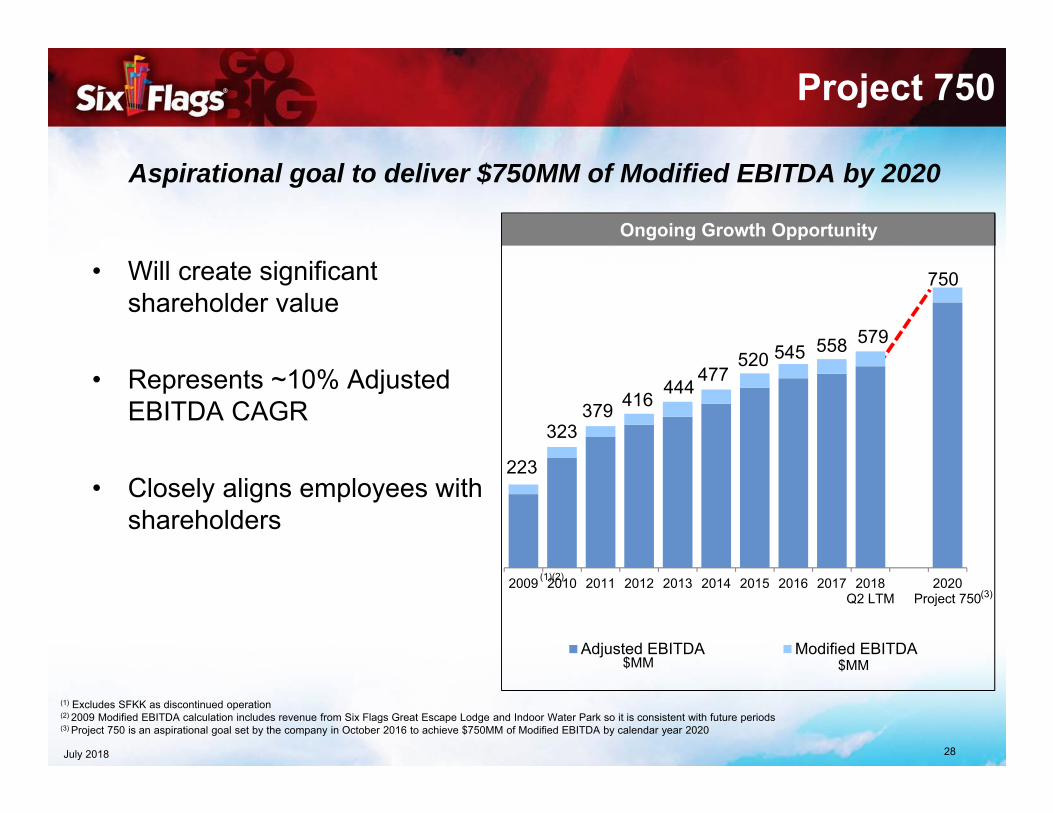
Project 750
• Will create significant shareholder value
• Represents ~10% Adjusted EBITDA CAGR
• Closely aligns employees with shareholders
Aspirational goal to deliver $750MM of Modified EBITDA by 2020
(1) Excludes SFKK as discontinued operation(2) 2009 Modified EBITDA calculation includes revenue from Six Flags Great Escape Lodge and Indoor Water Park so it is consistent with future periods(3) Project 750 is an aspirational goal set by the company in October 2016 to achieve $750MM of Modified EBITDA by calendar year 2020
Ongoing Growth Opportunity
(1)(2)
$MM $MM
(3)
29July 2018
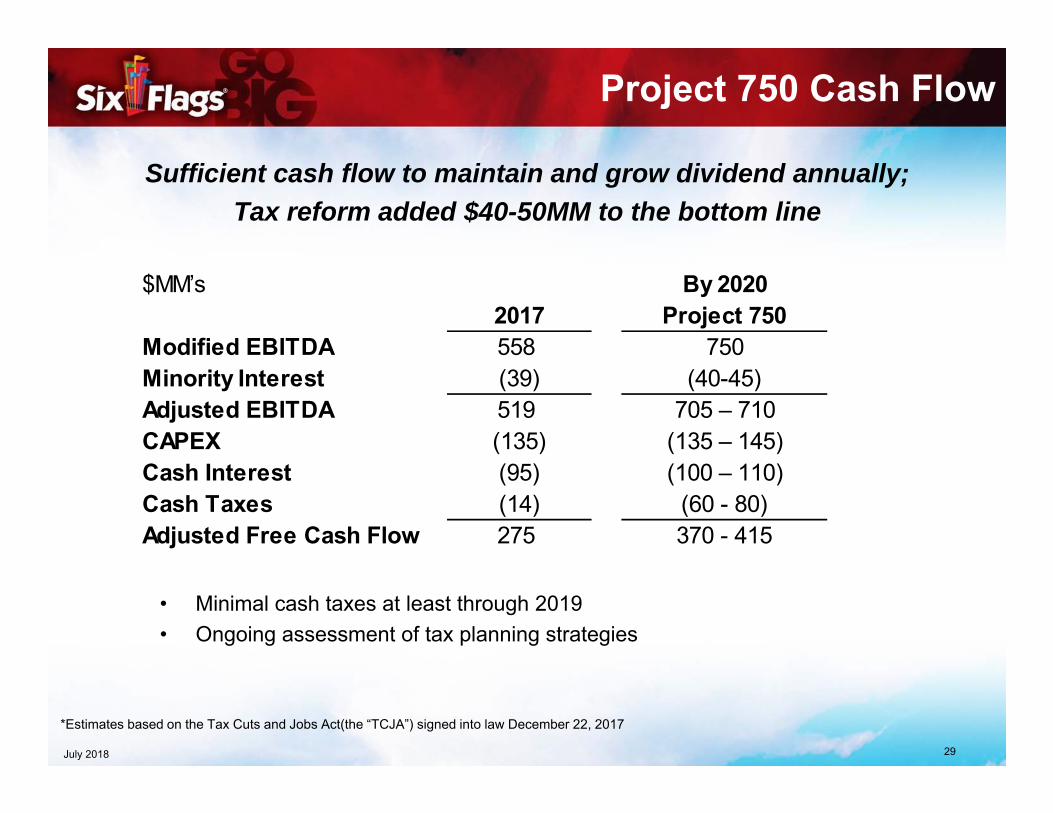
Project 750 Cash Flow
• Minimal cash taxes at least through 2019• Ongoing assessment of tax planning strategies
Sufficient cash flow to maintain and grow dividend annually;Tax reform added $40-50MM to the bottom line
$MM’s By 20202017 Project 750
Modified EBITDA 558 750Minority Interest (39) (40-45)Adjusted EBITDA 519 705 – 710CAPEX (135) (135 – 145)Cash Interest (95) (100 – 110)Cash Taxes (14) (60 - 80)Adjusted Free Cash Flow 275 370 - 415
*Estimates based on the Tax Cuts and Jobs Act(the “TCJA”) signed into law December 22, 2017
30July 2018
Summary
Delivering shareholder value
+ Delighting our guests
+ Building brand equity
+ Leveraging brand outside of North America
+ Maximizing revenue and cash flow
+ Generating strong returns for our shareholders
31July 2018
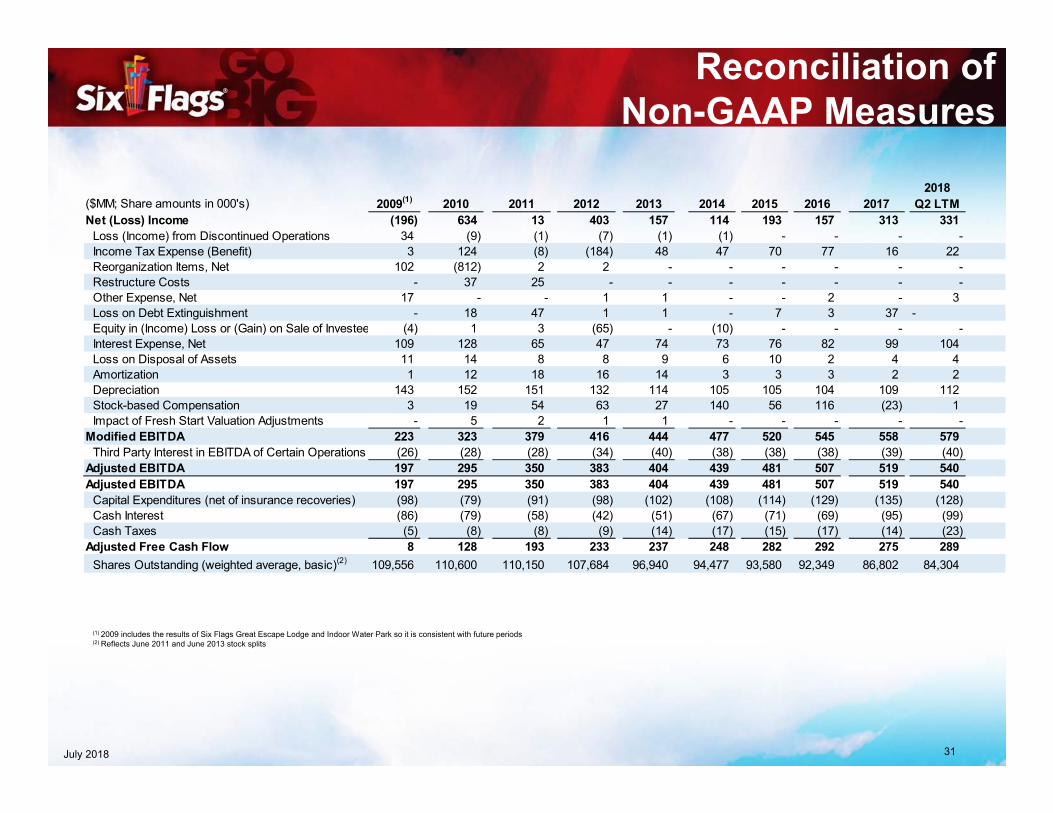
(1) 2009 includes the results of Six Flags Great Escape Lodge and Indoor Water Park so it is consistent with future periods(2) Reflects June 2011 and June 2013 stock splits
Reconciliation of Non-GAAP Measures
($MM; Share amounts in 000's) 2009(1) 2010 2011 2012 2013 2014 2015 2016 20172018
Q2 LTMNet (Loss) Income (196) 634 13 403 157 114 193 157 313 331
Loss (Income) from Discontinued Operations 34 (9) (1) (7) (1) (1) - - - -Income Tax Expense (Benefit) 3 124 (8) (184) 48 47 70 77 16 22Reorganization Items, Net 102 (812) 2 2 - - - - - -Restructure Costs - 37 25 - - - - - - -Other Expense, Net 17 - - 1 1 - - 2 - 3Loss on Debt Extinguishment - 18 47 1 1 - 7 3 37 -Equity in (Income) Loss or (Gain) on Sale of Investee (4) 1 3 (65) - (10) - - - -Interest Expense, Net 109 128 65 47 74 73 76 82 99 104Loss on Disposal of Assets 11 14 8 8 9 6 10 2 4 4Amortization 1 12 18 16 14 3 3 3 2 2Depreciation 143 152 151 132 114 105 105 104 109 112Stock-based Compensation 3 19 54 63 27 140 56 116 (23) 1Impact of Fresh Start Valuation Adjustments - 5 2 1 1 - - - - -
Modified EBITDA 223 323 379 416 444 477 520 545 558 579Third Party Interest in EBITDA of Certain Operations (26) (28) (28) (34) (40) (38) (38) (38) (39) (40)
Adjusted EBITDA 197 295 350 383 404 439 481 507 519 540Adjusted EBITDA 197 295 350 383 404 439 481 507 519 540
Capital Expenditures (net of insurance recoveries) (98) (79) (91) (98) (102) (108) (114) (129) (135) (128)Cash Interest (86) (79) (58) (42) (51) (67) (71) (69) (95) (99)Cash Taxes (5) (8) (8) (9) (14) (17) (15) (17) (14) (23)
Adjusted Free Cash Flow 8 128 193 233 237 248 282 292 275 289Shares Outstanding (weighted average, basic)(2) 109,556 110,600 110,150 107,684 96,940 94,477 93,580 92,349 86,802 84,304

32July 2018
DisclaimerNote About Forward-Looking Information• The information contained in this presentation, other than purely historical information, contains "forward-looking statements" within the meaning of Section 27A of the Securities Act and Section 21E of the Exchange Act.
These statements may involve risks and uncertainties that could cause actual results to differ materially from those described in such statements.• We caution you that you should not rely on any of these forward-looking statements as statements of historical fact or as guarantees or assurances of future performance. These risks and uncertainties include, but are not
limited to, statements we make regarding: (i) the adequacy of cash flows from operations, available cash and available amounts under our credit facilities to meet our future liquidity needs, (ii) our ability to roll out our capital enhancements in a timely and cost effective manner, (iii) our ability to improve operating results by implementing strategic cost reductions, and organizational and personnel changes without adversely affecting our business, and (iv) our operations and results of operations. Additional important factors that could cause actual results to differ materially from those in the forward-looking statements include regional, national or global political, economic, business, competitive, market and regulatory conditions and include, but not limited to, the following: (i) factors impacting attendance, such as local conditions, natural disasters, contagious diseases, events, disturbances and terrorist activities; (ii) accidents occurring at our parks or other parks in the industry and adverse publicity related thereto; (iii) adverse weather conditions; (iv) general financial and credit market conditions; (v) economic conditions; (vi) competition with other theme parks and other entertainment alternatives; and (vii) pending, threatened or future legal proceedings and the significant expenses associated with litigation.
• Reference is made to a more complete discussion of forward-looking statements and applicable risks contained under the caption “Cautionary Note Regarding Forward-Looking Statements” and “Risk Factors” in our Annual Report on Form 10-K for the year ended December 31, 2017 that is available on our website at www.investors.sixflags.com.
• Any forward-looking statement made by us in this presentation, or on our behalf by our directors, officers or employees related to the information contained herein, speaks only as of the date of this presentation. Factors or events that could cause our actual results to differ may emerge from time to time, and it is not possible for us to predict all of them. We do not intend to update any forward-looking statement, whether as a result of new information, future developments or otherwise.
Non-GAAP Financial Measures• The non-GAAP financial measures defined herein are used throughout this presentation and a reconciliation to GAAP has been included in the appendix of this presentation. We believe that these non-GAAP financial
measures provide important and useful information for investors to facilitate a comparison of our operating performance on a consistent basis from period to period and make it easier to compare our results with those of other companies in our industry. We use these measures for internal planning and forecasting purposes, to evaluate ongoing operations and our performance generally, and in our annual and long-term incentive plans. By providing these measures, we provide our investors with the ability to review our performance in the same manner as our management.
• However, because these non-GAAP financial measures are not determined in accordance with GAAP, they are susceptible to varying calculations, and not all companies calculate these measures in the same manner. As a result, these non-GAAP financial measures as presented may not be directly comparable to a similarly titled non-GAAP financial measure presented by another company. These non-GAAP financial measures are presented as supplemental information and not as alternatives to any GAAP financial measures. When reviewing a non-GAAP financial measure, we encourage our investors to fully review and consider the related reconciliation as detailed below.
• Modified EBITDA, a non-GAAP measure, is defined as our consolidated income (loss) from continuing operations: excluding the cumulative effect of changes in accounting principles, discontinued operations gains or losses, income tax expense or benefit, restructure costs or recoveries, reorganization items (net), other income or expense, gain or loss on early extinguishment of debt, equity in income or loss of investees, interest expense (net), gain or loss on disposal of assets, gain or loss on the sale of investees, amortization, depreciation, stock-based compensation, and fresh start accounting valuation adjustments. Modified EBITDA as defined herein may differ from similarly titled measures presented by other companies. Management uses non-GAAP measures for budgeting purposes, measuring actual results, allocating resources and in determining employee incentive compensation. We believe that Modified EBITDA provides relevant and useful information for investors because it assists in comparing our operating performance on a consistent basis, makes it easier to compare our results with those of other companies in our industry as it most closely ties our performance to that of our competitors from a park level perspective and allows investors to review performance in the same manner as our management.
• Adjusted EBITDA, a non-GAAP measure, is defined as Modified EBITDA minus the interests of third parties in the Adjusted EBITDA of properties that are less than wholly owned (consisting of Six Flags Over Georgia, Six Flags White Water Atlanta and Six Flags Over Texas). Adjusted EBITDA is approximately equal to “Parent Consolidated Adjusted EBITDA” as defined in our secured credit agreement, except that Parent Consolidated Adjusted EBITDA excludes Adjusted EBITDA from equity investees that is not distributed to us in cash on a net basis and has limitations on the amounts of certain expenses that are excluded from the calculation. Adjusted EBITDA as defined herein may differ from similarly titled measures presented by other companies. Our board of directors and management use Adjusted EBITDA to measure our performance and our current management incentive compensation plans are based largely on Adjusted EBITDA. We believe that Adjusted EBITDA is frequently used by all our sell-side analysts and most investors as their primary measure of our performance in the evaluation of companies in our industry. In addition, the instruments governing our indebtedness use Adjusted EBITDA to measure our compliance with certain covenants and, in certain circumstances, our ability to make certain borrowings. Adjusted EBITDA, as computed by us, may not be comparable to similar metrics used by other companies in our industry.
• Management uses Adjusted Free Cash Flow, a non-GAAP measure, in its financial and operational decision making processes, for internal reporting, and as part of its forecasting and budgeting processes as it provides additional transparency of our operations. Management believes that Adjusted Free Cash Flow is useful information to investors regarding the amount of cash that we estimate that we will generate from operations over a certain period. Management believes the presentation of this measure will enhance the investors' ability to analyze trends in the business and evaluate the Company's underlying performance relative to other companies in the industry. A reconciliation from net cash provided by operating activities to Adjusted Free Cash Flow is presented in the table above. Adjusted Free Cash Flow as presented herein may differ from similarly titled measures presented by other companies.
• Based on our current federal net operating loss carryforwards, we believe we will continue to pay minimal amounts for cash taxes for the next two years. Cash taxes paid represents statutory taxes paid, primarily driven by Mexico and state level obligations.
• Cash Operating Expenses include cost of goods sold, SG&A and operating expenses excluding, depreciation, amortization, stock-based compensation, and gain/loss on disposal of assets.Market and Industry Data • This presentation includes market, industry and competitor data, forecasts and valuations that have been obtained from independent consultant reports, publicly available information, various industry publications and other
published industry sources. Although we believe these sources are reliable, we have not independently verified the information and cannot make any representation as to the accuracy or completeness of such information.