Embed Size (px)
Citation preview

Metropolitan Transportation Authority
July Financial Plan 2015 – 2018
Presentation to the BoardJuly 28, 2014

The February Plan projected small cash balances in 2014 to 2016 and a $255 million deficit in 2017
($ in millions)
2

The February Plan was based on five key, inter-related elements
• Three years of “net zero” labor settlements for all MTA unions• Annually recurring cost savings ($1.1 billion in 2014 increasing to $1.5 billion by 2017)• Projected fare/toll increases of 4% in 2015 and 2017• No further legislative erosion of PMT revenue• $370 million of annual PAYGO capital beginning in 2015 as a “down payment” on the
2015 – 2019 Capital Program
As we stated at that time, failure to achieve the first two elements, or any significant decrease in the PMT or any other taxes/subsidies, will require an increase in fares/tolls or a decrease in funds committed to PAYGO capital
While we are on track to achieve the annually recurring savings targets, based on recent labor settlements and agreements, 3 “net zero” labor settlements are unachievable
3

• Favorable re-estimates and other changes― Lower health and welfare /OPEB current payment estimates ― Lower debt service ― Favorable energy re-estimates in 2015 – 2017― Lower pension re-estimates ― Higher passenger/toll revenues and other revenue― Higher paratransit savings― Higher real estate receipts in 2014, nearly offset by lower projections in 2015 – 2017 ― Delayed impact of East Side Access on operating expenses ― Reduced 2013 spending that increased carryover balance
• Unfavorable re-estimates and other changes― Lower PMT receipts ― Higher overtime re-estimates ― Higher safety investments― Additional operational and maintenance needs― Additional service investments and customer enhancements
• Re-estimates and other changes are $635 million net favorable through 2017
• However, actual and assumed labor settlements with TWU Local 100 and other unions and potential settlements with CRR unions will increase labor costs by a minimum of $1.28 billion through 2017
• Bottom line is $645 million net unfavorable through 2017
• Reallocation of existing resources is required to offset higher labor costs to avoid raising fares/tolls more than projected and to minimize hit on PAYGO capital
What else has changed since the February Plan?
4

Assuming Transit Unions follow the TWU Local 100 pattern and Commuter Unions follow the LIRR Union Coalition pattern,
incremental labor costs during the Plan Period increase $478 million in 2014 and an average of $260 million a year
($ in millions)
5

Reallocating resources to fund the higher labor costs avoids the need to raise fares/tolls above current projections,
but requires long-term trade-offs ($ in millions)
6

Highlights of the July Plan
7

Proposed Areas of MTA Safety Investments(not funded from the capital program)
MTA will be making safety investments based on: new mandates; recommendations by governmental bodies; compliance with existing laws, policies and procedures; and, new MTA initiatives such as those supporting the “Vision Zero” initiative. Investments will be taking place in the following areas:
•Customer/Employee Safety ($40 million per year) - Promote and adhere to a culture of safety with customers and employees via improved work practices and investments in technology and equipment, including the use of audio/visual cameras on commuter rail rolling stock
•Track ($17 million per year) - More frequent track inspections and repairs
•Signals ($8 million per year) - Upgrades and repairs to signals and signal systems
•Training ($6 million per year) - Enhancement of employee training
•Positive Train Control ($6 million per year) - Positive Train Control on LIRR and MNR
•IT/Communications ($3 million per year) - Enhance safety systems and communications with customers and employees
•Right-of-Way ($4 million per year) - More aggressive inspection and maintenance on the right-of-way
8
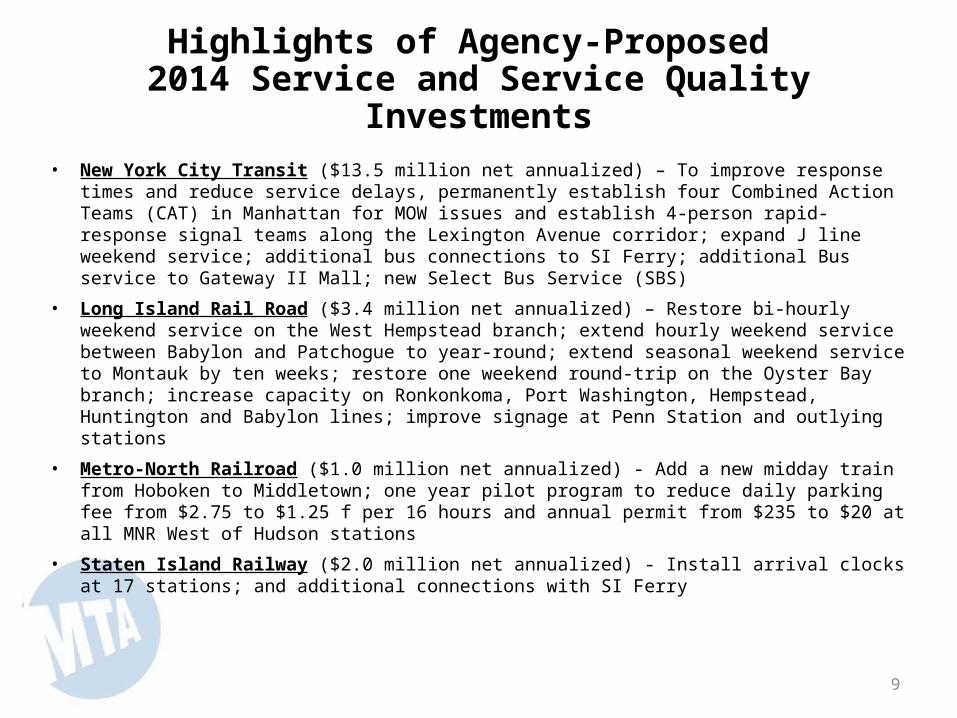
Highlights of Agency-Proposed 2014 Service and Service Quality Investments
• New York City Transit ($13.5 million net annualized) – To improve response times and reduce service delays, permanently establish four Combined Action Teams (CAT) in Manhattan for MOW issues and establish 4-person rapid-response signal teams along the Lexington Avenue corridor; expand J line weekend service; additional bus connections to SI Ferry; additional Bus service to Gateway II Mall; new Select Bus Service (SBS)
• Long Island Rail Road ($3.4 million net annualized) – Restore bi-hourly weekend service on the West Hempstead branch; extend hourly weekend service between Babylon and Patchogue to year-round; extend seasonal weekend service to Montauk by ten weeks; restore one weekend round-trip on the Oyster Bay branch; increase capacity on Ronkonkoma, Port Washington, Hempstead, Huntington and Babylon lines; improve signage at Penn Station and outlying stations
• Metro-North Railroad ($1.0 million net annualized) - Add a new midday train from Hoboken to Middletown; one year pilot program to reduce daily parking fee from $2.75 to $1.25 f per 16 hours and annual permit from $235 to $20 at all MNR West of Hudson stations
• Staten Island Railway ($2.0 million net annualized) - Install arrival clocks at 17 stations; and additional connections with SI Ferry
9
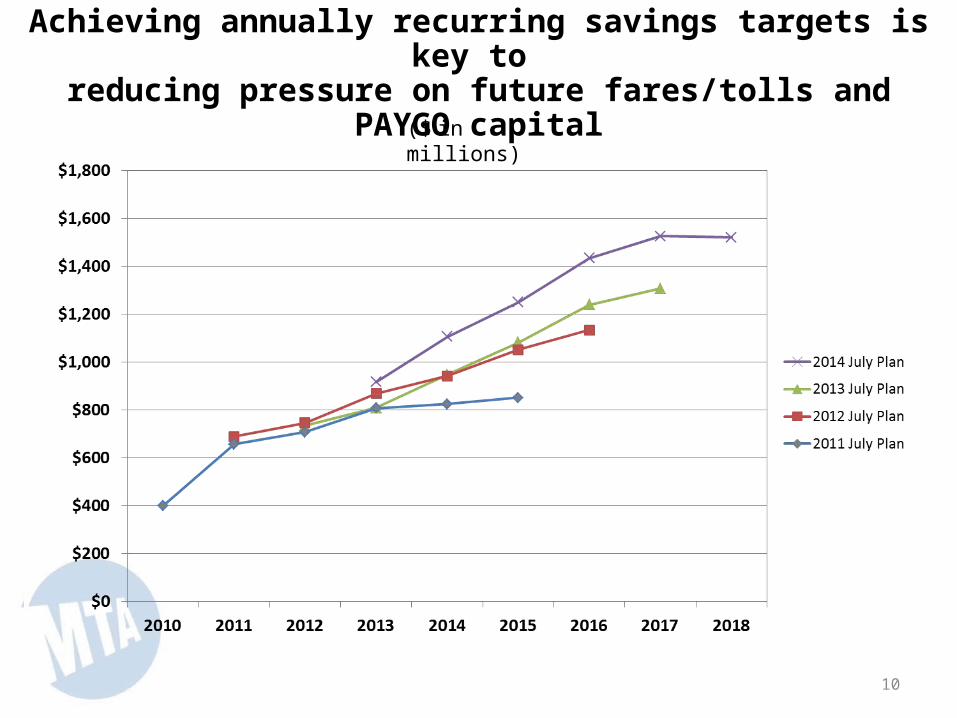
Achieving annually recurring savings targets is key to reducing pressure on future fares/tolls and PAYGO capital
($ in millions)
10

More targeted savings have been identified since the November Plan
($ in millions)
11

2014 February Plan vs. Proposed July Plan
12
($ in millions)
February Plan Proposed July Plan
Note: Cash balances are carried forward to reduce next year’s deficit

What is our strategy going forward?
• Continue to pursue efficiencies/consolidations to maximize annually recurring cost savings; we must remain focused on existing cost control to avoid “backsliding”
• While funding higher labor cost caused us to temporarily divert some of our resources away from our strategy to address long-term costs and liabilities, we remain committed to this objective– Although the July Plan suspends OPEB contributions through 2017, contributions are
resumed in 2018, albeit at a much lower level– Should finances improve, we intend to increase funding to the extent practicable
• Use non-recurring revenues, favorable budget variances and unused general reserve funds to reduce long-term unfunded liabilities—OPEBs, LIRR Additional Pension Plan or as PAYGO– Simply put, this strategy converts favorable “one- shots” into recurring savings
• Reinvest debt service savings in PAYGO capital
13