Embed Size (px)
Citation preview

June 2017
Investor Presentation
2
Disclaimer
Forward-Looking Statements: This presentation contains forward-looking statements which are made pursuant to
the safe harbor provisions of Section 27A of the Securities Act of 1933, as amended, and Section 21E of the
Securities Exchange Act of 1934, as amended.
The forward-looking statements in this presentation do not constitute guarantees of future performance. Investors are
cautioned that statements in this presentation, which are not strictly historical statements, including, without
limitation, statements by our President and Chief Executive Officer and our Chief Financial Officer, and statements
concerning our expected future performance, plans, objectives and strategies, constitute forward-looking statements.
Such forward-looking statements are subject to a number of risks and uncertainties that could cause actual results to
differ materially from those anticipated by the forward-looking statements, including, without limitation, risks
associated with our ability to develop and market new products and services that meet customer demands and
generate acceptable margins; our reliance on several large customers; our ability to negotiate and enter into
acceptable contract terms with our suppliers; our ability to attract and retain qualified management and other
personnel; competition in the industry in which we do business; failure of the third-party communications networks on
which we depend; legislation or regulatory environments, requirements or changes adversely affecting the
businesses in which we are engaged; our ability to maintain our databases, management systems and other
intellectual property; our ability to maintain adequate liquidity and produce sufficient cash flow to fund our capital
expenditures and debt service; our ability to obtain capital to grow our business; technological developments and
changes in the industry; our ability to complete acquisitions or divestures and to integrate any business or operation
acquired; general economic condition and other risks detailed in our filings with the Securities and Exchange
Commission. We undertake no obligation to update any forward-looking information contained in this presentation.
Additionally, this presentation may contain various non-GAAP financial measures as defined by the SEC’s
Regulation G. More information on the non-GAAP financial measures used in this presentation can be found on the
Investor Relations page of our corporate website at www.gtt.net.
3
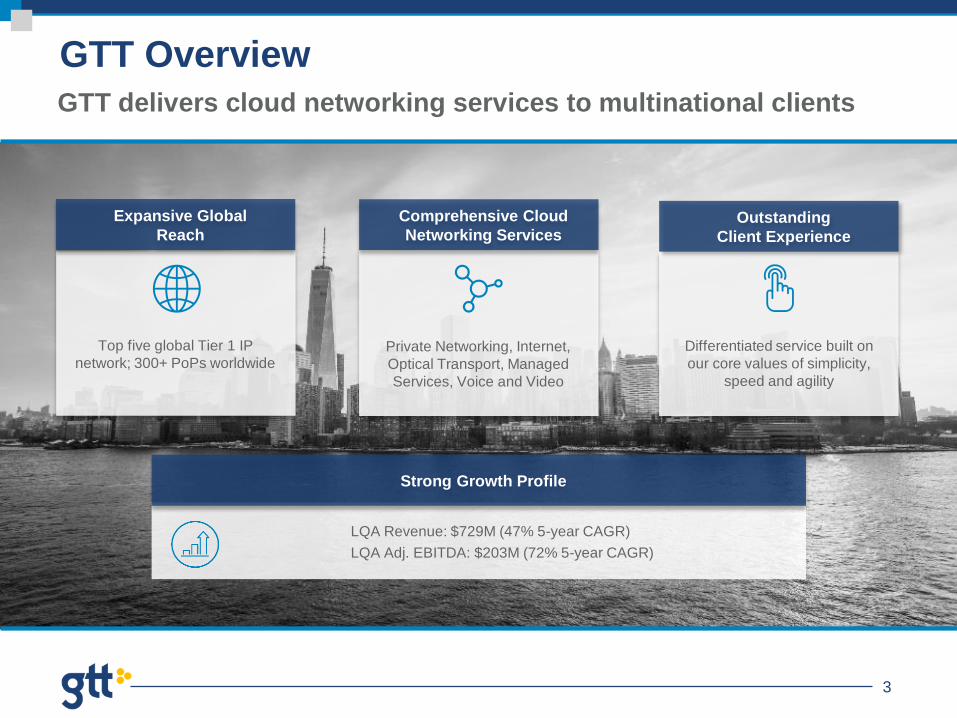
GTT Overview
Expansive Global
Reach
Comprehensive Cloud
Networking ServicesOutstanding
Client Experience
GTT delivers cloud networking services to multinational clients
Strong Growth Profile
Top five global Tier 1 IP
network; 300+ PoPs worldwidePrivate Networking, Internet,
Optical Transport, Managed
Services, Voice and Video
Differentiated service built on
our core values of simplicity,
speed and agility
LQA Revenue: $729M (47% 5-year CAGR)
LQA Adj. EBITDA: $203M (72% 5-year CAGR)
4
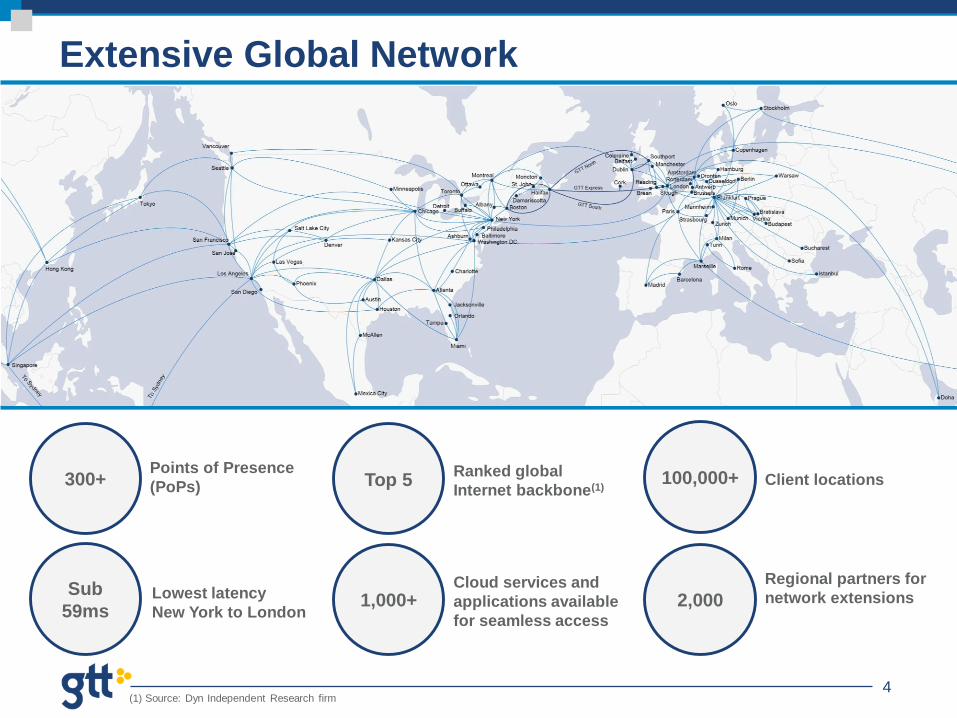
Extensive Global Network
1,000+
Points of Presence
(PoPs)Ranked global
Internet backbone(1)
Regional partners for
network extensionsCloud services and
applications available
for seamless access
(1) Source: Dyn Independent Research firm
300+ Top 5
2,000
Client locations100,000+
Sub
59msLowest latency
New York to London
5
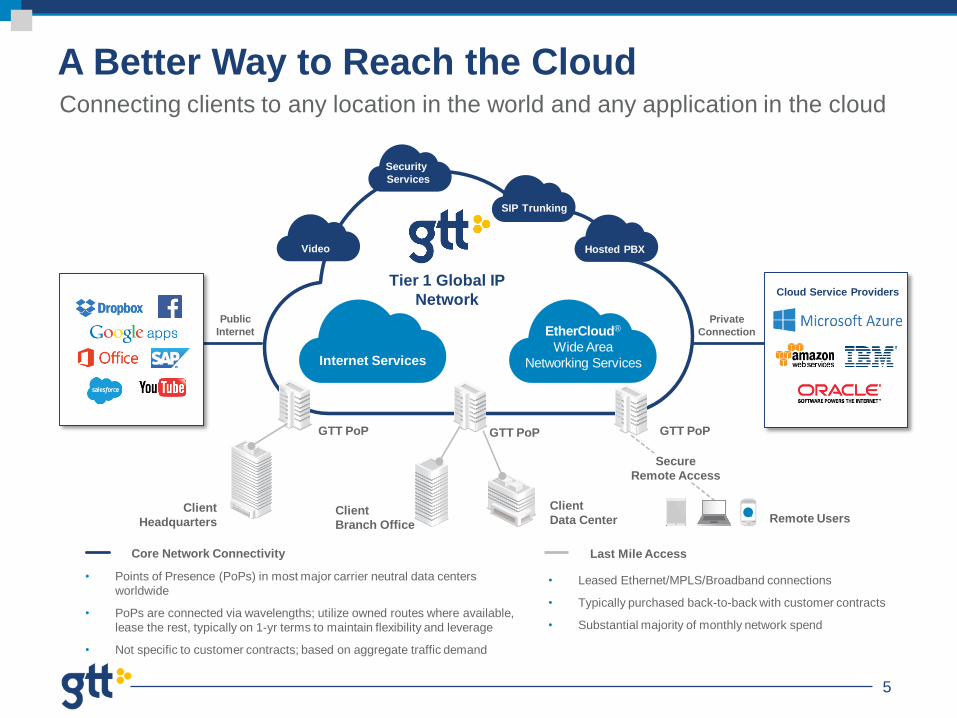
A Better Way to Reach the CloudConnecting clients to any location in the world and any application in the cloud
Client
Data Center
Security
Services
SIP Trunking
Hosted PBX
Internet Services
EtherCloud®
Wide Area
Networking Services
Tier 1 Global IP
Network
GTT PoP GTT PoP GTT PoP
Client
Branch Office
Secure
Remote Access
Remote Users
Cloud Service Providers
• Leased Ethernet/MPLS/Broadband connections
• Typically purchased back-to-back with customer contracts
• Substantial majority of monthly network spend
• Points of Presence (PoPs) in most major carrier neutral data centers
worldwide
• PoPs are connected via wavelengths; utilize owned routes where available,
lease the rest, typically on 1-yr terms to maintain flexibility and leverage
• Not specific to customer contracts; based on aggregate traffic demand
Core Network Connectivity Last Mile Access
Client
Headquarters
Public
Internet
Private
Connection
Video
6
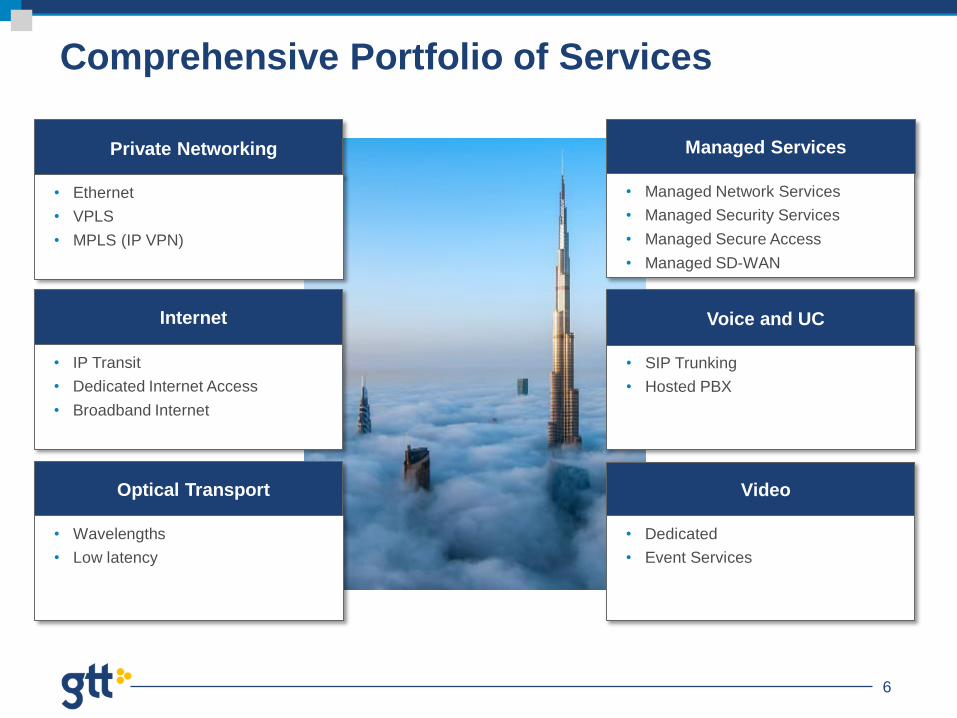
Comprehensive Portfolio of Services
Voice and UC
• SIP Trunking
• Hosted PBX
Managed Services
• Managed Network Services
• Managed Security Services
• Managed Secure Access
• Managed SD-WAN
Video
• Dedicated
• Event Services
Internet
• IP Transit
• Dedicated Internet Access
• Broadband Internet
Private Networking
• Ethernet
• VPLS
• MPLS (IP VPN)
Optical Transport
• Wavelengths
• Low latency
7
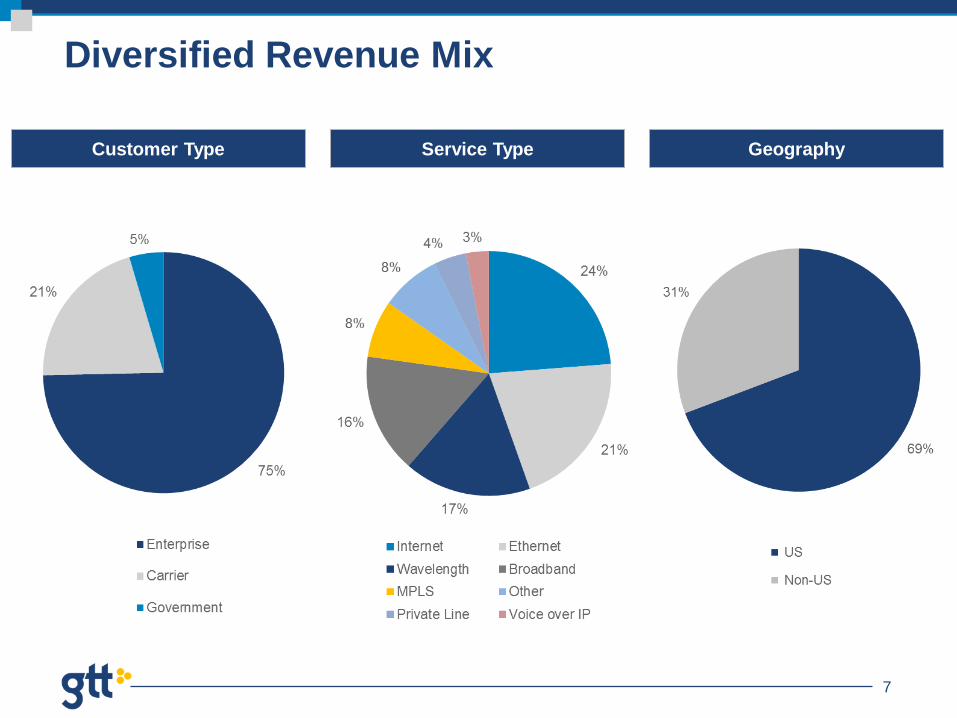
Diversified Revenue Mix
Customer Type Service Type Geography
8
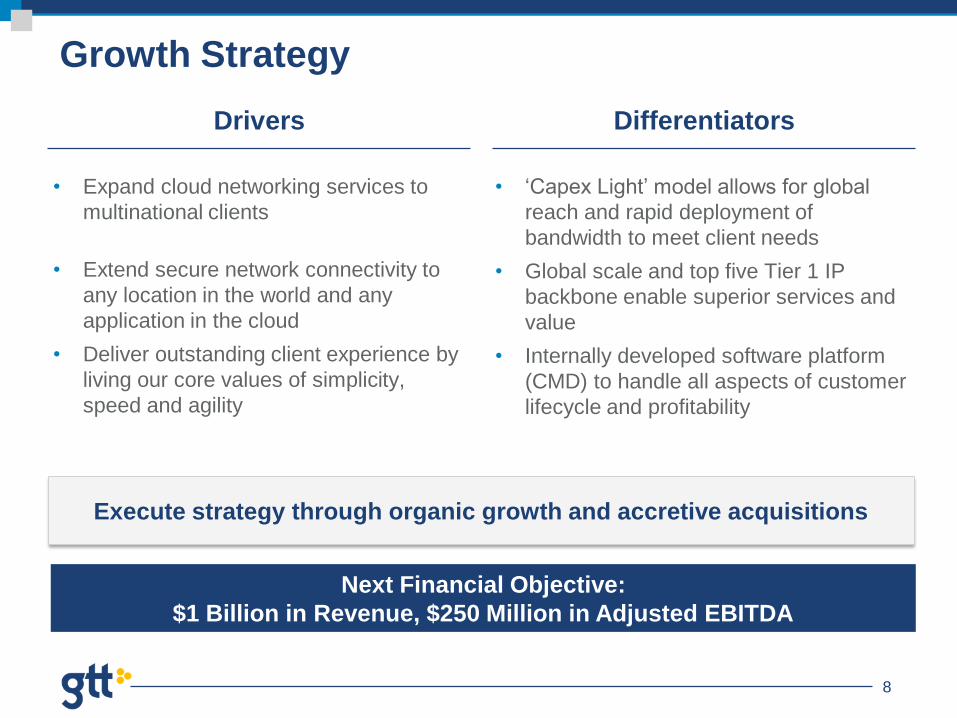
Growth Strategy
Next Financial Objective:
$1 Billion in Revenue, $250 Million in Adjusted EBITDA
• Expand cloud networking services to
multinational clients
• Extend secure network connectivity to
any location in the world and any
application in the cloud
• Deliver outstanding client experience by
living our core values of simplicity,
speed and agility
Execute strategy through organic growth and accretive acquisitions
• ‘Capex Light’ model allows for global
reach and rapid deployment of
bandwidth to meet client needs
• Global scale and top five Tier 1 IP
backbone enable superior services and
value
• Internally developed software platform
(CMD) to handle all aspects of customer
lifecycle and profitability
Drivers Differentiators
9
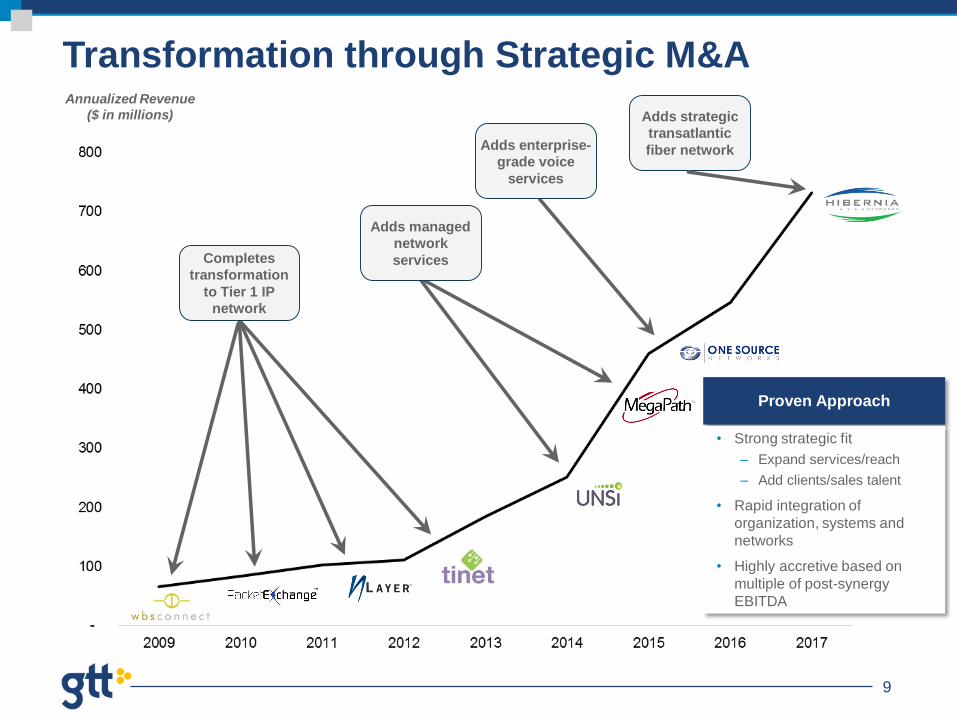
Transformation through Strategic M&AAnnualized Revenue
($ in millions)
Adds enterprise-
grade voice
services
Adds strategic
transatlantic
fiber network
Adds managed
network
servicesCompletes
transformation
to Tier 1 IP
network
Proven Approach
• Strong strategic fit
– Expand services/reach
– Add clients/sales talent
• Rapid integration of
organization, systems and
networks
• Highly accretive based on
multiple of post-synergy
EBITDA
10
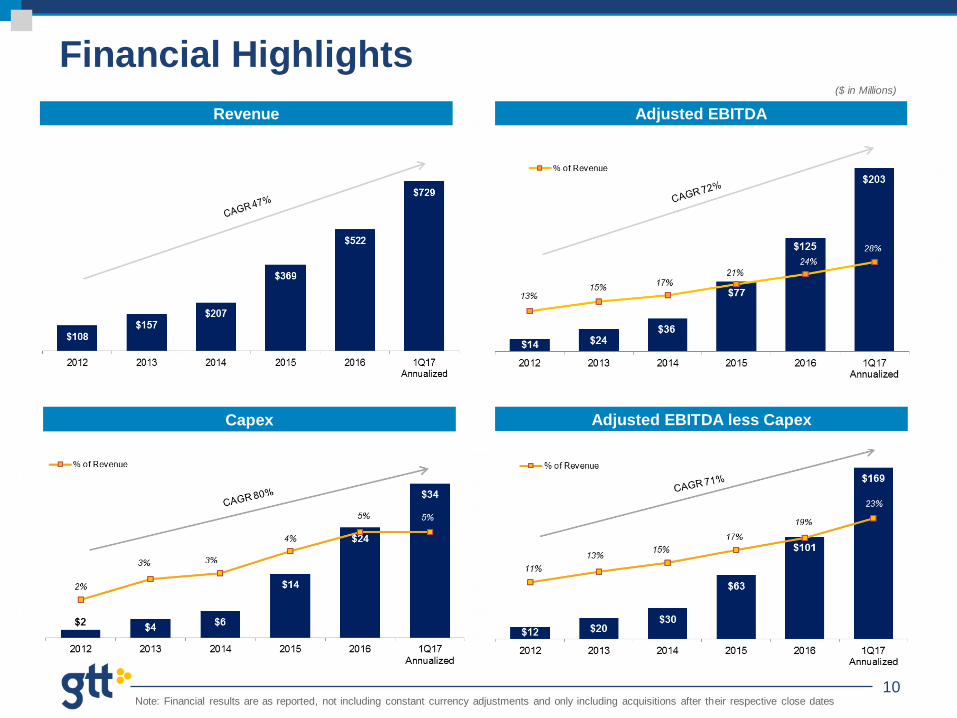
Financial Highlights($ in Millions)
Note: Financial results are as reported, not including constant currency adjustments and only including acquisitions after their respective close dates
Adjusted EBITDA
Capex Adjusted EBITDA less Capex
Revenue
11
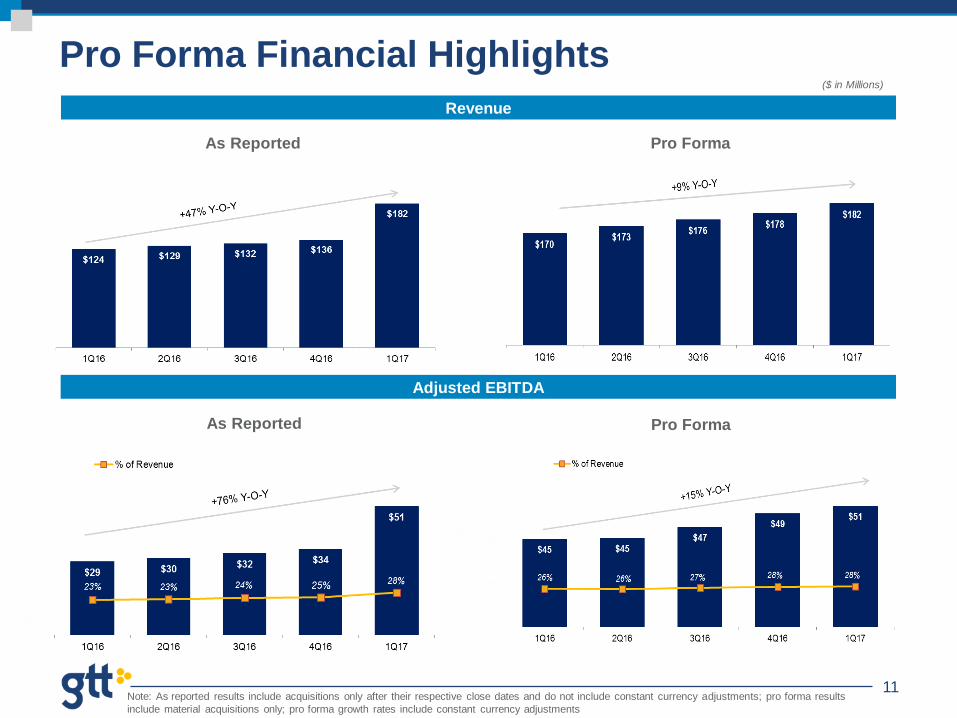
As Reported
Pro Forma Financial Highlights($ in Millions)
As Reported Pro Forma
Pro Forma
Note: As reported results include acquisitions only after their respective close dates and do not include constant currency adjustments; pro forma results
include material acquisitions only; pro forma growth rates include constant currency adjustments
Revenue
Adjusted EBITDA
12
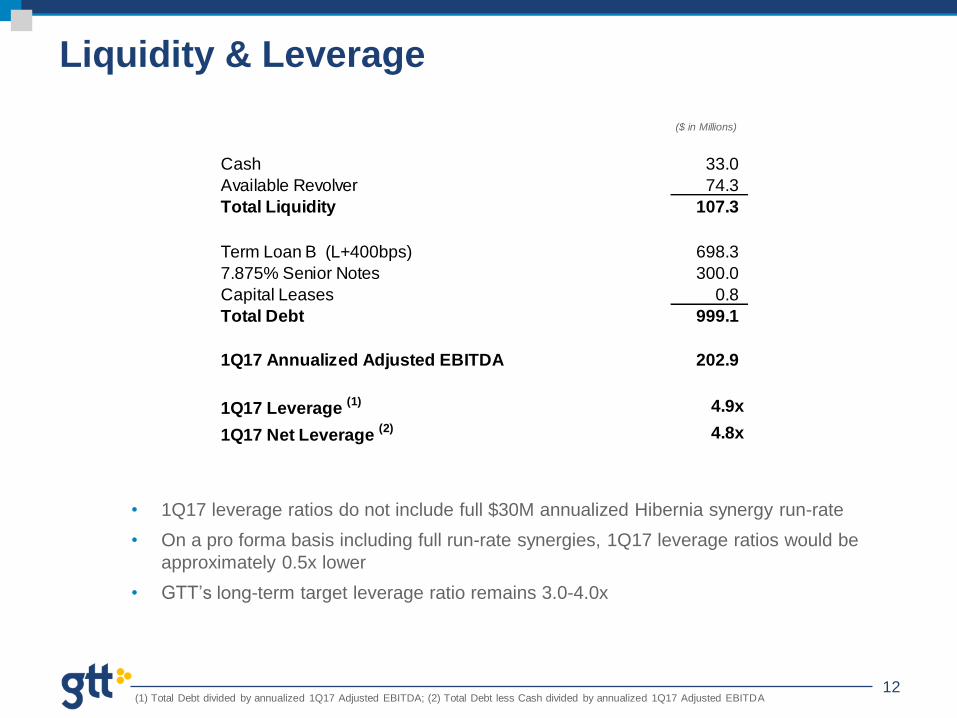
Liquidity & Leverage
($ in Millions)
(1) Total Debt divided by annualized 1Q17 Adjusted EBITDA; (2) Total Debt less Cash divided by annualized 1Q17 Adjusted EBITDA
• 1Q17 leverage ratios do not include full $30M annualized Hibernia synergy run-rate
• On a pro forma basis including full run-rate synergies, 1Q17 leverage ratios would be
approximately 0.5x lower
• GTT’s long-term target leverage ratio remains 3.0-4.0x
Cash 33.0
Available Revolver 74.3
Total Liquidity 107.3
Term Loan B (L+400bps) 698.3
7.875% Senior Notes 300.0
Capital Leases 0.8
Total Debt 999.1
1Q17 Annualized Adjusted EBITDA 202.9
1Q17 Leverage (1) 4.9x
1Q17 Net Leverage (2) 4.8x
13
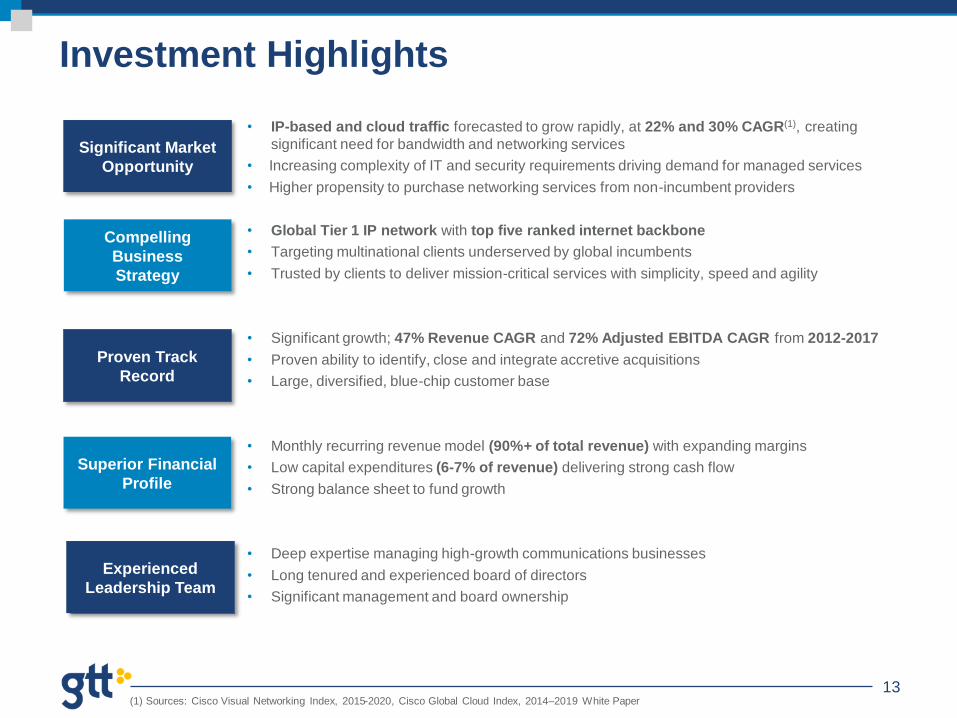
Investment Highlights
Significant Market
Opportunity
Compelling
Business
Strategy
Experienced
Leadership Team
Proven Track
Record
Superior Financial
Profile
(1) Sources: Cisco Visual Networking Index, 2015-2020, Cisco Global Cloud Index, 2014–2019 White Paper
• IP-based and cloud traffic forecasted to grow rapidly, at 22% and 30% CAGR(1), creating
significant need for bandwidth and networking services
• Increasing complexity of IT and security requirements driving demand for managed services
• Higher propensity to purchase networking services from non-incumbent providers
• Global Tier 1 IP network with top five ranked internet backbone
• Targeting multinational clients underserved by global incumbents
• Trusted by clients to deliver mission-critical services with simplicity, speed and agility
• Significant growth; 47% Revenue CAGR and 72% Adjusted EBITDA CAGR from 2012-2017
• Proven ability to identify, close and integrate accretive acquisitions
• Large, diversified, blue-chip customer base
• Monthly recurring revenue model (90%+ of total revenue) with expanding margins
• Low capital expenditures (6-7% of revenue) delivering strong cash flow
• Strong balance sheet to fund growth
• Deep expertise managing high-growth communications businesses
• Long tenured and experienced board of directors
• Significant management and board ownership
14
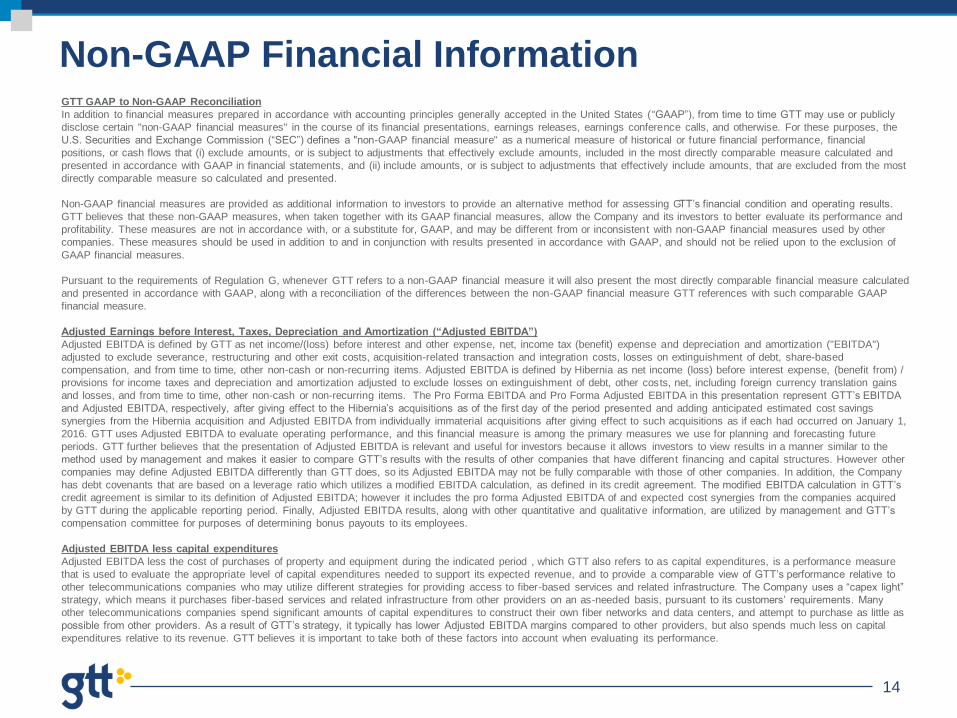
Non-GAAP Financial InformationGTT GAAP to Non-GAAP Reconciliation
In addition to financial measures prepared in accordance with accounting principles generally accepted in the United States (“GAAP”), from time to time GTT may use or publicly
disclose certain "non-GAAP financial measures" in the course of its financial presentations, earnings releases, earnings conference calls, and otherwise. For these purposes, the
U.S. Securities and Exchange Commission (“SEC”) defines a "non-GAAP financial measure" as a numerical measure of historical or future financial performance, financial
positions, or cash flows that (i) exclude amounts, or is subject to adjustments that effectively exclude amounts, included in the most directly comparable measure calculated and
presented in accordance with GAAP in financial statements, and (ii) include amounts, or is subject to adjustments that effectively include amounts, that are excluded from the most
directly comparable measure so calculated and presented.
Non-GAAP financial measures are provided as additional information to investors to provide an alternative method for assessing GTT’s financial condition and operating results.
GTT believes that these non-GAAP measures, when taken together with its GAAP financial measures, allow the Company and its investors to better evaluate its performance and
profitability. These measures are not in accordance with, or a substitute for, GAAP, and may be different from or inconsistent with non-GAAP financial measures used by other
companies. These measures should be used in addition to and in conjunction with results presented in accordance with GAAP, and should not be relied upon to the exclusion of
GAAP financial measures.
Pursuant to the requirements of Regulation G, whenever GTT refers to a non-GAAP financial measure it will also present the most directly comparable financial measure calculated
and presented in accordance with GAAP, along with a reconciliation of the differences between the non-GAAP financial measure GTT references with such comparable GAAP
financial measure.
Adjusted Earnings before Interest, Taxes, Depreciation and Amortization (“Adjusted EBITDA”)
Adjusted EBITDA is defined by GTT as net income/(loss) before interest and other expense, net, income tax (benefit) expense and depreciation and amortization ("EBITDA")
adjusted to exclude severance, restructuring and other exit costs, acquisition-related transaction and integration costs, losses on extinguishment of debt, share-based
compensation, and from time to time, other non-cash or non-recurring items. Adjusted EBITDA is defined by Hibernia as net income (loss) before interest expense, (benefit from) /
provisions for income taxes and depreciation and amortization adjusted to exclude losses on extinguishment of debt, other costs, net, including foreign currency translation gains
and losses, and from time to time, other non-cash or non-recurring items. The Pro Forma EBITDA and Pro Forma Adjusted EBITDA in this presentation represent GTT’s EBITDA
and Adjusted EBITDA, respectively, after giving effect to the Hibernia’s acquisitions as of the first day of the period presented and adding anticipated estimated cost savings
synergies from the Hibernia acquisition and Adjusted EBITDA from individually immaterial acquisitions after giving effect to such acquisitions as if each had occurred on January 1,
2016. GTT uses Adjusted EBITDA to evaluate operating performance, and this financial measure is among the primary measures we use for planning and forecasting future
periods. GTT further believes that the presentation of Adjusted EBITDA is relevant and useful for investors because it allows investors to view results in a manner similar to the
method used by management and makes it easier to compare GTT’s results with the results of other companies that have different financing and capital structures. However other
companies may define Adjusted EBITDA differently than GTT does, so its Adjusted EBITDA may not be fully comparable with those of other companies. In addition, the Company
has debt covenants that are based on a leverage ratio which utilizes a modified EBITDA calculation, as defined in its credit agreement. The modified EBITDA calculation in GTT’s
credit agreement is similar to its definition of Adjusted EBITDA; however it includes the pro forma Adjusted EBITDA of and expected cost synergies from the companies acquired
by GTT during the applicable reporting period. Finally, Adjusted EBITDA results, along with other quantitative and qualitative information, are utilized by management and GTT’s
compensation committee for purposes of determining bonus payouts to its employees.
Adjusted EBITDA less capital expenditures
Adjusted EBITDA less the cost of purchases of property and equipment during the indicated period , which GTT also refers to as capital expenditures, is a performance measure
that is used to evaluate the appropriate level of capital expenditures needed to support its expected revenue, and to provide a comparable view of GTT’s performance relative to
other telecommunications companies who may utilize different strategies for providing access to fiber-based services and related infrastructure. The Company uses a “capex light”
strategy, which means it purchases fiber-based services and related infrastructure from other providers on an as-needed basis, pursuant to its customers’ requirements. Many
other telecommunications companies spend significant amounts of capital expenditures to construct their own fiber networks and data centers, and attempt to purchase as little as
possible from other providers. As a result of GTT’s strategy, it typically has lower Adjusted EBITDA margins compared to other providers, but also spends much less on capital
expenditures relative to its revenue. GTT believes it is important to take both of these factors into account when evaluating its performance.
15
Non-GAAP Financial Information
Pro Forma Financial Information
In addition to financial measures prepared in accordance with GAAP, from time to time we may use or publicly disclose certain "pro forma”
financial measures. We believe certain pro forma financial measures provide a more comparable view of our results relative to prior
periods, particularly given the number of acquisitions we have completed in the past. The following unaudited pro forma financial
information and related notes present the historical financial information of GTT as if the acquisition of Hibernia had occurred on the first
day of the applicable period presented, and do not include any add-backs for expected post-acquisition cost synergies in pre-acquisition
periods. Note: pro forma information is only prepared for material acquisitions.
Constant Currency
We evaluate our results of operations both as reported and on a constant currency basis. The constant currency presentation, which is a
non-GAAP measure, excludes the impact of fluctuations in foreign currency exchange rates. We believe providing constant currency
information provides valuable supplemental information regarding our results of operations, consistent with how we evaluate our
performance. We calculate constant currency results by converting our current period local currency financial results using prior period
exchange rates and comparing these adjusted amounts to our prior period reported results.
16
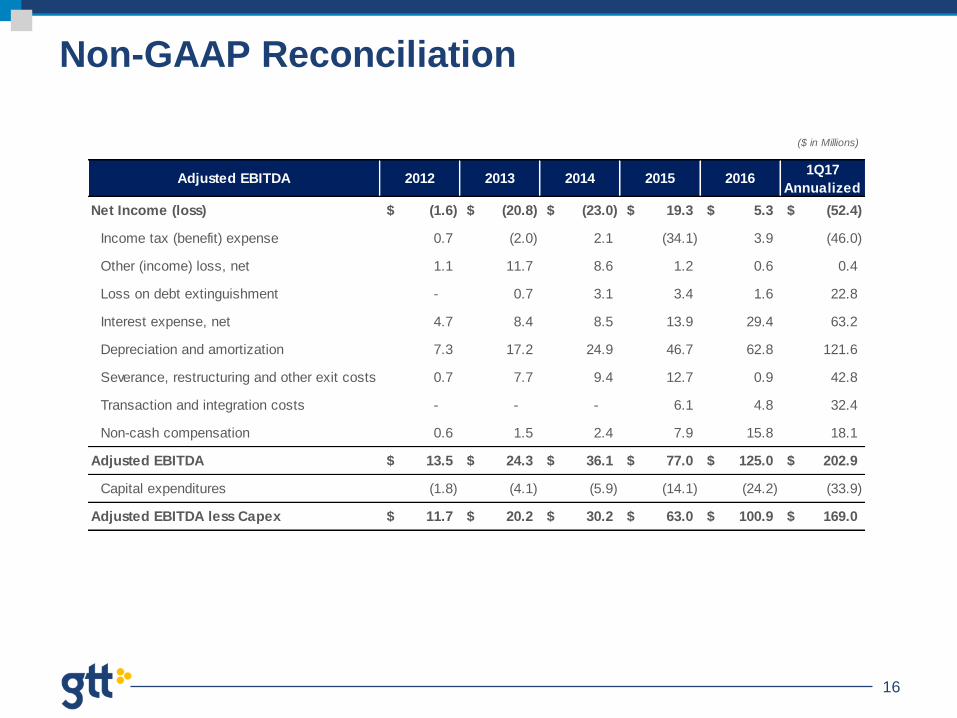
Non-GAAP Reconciliation
($ in Millions)
Adjusted EBITDA 2012 2013 2014 2015 20161Q17
Annualized
Net Income (loss) (1.6)$ (20.8)$ (23.0)$ 19.3$ 5.3$ (52.4)$
Income tax (benefit) expense 0.7 (2.0) 2.1 (34.1) 3.9 (46.0)
Other (income) loss, net 1.1 11.7 8.6 1.2 0.6 0.4
Loss on debt extinguishment - 0.7 3.1 3.4 1.6 22.8
Interest expense, net 4.7 8.4 8.5 13.9 29.4 63.2
Depreciation and amortization 7.3 17.2 24.9 46.7 62.8 121.6
Severance, restructuring and other exit costs 0.7 7.7 9.4 12.7 0.9 42.8
Transaction and integration costs - - - 6.1 4.8 32.4
Non-cash compensation 0.6 1.5 2.4 7.9 15.8 18.1
Adjusted EBITDA 13.5$ 24.3$ 36.1$ 77.0$ 125.0$ 202.9$
Capital expenditures (1.8) (4.1) (5.9) (14.1) (24.2) (33.9)
Adjusted EBITDA less Capex 11.7$ 20.2$ 30.2$ 63.0$ 100.9$ 169.0$
17
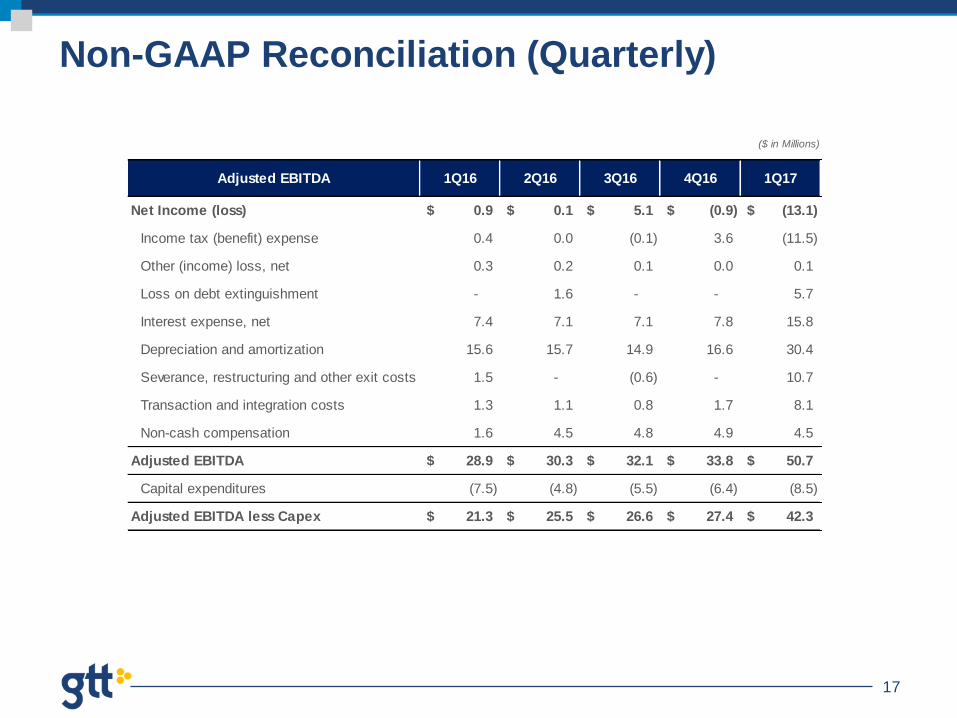
Non-GAAP Reconciliation (Quarterly)
($ in Millions)
Adjusted EBITDA 1Q16 2Q16 3Q16 4Q16 1Q17
Net Income (loss) 0.9$ 0.1$ 5.1$ (0.9)$ (13.1)$
Income tax (benefit) expense 0.4 0.0 (0.1) 3.6 (11.5)
Other (income) loss, net 0.3 0.2 0.1 0.0 0.1
Loss on debt extinguishment - 1.6 - - 5.7
Interest expense, net 7.4 7.1 7.1 7.8 15.8
Depreciation and amortization 15.6 15.7 14.9 16.6 30.4
Severance, restructuring and other exit costs 1.5 - (0.6) - 10.7
Transaction and integration costs 1.3 1.1 0.8 1.7 8.1
Non-cash compensation 1.6 4.5 4.8 4.9 4.5
Adjusted EBITDA 28.9$ 30.3$ 32.1$ 33.8$ 50.7$
Capital expenditures (7.5) (4.8) (5.5) (6.4) (8.5)
Adjusted EBITDA less Capex 21.3$ 25.5$ 26.6$ 27.4$ 42.3$
18
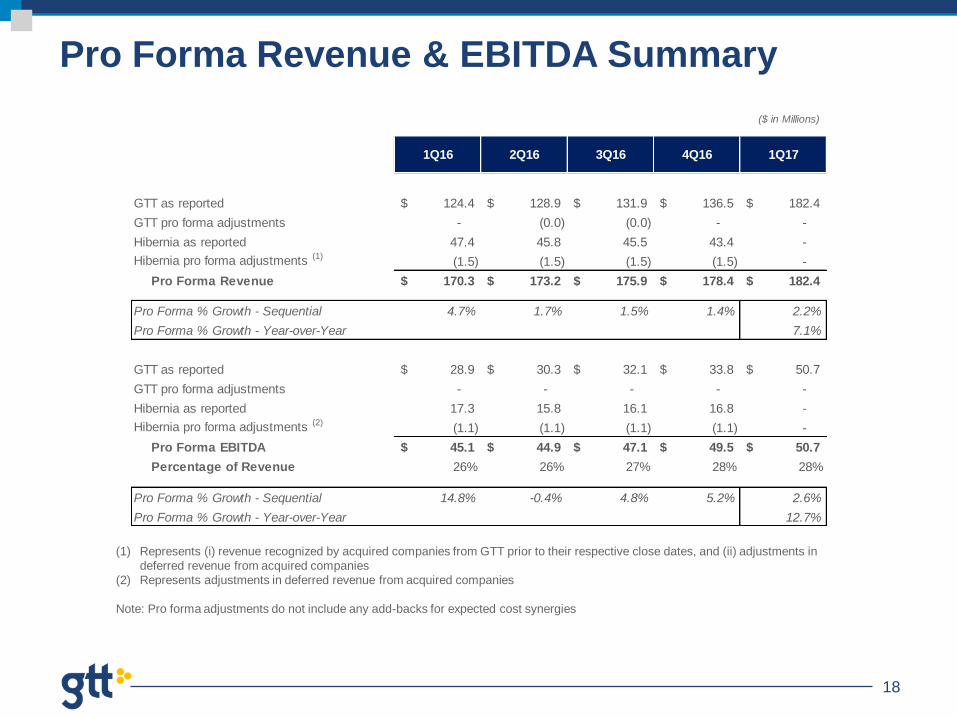
Pro Forma Revenue & EBITDA Summary
($ in Millions)
(1) Represents (i) revenue recognized by acquired companies from GTT prior to their respective close dates, and (ii) adjustments in
deferred revenue from acquired companies
(2) Represents adjustments in deferred revenue from acquired companies
Note: Pro forma adjustments do not include any add-backs for expected cost synergies
1Q16 2Q16 3Q16 4Q16 1Q17
GTT as reported 124.4$ 128.9$ 131.9$ 136.5$ 182.4$
GTT pro forma adjustments - (0.0) (0.0) - -
Hibernia as reported 47.4 45.8 45.5 43.4 -
Hibernia pro forma adjustments (1)(1.5) (1.5) (1.5) (1.5) -
Pro Forma Revenue 170.3$ 173.2$ 175.9$ 178.4$ 182.4$
Pro Forma % Growth - Sequential 4.7% 1.7% 1.5% 1.4% 2.2%
Pro Forma % Growth - Year-over-Year 7.1%
GTT as reported 28.9$ 30.3$ 32.1$ 33.8$ 50.7$
GTT pro forma adjustments - - - - -
Hibernia as reported 17.3 15.8 16.1 16.8 -
Hibernia pro forma adjustments (2)(1.1) (1.1) (1.1) (1.1) -
Pro Forma EBITDA 45.1$ 44.9$ 47.1$ 49.5$ 50.7$
Percentage of Revenue 26% 26% 27% 28% 28%
Pro Forma % Growth - Sequential 14.8% -0.4% 4.8% 5.2% 2.6%
Pro Forma % Growth - Year-over-Year 12.7%