Embed Size (px)
Citation preview
1
Investor Presentation June, 2015
2
Disclaimer
This presentation contains forward-looking statements which may be identified by their use of words contains “plans,” “expects,” “will,” “anticipates,” “believes,” “intends,” “projects,” “estimates” or other words of similar meaning. All statements that address expectations or projections about the future, including, but not limited to, statements about the strategy for growth, product development, market position, expenditures, and financial results, are forward-looking statements.
Forward-looking statements are based on certain assumptions and expectations of future events. The companies referred to in this presentation cannot guarantee that these assumptions and expectations are accurate or will be realised. The actual results, performance or achievements, could thus differ materially from those projected in any such forward-looking statements. These companies assume no responsibility to publicly amend, modify or revise any forward looking statements, on the basis of any subsequent developments, information or events, or otherwise
3
Agri Input Industry Overview
Company Update
AGRI INPUT INDUSTRY OVERVIEW
4

GLOBAL SCENARIO
5
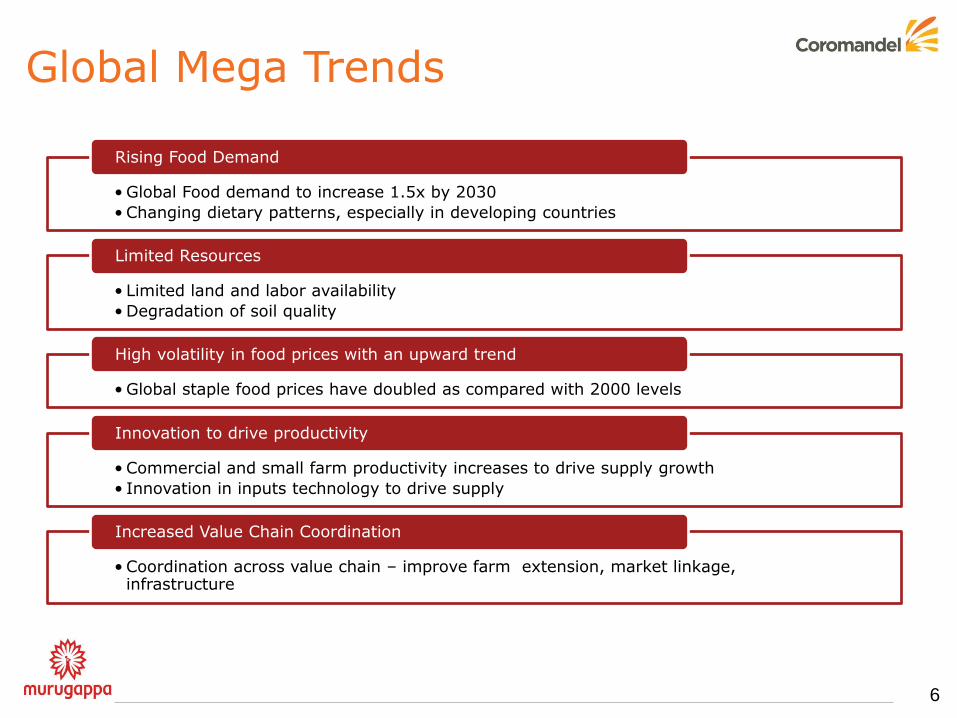
Global Mega Trends
6
• Global Food demand to increase 1.5x by 2030
• Changing dietary patterns, especially in developing countries
Rising Food Demand
• Limited land and labor availability
• Degradation of soil quality
Limited Resources
• Global staple food prices have doubled as compared with 2000 levels
High volatility in food prices with an upward trend
• Commercial and small farm productivity increases to drive supply growth
• Innovation in inputs technology to drive supply
Innovation to drive productivity
• Coordination across value chain – improve farm extension, market linkage, infrastructure
Increased Value Chain Coordination
7
"N" World Market
4%
52%
5%9%
11%
6%
13%
Ammonia
Urea
UAN
AN/CAN
NPK
DAP/MAP
Others
"P" World Market
48%
27%
17%
6% 2% DAP/MAP
NPK
SSP
TSP
Others
"K" World Market
70%
29%
1%
MOP/SOP
NPK
Others
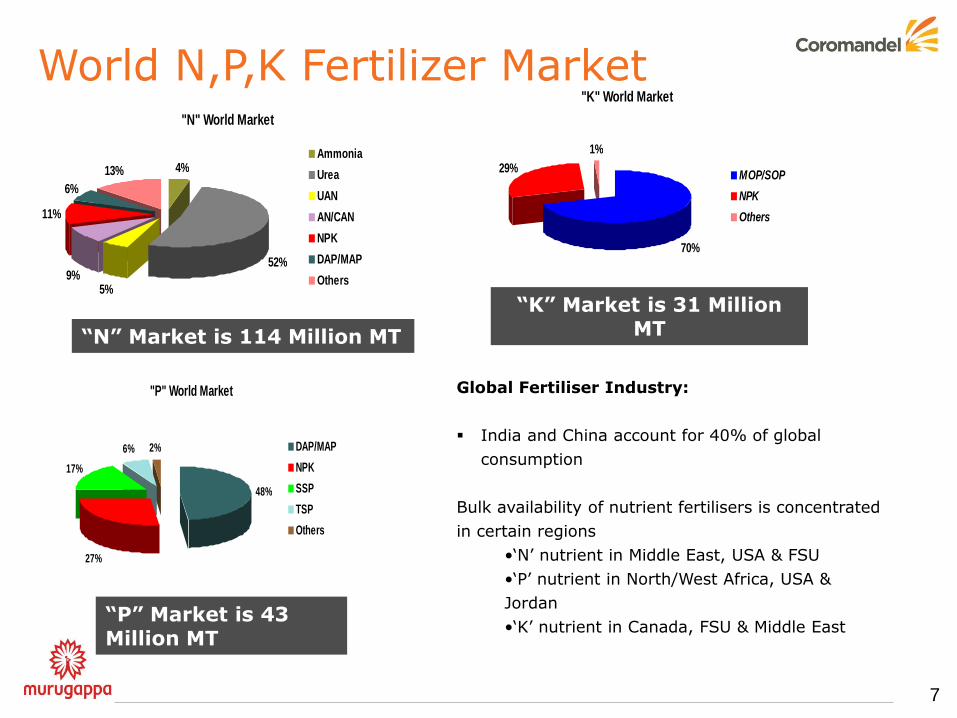
“N” Market is 114 Million MT
“P” Market is 43 Million MT
“K” Market is 31 Million MT
Global Fertiliser Industry:
India and China account for 40% of global
consumption
Bulk availability of nutrient fertilisers is concentrated
in certain regions
•„N‟ nutrient in Middle East, USA & FSU
•„P‟ nutrient in North/West Africa, USA &
Jordan
•„K‟ nutrient in Canada, FSU & Middle East
World N,P,K Fertilizer Market
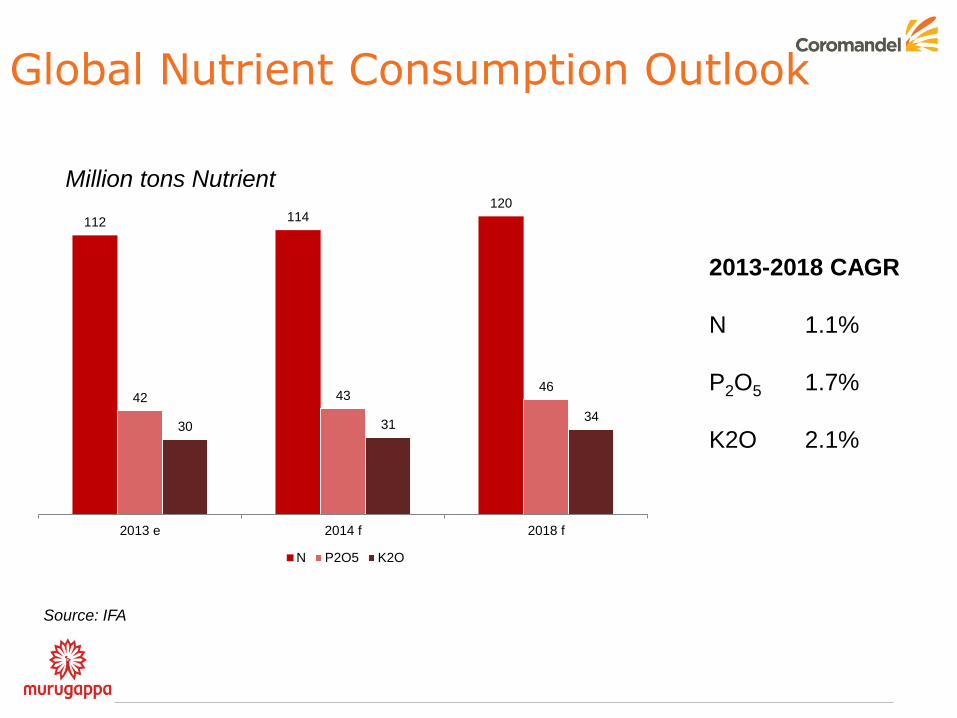
Global Nutrient Consumption Outlook
112 114 120
42 43 46
30 31 34
2013 e 2014 f 2018 f
N P2O5 K2O
2013-2018 CAGR
N 1.1%
P2O5 1.7%
K2O 2.1%
Million tons Nutrient
Source: IFA
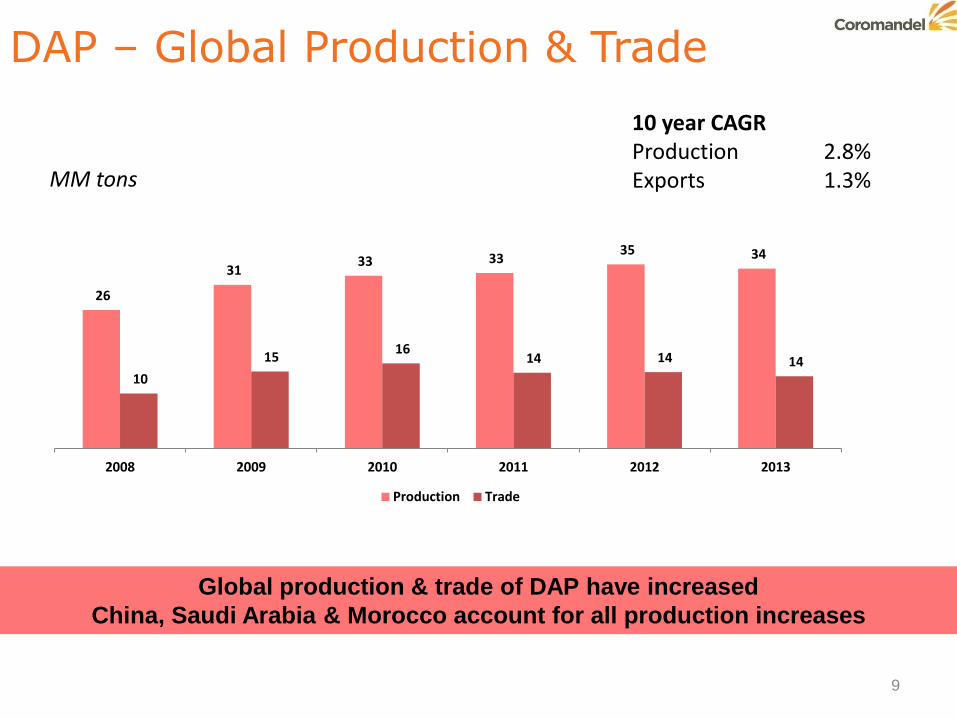
DAP – Global Production & Trade
MM tons
10 year CAGR Production 2.8% Exports 1.3%
Global production & trade of DAP have increased
China, Saudi Arabia & Morocco account for all production increases
9
26
31 33 33
35 34
10
15 16
14 14 14
2008 2009 2010 2011 2012 2013
Production Trade
INDIAN SCENARIO
10
11
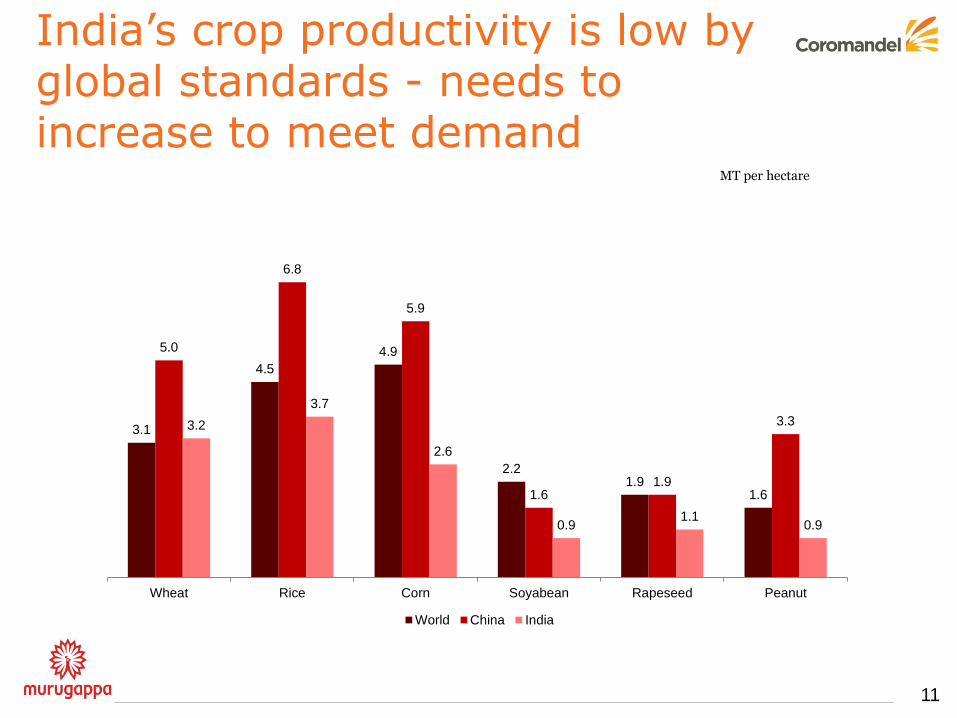
India‟s crop productivity is low by global standards - needs to increase to meet demand
MT per hectare
3.1
4.5
4.9
2.2 1.9
1.6
5.0
6.8
5.9
1.6 1.9
3.3 3.2
3.7
2.6
0.9 1.1
0.9
Wheat Rice Corn Soyabean Rapeseed Peanut
World China India
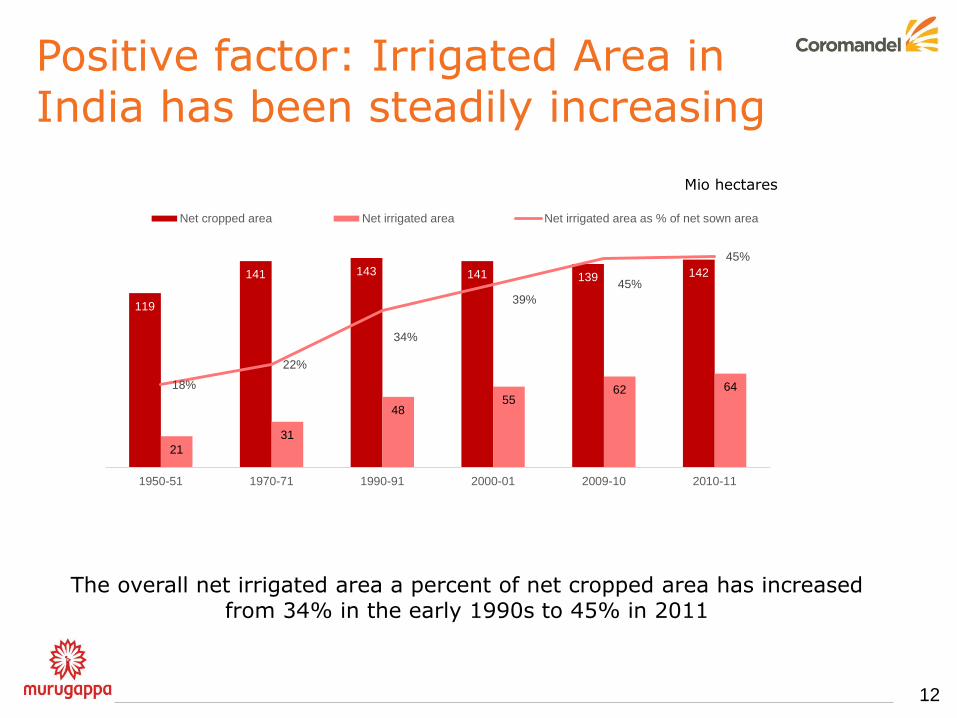
Positive factor: Irrigated Area in India has been steadily increasing
12
The overall net irrigated area a percent of net cropped area has increased from 34% in the early 1990s to 45% in 2011
119
141 143 141 139 142
21
31
48 55
62 64 18%
22%
34%
39%
45%
45%
0%
5%
10%
15%
20%
25%
30%
35%
40%
45%
50%
0
20
40
60
80
100
120
140
160
1950-51 1970-71 1990-91 2000-01 2009-10 2010-11
Net cropped area Net irrigated area Net irrigated area as % of net sown area
Mio hectares
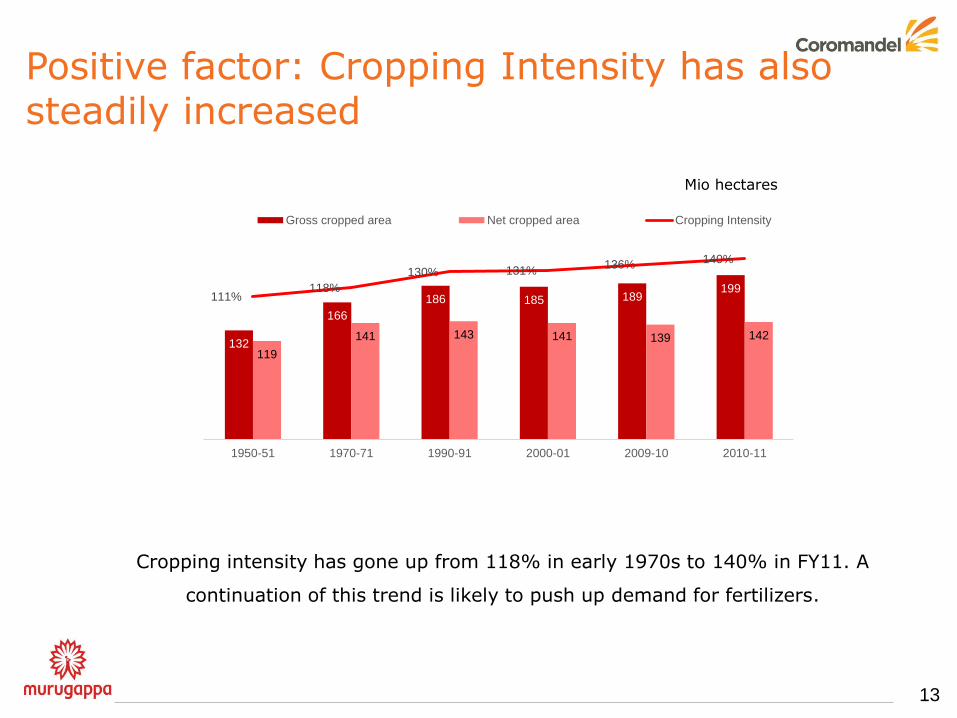
Positive factor: Cropping Intensity has also steadily increased
13
Cropping intensity has gone up from 118% in early 1970s to 140% in FY11. A
continuation of this trend is likely to push up demand for fertilizers.
132
166
186 185 189 199
119
141 143 141 139 142
111% 118%
130% 131% 136% 140%
0%
20%
40%
60%
80%
100%
120%
140%
160%
0
50
100
150
200
250
1950-51 1970-71 1990-91 2000-01 2009-10 2010-11
Gross cropped area Net cropped area Cropping Intensity
Mio hectares
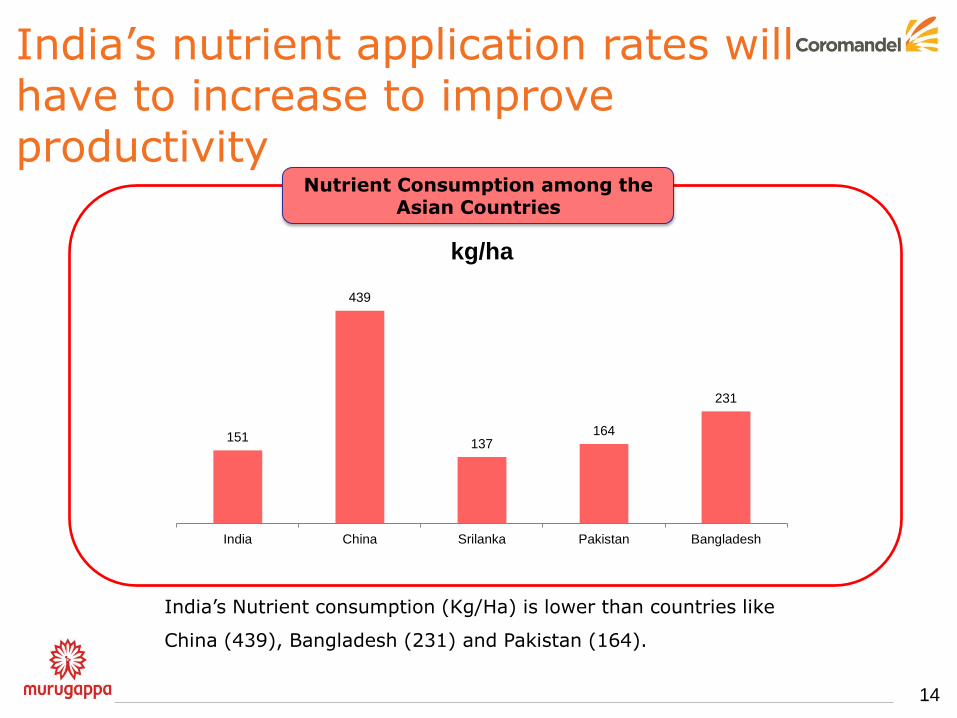
India‟s nutrient application rates will have to increase to improve productivity
Nutrient Consumption among the Asian Countries
India‟s Nutrient consumption (Kg/Ha) is lower than countries like
China (439), Bangladesh (231) and Pakistan (164).
14
151
439
137 164
231
India China Srilanka Pakistan Bangladesh
kg/ha
Long-term demand drivers and fundamentals are strong in India
15
• Population growth, urbanization and resulting food demand will be primary
growth drivers
– Population growth
– Urbanization and higher income levels
– Changing dietary mix
– Impact of Food Security Bill
• Nutrient application rates will have to increase from current levels to sustain
supply response to demand
• Cropping intensity, irrigation and other agricultural factors are improving
16
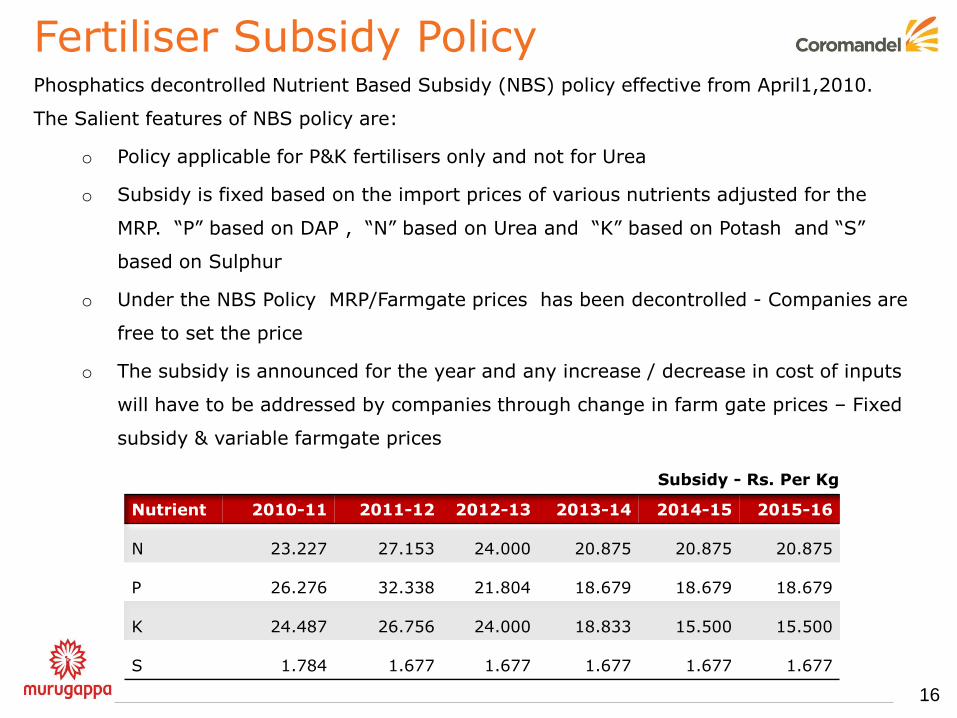
Fertiliser Subsidy Policy Phosphatics decontrolled Nutrient Based Subsidy (NBS) policy effective from April1,2010.
The Salient features of NBS policy are:
o Policy applicable for P&K fertilisers only and not for Urea
o Subsidy is fixed based on the import prices of various nutrients adjusted for the
MRP. “P” based on DAP , “N” based on Urea and “K” based on Potash and “S”
based on Sulphur
o Under the NBS Policy MRP/Farmgate prices has been decontrolled - Companies are
free to set the price
o The subsidy is announced for the year and any increase / decrease in cost of inputs
will have to be addressed by companies through change in farm gate prices – Fixed
subsidy & variable farmgate prices
Nutrient 2010-11 2011-12 2012-13 2013-14 2014-15 2015-16
N 23.227 27.153 24.000 20.875 20.875 20.875
P 26.276 32.338 21.804 18.679 18.679 18.679
K 24.487 26.756 24.000 18.833 15.500 15.500
S 1.784 1.677 1.677 1.677 1.677 1.677
Subsidy - Rs. Per Kg
17
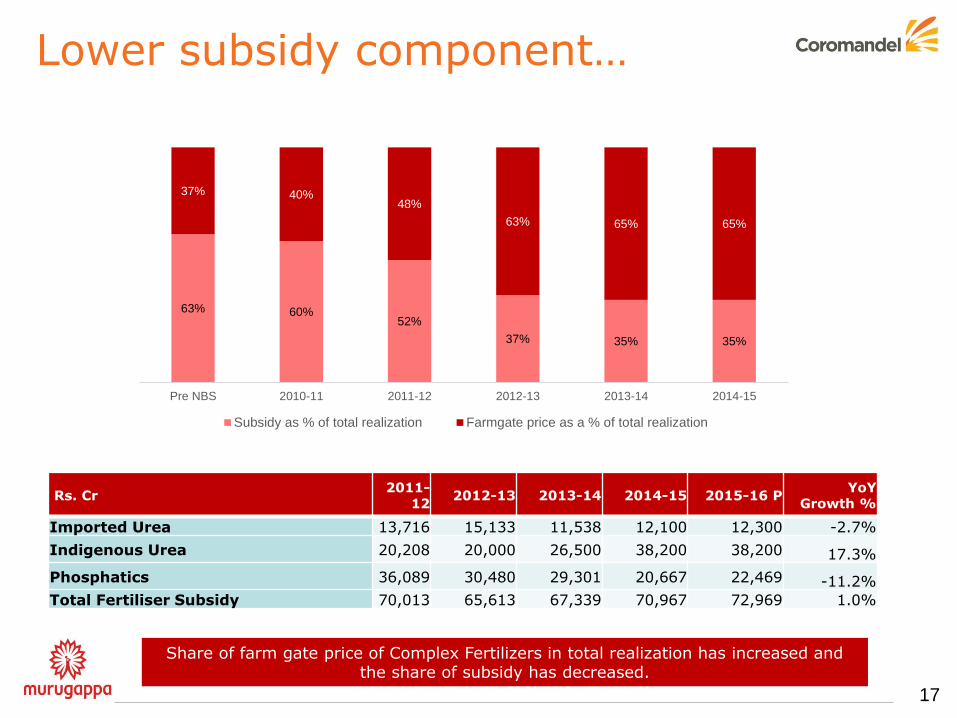
Lower subsidy component…
Share of farm gate price of Complex Fertilizers in total realization has increased and the share of subsidy has decreased.
Rs. Cr 2011-
12 2012-13 2013-14 2014-15 2015-16 P
YoY Growth %
Imported Urea 13,716 15,133 11,538 12,100 12,300 -2.7%
Indigenous Urea 20,208 20,000 26,500 38,200 38,200 17.3%
Phosphatics 36,089 30,480 29,301 20,667 22,469 -11.2%
Total Fertiliser Subsidy 70,013 65,613 67,339 70,967 72,969 1.0%
63% 60% 52%
37% 35% 35%
37% 40% 48%
63% 65% 65%
Pre NBS 2010-11 2011-12 2012-13 2013-14 2014-15
Subsidy as % of total realization Farmgate price as a % of total realization
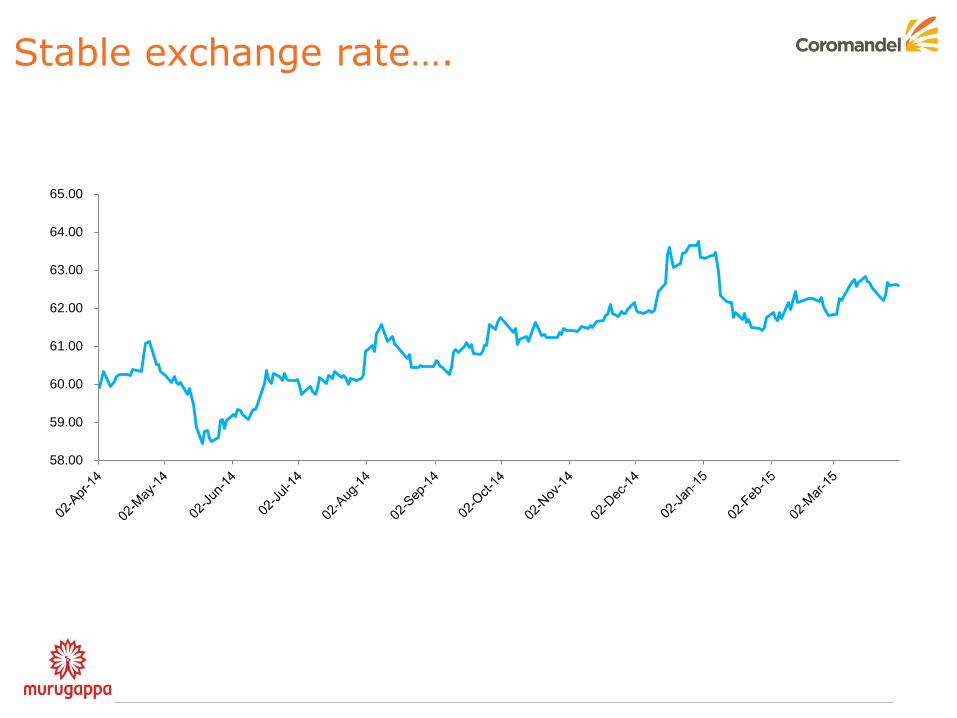
Stable exchange rate….
58.00
59.00
60.00
61.00
62.00
63.00
64.00
65.00
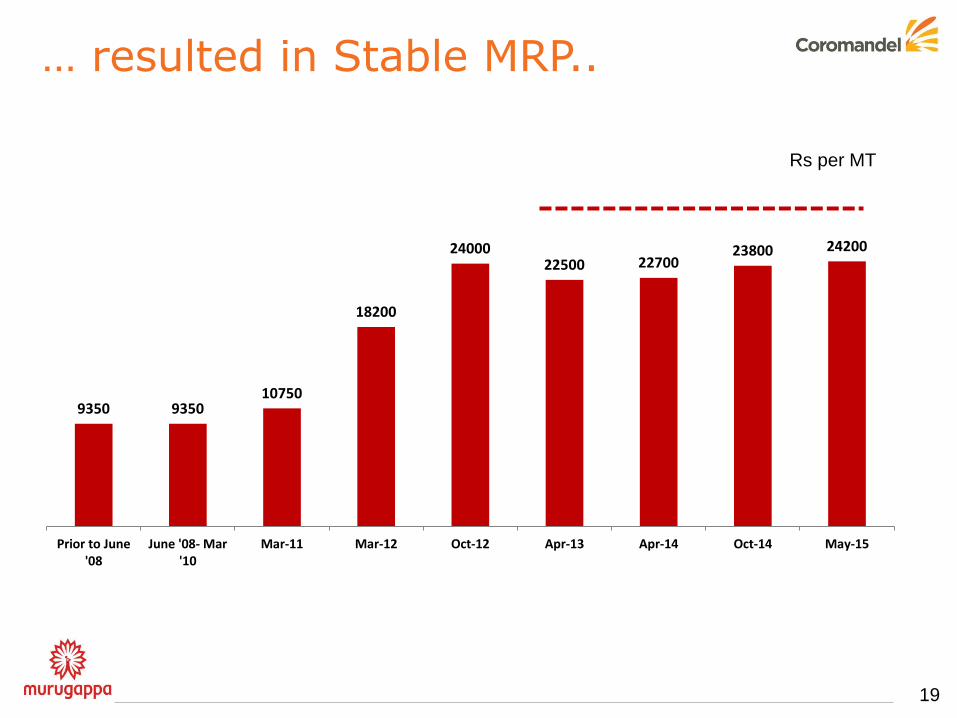
… resulted in Stable MRP..
19
Rs per MT
9350 9350 10750
18200
24000 22500 22700
23800 24200
Prior to June'08
June '08- Mar'10
Mar-11 Mar-12 Oct-12 Apr-13 Apr-14 Oct-14 May-15
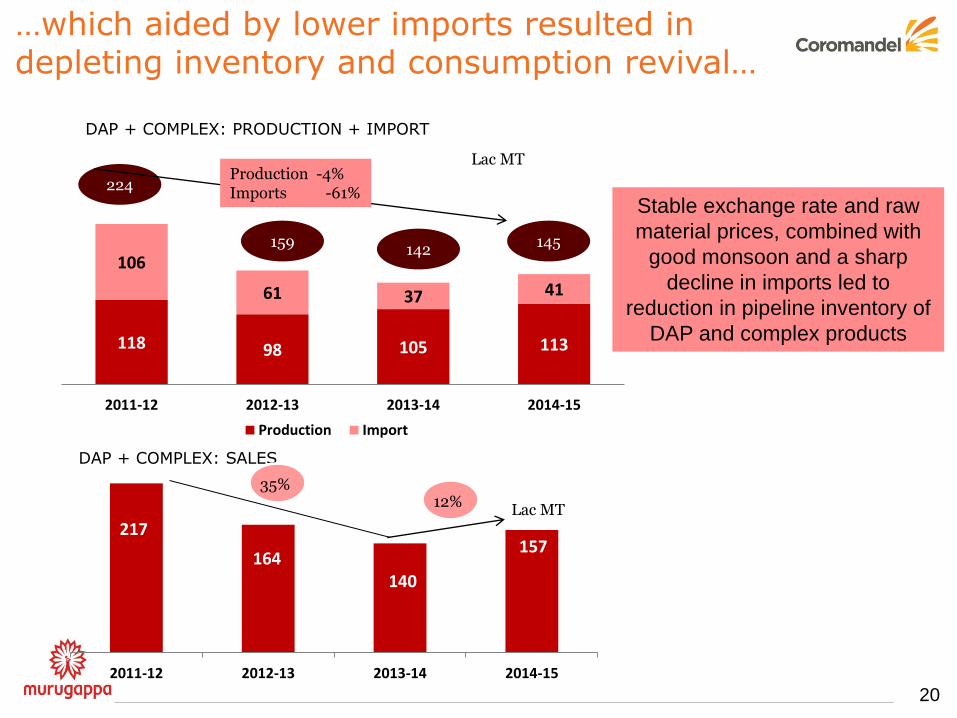
217
164 140
157
2011-12 2012-13 2013-14 2014-15
118 98 105 113
106
61 37 41
2011-12 2012-13 2013-14 2014-15
Production Import
…which aided by lower imports resulted in depleting inventory and consumption revival…
20
224
DAP + COMPLEX: PRODUCTION + IMPORT
DAP + COMPLEX: SALES
Lac MT Production -4% Imports -61%
159 142
Stable exchange rate and raw
material prices, combined with
good monsoon and a sharp
decline in imports led to
reduction in pipeline inventory of
DAP and complex products
12% Lac MT
145
35%
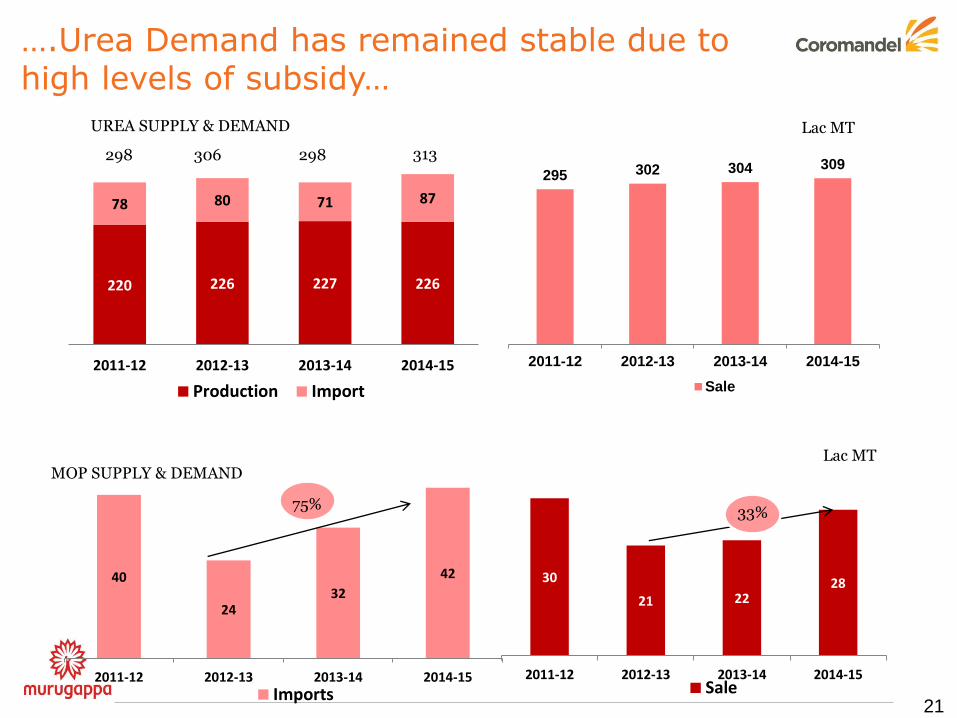
30
21 22 28
2011-12 2012-13 2013-14 2014-15Sale
40
24 32
42
2011-12 2012-13 2013-14 2014-15Imports
295 302 304 309
2011-12 2012-13 2013-14 2014-15
Sale
UREA SUPPLY & DEMAND Lac MT
….Urea Demand has remained stable due to high levels of subsidy…
21
298 306 298
75% 33%
MOP SUPPLY & DEMAND Lac MT
220 226 227 226
78 80 71 87
2011-12 2012-13 2013-14 2014-15
Production Import
313
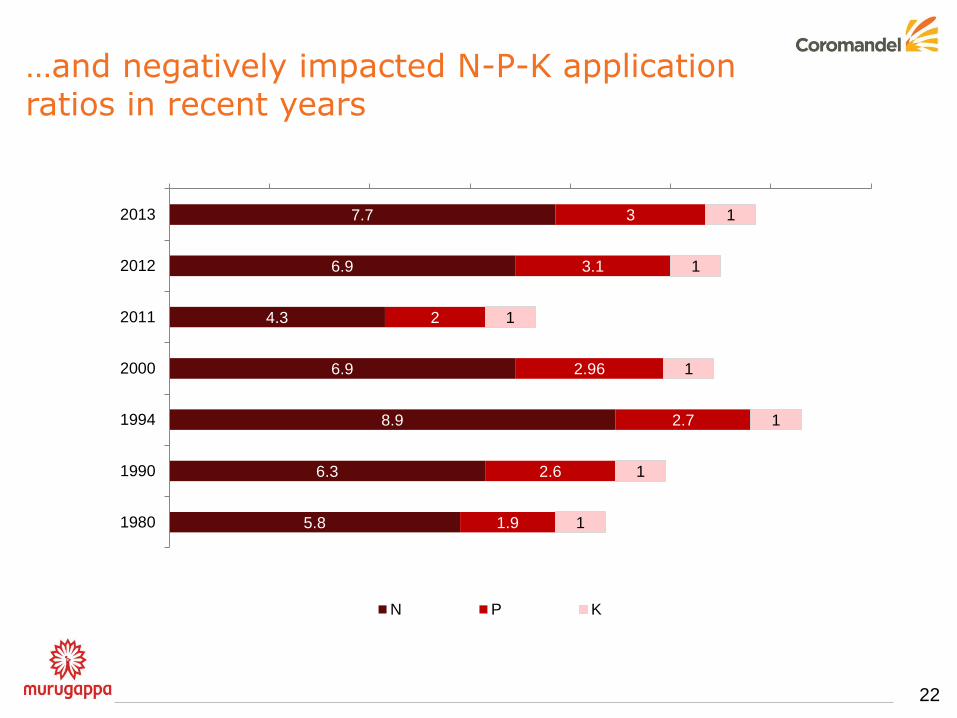
…and negatively impacted N-P-K application ratios in recent years
22
7.7
6.9
4.3
6.9
8.9
6.3
5.8
3
3.1
2
2.96
2.7
2.6
1.9
1
1
1
1
1
1
1
0 2 4 6 8 10 12 14
2013
2012
2011
2000
1994
1990
1980
N P K
COMPANY PROFILE
23
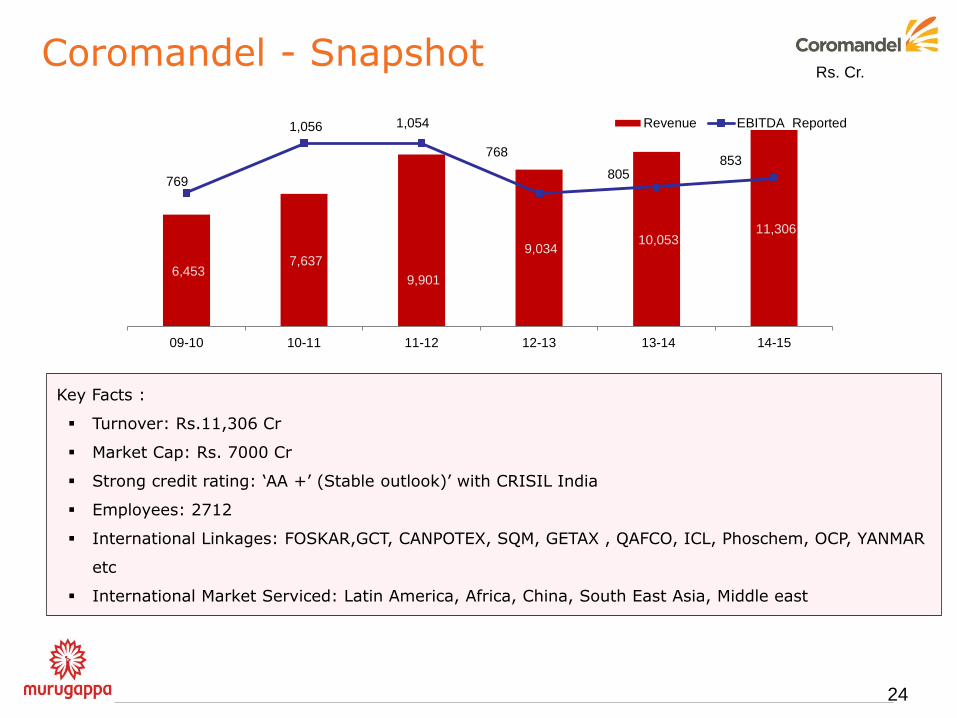
Coromandel - Snapshot
24
Key Facts :
Turnover: Rs.11,306 Cr
Market Cap: Rs. 7000 Cr
Strong credit rating: „AA +‟ (Stable outlook)‟ with CRISIL India
Employees: 2712
International Linkages: FOSKAR,GCT, CANPOTEX, SQM, GETAX , QAFCO, ICL, Phoschem, OCP, YANMAR
etc
International Market Serviced: Latin America, Africa, China, South East Asia, Middle east
Rs. Cr.
6,453 7,637
9,901
9,034 10,053
11,306
769
1,056 1,054
768
805 853
-
200
400
600
800
1,000
1,200
-
2,000
4,000
6,000
8,000
10,000
12,000
09-10 10-11 11-12 12-13 13-14 14-15
Revenue EBITDA Reported
25
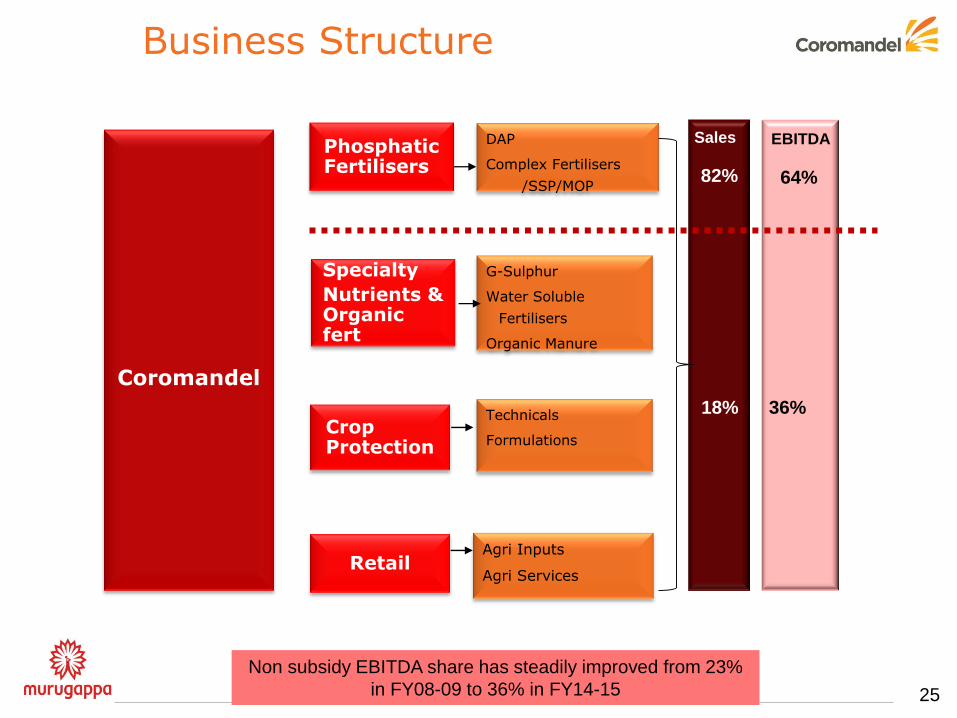
Business Structure
Coromandel
Phosphatic Fertilisers
Crop Protection
Retail
Specialty
Nutrients & Organic fert
DAP
Complex Fertilisers
/SSP/MOP
Technicals
Formulations
G-Sulphur
Water Soluble
Fertilisers
Organic Manure
Agri Inputs
Agri Services
64% 82%
36% 18%
Sales EBITDA
Non subsidy EBITDA share has steadily improved from 23%
in FY08-09 to 36% in FY14-15
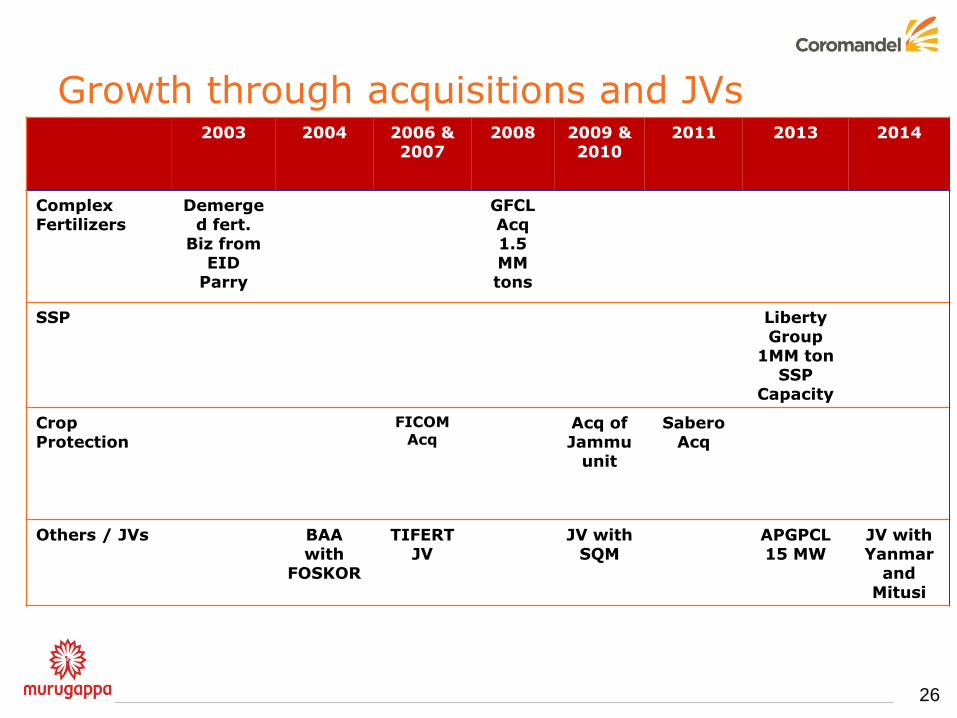
Growth through acquisitions and JVs
26
2003 2004 2006 & 2007
2008 2009 & 2010
2011 2013 2014
Complex Fertilizers
Demerged fert.
Biz from EID
Parry
GFCL Acq 1.5 MM tons
SSP Liberty Group
1MM ton SSP
Capacity
Crop Protection
FICOM Acq
Acq of Jammu
unit
Sabero Acq
Others / JVs BAA with
FOSKOR
TIFERT JV
JV with SQM
APGPCL 15 MW
JV with Yanmar
and Mitusi
27
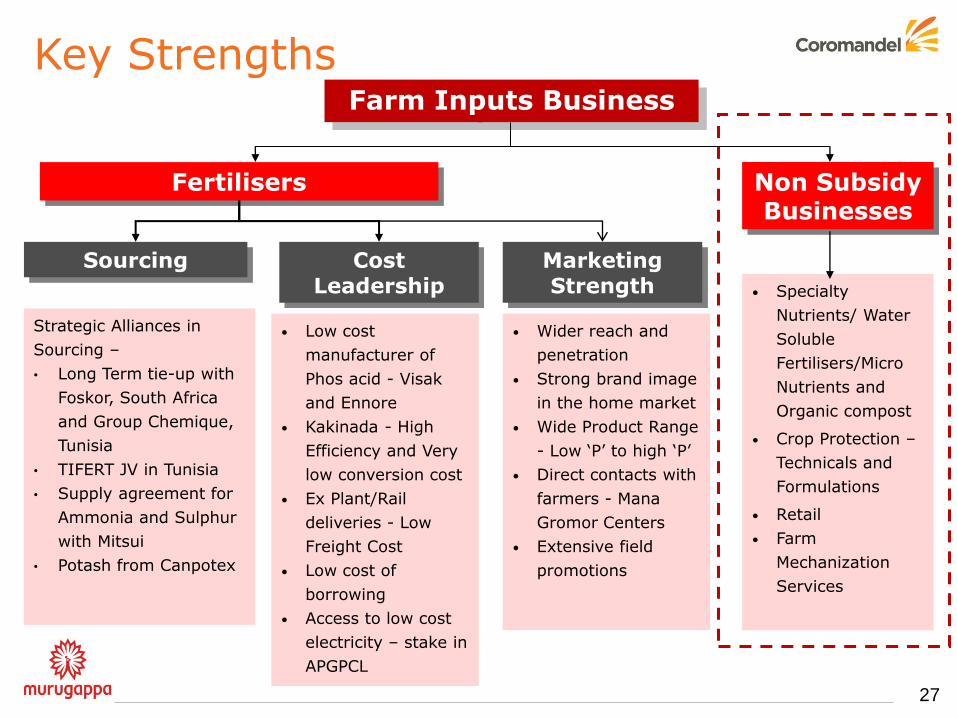
Key Strengths Farm Inputs Business
Cost Leadership
Fertilisers Non Subsidy Businesses
Sourcing
Strategic Alliances in
Sourcing –
• Long Term tie-up with
Foskor, South Africa
and Group Chemique,
Tunisia
• TIFERT JV in Tunisia
• Supply agreement for
Ammonia and Sulphur
with Mitsui
• Potash from Canpotex
• Low cost
manufacturer of
Phos acid - Visak
and Ennore
• Kakinada - High
Efficiency and Very
low conversion cost
• Ex Plant/Rail
deliveries - Low
Freight Cost
• Low cost of
borrowing
• Access to low cost
electricity – stake in
APGPCL
Marketing Strength
• Wider reach and
penetration
• Strong brand image
in the home market
• Wide Product Range
- Low „P‟ to high „P‟
• Direct contacts with
farmers - Mana
Gromor Centers
• Extensive field
promotions
• Specialty
Nutrients/ Water
Soluble
Fertilisers/Micro
Nutrients and
Organic compost
• Crop Protection –
Technicals and
Formulations
• Retail
• Farm
Mechanization
Services
28
Coromandel‟s Fertilisers Business
29
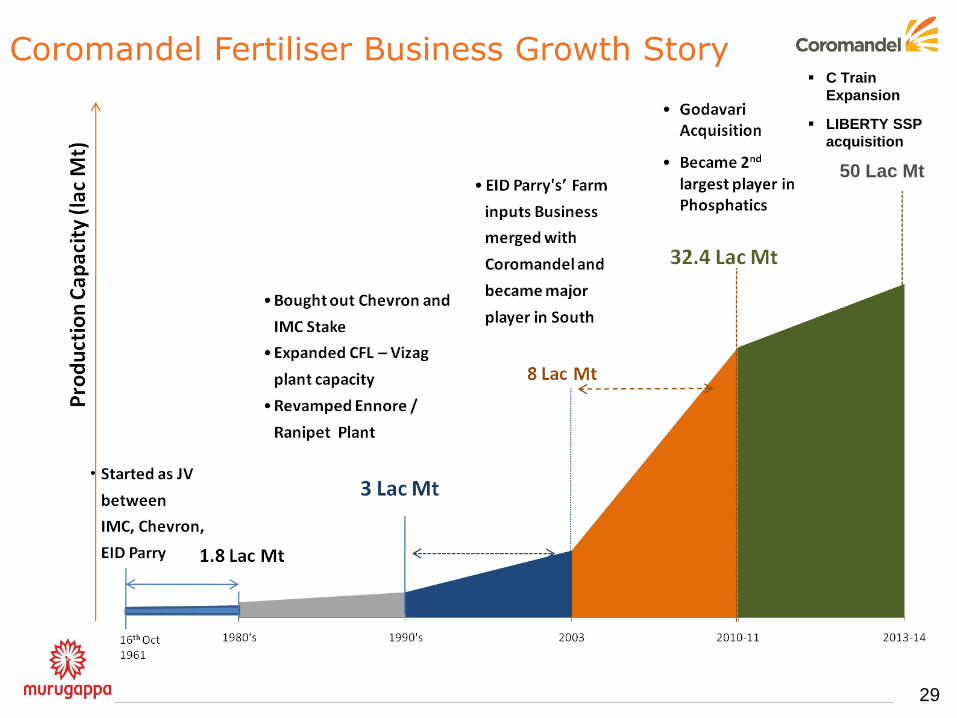
Coromandel Fertiliser Business Growth Story
50 Lac Mt
C Train
Expansion
LIBERTY SSP
acquisition
30
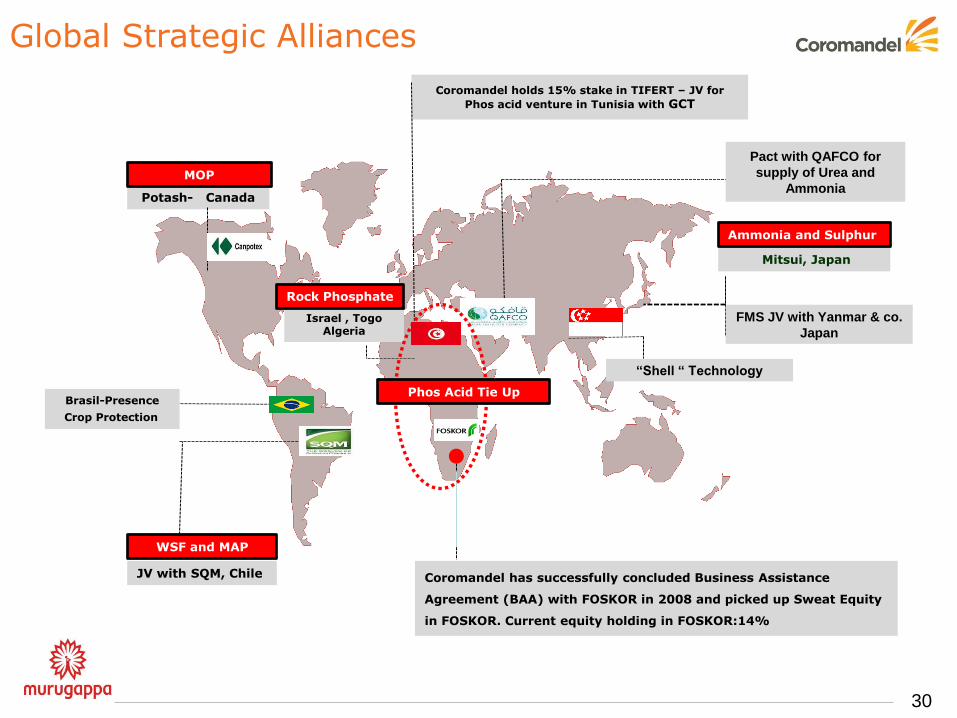
Global Strategic Alliances Alliances for Key raw
materials
Coromandel has successfully concluded Business Assistance
Agreement (BAA) with FOSKOR in 2008 and picked up Sweat Equity
in FOSKOR. Current equity holding in FOSKOR:14%
JV with SQM, Chile
Mitsui, Japan
Potash- Canada
Coromandel holds 15% stake in TIFERT – JV for
Phos acid venture in Tunisia with GCT
WSF and MAP
MOP
Ammonia and Sulphur
Israel , Togo Algeria
Rock Phosphate
Pact with QAFCO for
supply of Urea and
Ammonia
FMS JV with Yanmar & co.
Japan
“Shell “ Technology
Phos Acid Tie Up Brasil-Presence
Crop Protection
31
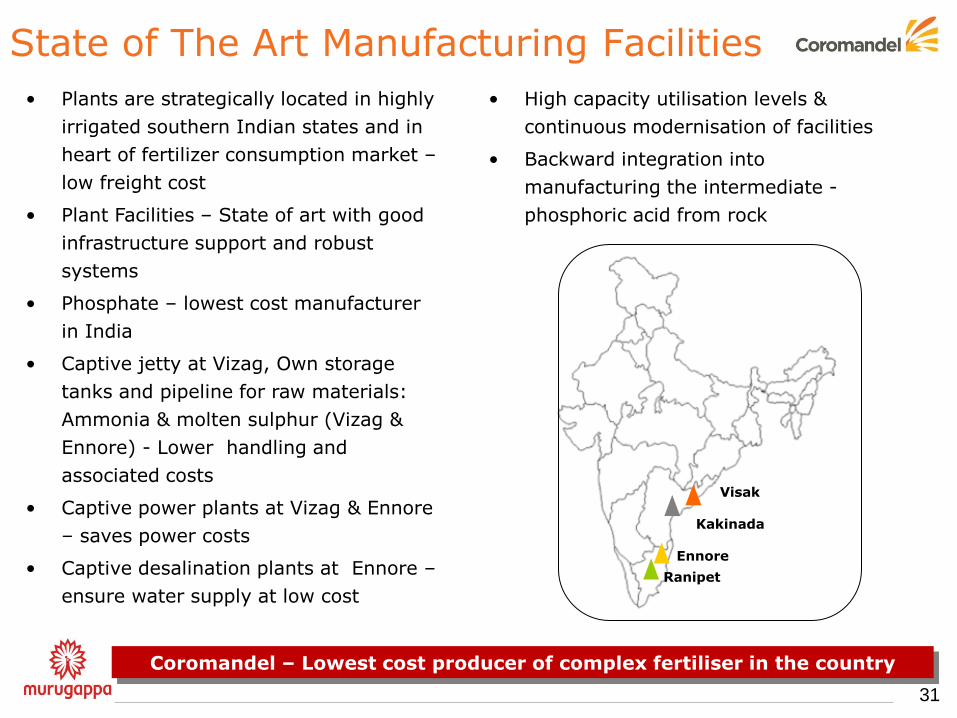
State of The Art Manufacturing Facilities
Coromandel – Lowest cost producer of complex fertiliser in the country
• Plants are strategically located in highly
irrigated southern Indian states and in
heart of fertilizer consumption market –
low freight cost
• Plant Facilities – State of art with good
infrastructure support and robust
systems
• Phosphate – lowest cost manufacturer
in India
• Captive jetty at Vizag, Own storage
tanks and pipeline for raw materials:
Ammonia & molten sulphur (Vizag &
Ennore) - Lower handling and
associated costs
• Captive power plants at Vizag & Ennore
– saves power costs
• Captive desalination plants at Ennore –
ensure water supply at low cost
• High capacity utilisation levels &
continuous modernisation of facilities
• Backward integration into
manufacturing the intermediate -
phosphoric acid from rock
Visak
Kakinada
Ennore
Ranipet
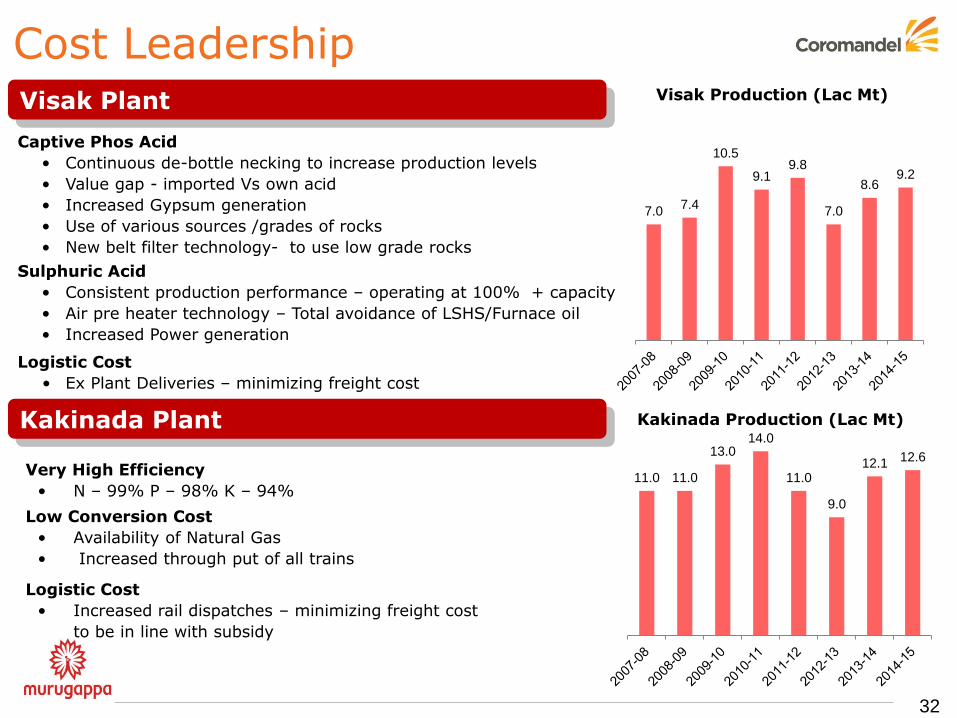
11.0 11.0
13.0 14.0
11.0
9.0
12.1 12.6
32
Captive Phos Acid
• Continuous de-bottle necking to increase production levels
• Value gap - imported Vs own acid
• Increased Gypsum generation
• Use of various sources /grades of rocks
• New belt filter technology- to use low grade rocks
Sulphuric Acid
• Consistent production performance – operating at 100% + capacity
• Air pre heater technology – Total avoidance of LSHS/Furnace oil
• Increased Power generation
Cost Leadership
Very High Efficiency
• N – 99% P – 98% K – 94%
Low Conversion Cost
• Availability of Natural Gas
• Increased through put of all trains
Logistic Cost
• Increased rail dispatches – minimizing freight cost
to be in line with subsidy
Logistic Cost
• Ex Plant Deliveries – minimizing freight cost
Kakinada Production (Lac Mt)
Visak Production (Lac Mt) Visak Plant
Kakinada Plant
7.0 7.4
10.5
9.1 9.8
7.0
8.6 9.2
33
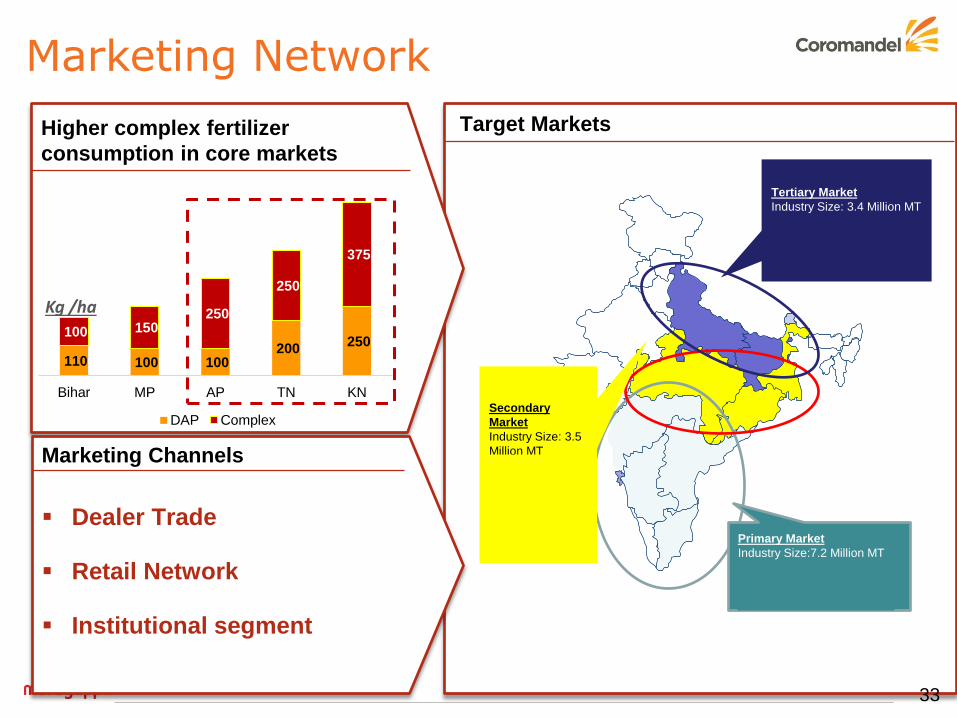
Marketing Network
Marketing Channels
Dealer Trade
Retail Network
Institutional segment
Target Markets
110 100 100 200
250 100 150
250
250
375
Bihar MP AP TN KN
DAP Complex
Kg /ha
Primary Market
Industry Size:7.2 Million MT
Coromandel’s Target : 2.35
Million MT
Percentage Share: 33%
Tertiary Market
Industry Size: 3.4 Million MT
Coromandel’s Target: 0.25
Million MT
Percentage Share: 7%
Secondary
Market
Industry Size: 3.5
Million MT
Coromandel’s
Target :
0.45Million MT
Percentage
Share: 13%
Higher complex fertilizer
consumption in core markets
34
Specialty Nutrient Business
35
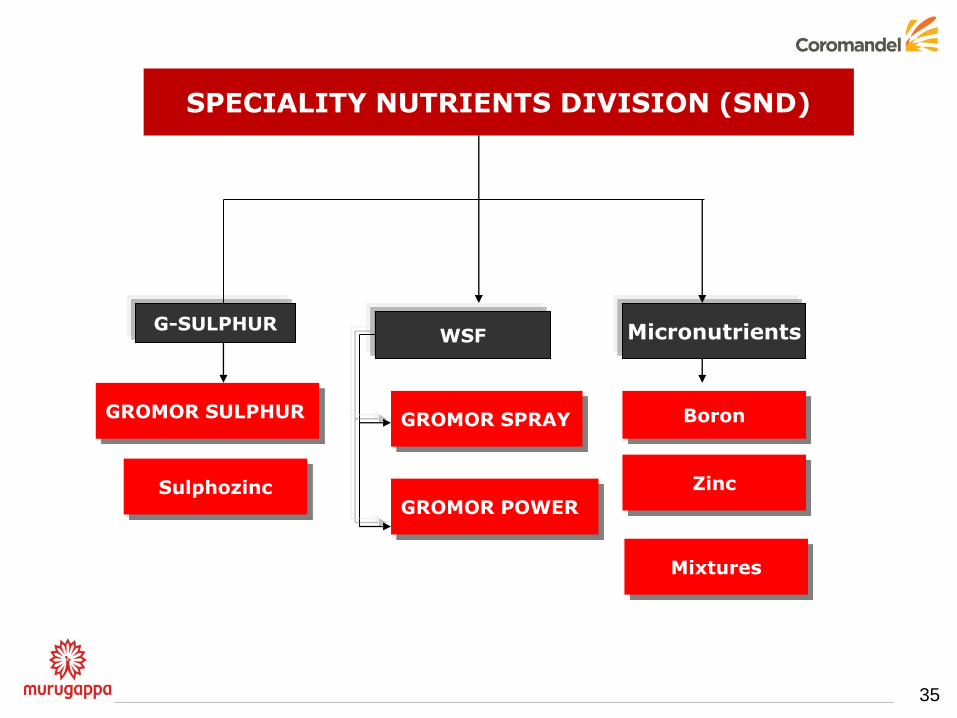
SPECIALITY NUTRIENTS DIVISION (SND)
G-SULPHUR WSF Micronutrients
GROMOR SULPHUR GROMOR SPRAY
GROMOR POWER
Zinc Sulphozinc
Boron
Mixtures
36
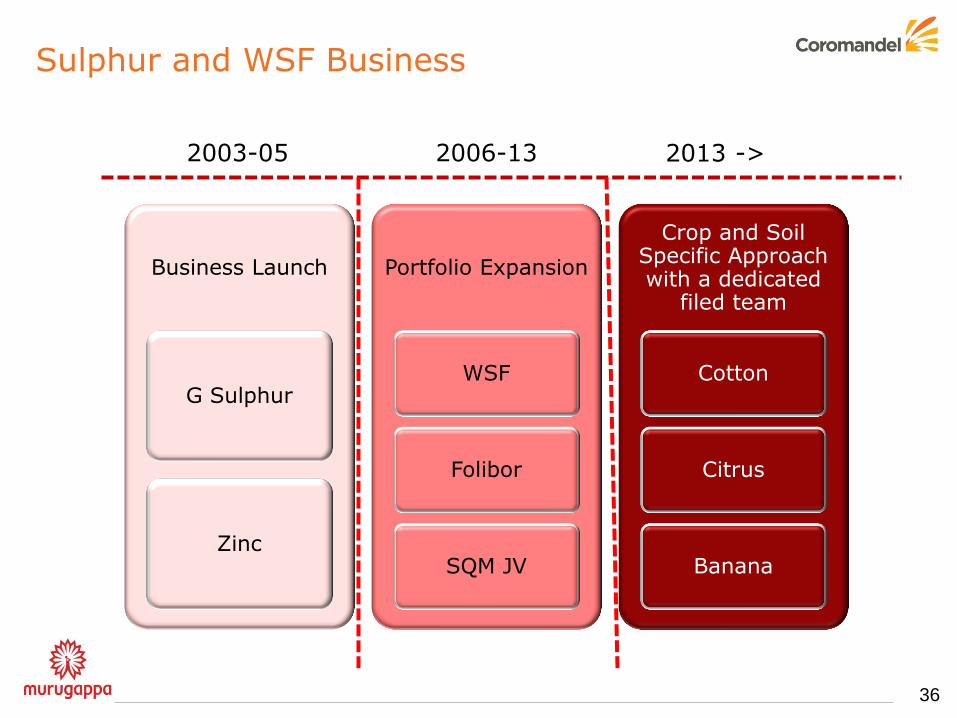
Sulphur and WSF Business
Business Launch
G Sulphur
Zinc
Portfolio Expansion
WSF
Folibor
SQM JV
Crop and Soil Specific Approach with a dedicated
filed team
Cotton
Citrus
Banana
2003-05 2006-13 2013 ->
37
Continuous innovation to introduce customized products suitable to soil, region
and crop requirements - Improve nutrient use efficiency
Leverage SQM to bring global best practices in crop nutrition management
Independent & specialized marketing teams to bring crop focus- Developing
market based on total nutrition package
Crop based and soil based new product introduction to address farmer needs
SND Strategy
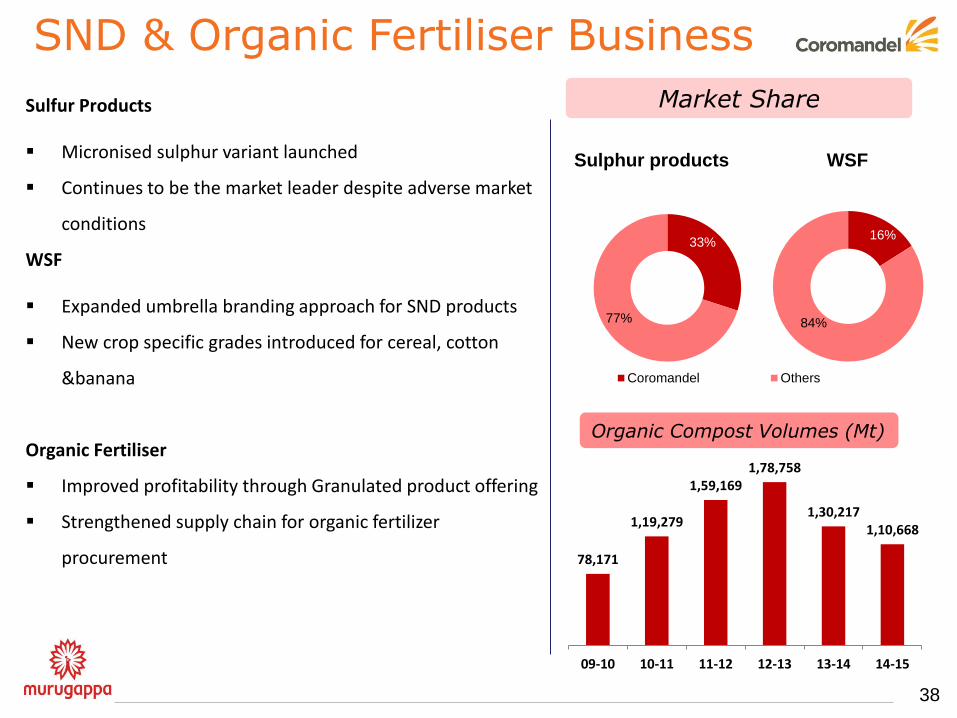
Sulfur Products
Micronised sulphur variant launched
Continues to be the market leader despite adverse market
conditions
WSF
Expanded umbrella branding approach for SND products
New crop specific grades introduced for cereal, cotton
&banana
Organic Fertiliser
Improved profitability through Granulated product offering
Strengthened supply chain for organic fertilizer
procurement
SND & Organic Fertiliser Business
38
Organic Compost Volumes (Mt)
Sulphur products
33%
77%
Coromandel Others
16%
84%
WSF
Market Share
78,171
1,19,279
1,59,169 1,78,758
1,30,217 1,10,668
09-10 10-11 11-12 12-13 13-14 14-15
39
Crop Protection Business
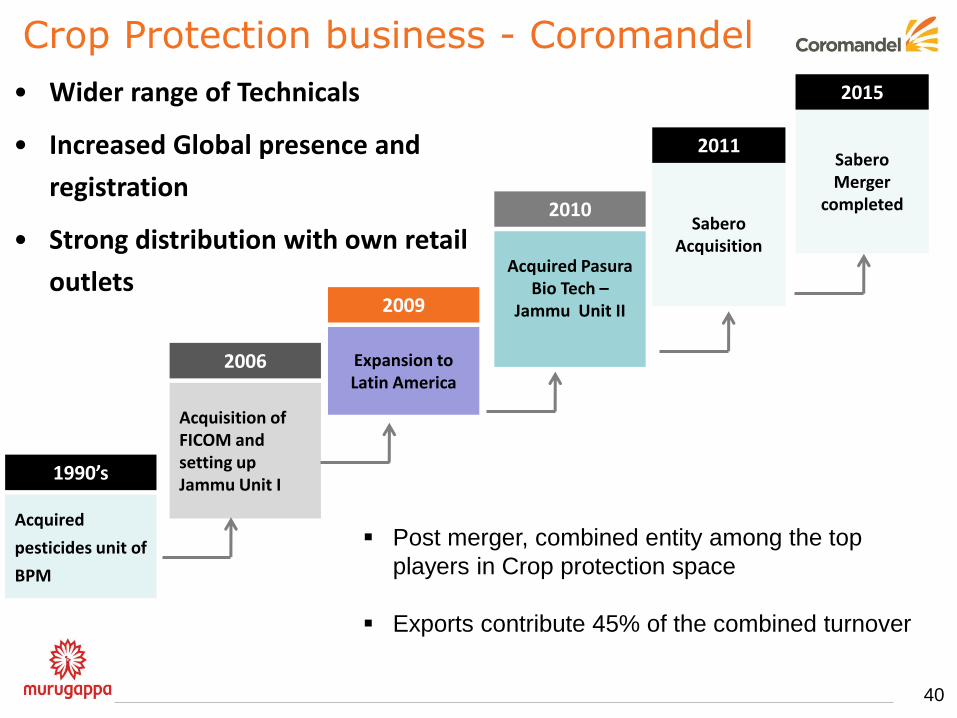
• Wider range of Technicals
• Increased Global presence and
registration
• Strong distribution with own retail
outlets
Acquisition of FICOM and setting up Jammu Unit I
Expansion to Latin America
Acquired Pasura Bio Tech –
Jammu Unit II
Sabero Acquisition
2006
2010
2011
2009
Acquired
pesticides unit of
BPM
1990’s
Crop Protection business - Coromandel
40
Sabero Merger
completed
2015
Post merger, combined entity among the top
players in Crop protection space
Exports contribute 45% of the combined turnover
Crop Protection Strategy
Increase R&D focus – Starting R&D center for crop protection business in
Hyderabad
Improving souring efficiency and generate market information through
China office
Expand business in LATAM, Africa and APAC by leveraging strong
registration portfolio
Focus on Export Registrations to improve market penetration
41
42
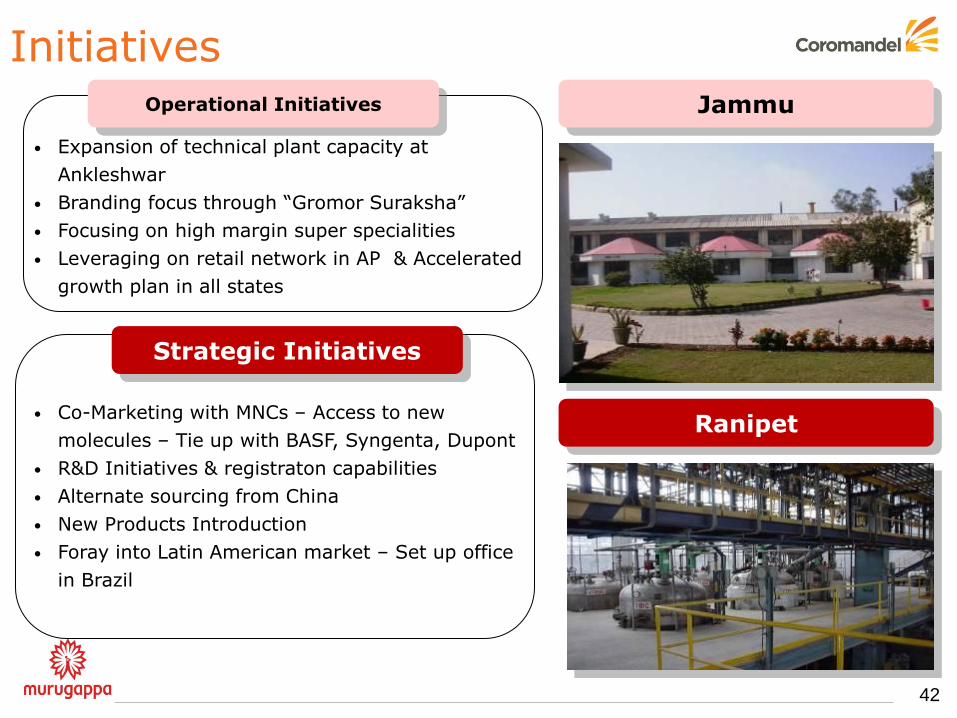
Initiatives
• Expansion of technical plant capacity at
Ankleshwar
• Branding focus through “Gromor Suraksha”
• Focusing on high margin super specialities
• Leveraging on retail network in AP & Accelerated
growth plan in all states
• Co-Marketing with MNCs – Access to new
molecules – Tie up with BASF, Syngenta, Dupont
• R&D Initiatives & registraton capabilities
• Alternate sourcing from China
• New Products Introduction
• Foray into Latin American market – Set up office
in Brazil
Jammu
Ranipet
Operational Initiatives
Strategic Initiatives
43
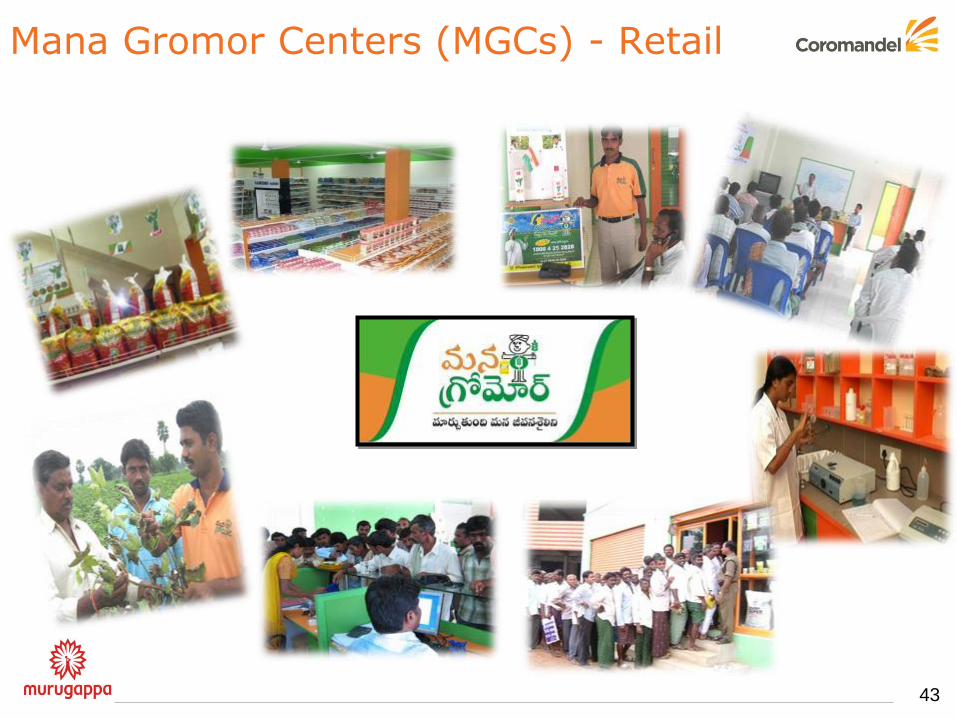
Mana Gromor Centers (MGCs) - Retail
Retail Strategy
Positioning Retail as a complete “Farming Solutions” platform
Constantly deliver significantly improved customer value proposition than
competition in terms of products & services
Leverage farm implements knowledge of Yanmar to expand operations
Increasing business efficiencies and margin expansion
Strengthening Multi brand and expansion of range assortment
44
45
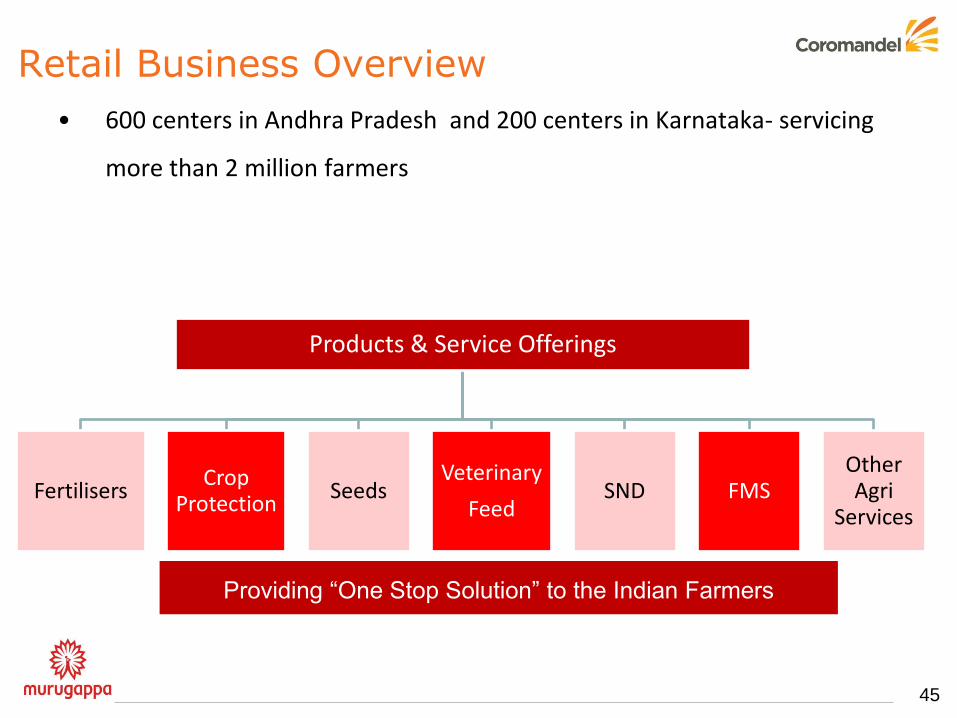
Products & Service Offerings
Fertilisers Crop
Protection Seeds
Veterinary
Feed SND FMS
Other Agri
Services
Providing “One Stop Solution” to the Indian Farmers
• 600 centers in Andhra Pradesh and 200 centers in Karnataka- servicing
more than 2 million farmers
Retail Business Overview
46
Financial Performance
47
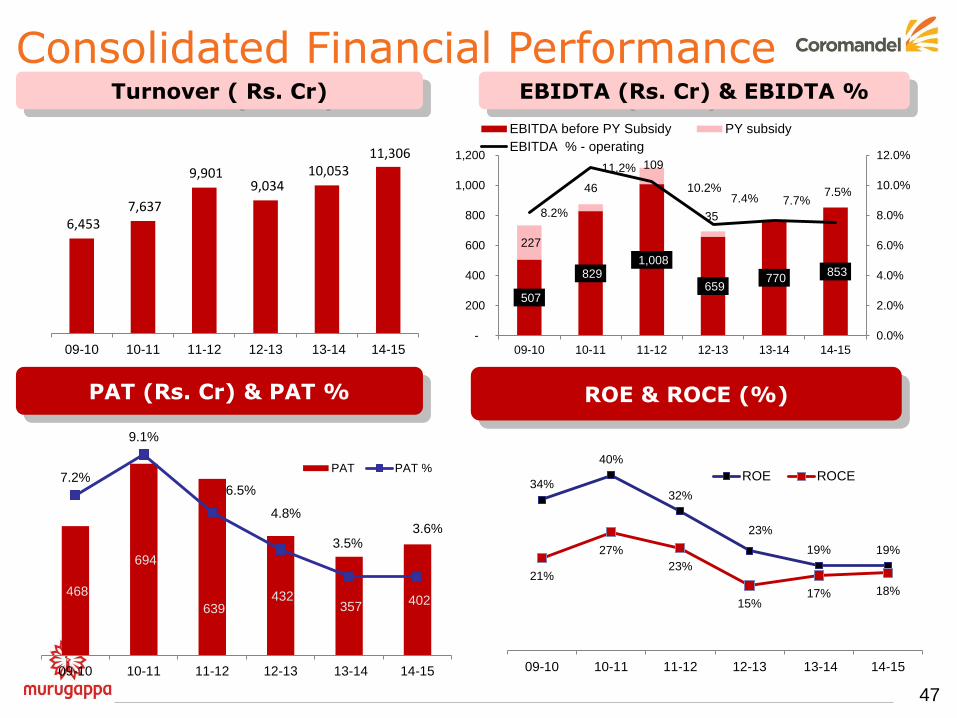
Consolidated Financial Performance Turnover ( Rs. Cr)
EBIDTA (Rs. Cr) & EBIDTA %
ROE & ROCE (%) PAT (Rs. Cr) & PAT %
6,453 7,637
9,901 9,034
10,053 11,306
09-10 10-11 11-12 12-13 13-14 14-15
468
694
639 432
357 402
7.2%
9.1%
6.5%
4.8%
3.5% 3.6%
0.0%
1.0%
2.0%
3.0%
4.0%
5.0%
6.0%
7.0%
8.0%
9.0%
10.0%
-
100
200
300
400
500
600
700
800
09-10 10-11 11-12 12-13 13-14 14-15
PAT PAT %
34%
40%
32%
23%
19% 19%
21%
27%
23%
15% 17% 18%
09-10 10-11 11-12 12-13 13-14 14-15
ROE ROCE
507
829 1,008
659 770
853
227
46
109
35 8.2%
11.2%
10.2% 7.4% 7.7%
7.5%
0.0%
2.0%
4.0%
6.0%
8.0%
10.0%
12.0%
-
200
400
600
800
1,000
1,200
09-10 10-11 11-12 12-13 13-14 14-15
EBITDA before PY Subsidy PY subsidy
EBITDA % - operating
48
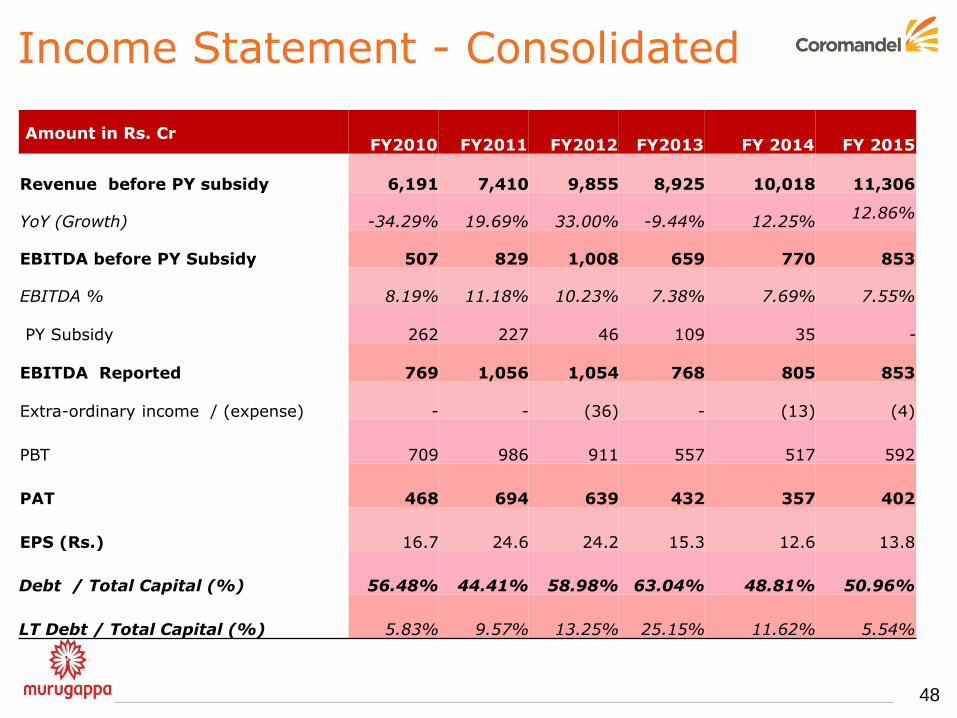
Income Statement - Consolidated
Amount in Rs. Cr FY2010 FY2011 FY2012 FY2013 FY 2014 FY 2015
Revenue before PY subsidy 6,191 7,410 9,855 8,925 10,018 11,306
YoY (Growth) -34.29% 19.69% 33.00% -9.44% 12.25% 12.86%
EBITDA before PY Subsidy 507 829 1,008 659 770 853
EBITDA % 8.19% 11.18% 10.23% 7.38% 7.69% 7.55%
PY Subsidy
262
227
46
109
35 -
EBITDA Reported
769
1,056
1,054
768
805 853
Extra-ordinary income / (expense)
-
-
(36)
-
(13) (4)
PBT
709
986
911
557
517 592
PAT
468
694
639
432
357 402
EPS (Rs.) 16.7 24.6 24.2 15.3 12.6 13.8
Debt / Total Capital (%) 56.48% 44.41% 58.98% 63.04% 48.81% 50.96%
LT Debt / Total Capital (%) 5.83% 9.57% 13.25% 25.15% 11.62% 5.54%
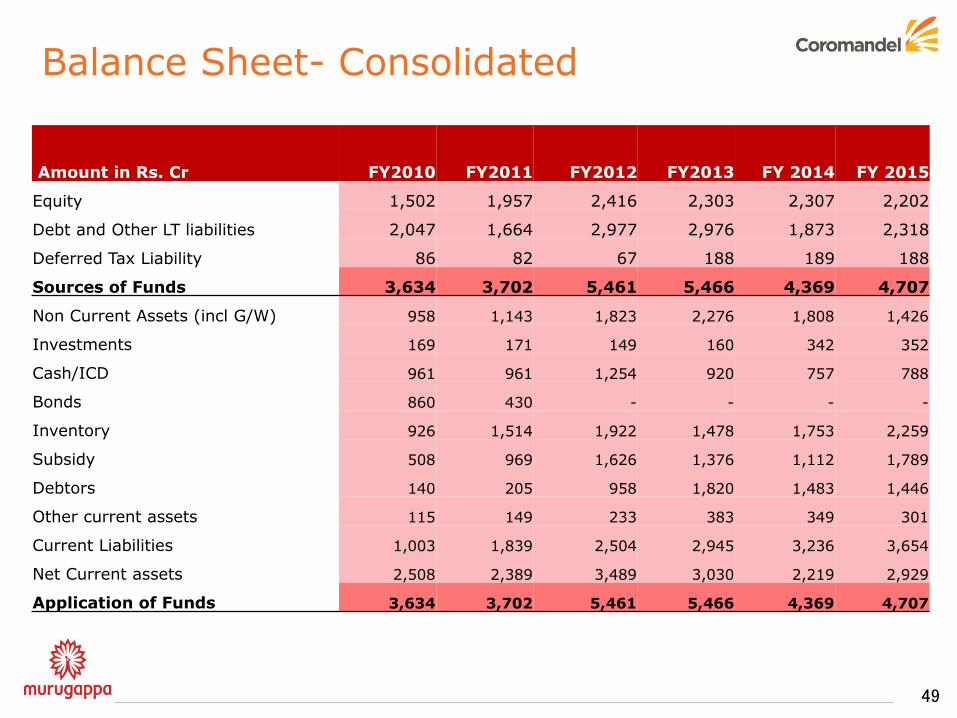
Balance Sheet- Consolidated
49
Amount in Rs. Cr FY2010 FY2011 FY2012 FY2013 FY 2014 FY 2015
Equity 1,502 1,957 2,416 2,303 2,307 2,202
Debt and Other LT liabilities 2,047 1,664 2,977 2,976 1,873 2,318
Deferred Tax Liability 86 82 67 188 189 188
Sources of Funds 3,634 3,702 5,461 5,466 4,369 4,707
Non Current Assets (incl G/W) 958 1,143 1,823 2,276 1,808 1,426
Investments 169 171 149 160 342 352
Cash/ICD 961 961 1,254 920 757 788
Bonds 860 430 - - - -
Inventory 926 1,514 1,922 1,478 1,753 2,259
Subsidy 508 969 1,626 1,376 1,112 1,789
Debtors 140 205 958 1,820 1,483 1,446
Other current assets 115 149 233 383 349 301
Current Liabilities 1,003 1,839 2,504 2,945 3,236 3,654
Net Current assets 2,508 2,389 3,489 3,030 2,219 2,929
Application of Funds 3,634 3,702 5,461 5,466 4,369 4,707
THANK YOU
50