Embed Size (px)
Citation preview

1
2
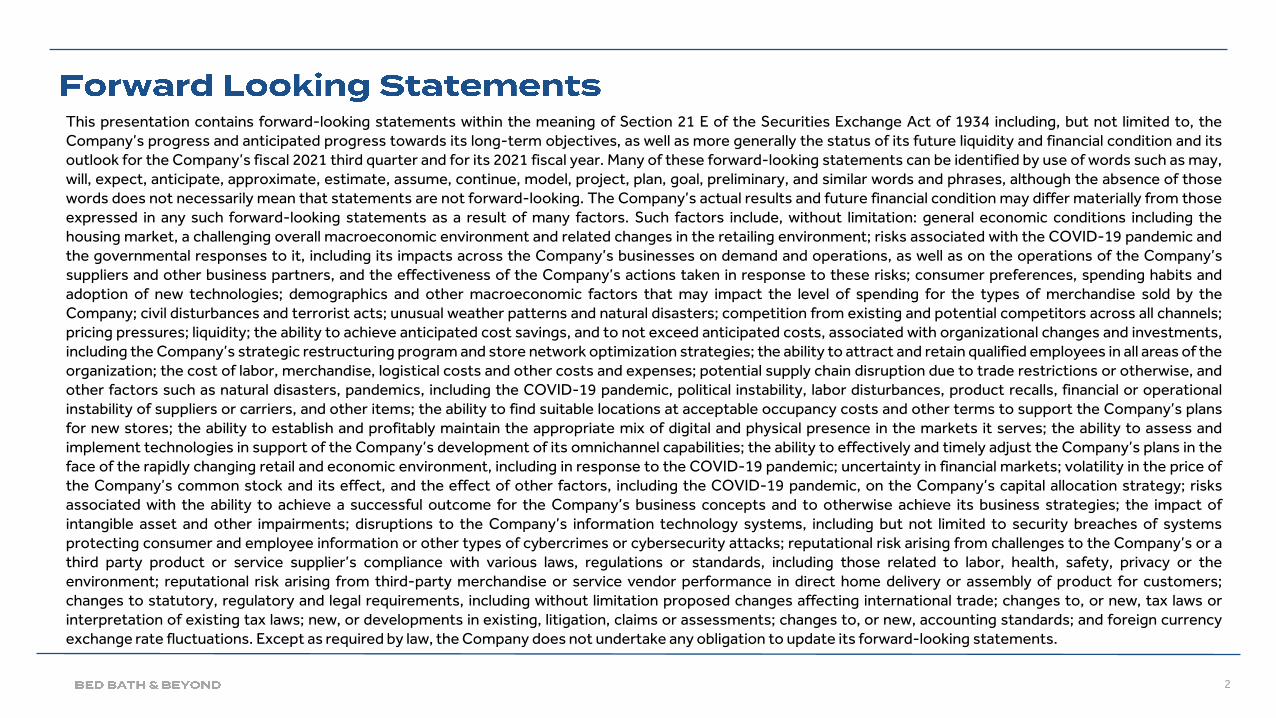
This presentation contains forward-looking statements within the meaning of Section 21 E of the Securities Exchange Act of 1934 including, but not limited to, theCompany’s progress and anticipated progress towards its long-term objectives, as well as more generally the status of its future liquidity and financial condition and itsoutlook for the Company’s fiscal 2021 third quarter and for its 2021 fiscal year. Many of these forward-looking statements can be identified by use of words such as may,will, expect, anticipate, approximate, estimate, assume, continue, model, project, plan, goal, preliminary, and similar words and phrases, although the absence of thosewords does not necessarily mean that statements are not forward-looking. The Company’s actual results and future financial condition may differ materially from thoseexpressed in any such forward-looking statements as a result of many factors. Such factors include, without limitation: general economic conditions including thehousing market, a challenging overall macroeconomic environment and related changes in the retailing environment; risks associated with the COVID-19 pandemic andthe governmental responses to it, including its impacts across the Company’s businesses on demand and operations, as well as on the operations of the Company’ssuppliers and other business partners, and the effectiveness of the Company’s actions taken in response to these risks; consumer preferences, spending habits andadoption of new technologies; demographics and other macroeconomic factors that may impact the level of spending for the types of merchandise sold by theCompany; civil disturbances and terrorist acts; unusual weather patterns and natural disasters; competition from existing and potential competitors across all channels;pricing pressures; liquidity; the ability to achieve anticipated cost savings, and to not exceed anticipated costs, associated with organizational changes and investments,including the Company’s strategic restructuring program and store network optimization strategies; the ability to attract and retain qualified employees in all areas of theorganization; the cost of labor, merchandise, logistical costs and other costs and expenses; potential supply chain disruption due to trade restrictions or otherwise, andother factors such as natural disasters, pandemics, including the COVID-19 pandemic, political instability, labor disturbances, product recalls, financial or operationalinstability of suppliers or carriers, and other items; the ability to find suitable locations at acceptable occupancy costs and other terms to support the Company’s plansfor new stores; the ability to establish and profitably maintain the appropriate mix of digital and physical presence in the markets it serves; the ability to assess andimplement technologies in support of the Company’s development of its omnichannel capabilities; the ability to effectively and timely adjust the Company’s plans in theface of the rapidly changing retail and economic environment, including in response to the COVID-19 pandemic; uncertainty in financial markets; volatility in the price ofthe Company’s common stock and its effect, and the effect of other factors, including the COVID-19 pandemic, on the Company’s capital allocation strategy; risksassociated with the ability to achieve a successful outcome for the Company’s business concepts and to otherwise achieve its business strategies; the impact ofintangible asset and other impairments; disruptions to the Company’s information technology systems, including but not limited to security breaches of systemsprotecting consumer and employee information or other types of cybercrimes or cybersecurity attacks; reputational risk arising from challenges to the Company’s or athird party product or service supplier’s compliance with various laws, regulations or standards, including those related to labor, health, safety, privacy or theenvironment; reputational risk arising from third-party merchandise or service vendor performance in direct home delivery or assembly of product for customers;changes to statutory, regulatory and legal requirements, including without limitation proposed changes affecting international trade; changes to, or new, tax laws orinterpretation of existing tax laws; new, or developments in existing, litigation, claims or assessments; changes to, or new, accounting standards; and foreign currencyexchange rate fluctuations. Except as required by law, the Company does not undertake any obligation to update its forward-looking statements.

3
▪
▪
▪
▪

4
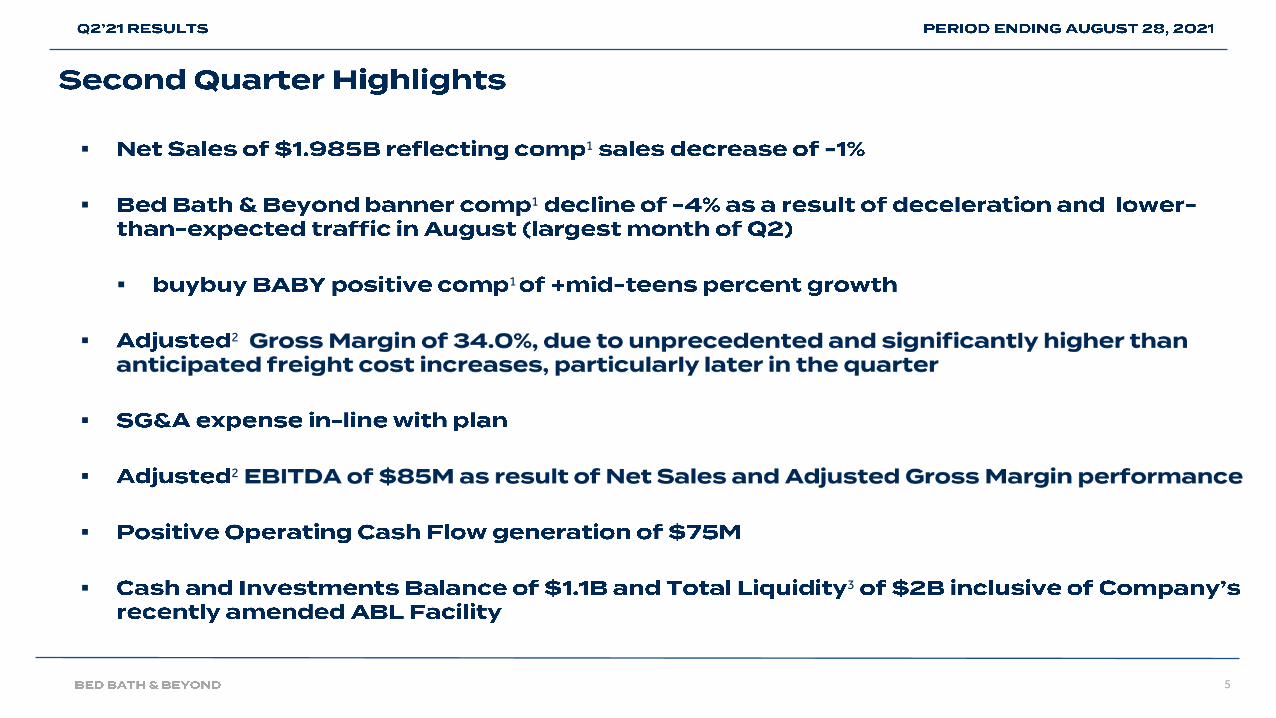
5
▪1
▪1
▪1
▪2
▪
▪2
▪
▪3
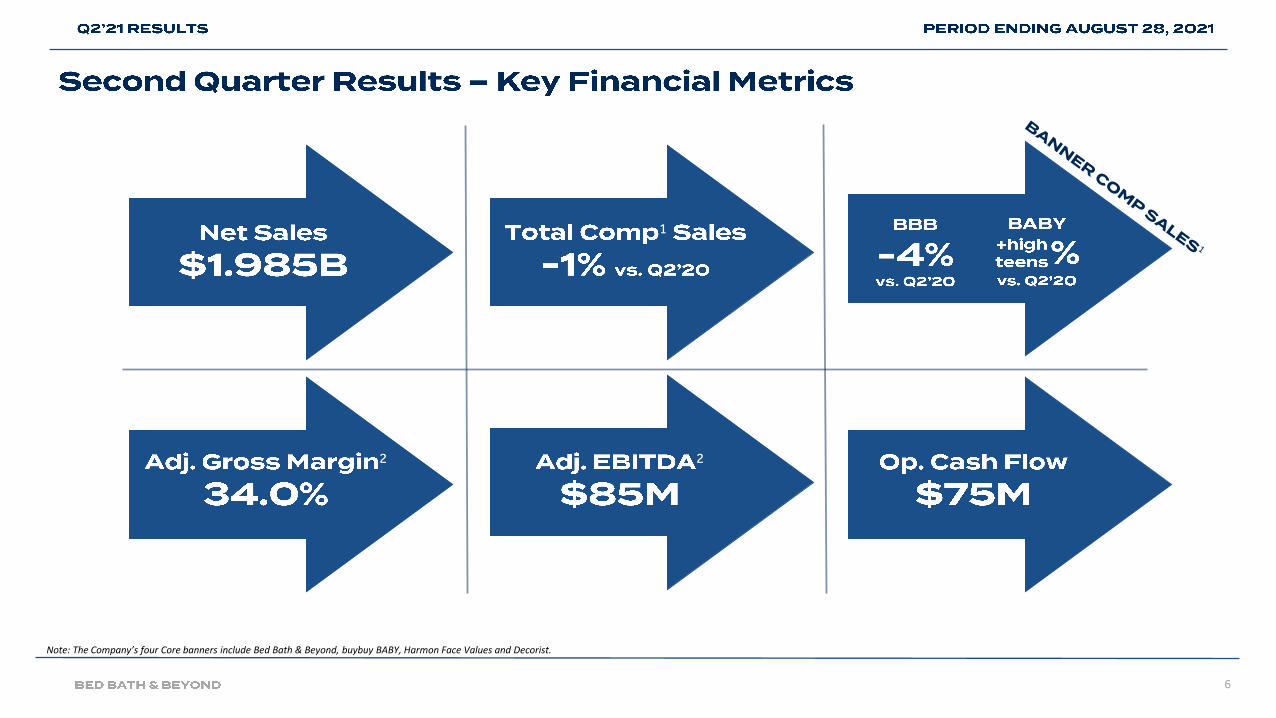
6
1
2 2
Note: The Company’s four Core banners include Bed Bath & Beyond, buybuy BABY, Harmon Face Values and Decorist.
7
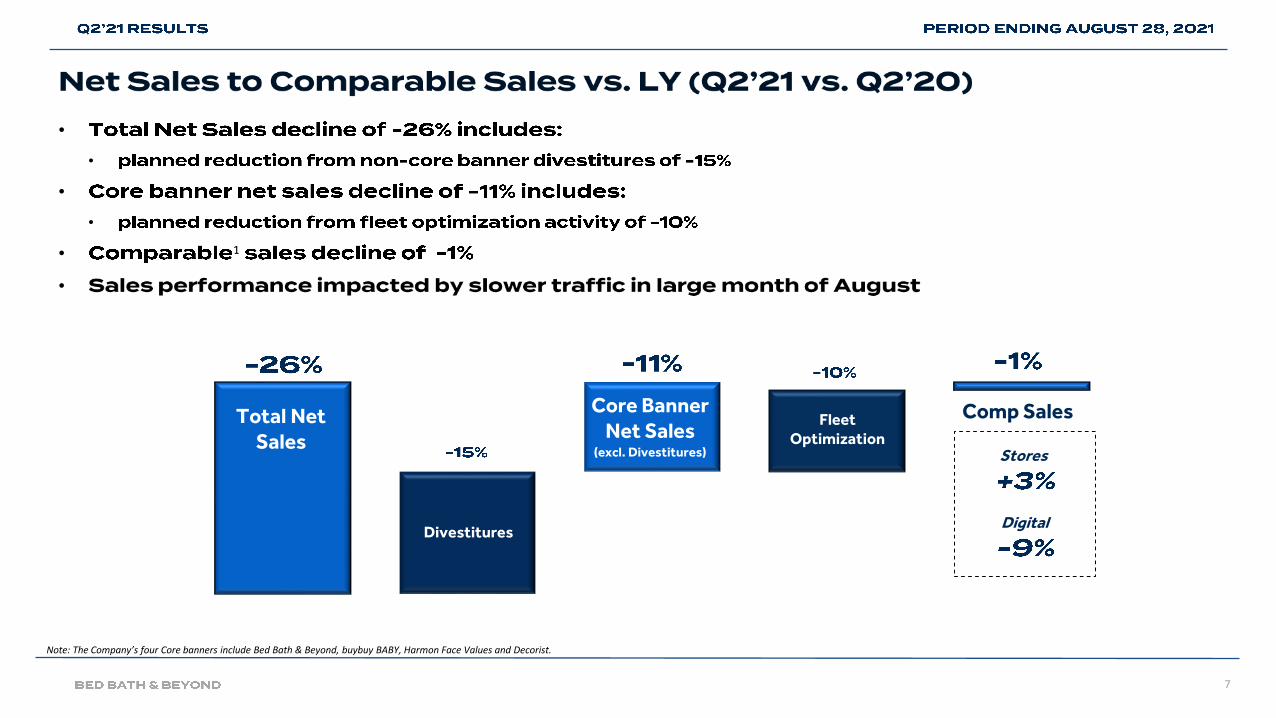
•
•
•
•
• 1
•
Total Net Sales
Divestitures
Core Banner Net Sales
(excl. Divestitures)
Fleet Optimization
Comp Sales
Note: The Company’s four Core banners include Bed Bath & Beyond, buybuy BABY, Harmon Face Values and Decorist.
Stores
Digital
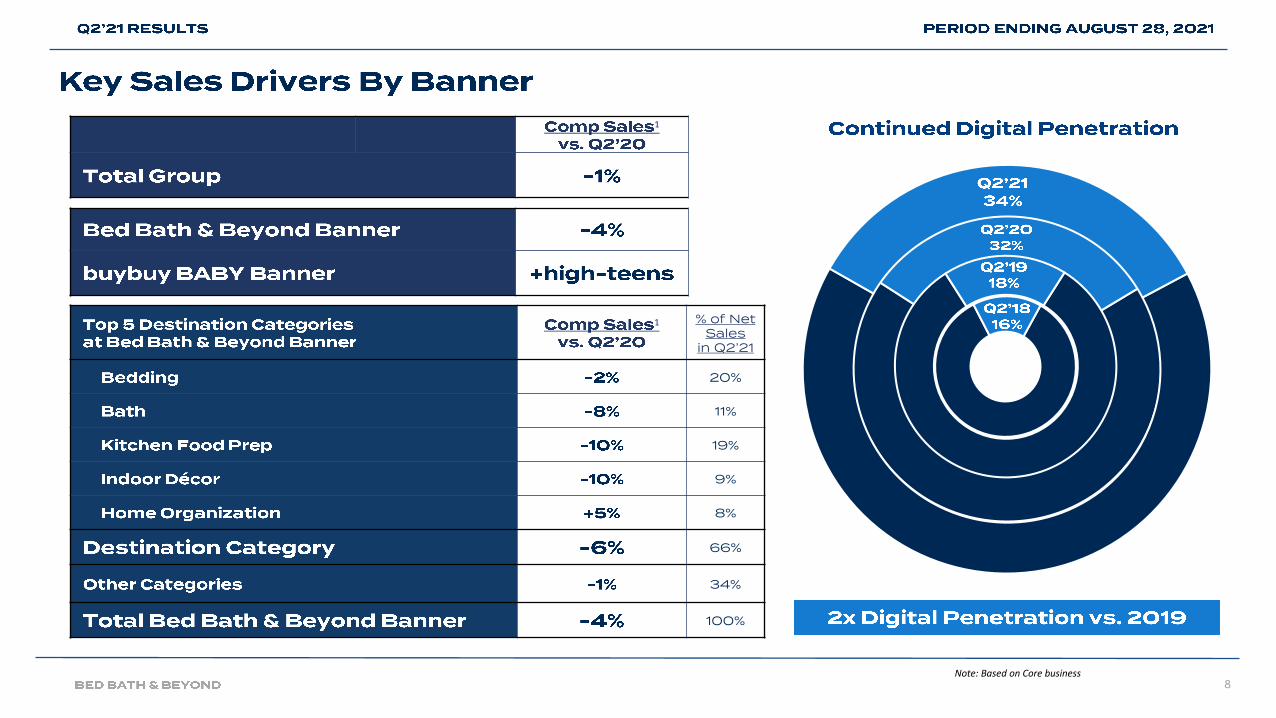
8
1
1 % of Net Sales
in Q2’21
20%
11%
19%
9%
8%
66%
34%
100%
Note: Based on Core business
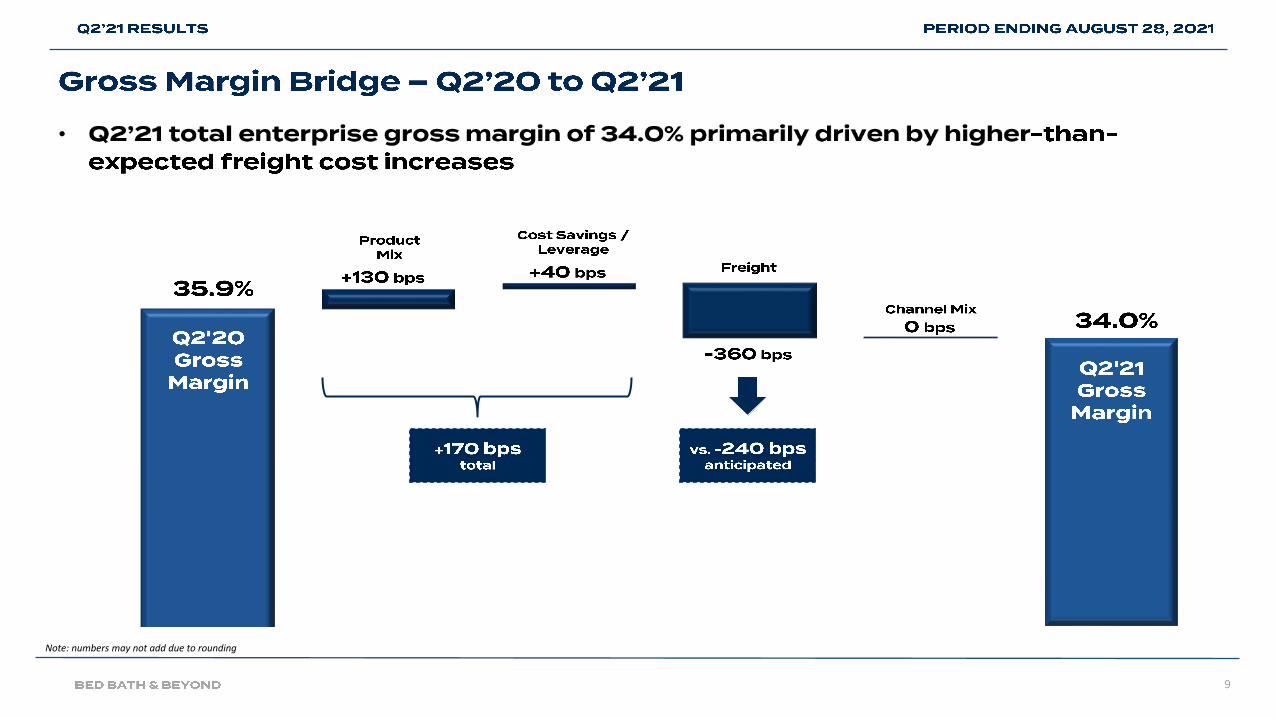
9
Note: numbers may not add due to rounding
•
10
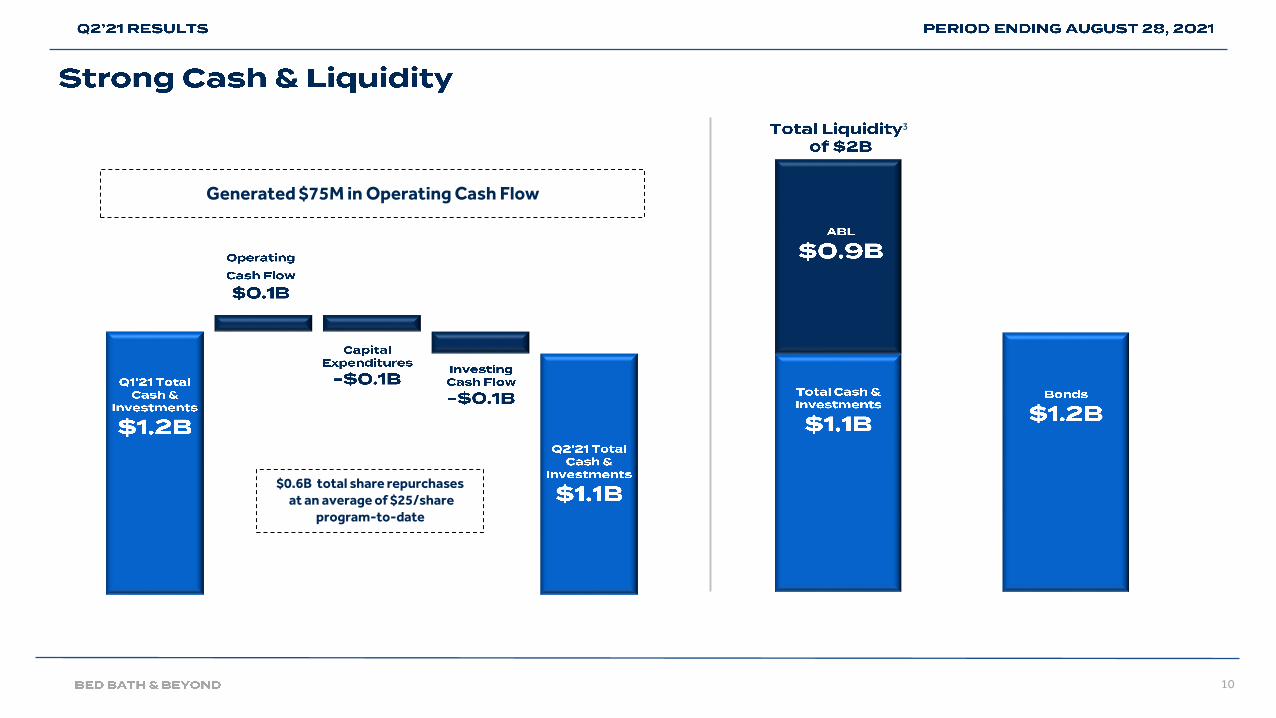
3
Generated $75M in Operating Cash Flow
$0.6B total share repurchasesat an average of $25/share
program-to-date

11
12
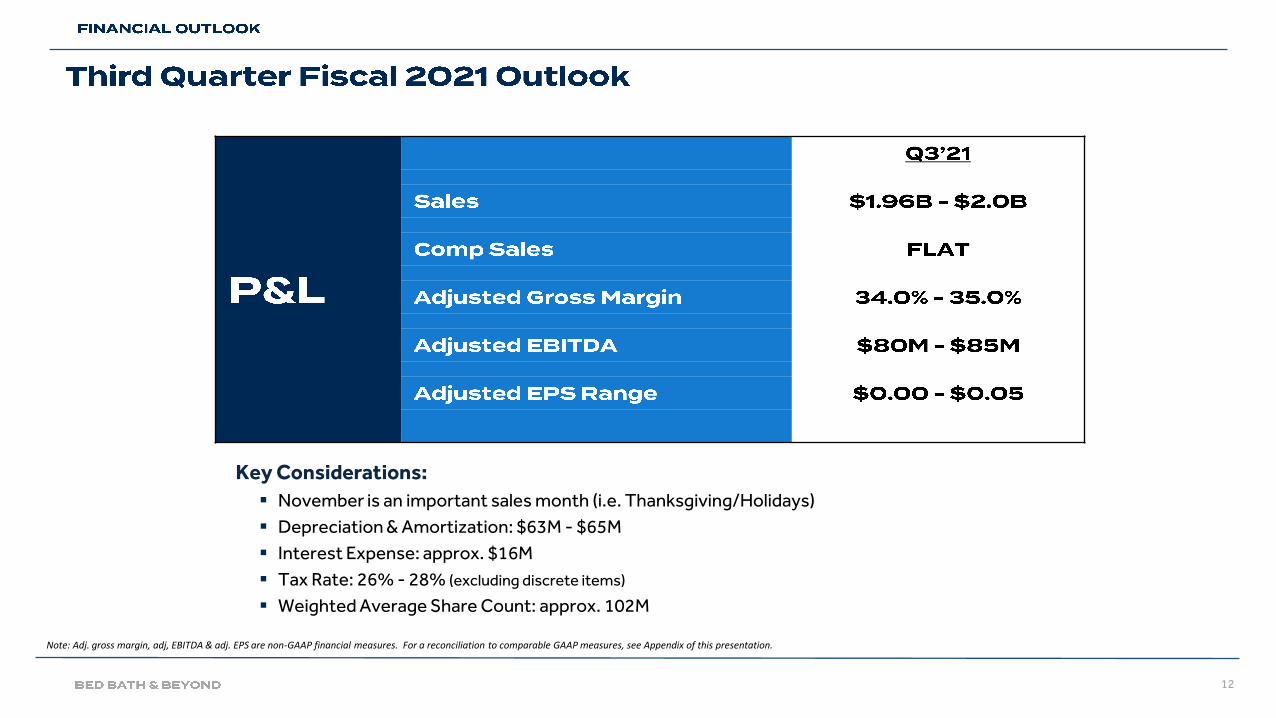
Note: Adj. gross margin, adj, EBITDA & adj. EPS are non-GAAP financial measures. For a reconciliation to comparable GAAP measures, see Appendix of this presentation.
Key Considerations:
▪ November is an important sales month (i.e. Thanksgiving/Holidays)
▪ Depreciation & Amortization: $63M - $65M
▪ Interest Expense: approx. $16M
▪ Tax Rate: 26% - 28% (excluding discrete items)
▪ Weighted Average Share Count: approx. 102M
13
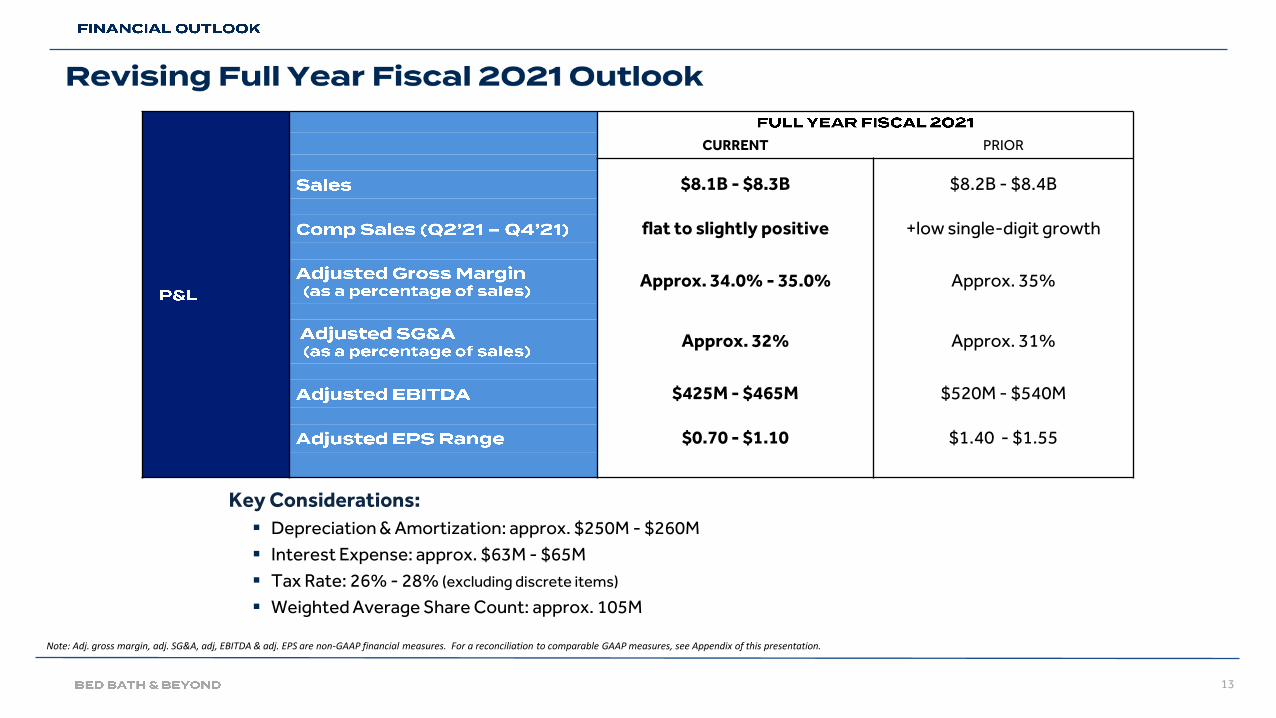
CURRENT PRIOR
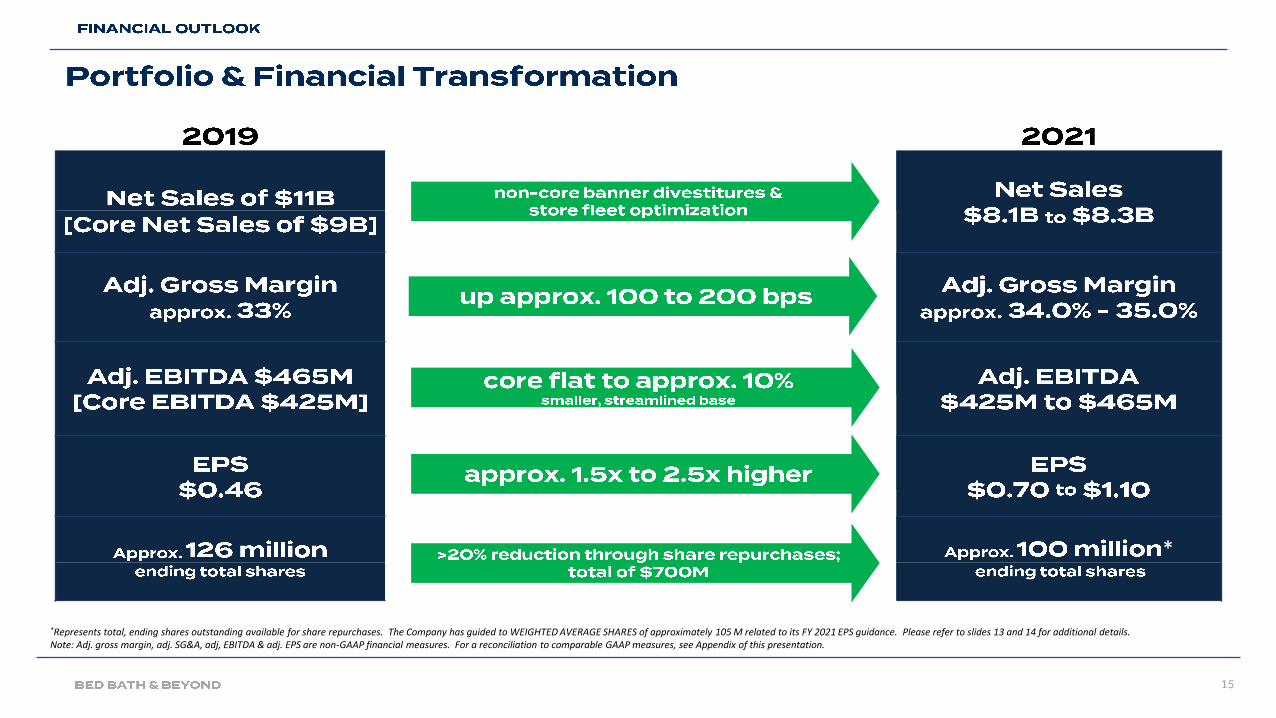
$8.1B - $8.3B $8.2B - $8.4B
flat to slightly positive +low single-digit growth
Approx. 34.0% - 35.0% Approx. 35%
Approx. 32% Approx. 31%
$425M - $465M $520M - $540M
$0.70 - $1.10 $1.40 - $1.55
Note: Adj. gross margin, adj. SG&A, adj, EBITDA & adj. EPS are non-GAAP financial measures. For a reconciliation to comparable GAAP measures, see Appendix of this presentation.
Key Considerations:
▪ Depreciation & Amortization: approx. $250M - $260M
▪ Interest Expense: approx. $63M - $65M
▪ Tax Rate: 26% - 28% (excluding discrete items)
▪ Weighted Average Share Count: approx. 105M
14
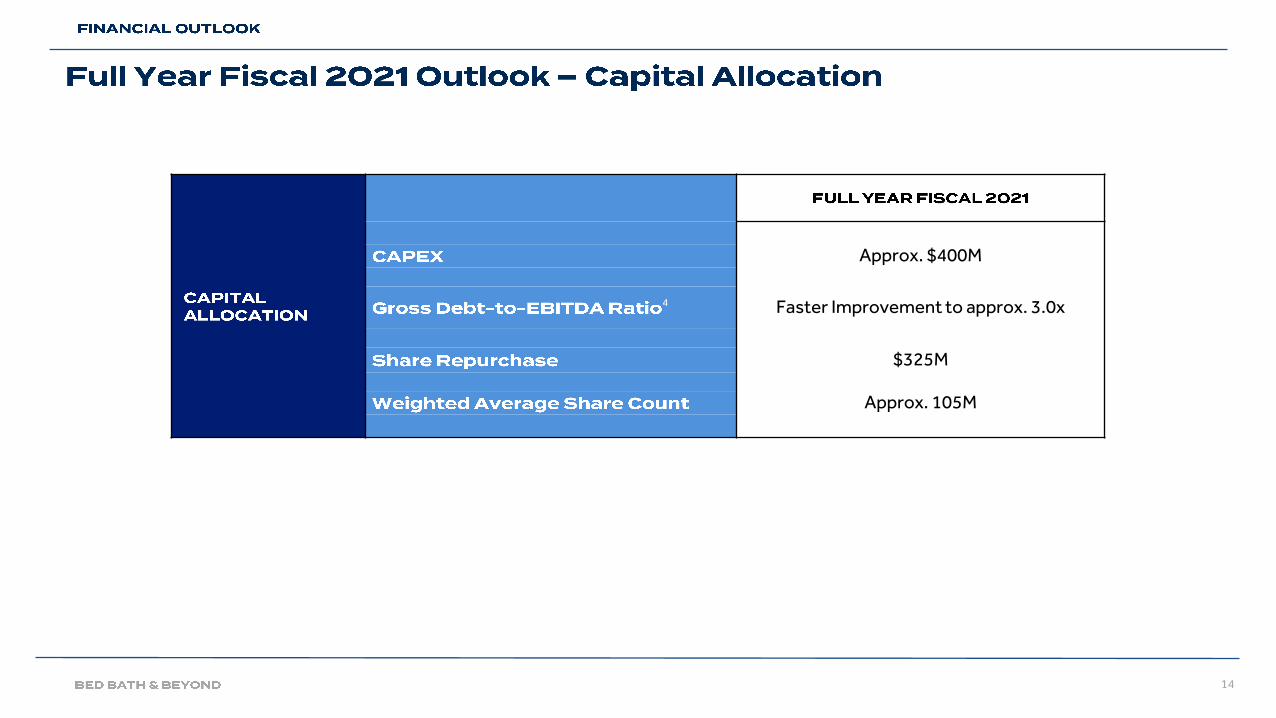
Approx. $400M
4 Faster Improvement to approx. 3.0x
$325M
Approx. 105M
15
*
*Represents total, ending shares outstanding available for share repurchases. The Company has guided to WEIGHTED AVERAGE SHARES of approximately 105 M related to its FY 2021 EPS guidance. Please refer to slides 13 and 14 for additional details.Note: Adj. gross margin, adj. SG&A, adj, EBITDA & adj. EPS are non-GAAP financial measures. For a reconciliation to comparable GAAP measures, see Appendix of this presentation.

16
17
18
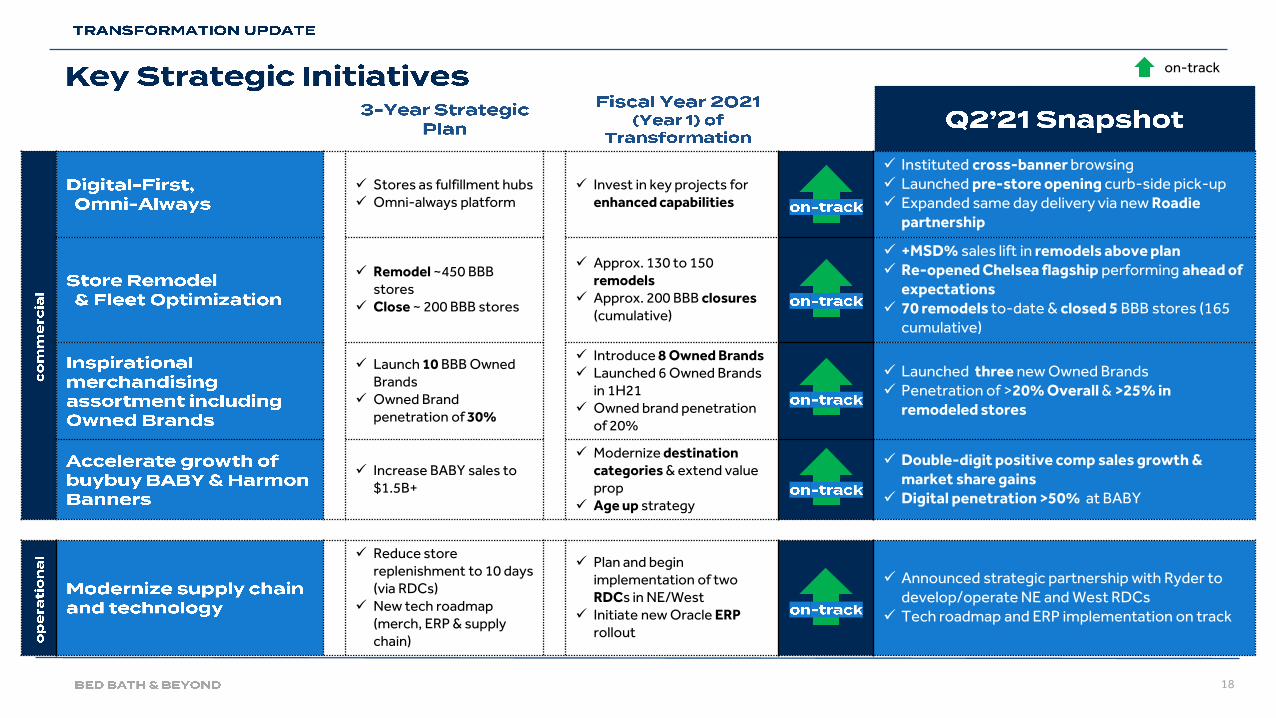
✓ Stores as fulfillment hubs✓ Omni-always platform
✓ Invest in key projects for enhanced capabilities
✓ Instituted cross-banner browsing✓ Launched pre-store opening curb-side pick-up✓ Expanded same day delivery via new Roadie
partnership
✓ Remodel ~450 BBB stores
✓ Close ~ 200 BBB stores
✓ Approx. 130 to 150 remodels
✓ Approx. 200 BBB closures (cumulative)
✓ +MSD% sales lift in remodels above plan ✓ Re-opened Chelsea flagship performing ahead of
expectations✓ 70 remodels to-date & closed 5 BBB stores (165
cumulative)
✓ Launch 10 BBB Owned Brands
✓ Owned Brand penetration of 30%
✓ Introduce 8 Owned Brands✓ Launched 6 Owned Brands
in 1H21✓ Owned brand penetration
of 20%
✓ Launched three new Owned Brands✓ Penetration of >20% Overall & >25% in
remodeled stores
✓ Increase BABY sales to $1.5B+
✓ Modernize destination categories & extend value prop
✓ Age up strategy
✓ Double-digit positive comp sales growth & market share gains
✓ Digital penetration >50% at BABY
✓ Reduce store replenishment to 10 days (via RDCs)
✓ New tech roadmap (merch, ERP & supply chain)
✓ Plan and begin implementation of two RDCs in NE/West
✓ Initiate new Oracle ERP rollout
✓ Announced strategic partnership with Ryder to develop/operate NE and West RDCs
✓ Tech roadmap and ERP implementation on track
on-track
19
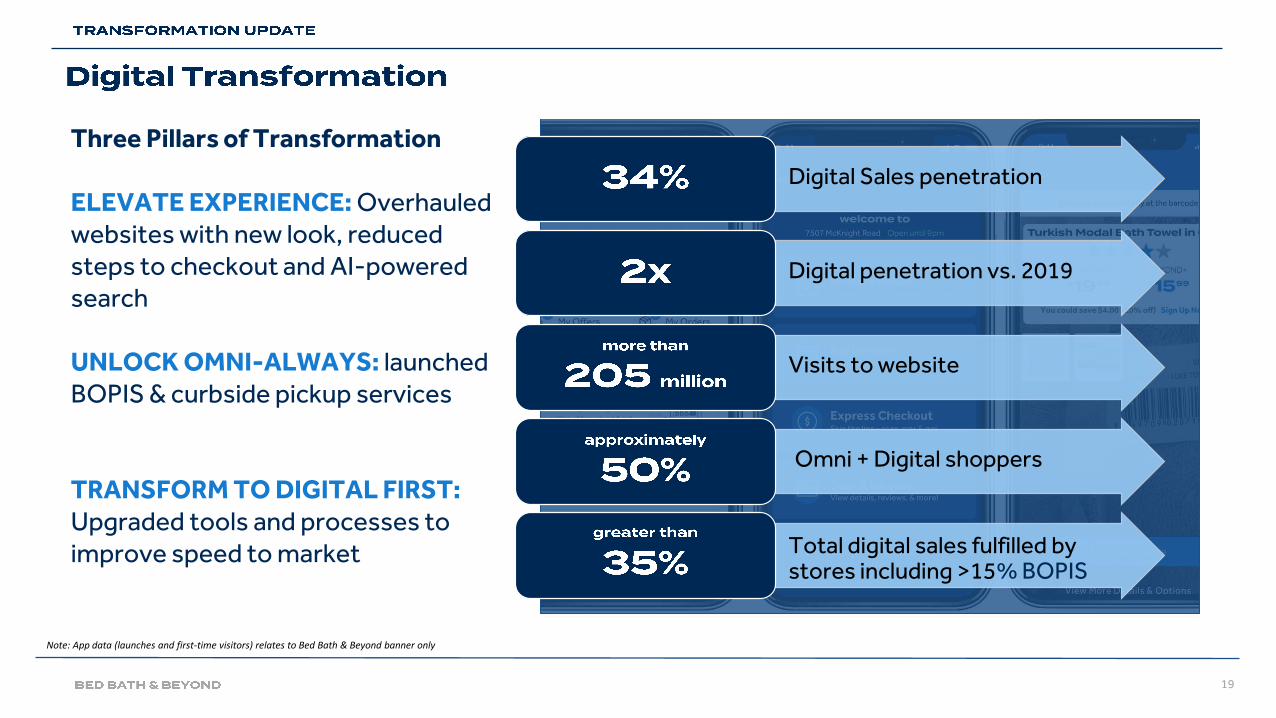
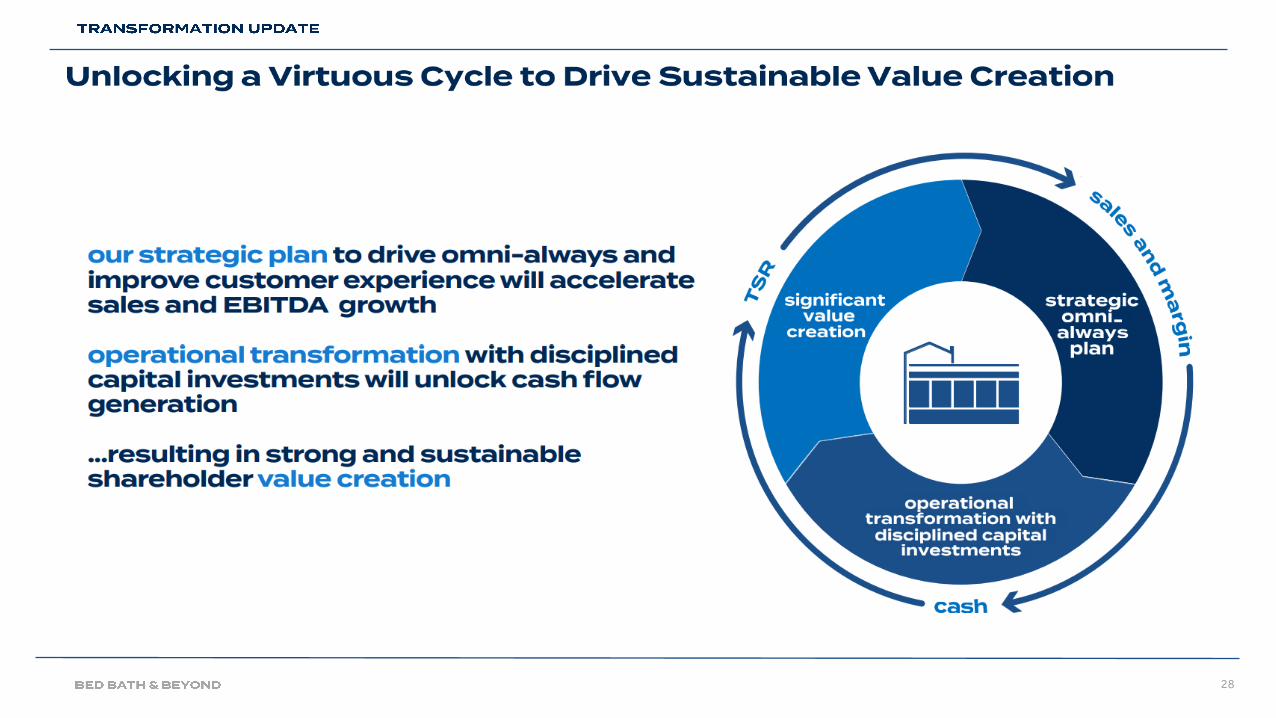
Three Pillars of Transformation
ELEVATE EXPERIENCE: Overhauled websites with new look, reduced steps to checkout and AI-powered search
UNLOCK OMNI-ALWAYS: launched BOPIS & curbside pickup services
TRANSFORM TO DIGITAL FIRST: Upgraded tools and processes to improve speed to market
Digital Sales penetration
Digital penetration vs. 2019
Visits to website
Omni + Digital shoppers
Total digital sales fulfilled by stores including >15% BOPIS
Note: App data (launches and first-time visitors) relates to Bed Bath & Beyond banner only
20
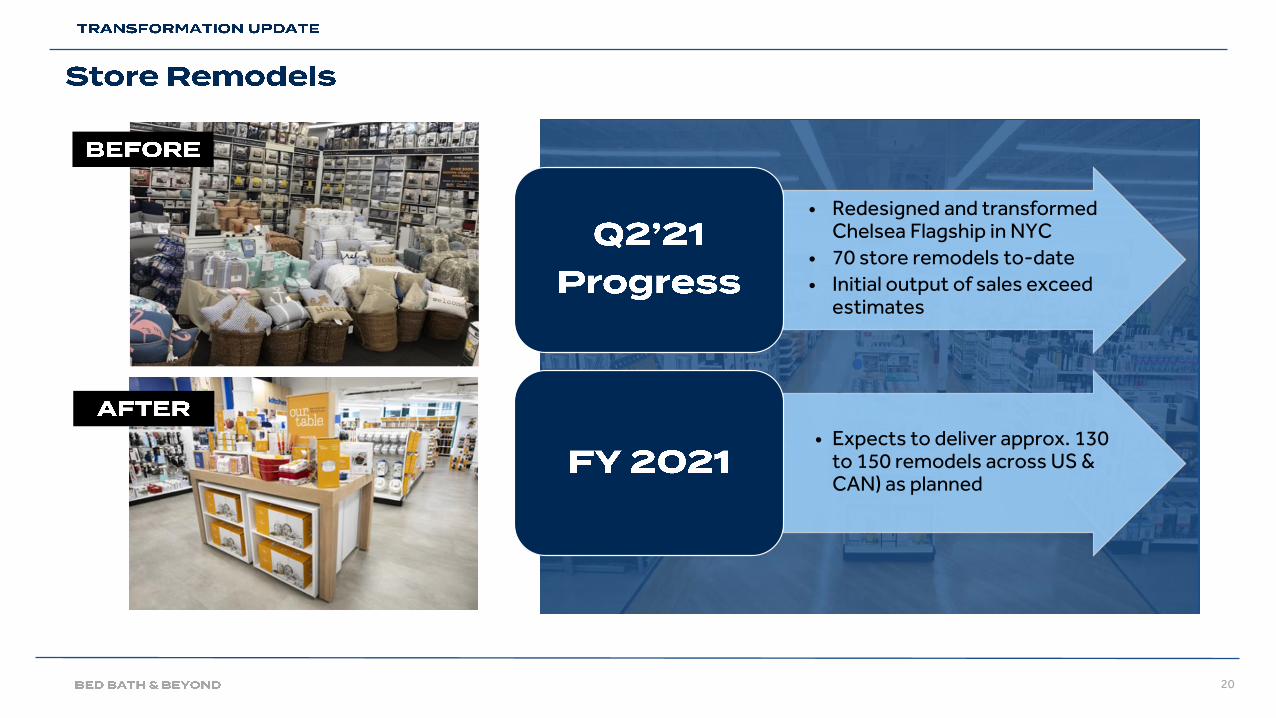
• Redesigned and transformed Chelsea Flagship in NYC
• 70 store remodels to-date• Initial output of sales exceed
estimates
• Expects to deliver approx. 130 to 150 remodels across US & CAN) as planned
21
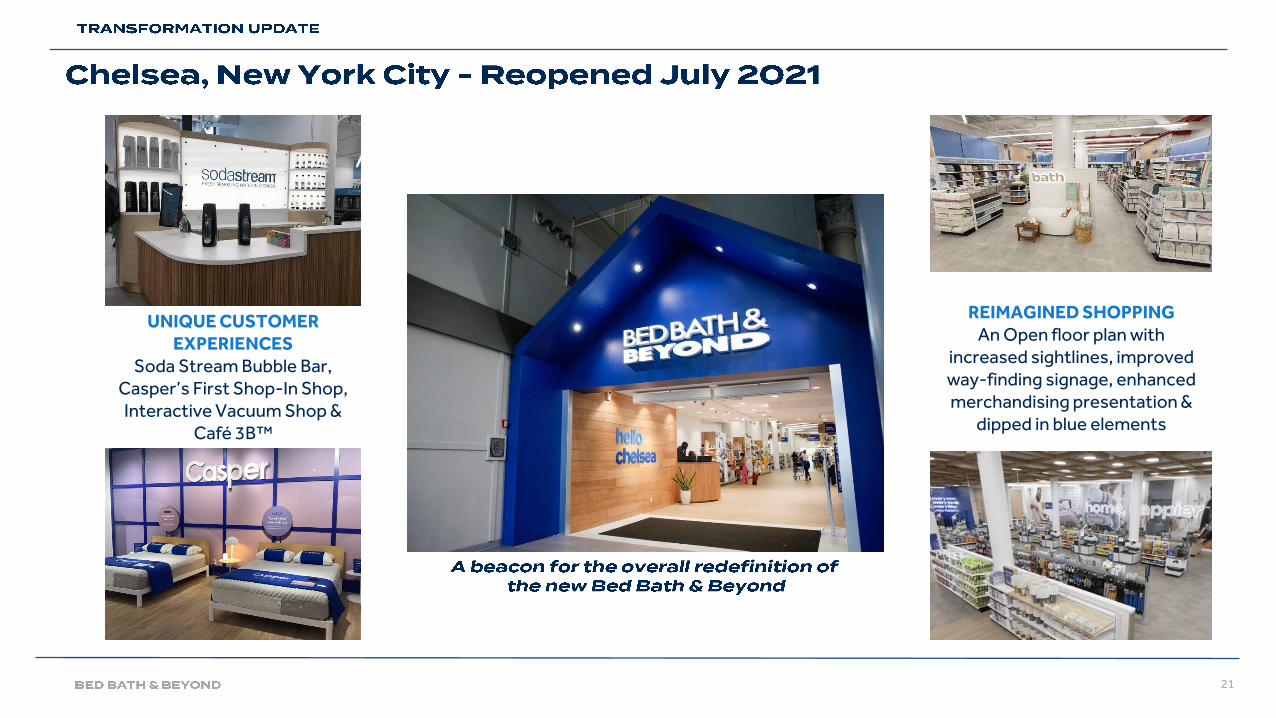
UNIQUE CUSTOMER EXPERIENCES
Soda Stream Bubble Bar, Casper’s First Shop-In Shop, Interactive Vacuum Shop &
Café 3B™
REIMAGINED SHOPPINGAn Open floor plan with
increased sightlines, improved way-finding signage, enhanced merchandising presentation &
dipped in blue elements
22
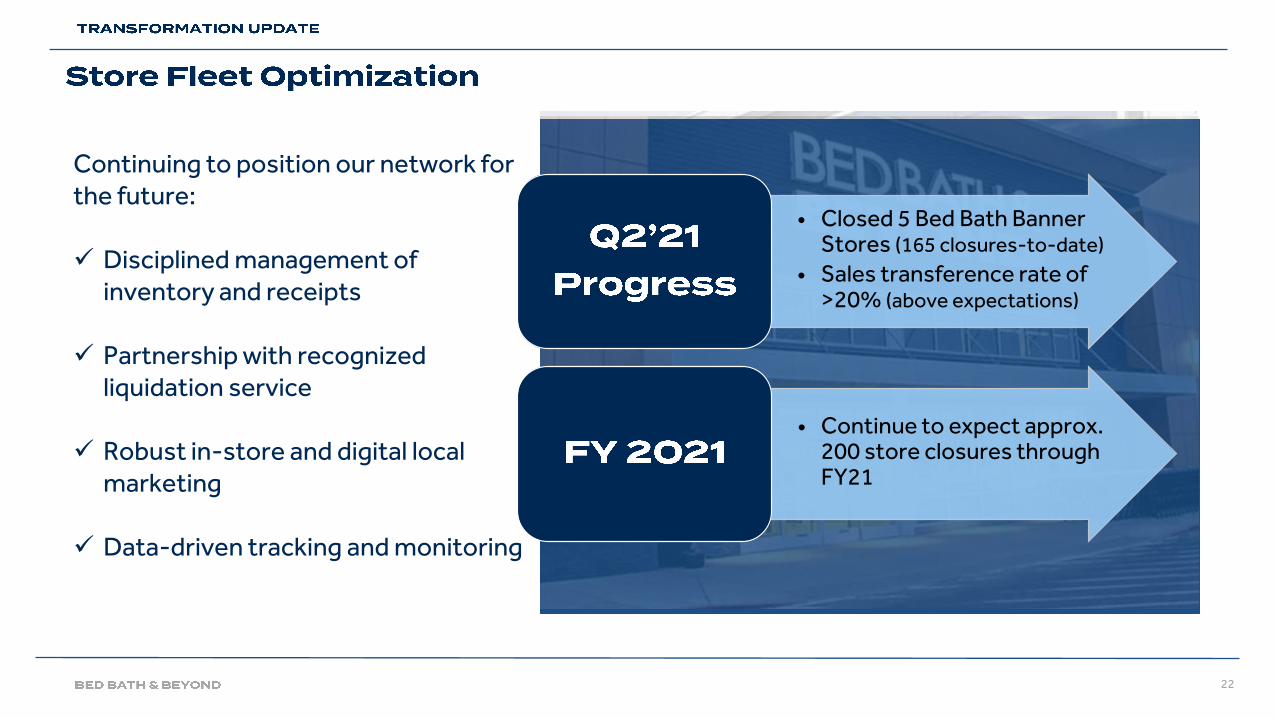
• Closed 5 Bed Bath Banner Stores (165 closures-to-date)
• Sales transference rate of >20% (above expectations)
• Continue to expect approx. 200 store closures through FY21
Continuing to position our network for the future:
✓ Disciplined management of inventory and receipts
✓ Partnership with recognized liquidation service
✓ Robust in-store and digital local marketing
✓ Data-driven tracking and monitoring
23
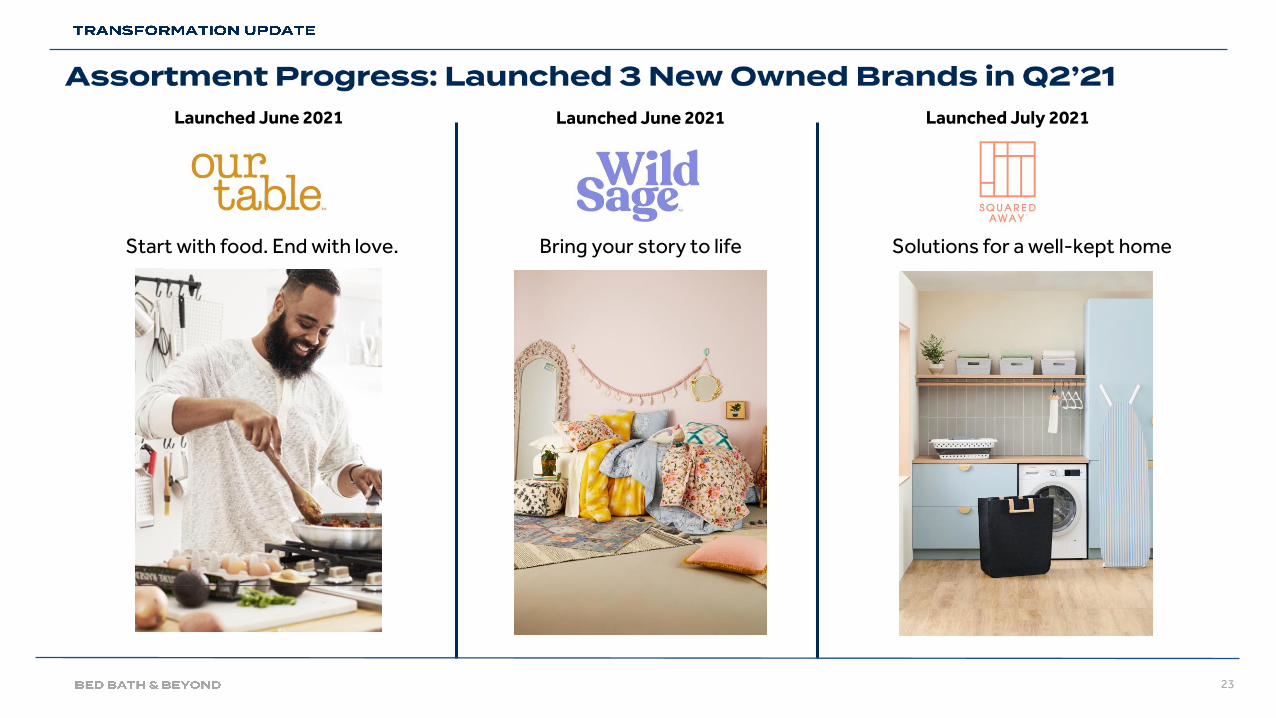
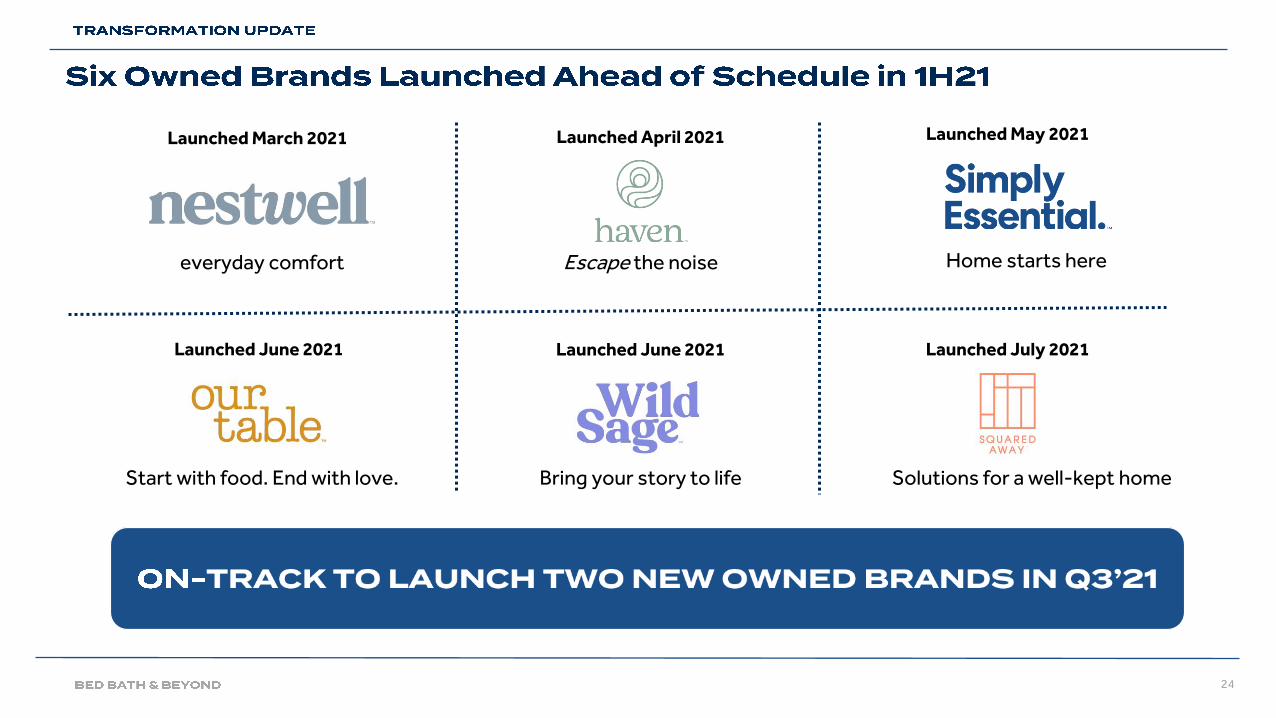
Bring your story to life
Launched June 2021
Start with food. End with love.
Launched June 2021 Launched July 2021
Solutions for a well-kept home
24
Bring your story to life
Launched June 2021
Start with food. End with love.
Launched June 2021 Launched July 2021
Solutions for a well-kept home
Escape the noise
Launched March 2021
everyday comfort
Launched April 2021 Launched May 2021
Home starts here
25
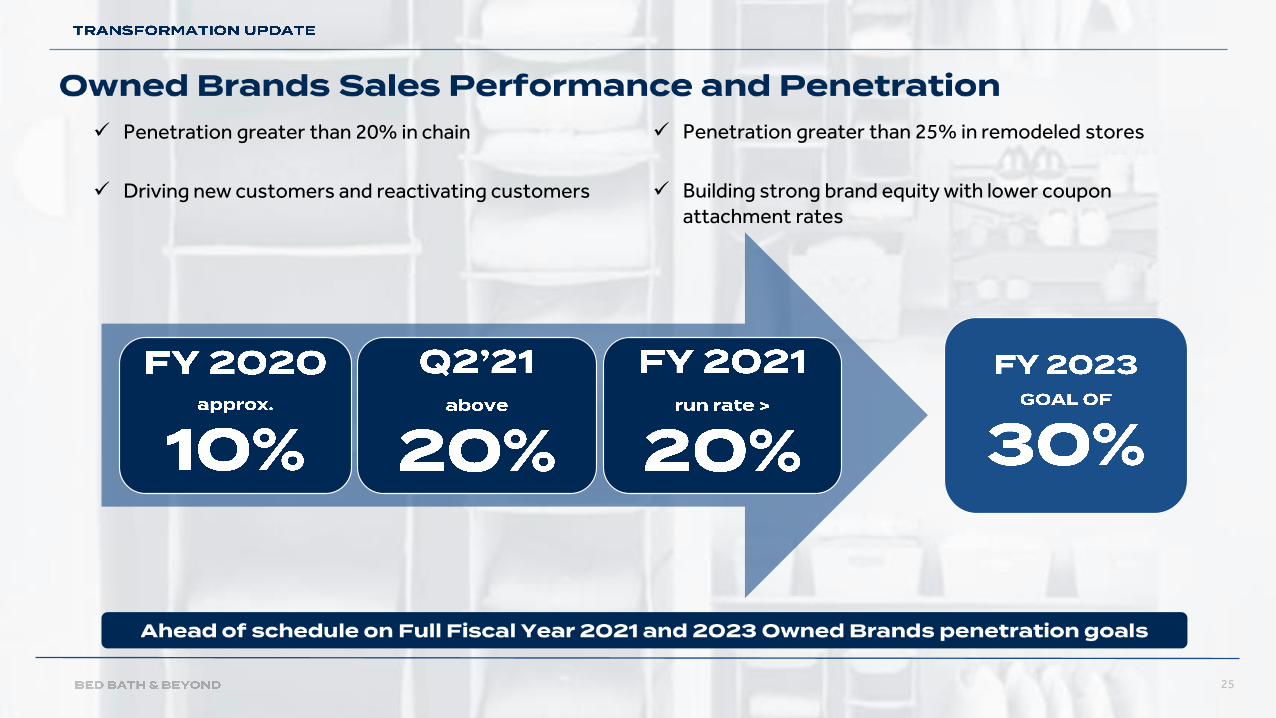
✓ Penetration greater than 20% in chain
✓ Driving new customers and reactivating customers
✓ Penetration greater than 25% in remodeled stores
✓ Building strong brand equity with lower coupon attachment rates
26
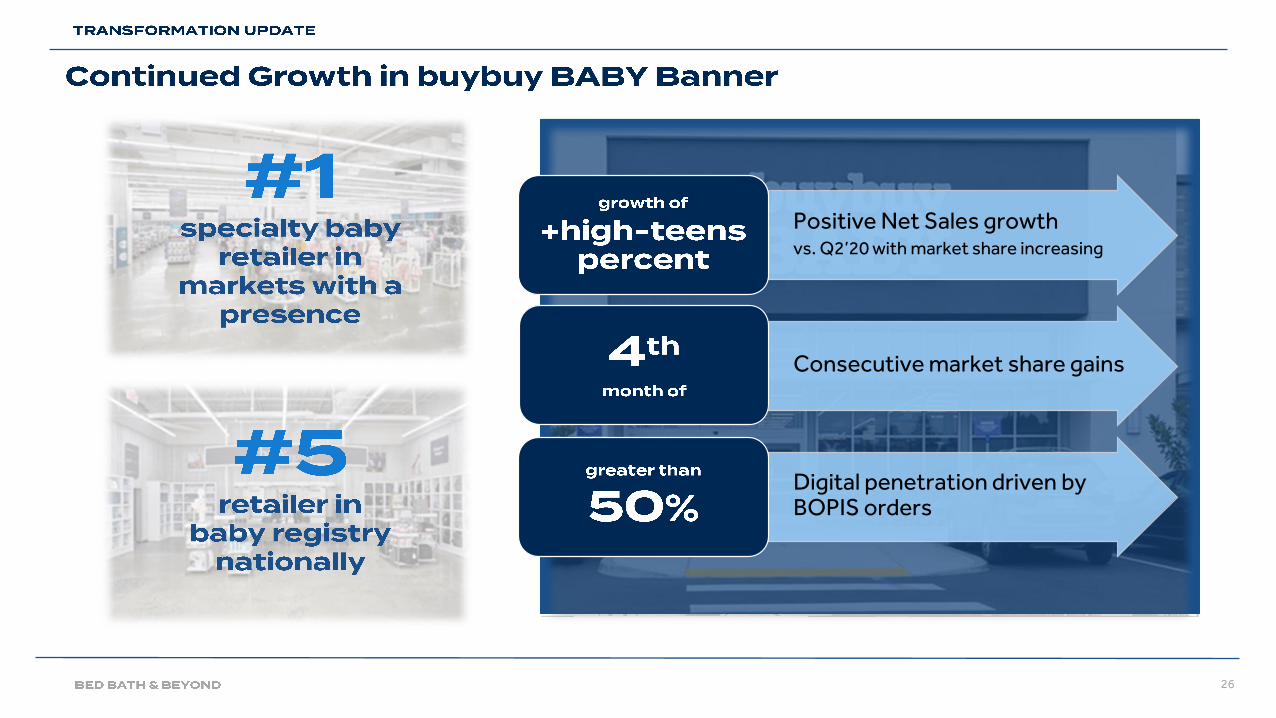
Positive Net Sales growthvs. Q2’20 with market share increasing
Consecutive market share gains
Digital penetration driven by BOPIS orders
27
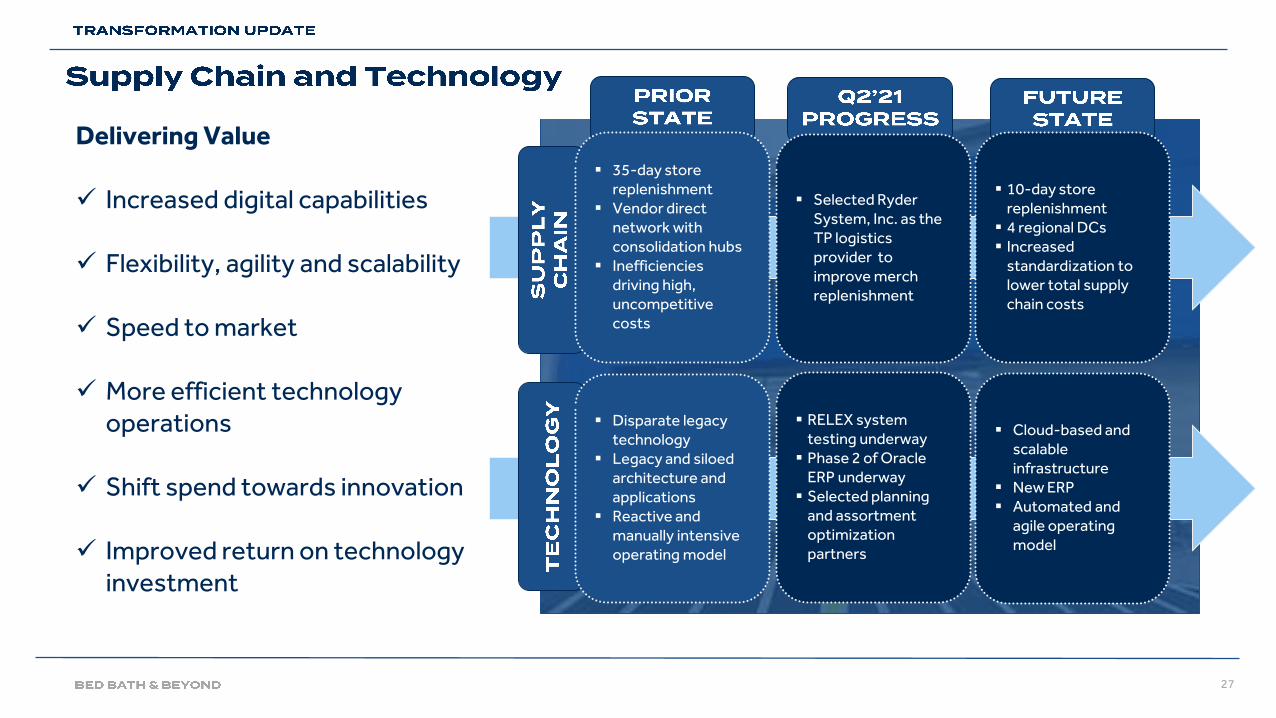
Delivering Value
✓ Increased digital capabilities
✓ Flexibility, agility and scalability
✓ Speed to market
✓ More efficient technology operations
✓ Shift spend towards innovation
✓ Improved return on technology investment
▪ 35-day store replenishment
▪ Vendor direct network with consolidation hubs
▪ Inefficiencies driving high, uncompetitive costs
▪ Disparate legacy technology
▪ Legacy and siloed architecture and applications
▪ Reactive and manually intensive operating model
▪ Selected Ryder System, Inc. as the TP logistics provider to improve merch replenishment
▪ RELEX system testing underway
▪ Phase 2 of Oracle ERP underway
▪ Selected planning and assortment optimization partners
▪ 10-day store replenishment
▪ 4 regional DCs▪ Increased
standardization to lower total supply chain costs
▪ Cloud-based and scalable infrastructure
▪ New ERP▪ Automated and
agile operating model
28
29
30
$-
$50
$100
$150
$200
$250
$300
$350
$400
Accelerated Share
Repurchase Program
Leverage of <3.0x
PMALLDivesture
One Kings LaneDivesture
Linen , CTS & Distribution
Center Divestiture
CPWMDivestiture
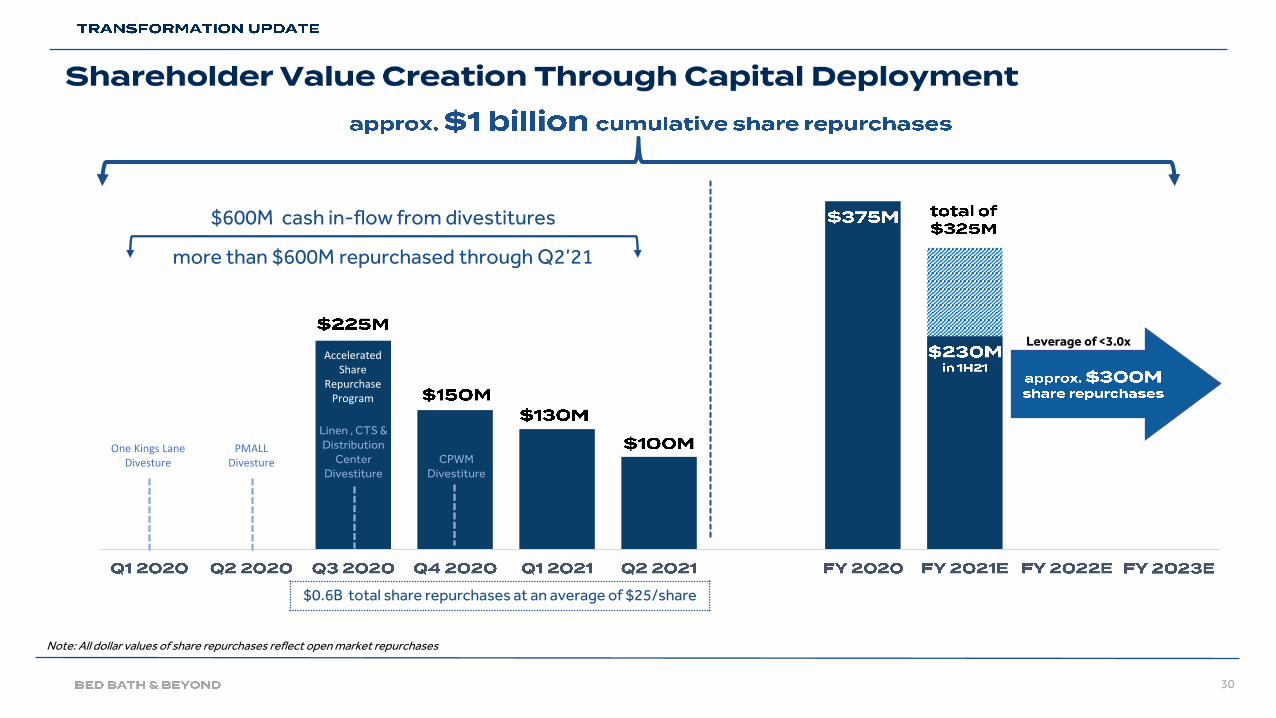
$600M cash in-flow from divestitures
Note: All dollar values of share repurchases reflect open market repurchases
more than $600M repurchased through Q2’21
$0.6B total share repurchases at an average of $25/share
31
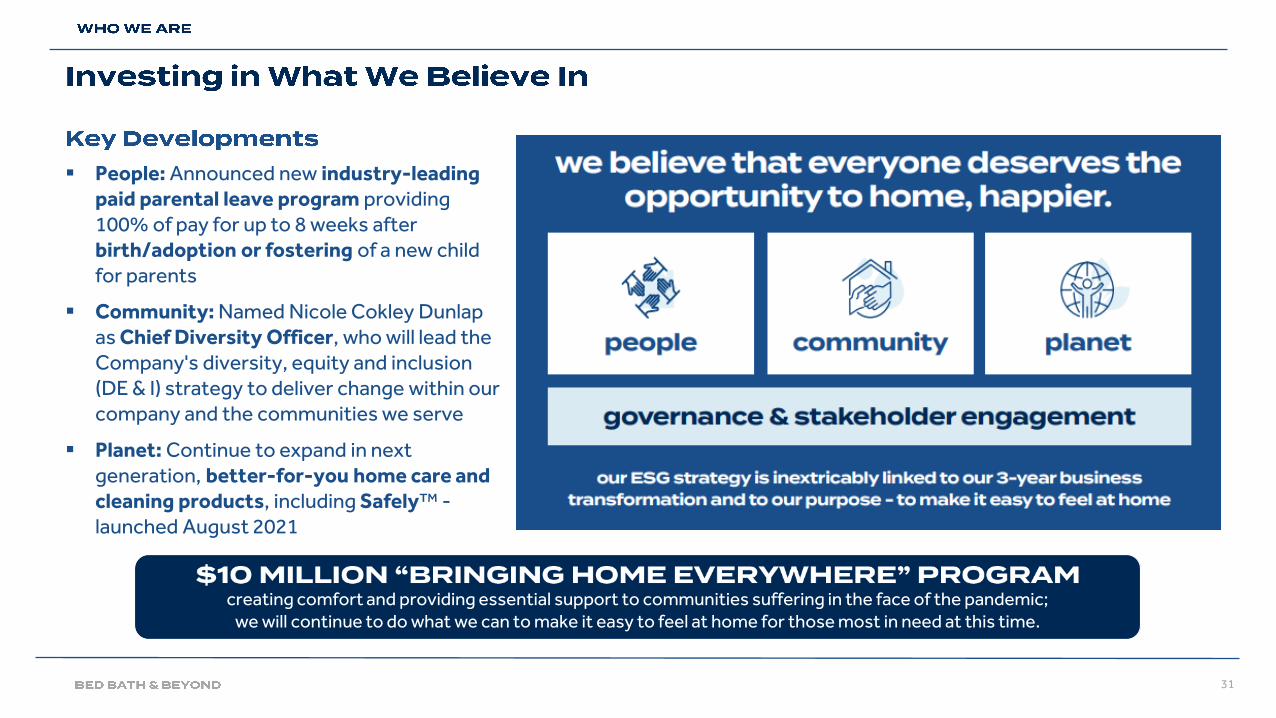
▪ People: Announced new industry-leading paid parental leave program providing 100% of pay for up to 8 weeks after birth/adoption or fostering of a new child for parents
▪ Community: Named Nicole Cokley Dunlap as Chief Diversity Officer, who will lead the Company's diversity, equity and inclusion (DE & I) strategy to deliver change within our company and the communities we serve
▪ Planet: Continue to expand in next generation, better-for-you home care and cleaning products, including Safely™ -launched August 2021
creating comfort and providing essential support to communities suffering in the face of the pandemic;we will continue to do what we can to make it easy to feel at home for those most in need at this time.
32
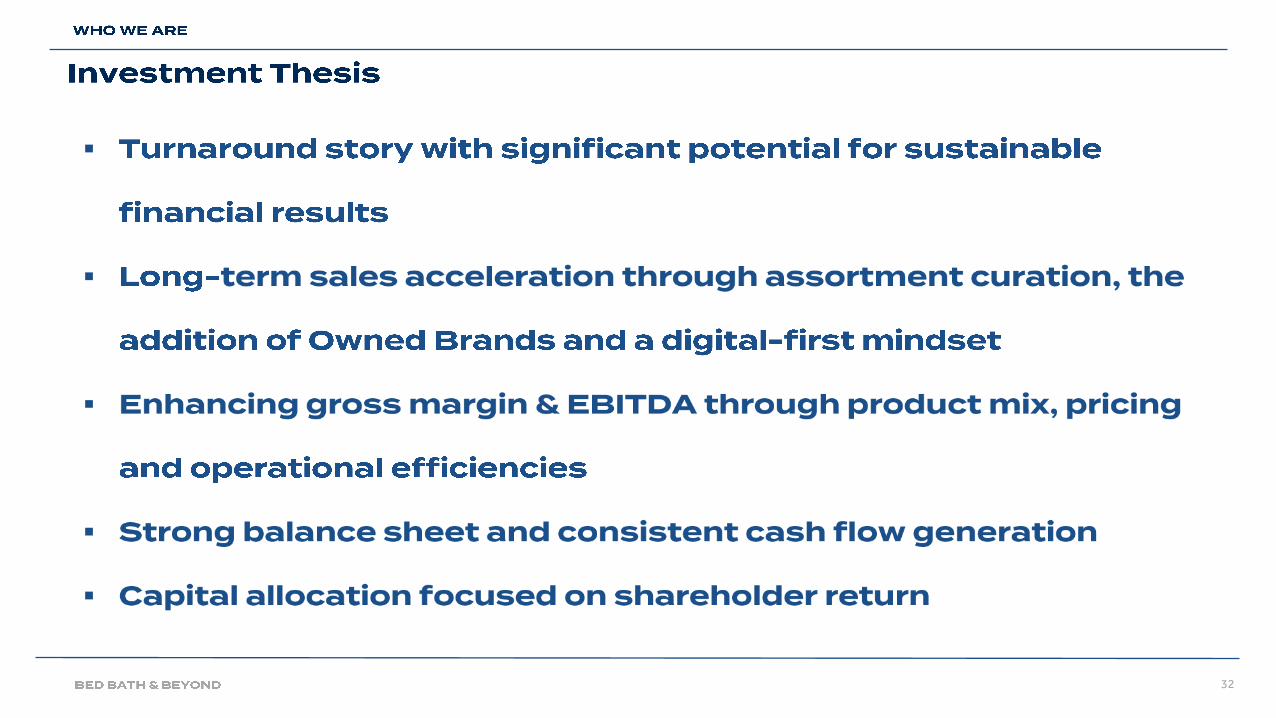
▪
▪
▪
▪
▪
33
34
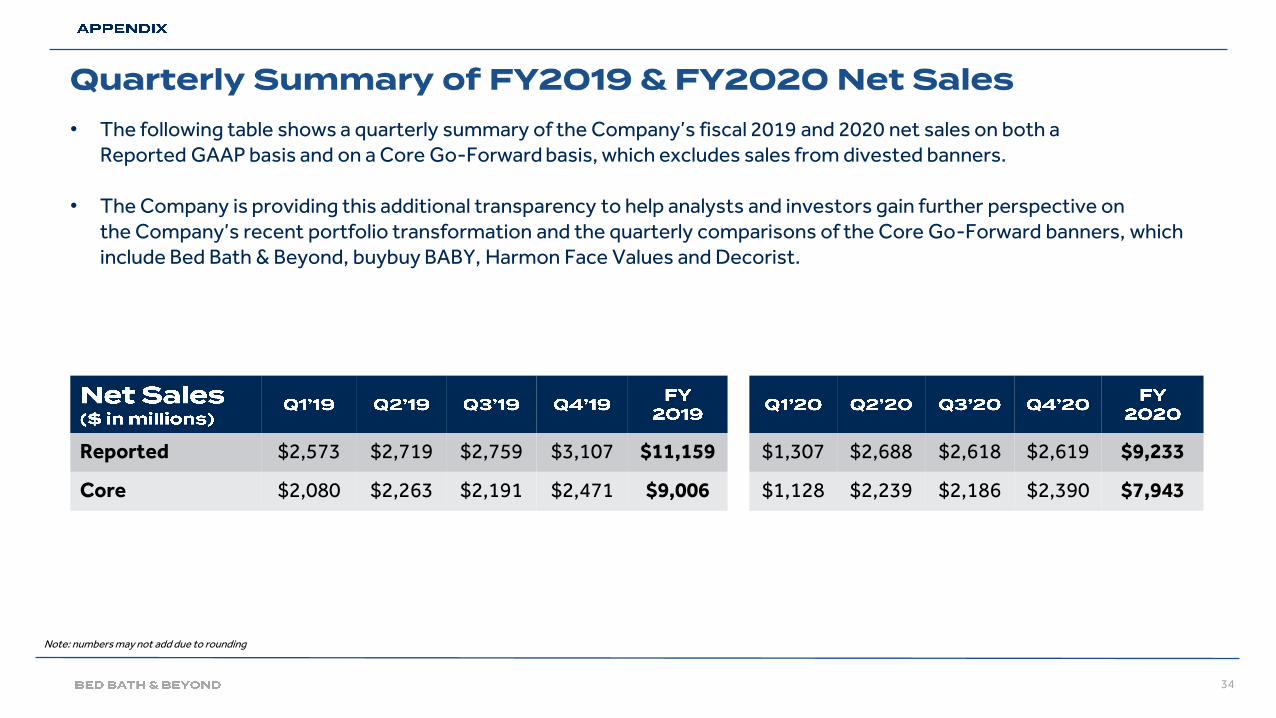
• The following table shows a quarterly summary of the Company’s fiscal 2019 and 2020 net sales on both a Reported GAAP basis and on a Core Go-Forward basis, which excludes sales from divested banners.
• The Company is providing this additional transparency to help analysts and investors gain further perspective on the Company’s recent portfolio transformation and the quarterly comparisons of the Core Go-Forward banners, which include Bed Bath & Beyond, buybuy BABY, Harmon Face Values and Decorist.
Note: numbers may not add due to rounding
Reported $2,573 $2,719 $2,759 $3,107 $11,159 $1,307 $2,688 $2,618 $2,619 $9,233
Core $2,080 $2,263 $2,191 $2,471 $9,006 $1,128 $2,239 $2,186 $2,390 $7,943
35
1 The Company notes that, similar to the first quarter of fiscal 2021, second quarter growth rates in fiscal 2021 are not fully comparable due to both last year’s extendedstore closures related to the COVID-19 pandemic in the month of June 2020 and the Company’s ongoing fleet optimization program. Therefore, Comparable SalesGrowth for the three months ended August 28, 2021 has been calculated by estimating the negative impact on June 2021 sales of the store closures in 2020 inconnection with the Company's fleet optimization program. The Company estimates that the stores closed in 2020 as part of this fleet optimization program would havecontributed approximately 2% to 3% growth to the Bed Bath banner and total company, in the second quarter of fiscal 2021. The Company believes this calculation ofcomparable sales is a more meaningful reference for the current quarter.2 Adjusted items refer to comparable sales as well as financial measures that are derived from measures calculated in accordance with GAAP, which have been adjusted toexclude certain items. Adjusted Gross Margin, Adjusted SG&A, Adjusted EBITDA, Adjusted EBITDA Margin, and Adjusted Diluted EPS are non-GAAP financial measures.For more information about non-GAAP financial measures, see “Non-GAAP Information” below.3Total Liquidity includes cash & investments and availability under the Company’s asset-based revolving credit facility.4 Leverage ratio calculated using Moody's gross debt/EBITDA ratios.
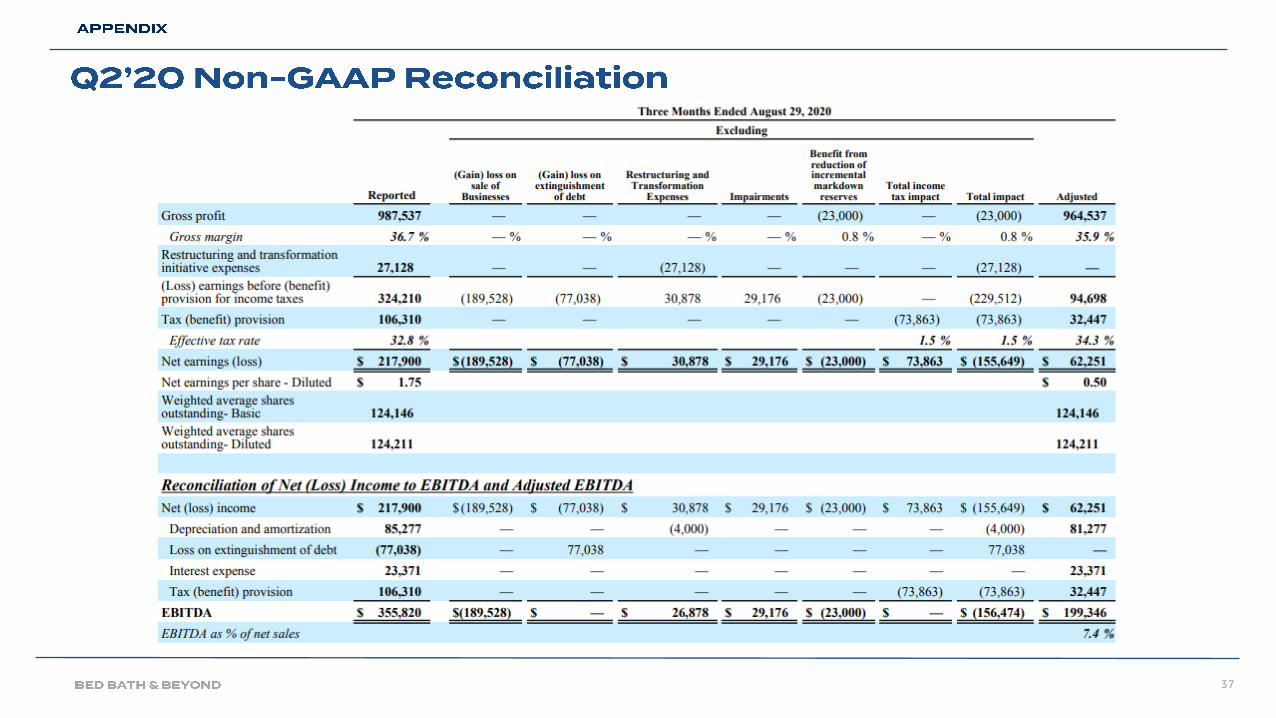
This presentation contains certain non-GAAP information, including adjusted earnings before interest, income taxes, depreciation and amortization ("EBITDA"), adjustedEBITDA margin, adjusted gross margin, adjusted SG&A, adjusted net earnings per diluted share, and free cash flow. Non-GAAP information is intended to providevisibility into the Company’s core operations and excludes special items, including non-cash impairment charges related to certain store-level assets and tradenames,loss on sale of businesses, loss on the extinguishment of debt, charges recorded in connection with the restructuring and transformation initiatives, which includesaccelerated markdowns and inventory reserves related to the planned assortment transition to Owned Brands and costs associated with store closures related to theCompany's fleet optimization and the income tax impact of these items. The Company’s definition and calculation of non-GAAP measures may differ from that of othercompanies. Non-GAAP financial measures should be viewed in addition to, and not as an alternative for, the Company’s reported GAAP financial results. For areconciliation to the most directly comparable US GAAP measures and certain information relating to the Company’s use of Non-GAAP financial measures, see “Non-GAAP Financial Measures” below.
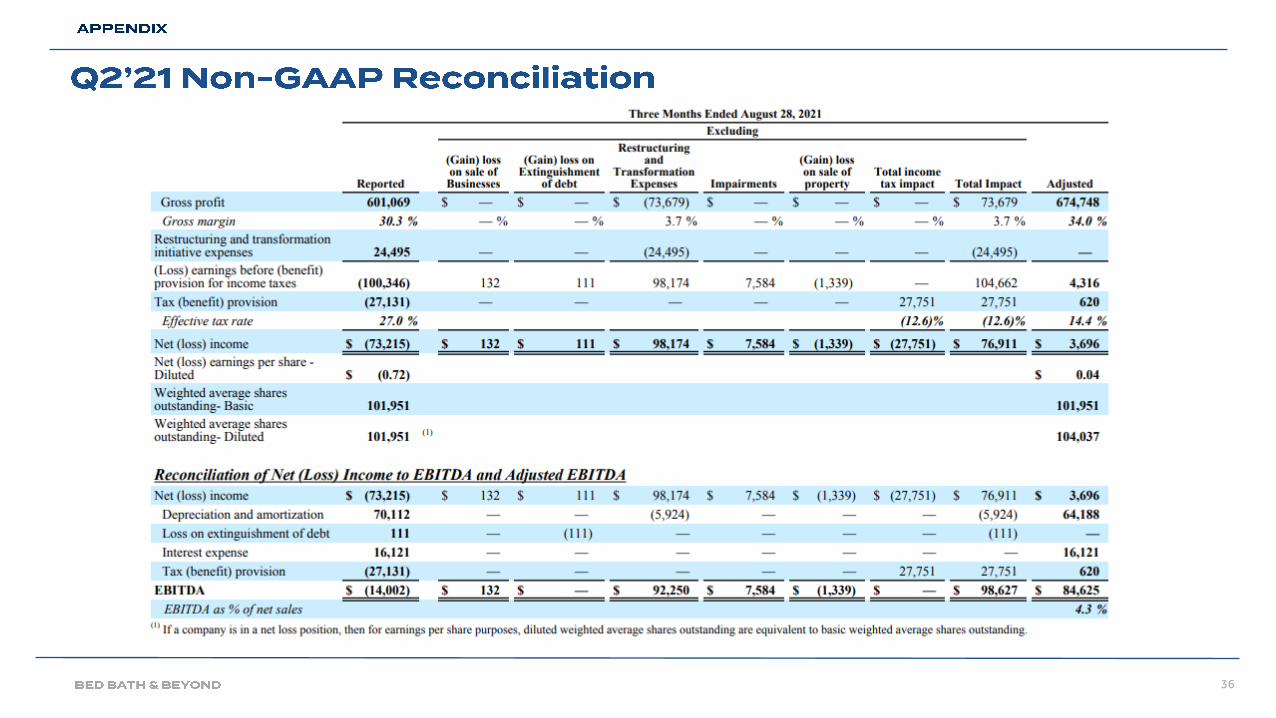
36
37

38