Embed Size (px)
Citation preview

INVESTOR
PRESENTATION
July 25, 2016
Disclaimer
Forward Looking Statements
This presentation includes "forward-looking statements", as defined in the safe harbor provisions of the US Private Securities Litigation
Reform Act of 1995. In addition to statements which are forward-looking by reason of context, the words “may”, “will”, “should”, “expects”,
“plans”, “intends”, “anticipates”, “believes”, “estimates”, “predicts”, “potential”, or “continue” and similar expressions identify forward-looking
statements. We caution you that reliance on any forward-looking statement involves risks and uncertainties that might cause actual results to
differ materially from those expressed or implied by such statements. These and other factors are more fully discussed in Videocon d2h’s
annual report on Form 20-F filed with the SEC and available at http://www.sec.gov. All information provided in this presentation is as of the
date hereof, unless the context otherwise requires. Other than as required by law, Videocon d2h does not undertake to update any forward-
looking statements or other information in this presentation.
Industry and Market Data
In this presentation, Videocon d2h relies on and refers to information and statistics regarding market shares in the sectors in which it
competes and other industry data. Videocon d2h obtained this information and statistics from third-party sources, including reports by market
research firms, such as Media Partners Asia, Ltd. Videocon d2h has supplemented this information where necessary with information from
discussions with Videocon d2h customers and its own internal estimates, taking into account publicly available information about other
industry participants and Videocon d2h’s management’s best view as to information that is not publicly available.
Earnings before interest, tax and depreciation & amortization (EBITDA)
EBITDA presented in this presentation, is a supplemental measure of performance and liquidity that is not required by or represented in
accordance with IFRS. Furthermore, EBITDA is not a measure of financial performance or liquidity under IFRS and should not be
considered as an alternative to profit after tax, operating income or other income or any other performance measures derived in accordance
with IFRS or as an alternative to cash flow from operating activities or as a measure of liquidity. In addition, EBITDA is not a standardized
term, hence direct comparison between companies using the same term may not be possible. Other companies may calculate EBITDA
differently from Videocon d2h, limiting their usefulness as comparative measures. Videocon d2h believes that EBITDA helps identify
underlying trends in its business that could otherwise be distorted by the effect of the expenses that are excluded calculating EBITDA.
Videocon d2h believes that EBITDA enhances the overall understanding of its past performance and future prospects and allows for greater
visibility with respect to key metrics used by its management in its financial and operational decision-making.
2

6.7
8.4
10.2
11.9 12.3
FY13 FY14 FY15 FY16 Q1 FY17
Videocon d2h Overview
Source: Company data
Note:
(1) Adjusted EBITDA is calculated after adding back ESOP expenses and after adding back
one off security issue expenses to Reported EBITDA
Who we are: India’s Fastest Growing DTH Company
Key Metrics
Net Subscribers Adjusted EBITDA(1)
11.3
17.6
23.4
28.6
8.2
FY13 FY14 FY15 FY16 Q1 FY17
Revenue Adjusted EBITDA less Capex
-6.7
-2.6 -1.6
0.7 0.9
FY13 FY14 FY15 FY16 Q1 FY17
► Pan India commercial operations launched in 2010
► India’s fast growing DTH operator with 12.29 million net
subscribers as of June 2016
► Strong distribution network with over 230,000 retailers
► Favourable environment driven by projected long term,
secular growth in India
► Regulatory tailwinds mandate the digitization of India’s
analog networks creating huge growth potential
► Innovator in the DTH space with advanced products
and services and highly satisfied customer base
► Founded by Saurabh Dhoot of Videocon Group &
supported by industry veterans Harry Sloan and Jeff
Sagansky
► Strong corporate governance; Board structure
comprises 9 board members, out of which only 2 board
members represent Dhoot family
0.8
3.9
6.1
8.0
2.5
FY13 FY14 FY15 FY16 Q1 FY17
(mn) (INR bn) (INR bn) (INR bn)
3
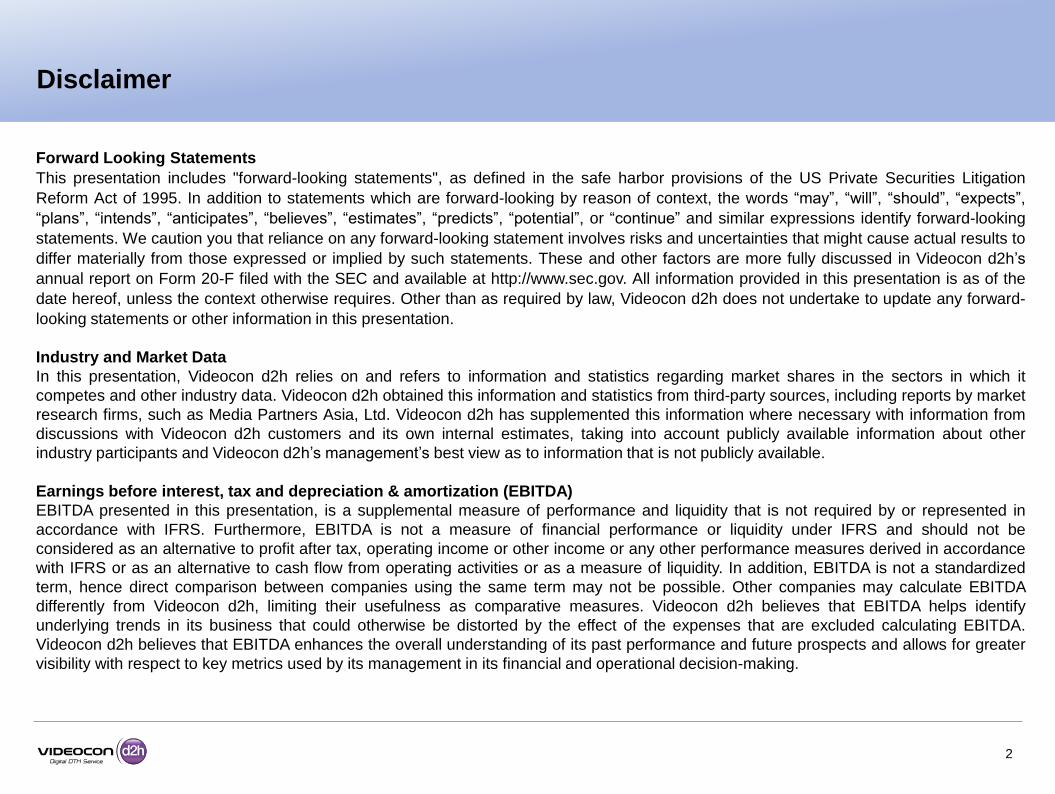
Videocon d2h Investment Highlights
1 World’s fastest growing pay TV market in the fastest growing “large economy”
2 Strong market presence and industry leading share of subscriber additions
4 Strong revenue and EBITDA growth driven by operating leverage
3 Leading distribution, customer service and content offerings
5 Robust free cash flow generation potential
4
6 Strong balance sheet with low leverage
Source: Company estimates
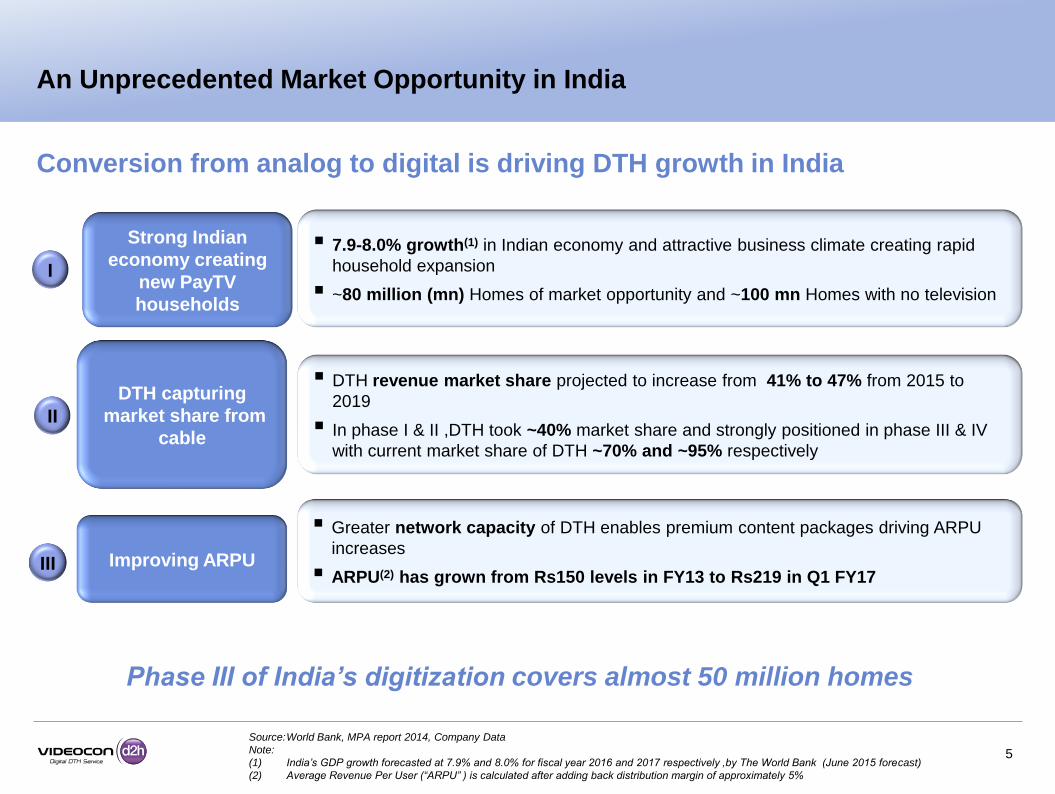
Conversion from analog to digital is driving DTH growth in India
An Unprecedented Market Opportunity in India
5
DTH revenue market share projected to increase from 41% to 47% from 2015 to
2019
In phase I & II ,DTH took ~40% market share and strongly positioned in phase III & IV
with current market share of DTH ~70% and ~95% respectively
Greater network capacity of DTH enables premium content packages driving ARPU
increases
ARPU(2) has grown from Rs150 levels in FY13 to Rs219 in Q1 FY17
7.9-8.0% growth(1) in Indian economy and attractive business climate creating rapid
household expansion
~80 million (mn) Homes of market opportunity and ~100 mn Homes with no television
Strong Indian
economy creating
new PayTV
households
DTH capturing
market share from
cable
Improving ARPU
I
II
III
Source: World Bank, MPA report 2014, Company Data
Note:
(1) India’s GDP growth forecasted at 7.9% and 8.0% for fiscal year 2016 and 2017 respectively ,by The World Bank (June 2015 forecast)
(2) Average Revenue Per User (“ARPU” ) is calculated after adding back distribution margin of approximately 5%
Phase III of India’s digitization covers almost 50 million homes

Indian Government has mandated that all of the country’s analog
networks are to be replaced with a Digital Addressable System (DAS).
Phase 4
The remainder of India
to be digitized
Deadline: December
2016
Phase 1 By 2013, 38 cities with a population
of more than
1 million went through the
digitization process
Phase 2
In 2012, four
metropolitan
areas go digital
Delhi, Mumbai,
Kolkata,
Chennai
In phases 1 and 2, DTH took ~40% market share
2012 2013 2015 2016
Cable Users Switching to DTH in Analog to Digital Conversion
6
DTH’s “Light” Infrastructure is Well Optimized Within India’s Fragmented Last Mile of Service Connection Model
Phase 3 Over 6,100 towns with a population
of more than
100,000 currently undergoing digitization process
In phases 3 and 4, DTH enjoys ~70-95% market share of the digital subscriber base
Source: Ministry of Information & Broadcasting, MPA report 2014, Company estimates

440 440 484
521
590 605 650
149 180
217 217 241 253 275
0
100
200
300
400
500
600
700
Apr-11 Apr-12 Apr-13 Apr-14 Feb-15 Sep-15 Mar-16
HD base pack price (Rs.) SD base pack price (Rs.)
Significant subscriber opportunity in the next 4-5 years
Source: MPA report 2014, Company data
* Phase III data is based on company estimates
175
202
63.0%
66.1%
2015 2020
(Pe
ne
tratio
n o
f to
tal h
ou
se
ho
lde
rs)
TV
Ho
us
eh
old
s (
in m
n)
Substantial upside in Indian PayTV ARPU
7
Steady pack price increases
$3.2 $4.5 $4.7
$9.1 $10.7 $10.9
$26.0
India China Vietnam Phillippines Thailand Indonesia Malaysia GDP growth
(‘14-’16
CAGR)
6.8% 6.5% 5.2% 5.1% 6.5% 3.2% 6.2%
~2.5x
In Rs
Strong business outlook
23
28
15
1
12
17
10 46
10
3
80
50
35
- 15 30 45 60 75 90
Phase IV
Phase III *
Phase I & II
DTH Digital cable Free dish Analog cable

Source: MPA report 2014, Company data
Note: (1) Videocon d2h offer highest number of channels and services amongst DTH operators in India as of December 31, 2015 8
Videocon d2h : Competitive Advantage
Highest no. of channels
and services in India (1)
Widespread sales &
distribution presence Pioneer in Technology &
Product Innovations Quality customer service
Competitive advantages...
Videocon d2h, ~9%
Others, ~91%
Subscriber market share in FY11
Videocon d2h, ~21%
Others, ~79%
Subscriber market share in FY16
… Resulting into market share gains

37
30 27
22
15 16 13
Tam
il
Telu
gu
Mala
yala
m
Kannada
Bengali
Mara
thi
Oriya
12
21
26 29
45 45
FY
12
FY
13
FY
14
FY
15
FY
16
Q1 F
Y17
Strong content focus
Source: Company data, Company estimate; Based on publicly available data for other companies
Note: (1) Channels count as of July 20, 2016
(2) Includes HD services
Significant regional focus (1)
d2h’s proprietary services: Fulfilling content gaps
9
HD Channel Count (2) on Videocon d2h increasing

Backed by founders with over 30 years of experience in Distribution
3 generations old loyalty in market relationship with the founder family
75% display counters have d2h demo in stores
Large shelf space occupied by brands under the parent group
93% penetration against Industry average of 85%
Market reach of more than 230,000 Retail stores; Tie up with Vodafone mPesa 1
6
2
5
Pan-India Distribution Channel
4
3
Source: Company estimates 10

Strong Focus on Customer Service
Dealer calls the call centre and gives customer details for
installation or customer complaint
Call centre raises a work
order and passes the
details to the respective
service center
Service centre assigns work order for installation or
customer complaint to an engineer
2,800+ Distributors & Direct Dealers Market reach of over 230,000 Retail stores
Fastest growing DTH company in India with 12.29 million
delighted net subscribers (1)
Nearly 320 direct service centers
97%+ installations within 2-4 hours 85%+ repairs within 6-8 hours
Source: Company data
Note: (1) As of June 30, 2016 11

Offering the Latest in Standards in Equipment, Service and Delivery
Source: Company data
Latest Technology New Offering Product Innovation
12
Technology & Innovations
HEVC
DVB S2 Advertising
TV
Everywhere
1000 GB HD
DVR
Wireless DTH
Headphone
MPEG4
DVB S2
4K 11 Proprietary
Services RF Remote

Key Metrics

0.7
6
0.6
1
0.6
6
0.6
2
0.6
1
0.5
7
0.6
7
0.7
9
0.6
0
0.6
5
0.3
7
0.3
6
0.3
6
0.4
6
0.2
0 0.4
3
0.5
9
0.4
3
Q1 FY15
Q2 FY15
Q3 FY15
Q4 FY15
Q1 FY16
Q2 FY16
Q3 FY16
Q4 FY16
Q1 FY17
Gross additions Net additions
2.6
4
2.5
4
2.4
3
2.6
4
2.6
5
2.0
8
1.8
7
1.7
3
1.7
4
1.6
8
FY12 FY13 FY14 FY15 FY16
Gross additions Net additions
9.0
9
9.4
6
9.8
2
10
.18
10
.64
10
.84
11
.27
11
.86
12
.29
Q1 FY15
Q2 FY15
Q3 FY15
Q4 FY15
Q1 FY16
Q2 FY16
Q3 FY16
Q4 FY16
Q1 FY17
Net Base
4.8
4
6.7
1
8.4
4
10
.18
11
.86
FY12 FY13 FY14 FY15 FY16
Net Base
Net Subscriber Base (mn)
Net Subscriber Base (mn)
Gross and Net Subscribers
Gross & Net Subscriber Additions (mn)
Gross & Net Subscriber Additions (mn)
14
Source: Company data
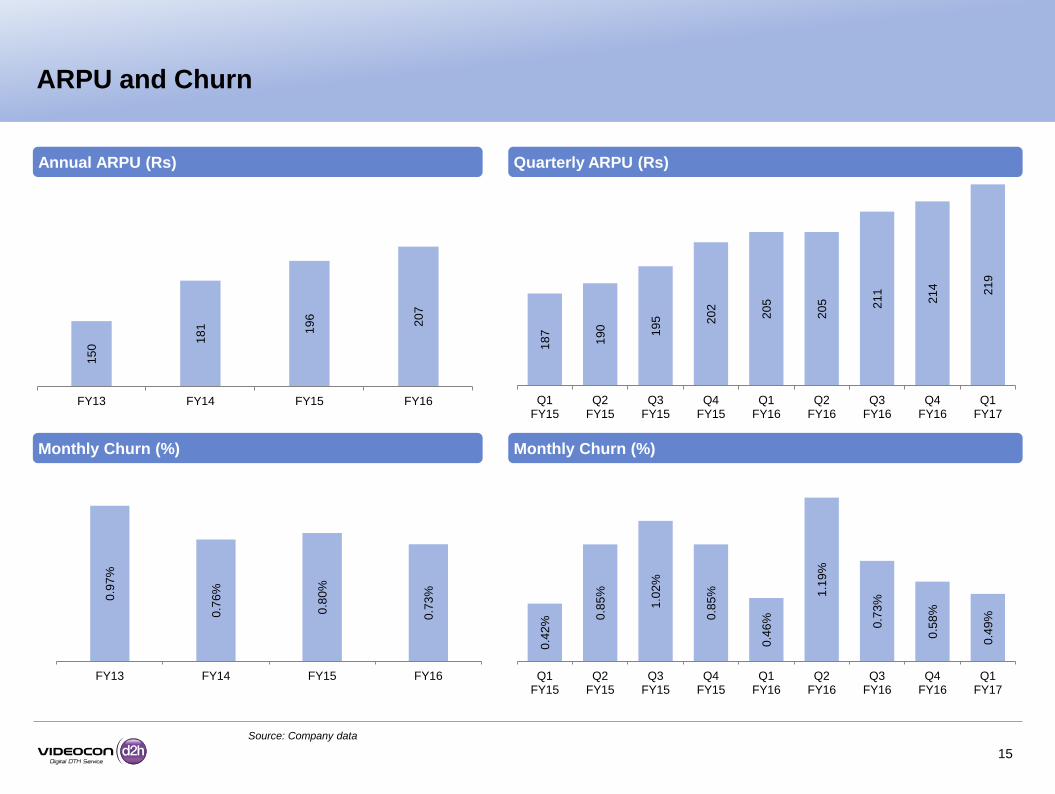
0.4
2%
0.8
5%
1.0
2%
0.8
5%
0.4
6%
1.1
9%
0.7
3%
0.5
8%
0.4
9%
Q1 FY15
Q2 FY15
Q3 FY15
Q4 FY15
Q1 FY16
Q2 FY16
Q3 FY16
Q4 FY16
Q1 FY17
18
7
19
0
19
5
20
2
20
5
20
5
21
1
21
4
21
9
Q1 FY15
Q2 FY15
Q3 FY15
Q4 FY15
Q1 FY16
Q2 FY16
Q3 FY16
Q4 FY16
Q1 FY17
0.9
7%
0.7
6%
0.8
0%
0.7
3%
FY13 FY14 FY15 FY16
15
0 1
81
19
6
20
7
FY13 FY14 FY15 FY16
ARPU Monthly Churn (%)
Annual ARPU (Rs)
ARPU and Churn
Monthly Churn (%)
Quarterly ARPU (Rs)
15
Source: Company data

163
194 209
218 214 221 222 226
11
43 55 61 59 61 63 70
FY13 FY14 FY15 Q1 FY16 Q2 FY16 Q3 FY16 Q4 FY16 Q1 FY17
Total revenue per sub EBITDA per sub
2,0
90
1,8
90
1,9
84
1,7
93
**
1,7
75
**
1,7
26
**
1,7
76
**
1,8
72
**
FY13 FY14 FY15 Q1 FY16 Q2 FY16 Q3 FY16 Q4 FY16 Q1 FY17
5.4
5.7
6.0
6.3
6.6
6.9
7.3
7.7
8.2
1.5
1.4
1.4
1.8
*
1.9
*
1.9
*
2.0
*
2.2
*
2.5
*
27.6% 25.2% 23.5% 28.0%
28.7% 27.7% 27.4%
28.4% 30.8%
15%
20%
25%
30%
35%
0
9
Q1 FY15
Q2 FY15
Q3 FY15
Q4 FY15
Q1 FY16
Q2 FY16
Q3 FY16
Q4 FY16
Q1 FY17
Revenue EBITDA EBITDA %
SAC per sub (Rs)
Annual Revenue & Adjusted EBITDA (Rs billion)
Revenue and EBITDA
Revenue and EBITDA per avg. net sub (Rs per month)
Quarterly Revenue & Adjusted EBITDA (Rs billion)
16
Source: Company data
Note: * Q4 FY15 Adjusted EBIDTA is before accounting for one off securities issue expenses of Rs 105.43 mn and Employee Share based Compensations cost
of Rs. 29.74 mn towards provision of ESOP plan of 2014; Q1-Q4 FY16 & Q1 FY17 Adjusted EBITDA is before accounting for Employee Share based
Compensations cost towards provision of ESOP plan of 2014
** Q1-Q4 FY16 & Q1 FY17 SAC represents hardware subsidy only, excludes marketing cost.
11.3
17.6
23.4
28.6
0.8
3.9
6.1
*
8.0
*
6.8%
22.2%
26.1% 28.1%
0%
5%
10%
15%
20%
25%
30%
0
30
FY13 FY14 FY15 FY16
Revenue EBITDA EBITDA %

32.7% 34.8% 38.3% 38.4% 37.0% 38.1% 38.5% 37.5% 36.1%
17.3% 17.6% 16.0% 17.8% 16.1% 15.6% 15.6% 16.6% 15.0%
22.4% 22.4% 22.2% 17.9% 18.6% 19.0% 18.9% 17.9% 18.4%
27.6% 25.2% 23.5% 25.9% 28.3% 27.3% 27.0% 28.0% 30.5%
Q1 FY15
Q2 FY15
Q3 FY15
Q4 FY15
Q1 FY16
Q2 FY16
Q3 FY16
Q4 FY16
Q1 FY17
Content costs Fixed costs Variable costs Reported EBITDA margin
(6,728)
(2,580)
(1,558)
744 887
FY13 FY14 FY15 FY16 Q1 FY17
Adjusted EBITDA less capex
7,501
6,502
7,649 7,269
1,632
FY13 FY14 FY15 FY16 Q1 FY17
Capex
Capex (Rs mn)
Operating Leverage and Cash Flow
Adjusted EBITDA* less capex (Rs mn)
Source: Company data
Note: * Adjusted EBIDTA is before accounting for one off securities issue expenses and Employee Share based Compensations costs
towards provision of ESOP plan of 2014 17
Fixed, Variable and Content Cost (% of Revenue) Fixed, Variable and Content Cost (% of Revenue)
40.4% 34.1% 36.2% 37.8%
22.6% 20.6% 17.2% 16.0%
30.1%
23.1% 21.1% 18.6%
6.8% 22.2% 25.5% 27.6%
FY13 FY14 FY15 FY16
Content costs Fixed costs Variable costs EBITDA margin
Appendix

Financial Results (Unaudited) – Quarterly profit and loss
20
Rs in mn Q1FY15 Q2FY15 Q3FY15 Q4FY15 Q1FY16 Q2FY16 Q3FY16 Q4FY16 Q1FY17
INCOME
Revenue from operations 5,375 5,734 6,015 6,253 6,628 6,901 7,315 7,715 8,185
5,375 5,734 6,015 6,253 6,628 6,901 7,315 7,715 8,185
EXPENSE
Operating expense 3,090 3,381 3,746 3,637 3,791 4,021 4,266 4,414 4,547
Employee benefits expense 244 245 250 285 309 303 304 291 322
Administration and other expenses 127 157 152 253 146 198 178 183 178
Selling and distribution expenses 432 507 457 461 509 496 590 664 640
Depreciation, amortization and
impairment 1,245 1,284 1,348 1,410 1,427 1,489 1,508 1,665 1,711
Total Expenses 5,137 5,573 5,952 6,045 6,181 6,507 6,846 7,218 7,398
Profit / (Loss) from operations 238 161 63 207 447 394 469 497 787
Finance costs/Finance Income
(Net) (1,045) (1,049) (1,219) (1,301) (765) (802) (797) (778) (759)
Other Income 0 0 0 (1) 12 6 9 9 9
Profit/(loss) before tax (807) (888) (1,155) (1,094) (307) (402) (319) (272) 38
Income tax expense
Current tax - - - - - - - - -
Deferred tax (249) (275) (357) (337) (63) (156) (99) (60) 11
Profit/(Loss) after tax (558) (614) (798) (757) (244) (246) (220) (212) 27