Embed Size (px)
Citation preview

Investor Presentation
February 2019
// 2February 2019
(segmental or other) information in the consolidated financialstatements of the former METRO Group and, thus, may not befully comparable to such financial statements. Historicalinformation contained in this presentation which is not taken orderived from the unaudited combined financial statements ismostly based on or derived from the consolidated (interim)financial statements for the respective period. Financialinformation with respect to the business of MediaMarktSaturnRetail Group is particularly based on or derived from the segmentreporting contained in these financial statements. In addition, thehistorical financial and operative information included in thispresentation is not necessarily indicative for the operationalresults, the financial position and/or the cash flow of theCECONOMY business on a stand-alone basis neither in the pastnor in the future and may, in particular, deviate from anyhistorical financial information based on corresponding combinedfinancial statements with respect to the CECONOMY business.Given the aforementioned uncertainties, readers are cautionednot to place undue reliance on any of this information. Norepresentation or warranty is given and no liability is assumed byCECONOMY, express or implied, as to the accuracy, correctness orcompleteness of the information contained in this presentation.All numbers shown are before special items, unless otherwisestated. All amounts are stated in million euros (€ million) unlessotherwise indicated. Amounts below €0.5 million are roundedand reported as 0. Rounding differences may occur.
This presentation contains certain supplemental financial oroperative measures that are not calculated in accordance withIFRS and are therefore considered as non-IFRS measures. Webelieve that such non-IFRS measures used, when considered inconjunction with (but not in lieu of) other measures that arecomputed in accordance with IFRS, enhance the understanding of
our business, results of operations, financial position or cashflows. There are, however, material limitations associated withthe use of non-IFRS measures including (without limitation) thelimitations inherent in the determination of relevant adjustments.The non-IFRS measures used by us may differ from, and not becomparable to, similarly-titled measures used by othercompanies.
To the extent that statements in this presentation do not relate tohistorical or current facts they constitute forward-lookingstatements. All forward-looking statements herein are based oncertain estimates, expectations and assumptions at the time ofpublication of this presentation and there can be no assurancethat these estimates, expectations and assumptions are or willprove to be accurate. Furthermore, the forward-lookingstatements are subject to risks and uncertainties including(without limitation) future market and economic conditions, thebehaviour of other market participants, investments in innovativesales formats, expansion in online and multichannel salesactivities, integration of acquired businesses and achievement ofanticipated cost savings and productivity gains, and the actions ofpublic authorities and other third parties, many of which arebeyond our control, that could cause actual results, performanceor financial position to differ materially from any future results,performance or financial position expressed or implied in thispresentation. Accordingly, no representation or warranty (expressor implied) is given that such forward-looking statements,including the underlying estimates, expectations andassumptions, are correct or complete. Readers are cautioned notto place reliance on these forward-looking statements.
BY ACCESSING THIS PRESENTATION YOU AGREE TO THEFOLLOWING RESTRICTIONS
This document and the presentation to which it relates isintended for information only, does not constitute a prospectusor similar document and should not be treated as investmentadvice. It is not intended and should not be construed as an offerfor sale, or as a solicitation of an offer to purchase or subscribe to,any securities in any jurisdiction. Neither this presentation noranything contained therein shall form the basis of, or be reliedupon in connection with, any commitment or contractwhatsoever. This presentation may not, at any time, bereproduced, distributed or published (in whole or in part) withoutprior written consent of CECONOMY AG (“CECONOMY”).
Historical financial or operative information contained in thispresentation, if not taken or derived from our accounting recordsor our management reporting or unless otherwise stated, is takenor derived from the unaudited combined financial statements ofCECONOMY for the respective period and not from theconsolidated (interim) financial statements of the former METROGroup. The combined financial statements of CECONOMY havenot been audited and may also deviate substantially from
DISCLAIMER AND NOTES
PublicInvestor Presentation
// 3February 2019
We do not undertake any obligation to publicly update anyforward-looking statements or to conform them to events orcircumstances after the date of this presentation. Thispresentation contains forecasts, statistics, data and otherinformation relating to markets, market sizes, market shares,market positions and other industry data on the Company’sbusiness and markets (together the “market data”) provided bythird party sources as interpreted by us. This market data is, inpart, derived from published research and additional marketstudies prepared primarily as a research tool and reflectsestimates of market conditions based on research methodologiesincluding primary research, secondary sources and econometricmodelling. We want to point out that part of the market dataused has been collected in the framework of a market surveycarried out as a panel observation. The panel is a regular surveymonitoring sales of specific products and product categories,using a range of distribution channels including internet, retailoutlets (e.g. high street, mail order) and companies (e.g.resellers). The market data does not represent actual sales figuresglobally or in any given country; rather, the market datarepresents a statistical projection of sales in a given territory andis subject to the limitations of statistical error and adjustments atany time (e.g. reworks, changes in panel structure). Therepresentativeness of the market data may be impacted byfactors such as product categorisation, channel distribution andsupplier universe identification and statistical sampling andextrapolation methodologies. The market data presented is basedon statistical methods and extrapolation. In addition, marketresearch data and trend information as interpreted or used by
CECONOMY is based on certain estimates and assumptions andthere can be no assurance that these estimates and assumptionsas well as any interpretation of the relevant information byCECONOMY are accurate. The market research institutes whichdata CECONOMY used as basis for this presentation are neitherregistered broker dealers nor financial advisors and the permitteduse of any market research data does not constitute financialadvise or recommendations.
CECONOMY operates, in part, in industries and channels forwhich it is difficult to obtain precise market data. Such marketdata should therefore be considered with caution and not besolely relied on as market studies are often based on informationand assumptions that may be inaccurate or inappropriate, andtheir methodology is inherently predictive and speculative. Wehave no reason to believe that such information is false ormisleading or that any material fact has been omitted that wouldrender such information false or misleading. Our own estimateshave not been checked or verified externally. They may differfrom estimates made by competitors of our group or from futurestudies conducted by market research institutes or otherindependent sources. Information prepared by third parties hasnot been independently verified by us or any other party.
Therefore you acknowledge that the market data presented isbased on statistical methods and extrapolation and so due to thenature of such data no guarantee for completeness and accuracycan be given by us or any third party. Neither we nor any thirdparty, including those third parties whose data is cited in this
presentation, warrant that the data collected, processed andanalysed by it in accordance with the rules and methods ofmarket and social research, will be able to be used by in a specificway, in particular not in the legal sense of an expert report. Itshould be noted that all liability for completeness and correctnessof the information provided by us or any third party is explicitlyexcluded. Under no circumstance shall a third party whose data iscited in this presentation be liable for damages incurred throughor in connection with your or our interpretation of the providedinformation. Neither we nor any third party shall be responsiblefor any loss or damage arising out of your or our use or relianceupon the information contained herein, or for actions of anddecisions taken by us, you or any third parties that receive thisinformation. Neither we nor any third party give anyrepresentations as to the accuracy of the market data included inthis presentation. The third parties whose data is cited in thispresentation are neither registered broker-dealers nor financialadvisors and the permitted use of any market research data doesnot constitute financial advice or recommendations.
Disclaimer and Notes (cont’d)
PublicInvestor Presentation

// 4February 2019
CECONOMY at a glance//
// 5February 2019
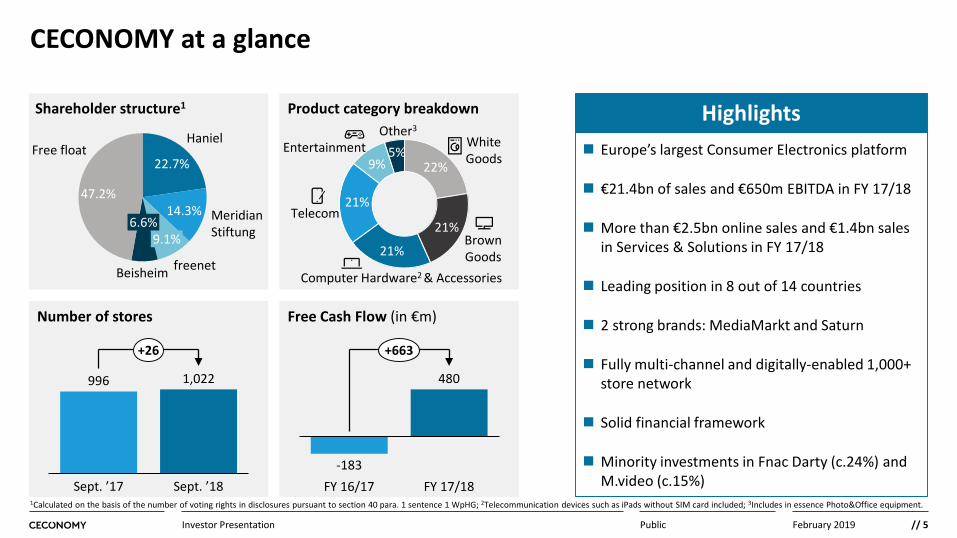
CECONOMY at a glance
PublicInvestor Presentation
Europe’s largest Consumer Electronics platform
€21.4bn of sales and €650m EBITDA in FY 17/18
More than €2.5bn online sales and €1.4bn sales in Services & Solutions in FY 17/18
Leading position in 8 out of 14 countries
2 strong brands: MediaMarkt and Saturn
Fully multi-channel and digitally-enabled 1,000+ store network
Solid financial framework
Minority investments in Fnac Darty (c.24%) and M.video (c.15%)
HighlightsShareholder structure1 Product category breakdown
Number of stores Free Cash Flow (in €m)
996
Sept. ’17 Sept. ’18
1,022
+26
freenet
9.1%
22.7%
Beisheim
Haniel
6.6%14.3% Meridian
Stiftung
47.2%
Free float22%
21%
21%
21%
9%5%
WhiteGoods
BrownGoods
Computer Hardware2 & Accessories
Telecom
EntertainmentOther3
-183
480
FY 16/17 FY 17/18
+663
1Calculated on the basis of the number of voting rights in disclosures pursuant to section 40 para. 1 sentence 1 WpHG; 2Telecommunication devices such as iPads without SIM card included; 3Includes in essence Photo&Office equipment.
// 6February 2019
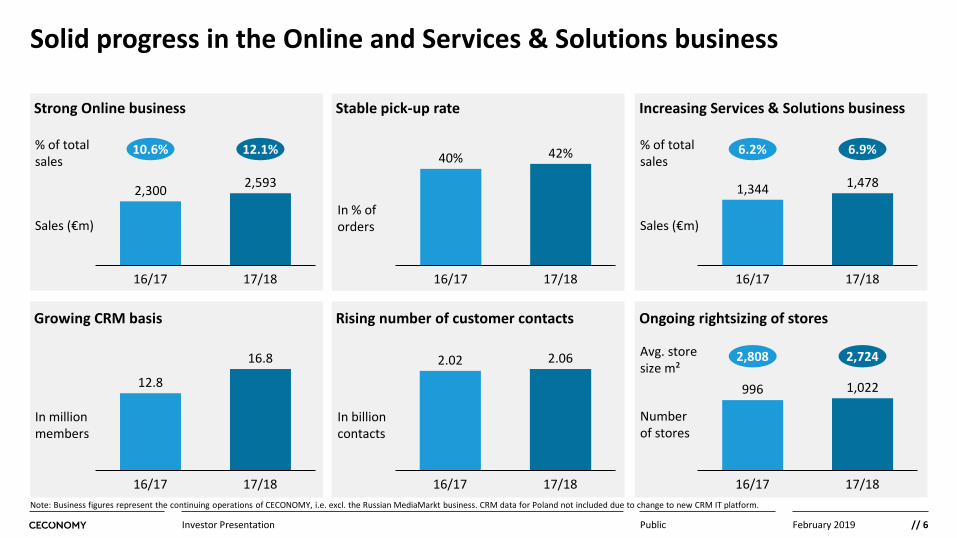
Solid progress in the Online and Services & Solutions business
PublicInvestor Presentation
Strong Online business
10.6% 12.1%
Sales (€m)
% of totalsales
Stable pick-up rate Increasing Services & Solutions business
Ongoing rightsizing of stores
Numberof stores
Growing CRM basis Rising number of customer contacts
17/1816/17
2,5932,300
16/17
42%40%
17/18
In % of orders
6.2% 6.9%
Sales (€m)
% of totalsales
16/17 17/18
1,344 1,478
16.8
16/17 17/18
12.8
In million members
16/17 17/18
2.02 2.06
In billion contacts
2,808 2,724Avg. store size m²
996
16/17 17/18
1,022
Note: Business figures represent the continuing operations of CECONOMY, i.e. excl. the Russian MediaMarkt business. CRM data for Poland not included due to change to new CRM IT platform.
// 7February 2019
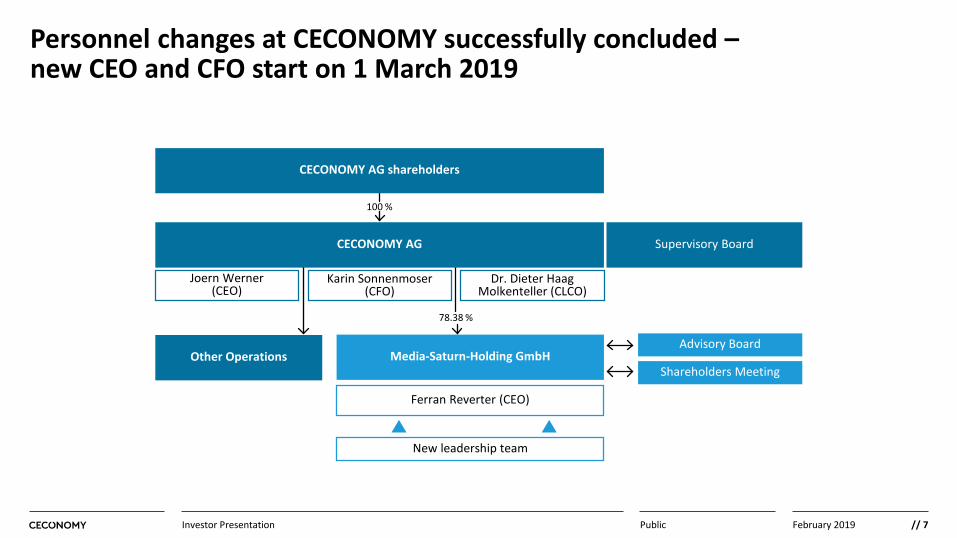
Personnel changes at CECONOMY successfully concluded –new CEO and CFO start on 1 March 2019
PublicInvestor Presentation
Other Operations Media-Saturn-Holding GmbH
CECONOMY AG shareholders
100 %
78.38 %
Supervisory Board
Joern Werner(CEO)
Karin Sonnenmoser (CFO)
Dr. Dieter Haag Molkenteller (CLCO)
Ferran Reverter (CEO)
CECONOMY AG
Advisory Board
Shareholders Meeting
New leadership team
// 8February 2019
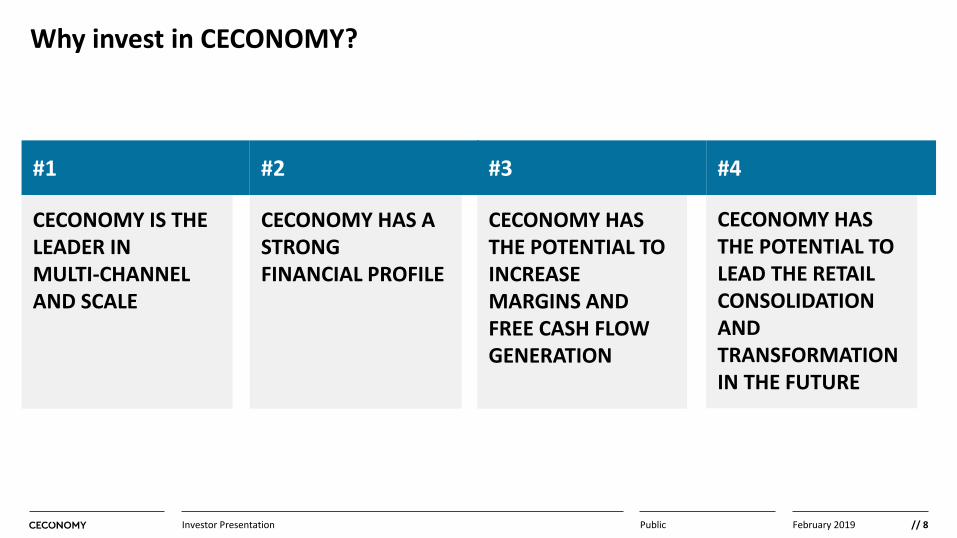
Why invest in CECONOMY?
PublicInvestor Presentation
CECONOMY HAS THE POTENTIAL TO LEAD THE RETAIL CONSOLIDATION AND TRANSFORMATION IN THE FUTURE
CECONOMY HAS A STRONG FINANCIAL PROFILE
#4
CECONOMY HAS THE POTENTIAL TO INCREASE MARGINS AND FREE CASH FLOW GENERATION
#3#2
CECONOMY IS THE LEADER IN MULTI-CHANNEL AND SCALE
#1
// 9February 2019
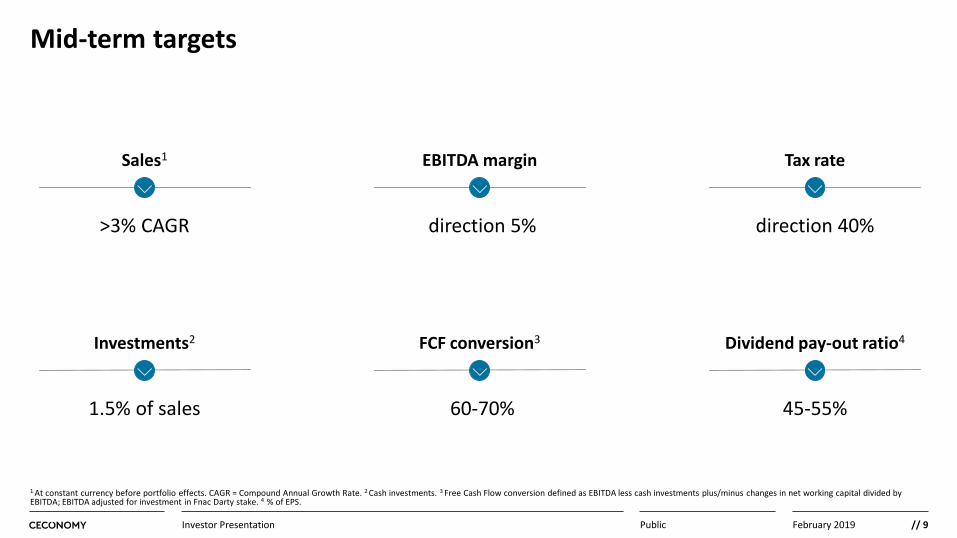
Mid-term targets
PublicInvestor Presentation
Sales1 EBITDA margin Tax rate
>3% CAGR direction 5% direction 40%
Investments2 FCF conversion3 Dividend pay-out ratio4
1.5% of sales 60-70% 45-55%
1 At constant currency before portfolio effects. CAGR = Compound Annual Growth Rate. 2 Cash investments. 3 Free Cash Flow conversion defined as EBITDA less cash investments plus/minus changes in net working capital divided by EBITDA; EBITDA adjusted for investment in Fnac Darty stake. 4 % of EPS.

// 10February 2019
Q1 2018/19 Results//
// 11February 2019
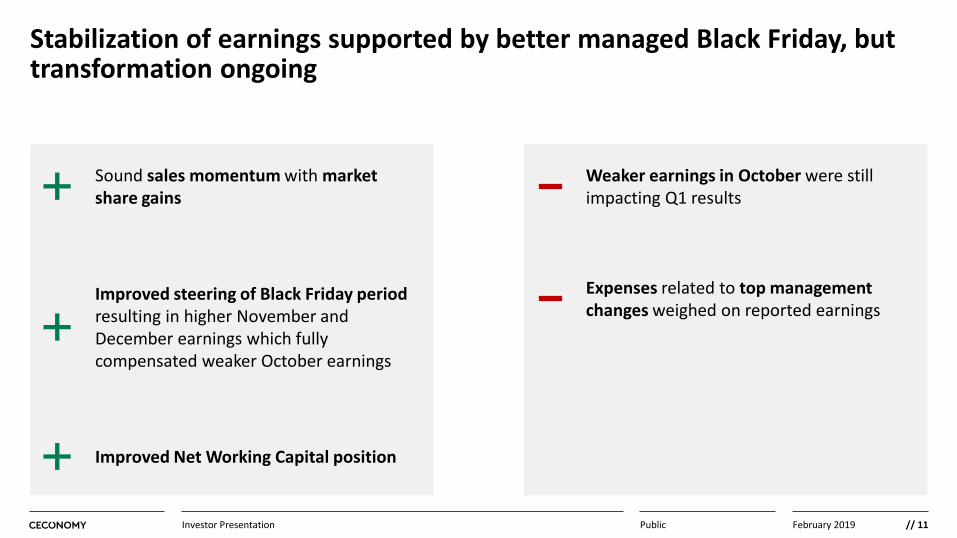
Sound sales momentum with market share gains
Improved Net Working Capital position
Stabilization of earnings supported by better managed Black Friday, but transformation ongoing
PublicInvestor Presentation
Weaker earnings in October were still impacting Q1 results
Improved steering of Black Friday period resulting in higher November and December earnings which fully compensated weaker October earnings
Expenses related to top management changes weighed on reported earnings
// 12February 2019
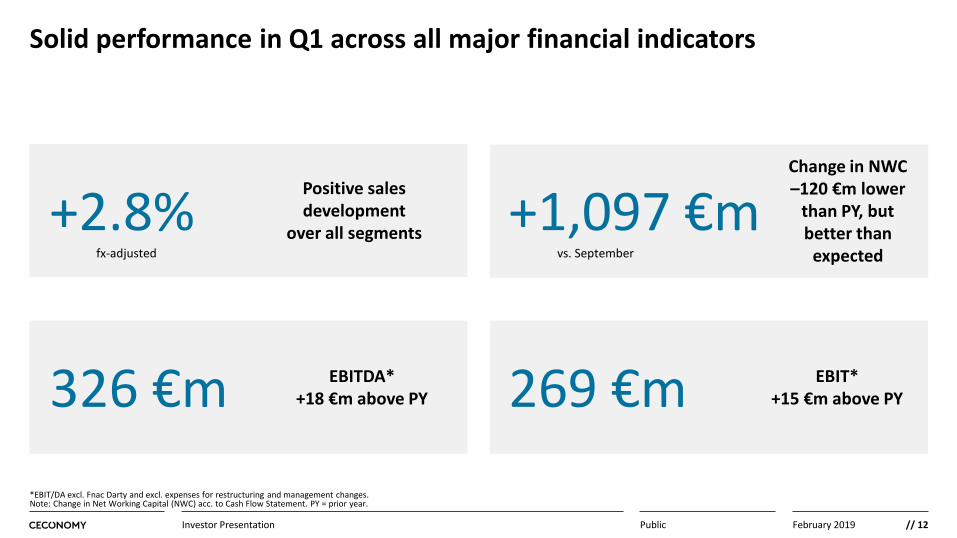
Solid performance in Q1 across all major financial indicators
PublicInvestor Presentation
+2.8% Positive sales development
over all segmentsfx-adjusted
+1,097 €mChange in NWC –120 €m lower
than PY, but better than
expected
326 €m EBITDA*+18 €m above PY 269 €m EBIT*
+15 €m above PY
*EBIT/DA excl. Fnac Darty and excl. expenses for restructuring and management changes. Note: Change in Net Working Capital (NWC) acc. to Cash Flow Statement. PY = prior year.
vs. September
// 13February 2019
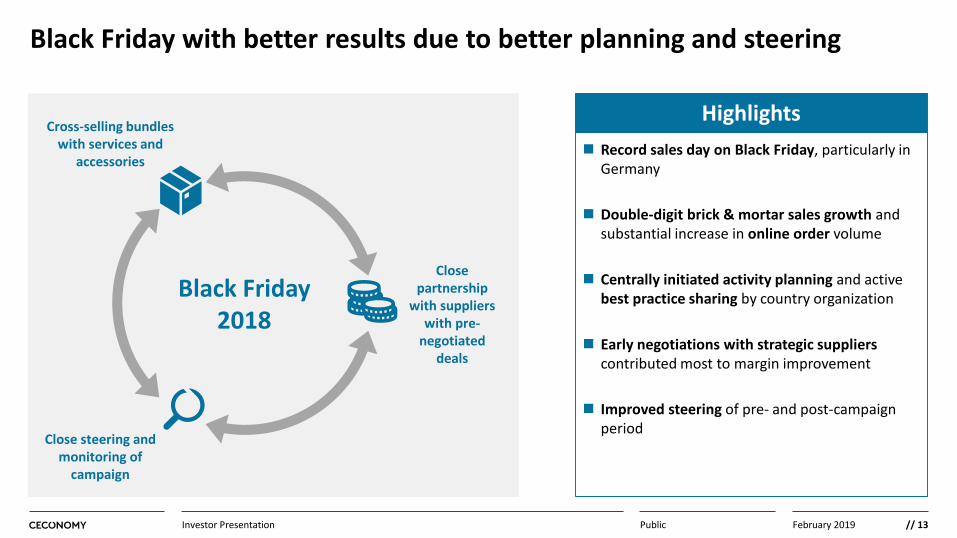
Black Friday with better results due to better planning and steering
PublicInvestor Presentation
Record sales day on Black Friday, particularly in Germany
Double-digit brick & mortar sales growth and substantial increase in online order volume
Centrally initiated activity planning and active best practice sharing by country organization
Early negotiations with strategic suppliers contributed most to margin improvement
Improved steering of pre- and post-campaign period
HighlightsCross-selling bundles
with services and accessories
Close steering and monitoring of
campaign
Close partnership
with suppliers with pre-
negotiated deals
Black Friday 2018
// 14February 2019
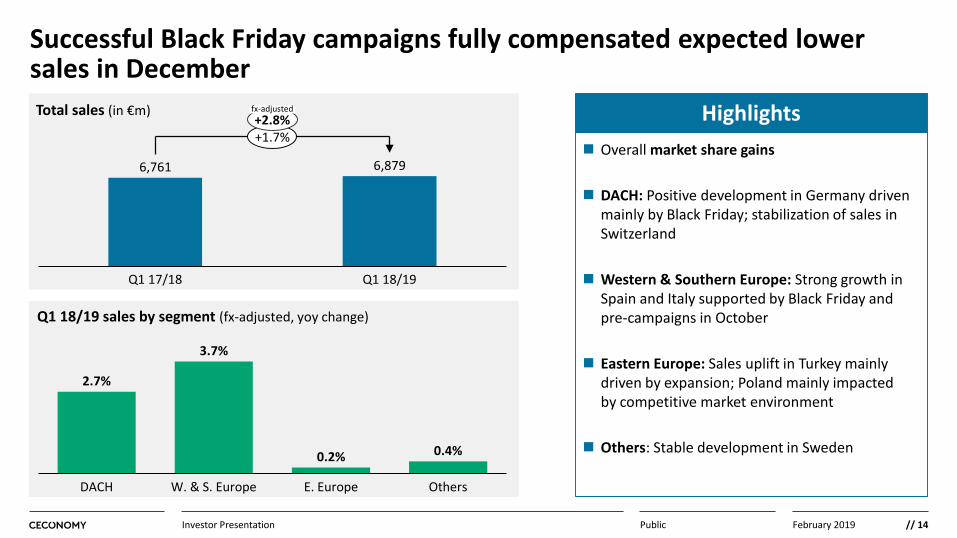
Successful Black Friday campaigns fully compensated expected lower sales in December
PublicInvestor Presentation
Total sales (in €m)
Q1 18/19 sales by segment (fx-adjusted, yoy change)
Overall market share gains
DACH: Positive development in Germany driven mainly by Black Friday; stabilization of sales in Switzerland
Western & Southern Europe: Strong growth in Spain and Italy supported by Black Friday and pre-campaigns in October
Eastern Europe: Sales uplift in Turkey mainly driven by expansion; Poland mainly impacted by competitive market environment
Others: Stable development in Sweden
OthersE. Europe
0.2%
DACH
0.4%
W. & S. Europe
2.7%
3.7%
Q1 17/18
6,8796,761
Q1 18/19
+1.7%Highlights+2.8%
fx-adjusted
// 15February 2019
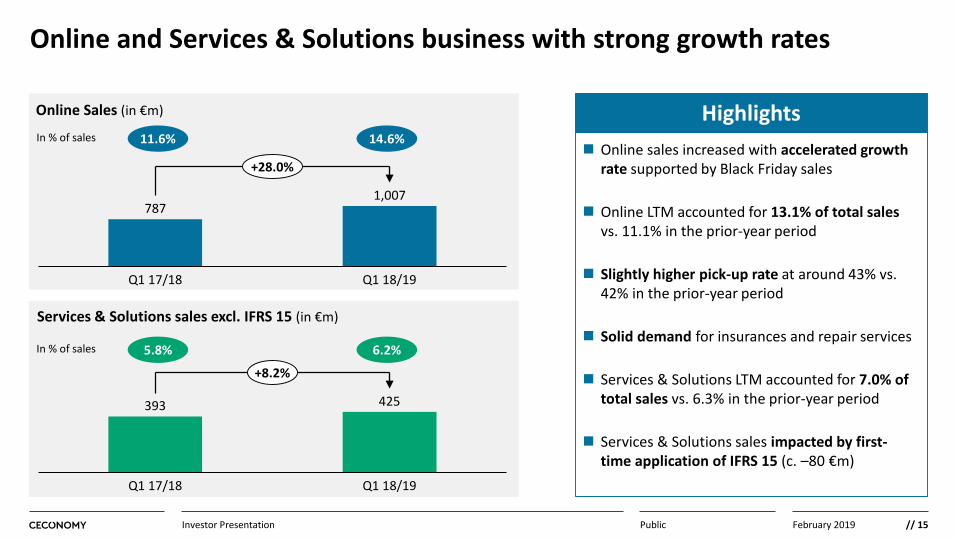
Online and Services & Solutions business with strong growth rates
PublicInvestor Presentation
Online Sales (in €m)
Services & Solutions sales excl. IFRS 15 (in €m)
Online sales increased with accelerated growth rate supported by Black Friday sales
Online LTM accounted for 13.1% of total sales vs. 11.1% in the prior-year period
Slightly higher pick-up rate at around 43% vs. 42% in the prior-year period
Solid demand for insurances and repair services
Services & Solutions LTM accounted for 7.0% of total sales vs. 6.3% in the prior-year period
Services & Solutions sales impacted by first-time application of IFRS 15 (c. –80 €m)
Highlights
393 425
Q1 17/18 Q1 18/19
+8.2%
6.2%5.8%
Q1 18/19Q1 17/18
1,007787
+28.0%
14.6%11.6%
In % of sales
In % of sales
// 16February 2019
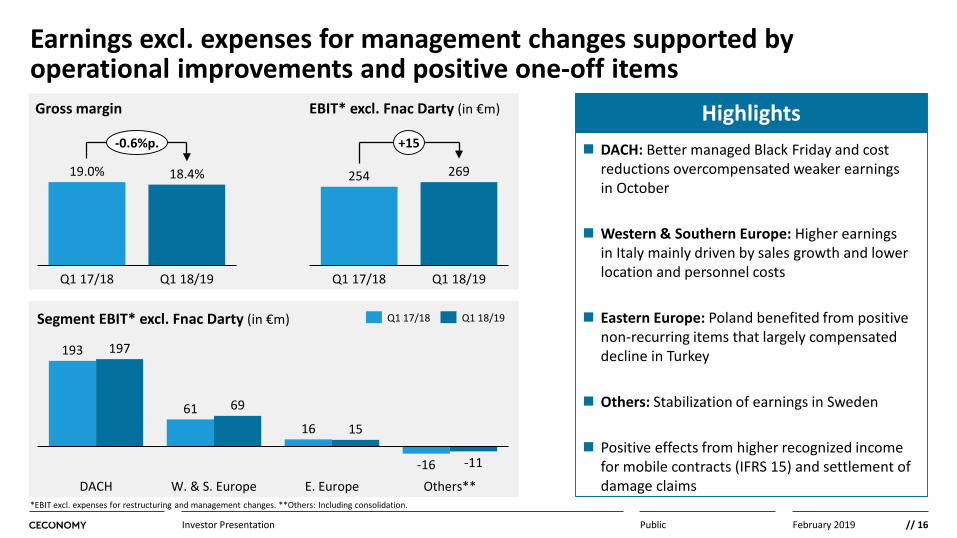
Earnings excl. expenses for management changes supported by operational improvements and positive one-off items
PublicInvestor Presentation
Segment EBIT* excl. Fnac Darty (in €m)
193
6116
-16
197
69
15
-11
Others**E. EuropeDACH W. & S. Europe
Q1 17/18 Q1 18/19
*EBIT excl. expenses for restructuring and management changes. **Others: Including consolidation.
DACH: Better managed Black Friday and cost reductions overcompensated weaker earnings in October
Western & Southern Europe: Higher earnings in Italy mainly driven by sales growth and lower location and personnel costs
Eastern Europe: Poland benefited from positive non-recurring items that largely compensated decline in Turkey
Others: Stabilization of earnings in Sweden
Positive effects from higher recognized income for mobile contracts (IFRS 15) and settlement of damage claims
Highlights
Q1 17/18
18.4%19.0%
Q1 18/19
-0.6%p.
254 269
Q1 17/18 Q1 18/19
+15
Gross margin EBIT* excl. Fnac Darty (in €m)
// 17February 2019
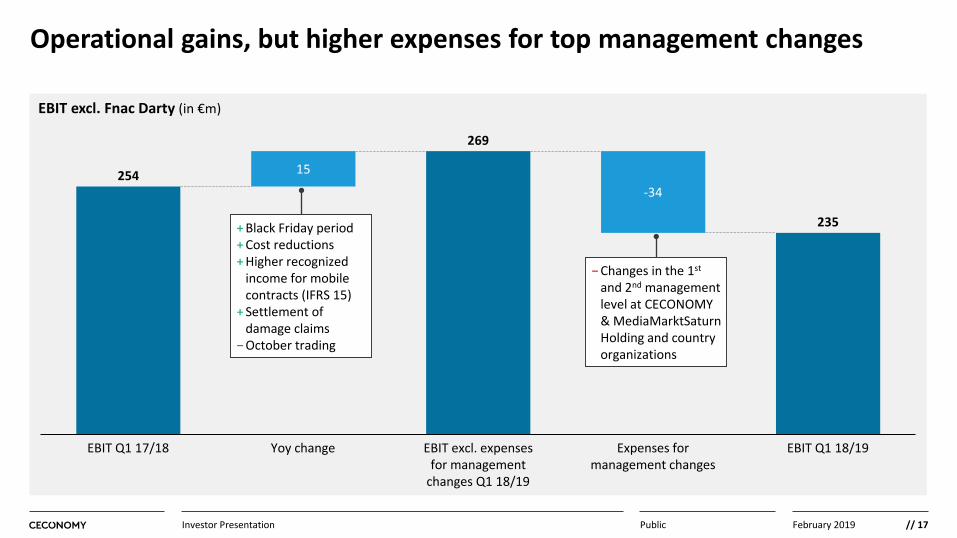
Operational gains, but higher expenses for top management changes
EBIT excl. Fnac Darty (in €m)
254
269
235
15
EBIT Q1 17/18
-34
EBIT excl. expenses for management
changes Q1 18/19
Yoy change Expenses for management changes
EBIT Q1 18/19
PublicInvestor Presentation
− Changes in the 1st
and 2nd management level at CECONOMY & MediaMarktSaturn Holding and country organizations
+ Black Friday period+ Cost reductions+ Higher recognized
income for mobile contracts (IFRS 15)
+ Settlement of damage claims
− October trading
// 18February 2019
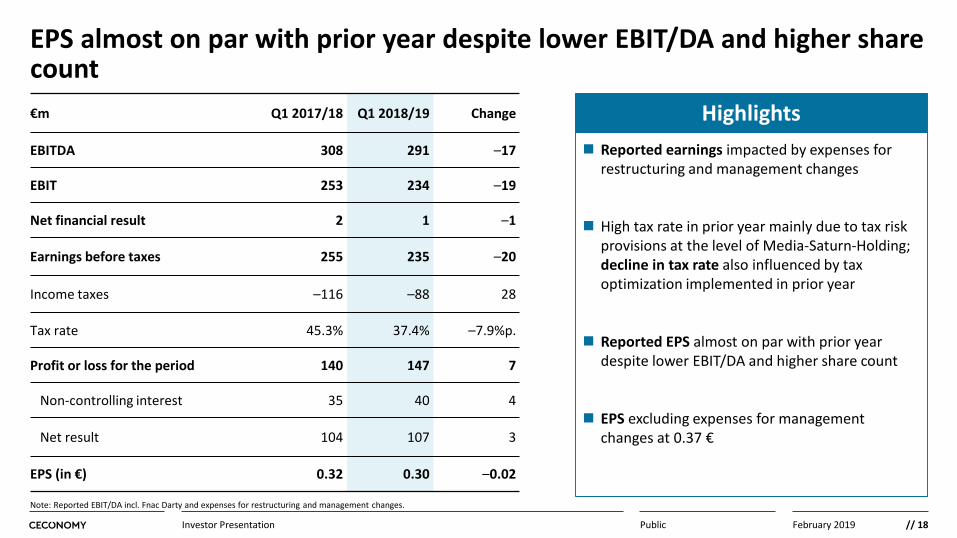
EPS almost on par with prior year despite lower EBIT/DA and higher share count
PublicInvestor Presentation
€m Q1 2017/18 Q1 2018/19 Change
EBITDA 308 291 –17
EBIT 253 234 –19
Net financial result 2 1 –1
Earnings before taxes 255 235 –20
Income taxes –116 –88 28
Tax rate 45.3% 37.4% –7.9%p.
Profit or loss for the period 140 147 7
Non-controlling interest 35 40 4
Net result 104 107 3
EPS (in €) 0.32 0.30 –0.02
Reported earnings impacted by expenses for restructuring and management changes
High tax rate in prior year mainly due to tax risk provisions at the level of Media-Saturn-Holding; decline in tax rate also influenced by tax optimization implemented in prior year
Reported EPS almost on par with prior year despite lower EBIT/DA and higher share count
EPS excluding expenses for management changes at 0.37 €
Highlights
Note: Reported EBIT/DA incl. Fnac Darty and expenses for restructuring and management changes.
// 19February 2019
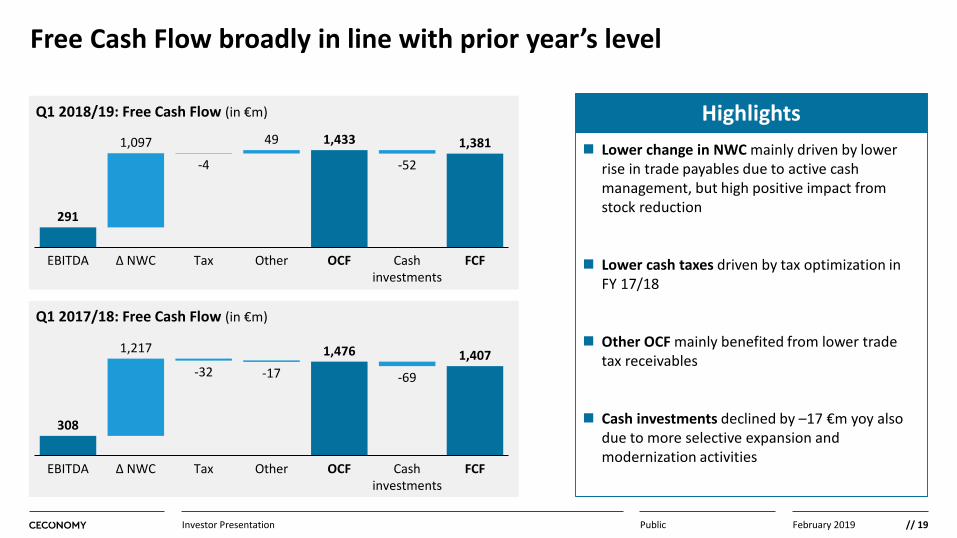
Free Cash Flow broadly in line with prior year’s level
PublicInvestor Presentation
Q1 2018/19: Free Cash Flow (in €m)
Q1 2017/18: Free Cash Flow (in €m)
308
OCFEBITDA Δ NWC OtherTax FCFCash investments
1,217
-32 -171,476
-691,407
291
49
EBITDA Tax OtherΔ NWC FCFOCF Cash investments
-4
1,4331,097
-521,381 Lower change in NWC mainly driven by lower
rise in trade payables due to active cash management, but high positive impact from stock reduction
Lower cash taxes driven by tax optimization in FY 17/18
Other OCF mainly benefited from lower trade tax receivables
Cash investments declined by –17 €m yoy also due to more selective expansion and modernization activities
Highlights
// 20February 2019
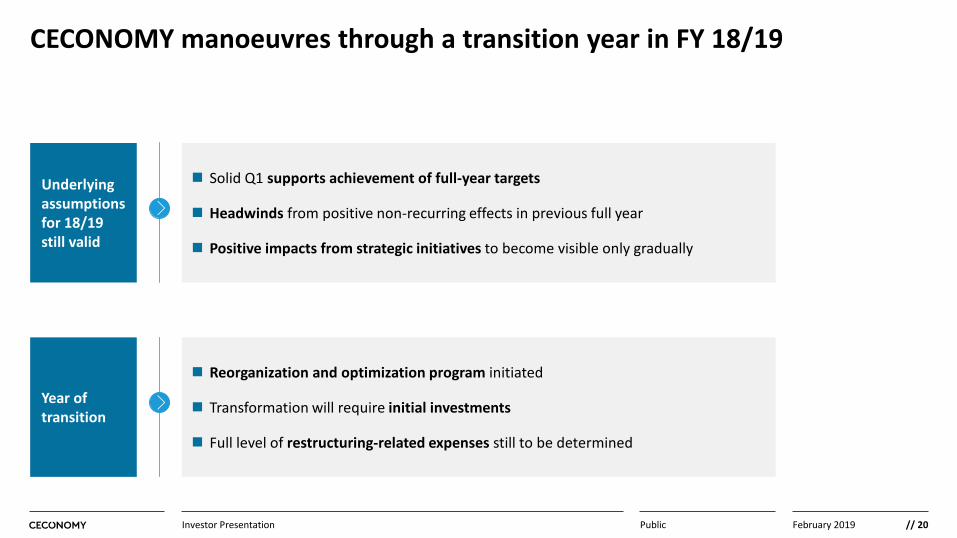
CECONOMY manoeuvres through a transition year in FY 18/19
PublicInvestor Presentation
Solid Q1 supports achievement of full-year targets
Headwinds from positive non-recurring effects in previous full year
Positive impacts from strategic initiatives to become visible only gradually
Reorganization and optimization program initiated
Transformation will require initial investments
Full level of restructuring-related expenses still to be determined
Underlying assumptions for 18/19 still valid
Year of transition
// 21February 2019
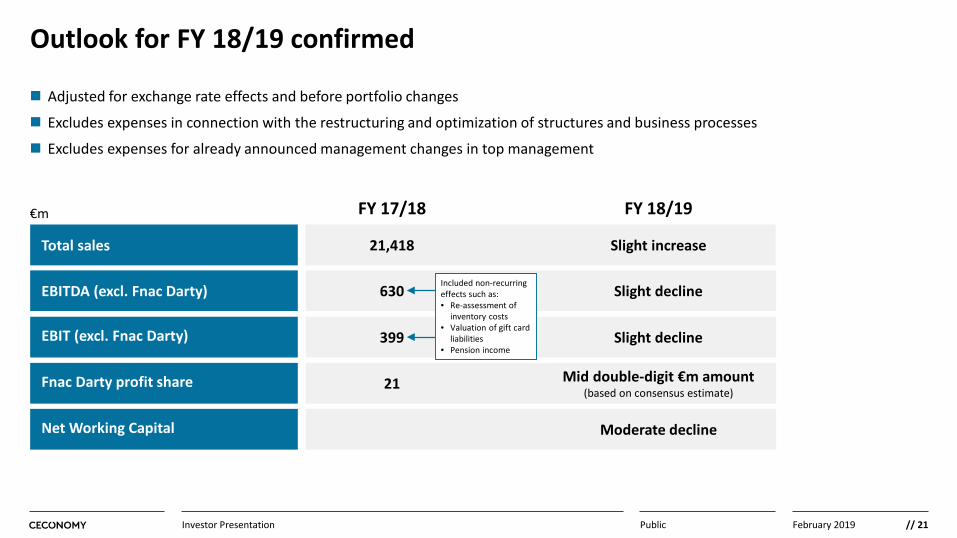
Total sales
EBITDA (excl. Fnac Darty)
EBIT (excl. Fnac Darty)
Fnac Darty profit share
Net Working Capital
Outlook for FY 18/19 confirmed
Adjusted for exchange rate effects and before portfolio changes
Excludes expenses in connection with the restructuring and optimization of structures and business processes
Excludes expenses for already announced management changes in top management
PublicInvestor Presentation
FY 17/18€m
21,418
630
399
21
FY 18/19
Slight increase
Slight decline
Slight decline
Mid double-digit €m amount (based on consensus estimate)
Moderate decline
Included non-recurring effects such as: • Re-assessment of
inventory costs• Valuation of gift card
liabilities• Pension income

// 22February 2019
Strategy and Operations//
// 23February 2019
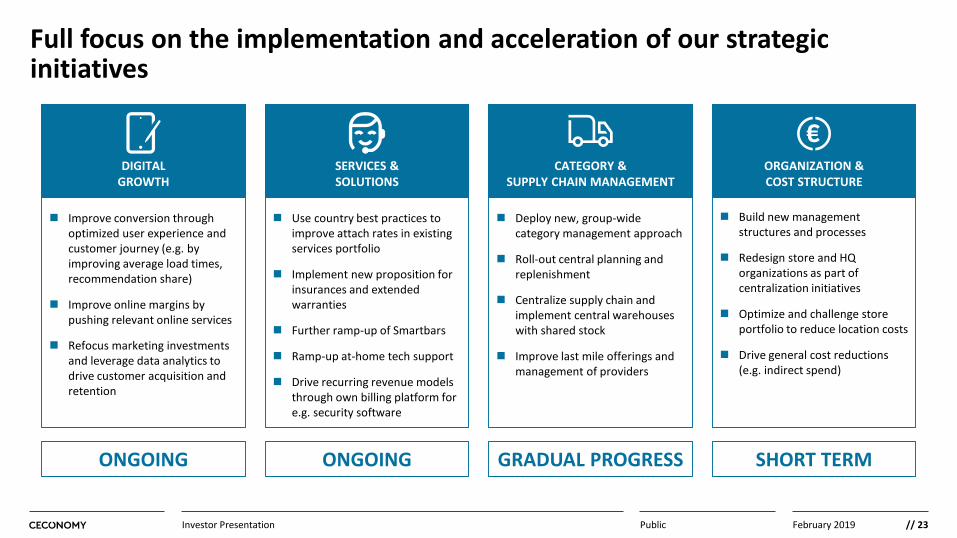
Full focus on the implementation and acceleration of our strategic initiatives
PublicInvestor Presentation
Improve conversion through optimized user experience and customer journey (e.g. by improving average load times, recommendation share)
Improve online margins by pushing relevant online services
Refocus marketing investments and leverage data analytics to drive customer acquisition and retention
DIGITALGROWTH
Use country best practices to improve attach rates in existing services portfolio
Implement new proposition for insurances and extended warranties
Further ramp-up of Smartbars
Ramp-up at-home tech support
Drive recurring revenue models through own billing platform for e.g. security software
SERVICES & SOLUTIONS
Deploy new, group-wide category management approach
Roll-out central planning and replenishment
Centralize supply chain and implement central warehouses with shared stock
Improve last mile offerings and management of providers
CATEGORY & SUPPLY CHAIN MANAGEMENT
Build new management structures and processes
Redesign store and HQ organizations as part of centralization initiatives
Optimize and challenge store portfolio to reduce location costs
Drive general cost reductions (e.g. indirect spend)
ORGANIZATION & COST STRUCTURE
ONGOING ONGOING GRADUAL PROGRESS SHORT TERM
// 24February 2019
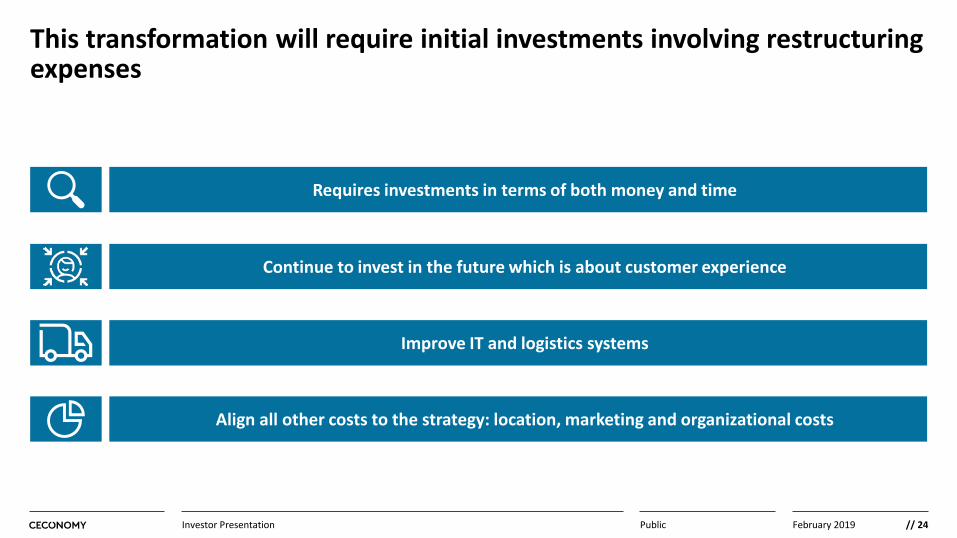
This transformation will require initial investments involving restructuring expenses
PublicInvestor Presentation
Requires investments in terms of both money and time
Continue to invest in the future which is about customer experience
Improve IT and logistics systems
Align all other costs to the strategy: location, marketing and organizational costs
// 25February 2019
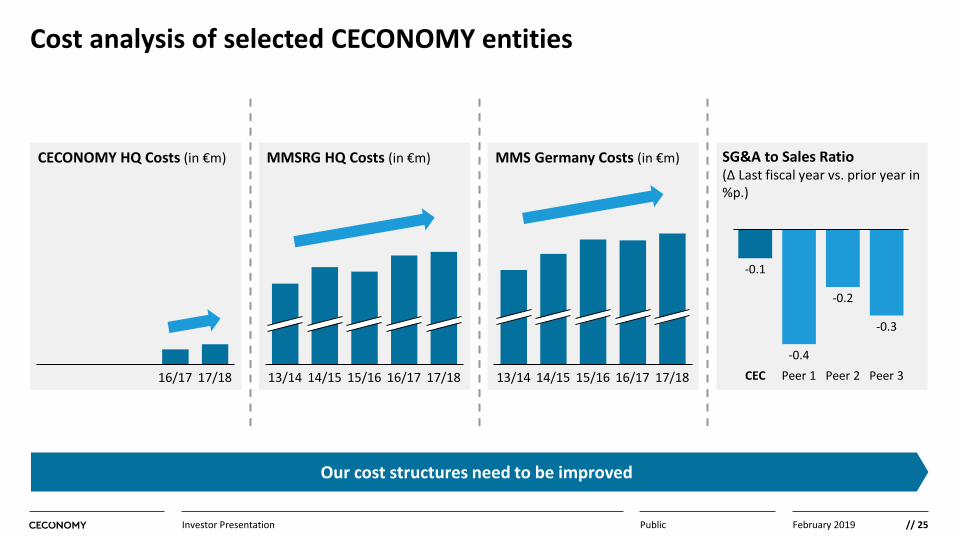
Cost analysis of selected CECONOMY entities
PublicInvestor Presentation
Our cost structures need to be improved
CECONOMY HQ Costs (in €m)
15/1613/14 17/1816/1714/15 15/1613/14 14/15 16/17 17/1816/17 17/18
MMSRG HQ Costs (in €m) MMS Germany Costs (in €m) SG&A to Sales Ratio(∆ Last fiscal year vs. prior year in %p.)
-0.2
Peer 3Peer 1CEC Peer 2
-0.1
-0.4
-0.3
// 26February 2019
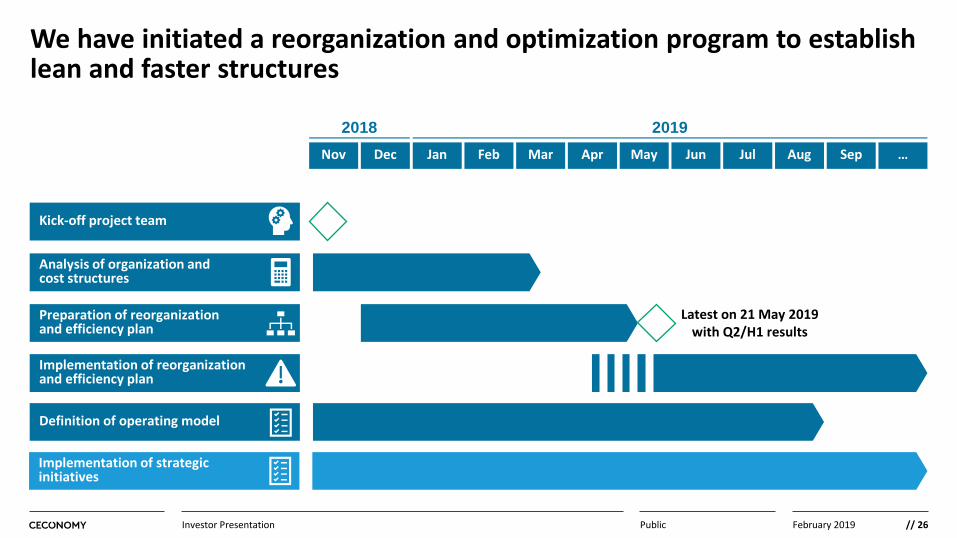
We have initiated a reorganization and optimization program to establish lean and faster structures
PublicInvestor Presentation
Latest on 21 May 2019 with Q2/H1 results
2018 2019
Kick-off project team
Analysis of organization andcost structures
Preparation of reorganizationand efficiency plan
Implementation of strategic initiatives
Implementation of reorganization and efficiency plan
Dec Jan Feb Mar Apr May Jun Jul Aug Sep … Nov
Definition of operating model
// 27February 2019
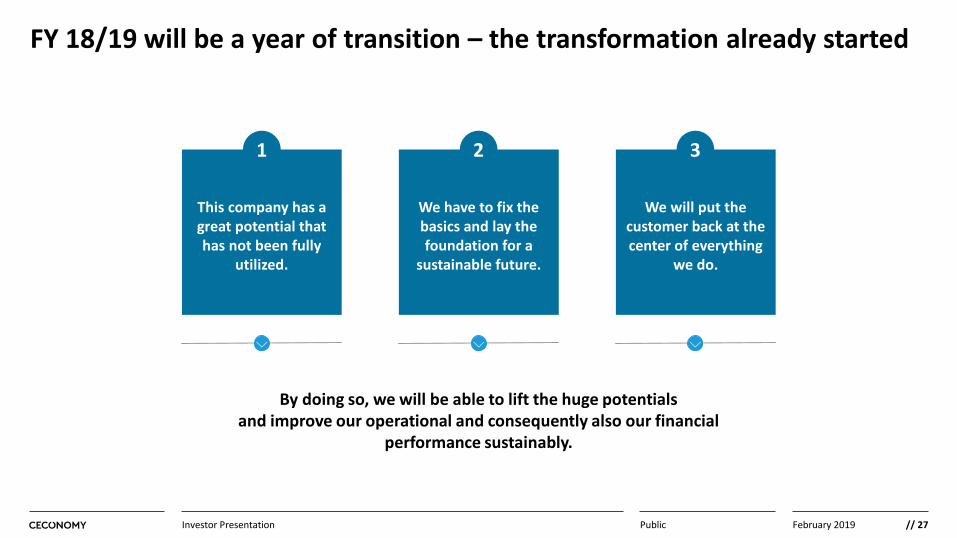
FY 18/19 will be a year of transition – the transformation already started
PublicInvestor Presentation
This company has a great potential that has not been fully
utilized.
We have to fix the basics and lay the foundation for a
sustainable future.
We will put the customer back at the center of everything
we do.
By doing so, we will be able to lift the huge potentialsand improve our operational and consequently also our financial
performance sustainably.
1 2 3

// 28February 2019
Back Up//
// 29February 2019
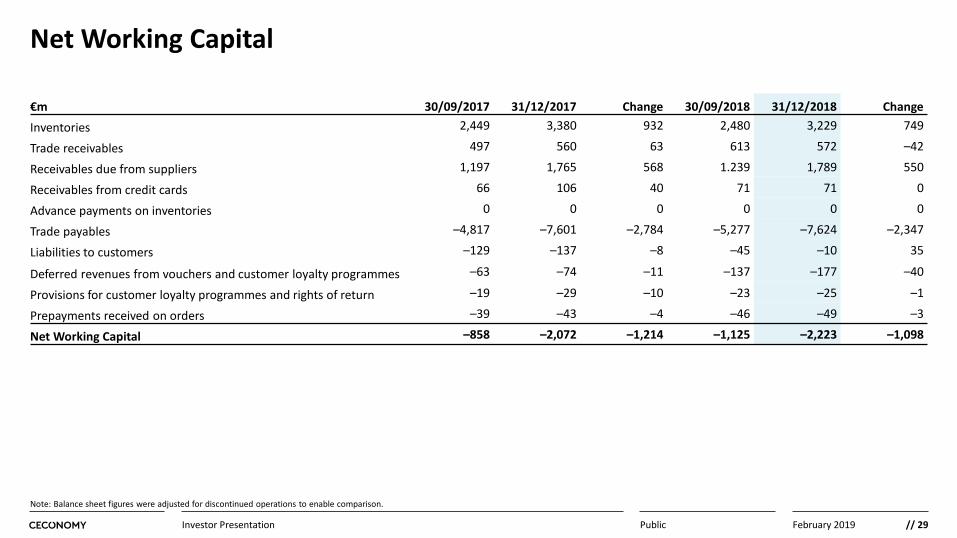
Net Working Capital
PublicInvestor Presentation
€m 30/09/2017 31/12/2017 Change 30/09/2018 31/12/2018 ChangeInventories 2,449 3,380 932 2,480 3,229 749
Trade receivables 497 560 63 613 572 –42
Receivables due from suppliers 1,197 1,765 568 1.239 1,789 550
Receivables from credit cards 66 106 40 71 71 0
Advance payments on inventories 0 0 0 0 0 0
Trade payables –4,817 –7,601 –2,784 –5,277 –7,624 –2,347
Liabilities to customers –129 –137 –8 –45 –10 35
Deferred revenues from vouchers and customer loyalty programmes –63 –74 –11 –137 –177 –40
Provisions for customer loyalty programmes and rights of return –19 –29 –10 –23 –25 –1
Prepayments received on orders –39 –43 –4 –46 –49 –3
Net Working Capital –858 –2,072 –1,214 –1,125 –2,223 –1,098
Note: Balance sheet figures were adjusted for discontinued operations to enable comparison.
// 30February 2019
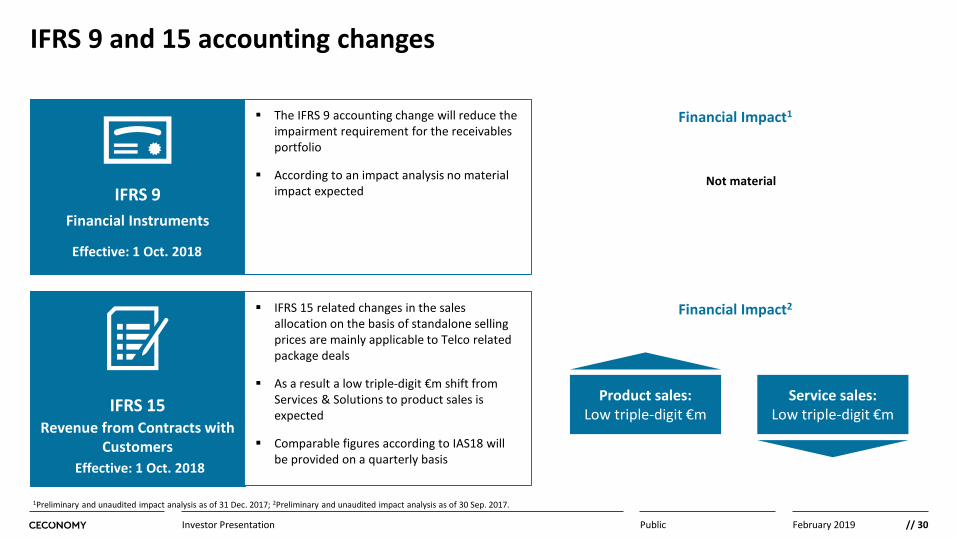
IFRS 9 and 15 accounting changes
PublicInvestor Presentation
IFRS 9Financial Instruments
The IFRS 9 accounting change will reduce the impairment requirement for the receivables portfolio
According to an impact analysis no material impact expected
IFRS 15
IFRS 15 related changes in the sales allocation on the basis of standalone selling prices are mainly applicable to Telco related package deals
As a result a low triple-digit €m shift from Services & Solutions to product sales is expected
Comparable figures according to IAS18 will be provided on a quarterly basis
Effective: 1 Oct. 2018
Revenue from Contracts with Customers
Effective: 1 Oct. 2018
Financial Impact1
Not material
Financial Impact2
Product sales: Low triple-digit €m
Service sales: Low triple-digit €m
1Preliminary and unaudited impact analysis as of 31 Dec. 2017; 2Preliminary and unaudited impact analysis as of 30 Sep. 2017.
// 31February 2019
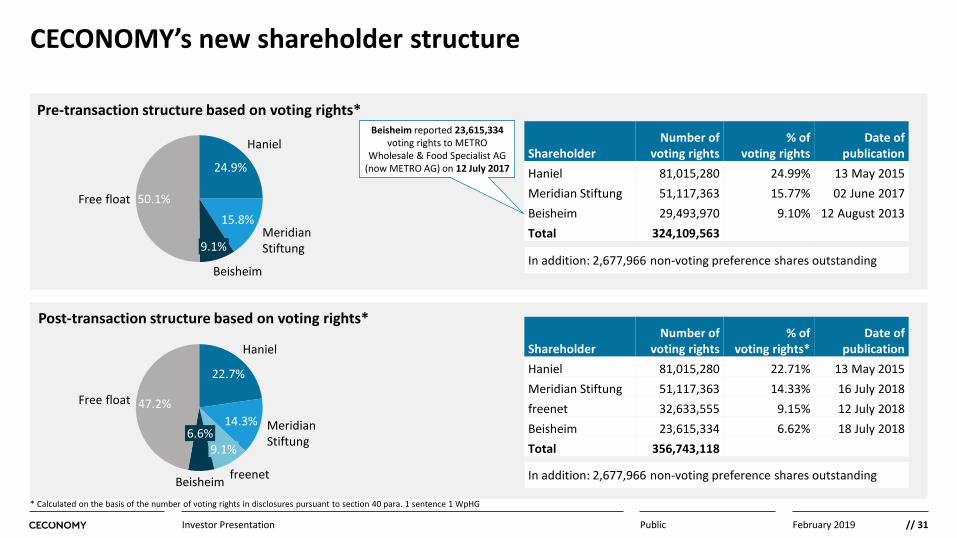
CECONOMY’s new shareholder structure
PublicInvestor Presentation
* Calculated on the basis of the number of voting rights in disclosures pursuant to section 40 para. 1 sentence 1 WpHG
Pre-transaction structure based on voting rights*
Post-transaction structure based on voting rights*
24.9%
Meridian Stiftung
Haniel
Beisheim
9.1%
15.8%50.1%Free float
22.7%
Haniel
14.3%
freenet
9.1%
Meridian Stiftung6.6%
Beisheim
47.2%Free float
ShareholderNumber of
voting rights% of
voting rightsDate of
publicationHaniel 81,015,280 24.99% 13 May 2015Meridian Stiftung 51,117,363 15.77% 02 June 2017Beisheim 29,493,970 9.10% 12 August 2013Total 324,109,563
ShareholderNumber of
voting rights% of
voting rights*Date of
publicationHaniel 81,015,280 22.71% 13 May 2015Meridian Stiftung 51,117,363 14.33% 16 July 2018freenet 32,633,555 9.15% 12 July 2018Beisheim 23,615,334 6.62% 18 July 2018Total 356,743,118
Beisheim reported 23,615,334voting rights to METRO
Wholesale & Food Specialist AG (now METRO AG) on 12 July 2017
In addition: 2,677,966 non-voting preference shares outstanding
In addition: 2,677,966 non-voting preference shares outstanding
// 32February 2019
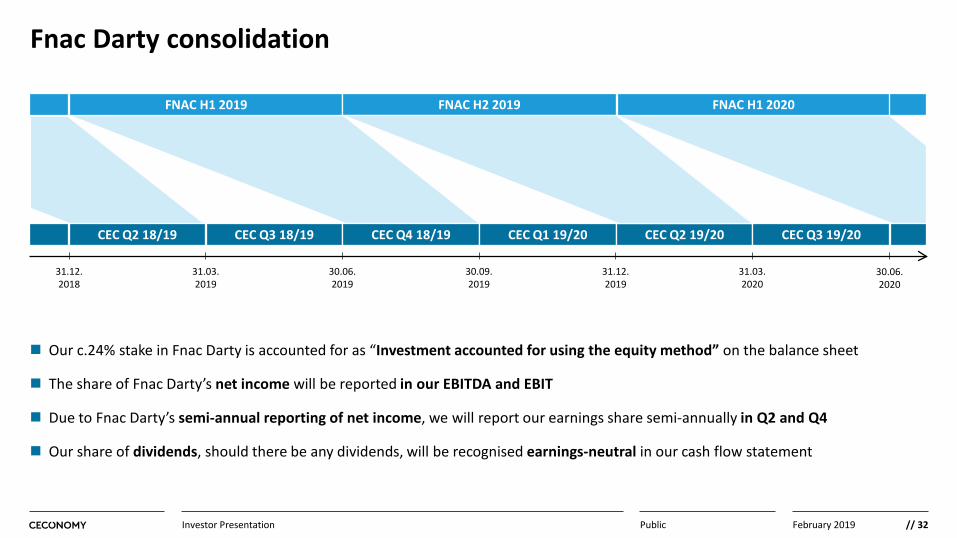
Fnac Darty consolidation
PublicInvestor Presentation
Our c.24% stake in Fnac Darty is accounted for as “Investment accounted for using the equity method” on the balance sheet
The share of Fnac Darty’s net income will be reported in our EBITDA and EBIT
Due to Fnac Darty’s semi-annual reporting of net income, we will report our earnings share semi-annually in Q2 and Q4
Our share of dividends, should there be any dividends, will be recognised earnings-neutral in our cash flow statement
FNAC H1 2020FNAC H2 2019
CEC Q2 18/19 CEC Q3 18/19 CEC Q4 18/19 CEC Q1 19/20 CEC Q2 19/20 CEC Q3 19/20
31.12.2018
31.03.2019
30.06.2019
30.09.2019
31.12.2019
31.03.2020
30.06.2020
FNAC H1 2019
// 33February 2019
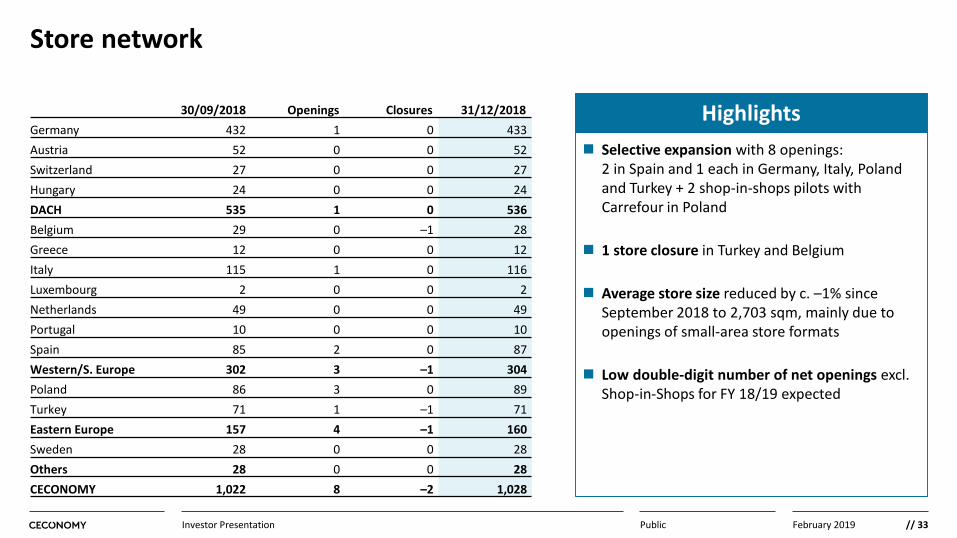
Store network
PublicInvestor Presentation
Selective expansion with 8 openings: 2 in Spain and 1 each in Germany, Italy, Poland and Turkey + 2 shop-in-shops pilots with Carrefour in Poland
1 store closure in Turkey and Belgium
Average store size reduced by c. –1% since September 2018 to 2,703 sqm, mainly due to openings of small-area store formats
Low double-digit number of net openings excl. Shop-in-Shops for FY 18/19 expected
Highlights30/09/2018 Openings Closures 31/12/2018Germany 432 1 0 433Austria 52 0 0 52Switzerland 27 0 0 27Hungary 24 0 0 24DACH 535 1 0 536Belgium 29 0 –1 28Greece 12 0 0 12Italy 115 1 0 116Luxembourg 2 0 0 2Netherlands 49 0 0 49Portugal 10 0 0 10Spain 85 2 0 87Western/S. Europe 302 3 –1 304Poland 86 3 0 89Turkey 71 1 –1 71Eastern Europe 157 4 –1 160Sweden 28 0 0 28Others 28 0 0 28CECONOMY 1,022 8 –2 1,028
// 34February 2019
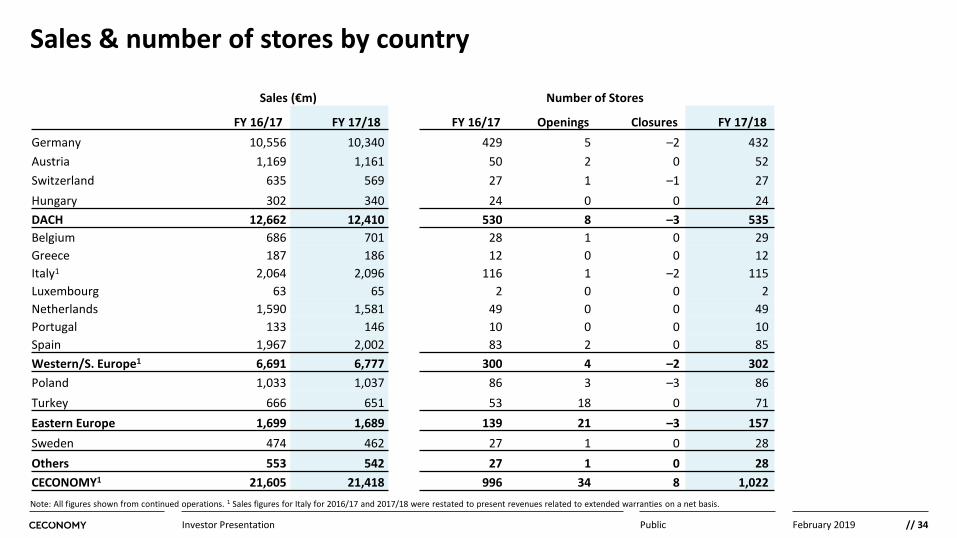
Sales & number of stores by country
PublicInvestor Presentation
Note: All figures shown from continued operations. 1 Sales figures for Italy for 2016/17 and 2017/18 were restated to present revenues related to extended warranties on a net basis.
Sales (€m) Number of Stores
FY 16/17 FY 17/18 FY 16/17 Openings Closures FY 17/18Germany 10,556 10,340 429 5 –2 432Austria 1,169 1,161 50 2 0 52Switzerland 635 569 27 1 –1 27Hungary 302 340 24 0 0 24DACH 12,662 12,410 530 8 –3 535Belgium 686 701 28 1 0 29Greece 187 186 12 0 0 12Italy1 2,064 2,096 116 1 –2 115Luxembourg 63 65 2 0 0 2Netherlands 1,590 1,581 49 0 0 49Portugal 133 146 10 0 0 10Spain 1,967 2,002 83 2 0 85Western/S. Europe1 6,691 6,777 300 4 –2 302Poland 1,033 1,037 86 3 –3 86Turkey 666 651 53 18 0 71Eastern Europe 1,699 1,689 139 21 –3 157Sweden 474 462 27 1 0 28Others 553 542 27 1 0 28CECONOMY1 21,605 21,418 996 34 8 1,022
// 35February 2019
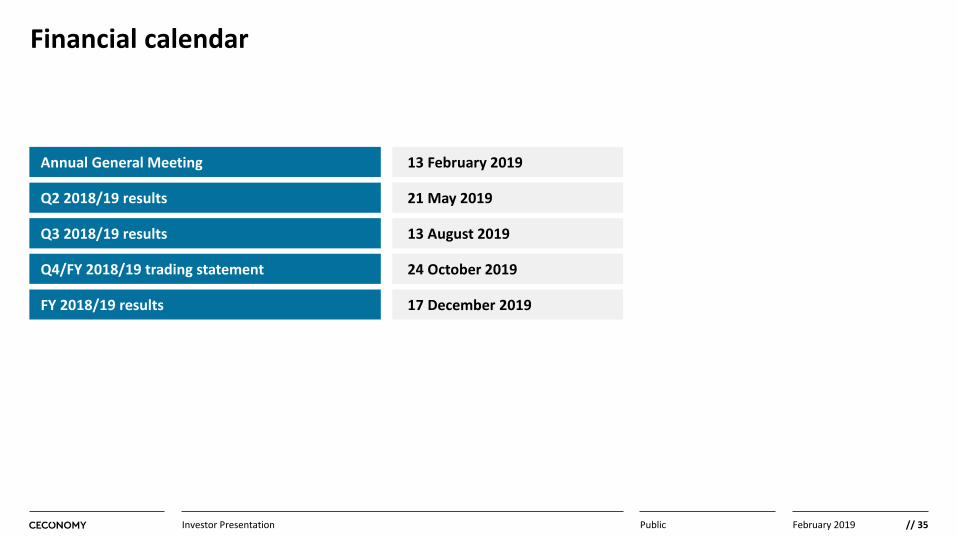
Financial calendar
PublicInvestor Presentation
13 February 2019
21 May 2019
13 August 2019
24 October 2019
Annual General Meeting
Q2 2018/19 results
Q3 2018/19 results
Q4/FY 2018/19 trading statement
FY 2018/19 results 17 December 2019

// 36February 2019PublicInvestor Presentation