Embed Size (px)
Citation preview
Thomas Cook Group Corporate Strategy
Investor Day PresentationRoyal Opera House, London10 March 2010
Page 2
This presentation does not constitute an invitation or inducement to underwrite, subscribe for or otherwise acquire or dispose of (or engage in any other investment activity in relation to) any Thomas Cook Group plc (‘the Company’) shares or other securities.
This presentation contains certain forward-looking statements and forecasts (based on information known to the Company on the date shown) with respect to future matters, including strategies, initiatives and targets, the financial condition, results and operations of the Company. These statements and forecasts involve risks and uncertainty because they relate to events and depend on circumstances that will occur in the future. There are a number of factors that could cause actual results or developments to differ materially from those expressed or implied by these forward-looking statements and forecasts, including factors that are outside of the Company’s control. This presentation does not constitute a commitment by the Company to proceed with a certain transaction or business practice in the future. Except as required by its legal or regulatory obligations, the Company does not undertake any obligation to update or revise publicly any forward-looking statement or forecast, whether as a result of new information, future events or otherwise. The reader should, however, consult any future disclosures that the Company may publish via the Regulatory News Service.
Past performance is no guide to future performance and persons needing advice should consult an independent financial adviser. Neither the Company nor anyone acting on its behalf makes any representation or warranty, express or implied, as to the accuracy or completeness of the information contained in this presentation. Neither the Company nor any person acting on its behalf shall have any liability whatsoever for loss, howsoever arising, directly or indirectly, from use of the
information contained within this presentation.
10 March 2010
Disclaimer and cautionary statement

Welcome and IntroductionManny Fontenla-Novoa, Group CEO
Page 4Page 4
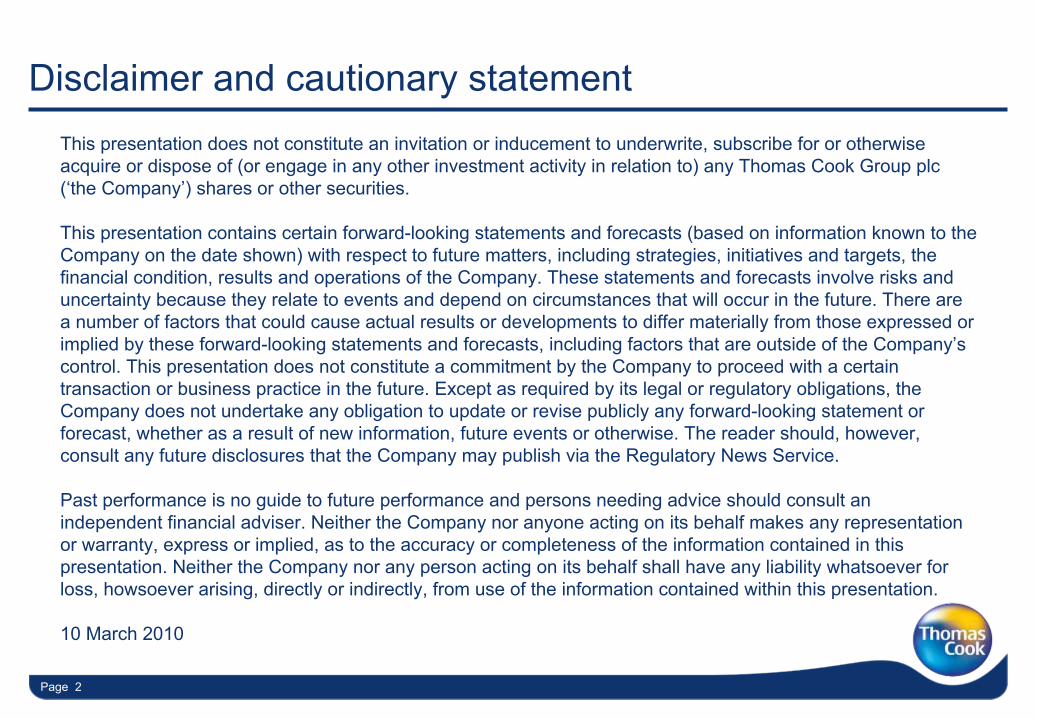
Agenda
Welcome and Introduction Manny Fontenla-Novoa 0900 –
0920
Strategic Progress Case Studies Management Team 0920 –
1015
Strategy for Growth Paul Hollingworth, Jürgen Büser 1015 –
1045
Refreshments
Growth Strategy Case Studies Management Team 1115 –
1225
Summary and Wrap-up Manny Fontenla-Novoa 1225 –
1230
Q&A Management Team 1230 –
1300
Lunch
Page 5Page 5
What we are going to cover in this section
•
Senior management team introductions
•
Thomas Cook in 2007 –
recap of our objectives
•
Progress review against those objectives
•
Case studies of how we solved key strategic challenges
•
Summary of where we are today
Page 6
Senior management team introductions
Page 7Page 7
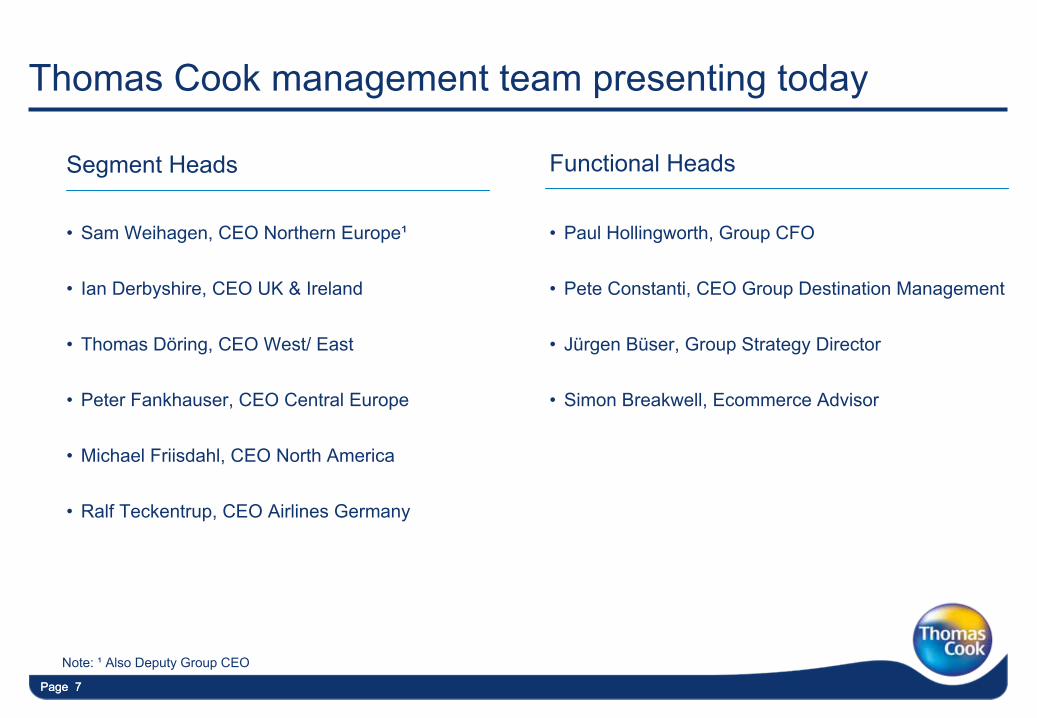
Thomas Cook management team presenting today
•
Sam Weihagen, CEO Northern Europe¹
•
Ian Derbyshire, CEO UK & Ireland
•
Thomas Döring, CEO West/ East
•
Peter Fankhauser, CEO Central Europe
•
Michael Friisdahl, CEO North America
•
Ralf Teckentrup, CEO Airlines Germany
•
Paul Hollingworth, Group CFO
•
Pete Constanti, CEO Group Destination Management
•
Jürgen Büser, Group Strategy Director
•
Simon Breakwell, Ecommerce Advisor
Segment Heads Functional Heads
Note: ¹
Also Deputy Group CEO
Page 8
Thomas Cook in 2007
Page 9Page 9
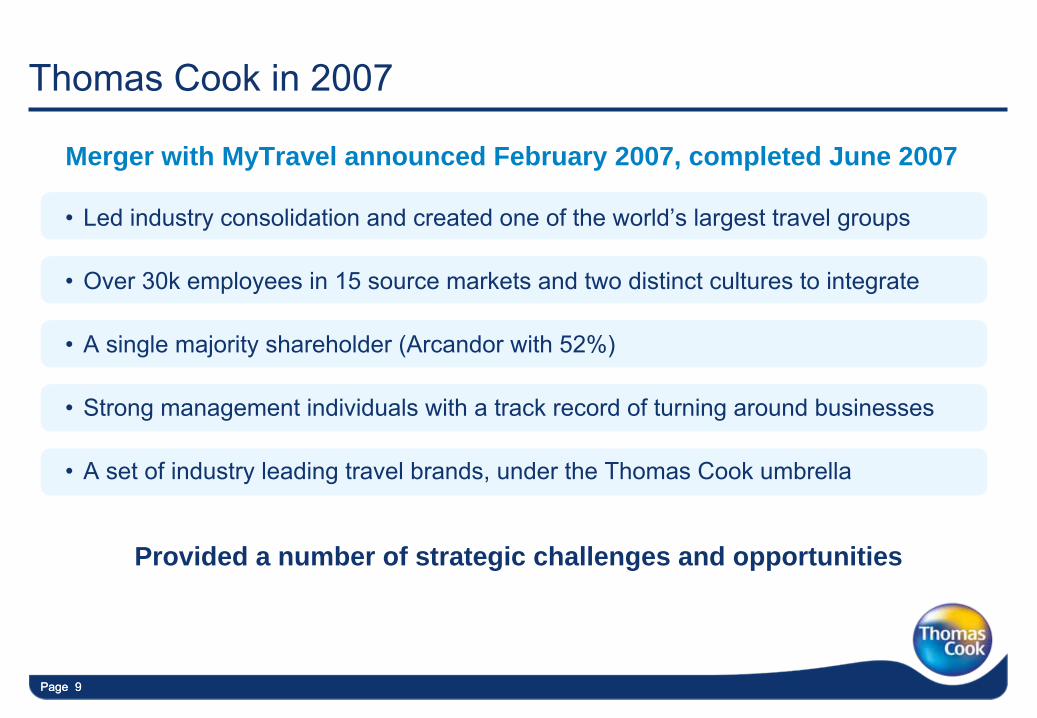
Thomas Cook in 2007
•
Led industry consolidation and created one of the world’s largest travel groups
•
Over 30k employees in 15 source markets and two distinct cultures to integrate
•
A single majority shareholder (Arcandor with 52%)
•
Strong management individuals with a track record of turning around businesses
•
A set of industry leading travel brands, under the Thomas Cook umbrella
Provided a number of strategic challenges and opportunities
Merger with MyTravel announced February 2007, completed June 2007
Page 10
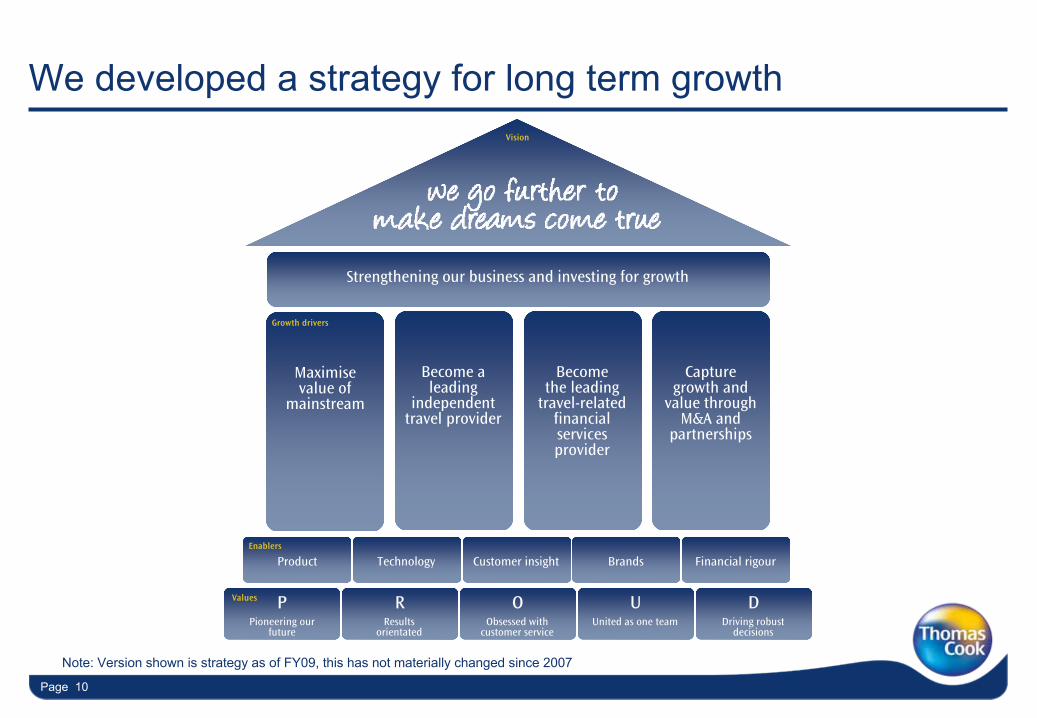
We developed a strategy for long term growth
Strategic objectives
Strengthening our business and investing for growth
Financial rigourBrandsCustomer insightTechnology
Results orientated
Obsessed with customer service
United as one team Driving robust decisions
Pioneering our future
Values
ProductEnablers
Become a leading
independent travel provider
Become the leading
travel-related financial services provider
Capture growth and
value through M&A and
partnerships
Maximisevalue of
mainstream
Growth drivers
Vision
P R O U D
Note: Version shown is strategy as of FY09, this has not materially changed since 2007
Page 11Page 11
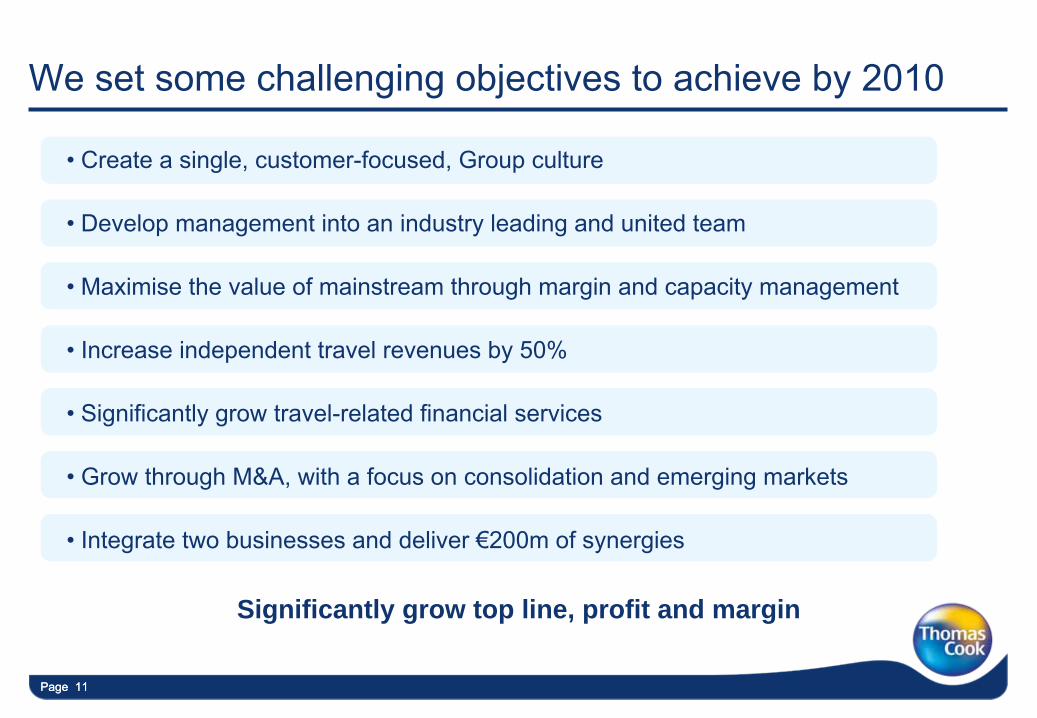
We set some challenging objectives to achieve by 2010
•
Create a single, customer-focused, Group culture
•
Develop management into an industry leading and united team
•
Maximise the value of mainstream through margin and capacity management
•
Increase independent travel revenues by 50%
•
Significantly grow travel-related financial services
•
Grow through M&A, with a focus on consolidation and emerging markets
•
Integrate two businesses and deliver €200m of synergies
Significantly grow top line, profit and margin
Page 12
Progress since the merger
Page 13Page 13
Since 2007 we’ve seen unprecedented market conditions
Page 13
Pound nears parity with the Euro
Economy at 60-year low, says Darling
Surge in last-minute foreign holidays
Oil rises past $140
Pound hits Eight-year low against dollar
Credit crisis fells Lehman Brothers Jobless highest level for 17 years
Despite this backdrop, we’ve made significant progress
Page 14Page 14
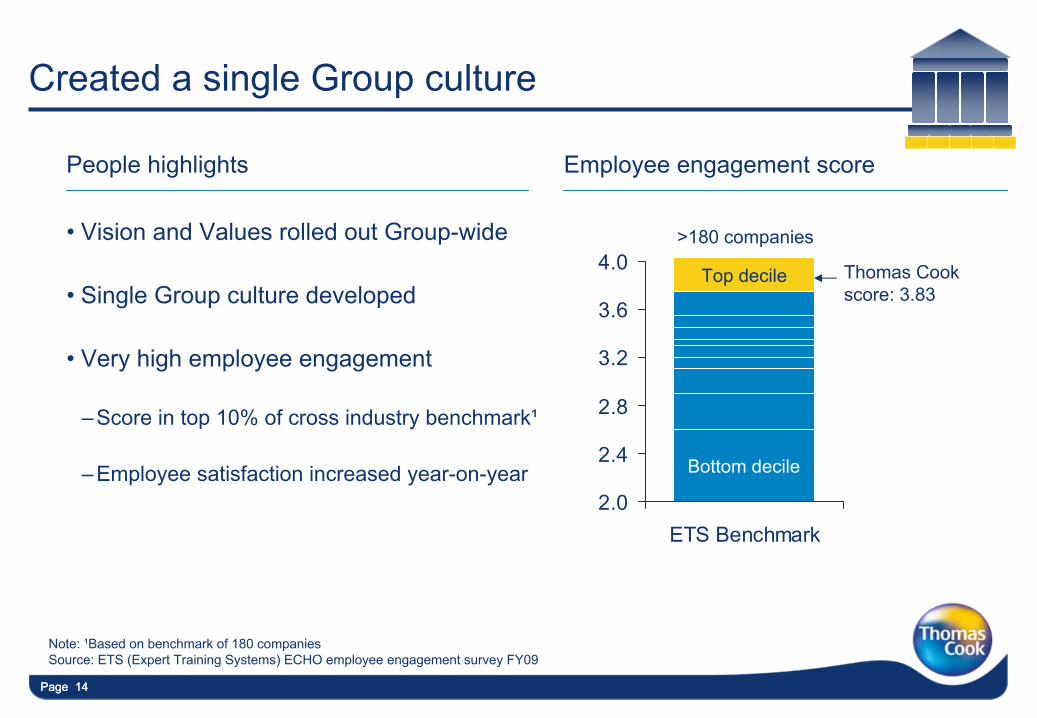
Created a single Group culture
•
Vision and Values rolled out Group-wide
•
Single Group culture developed
•
Very high employee engagement
–Score in top 10% of cross industry benchmark¹
–Employee satisfaction increased year-on-year
Note: ¹Based on benchmark of 180 companiesSource: ETS (Expert Training Systems) ECHO employee engagement survey FY09
People highlights Employee engagement score
2.0
2.4
2.8
3.2
3.6
4.0
ETS Benchmark
Top decile
Bottom decile
Thomas Cook score: 3.83
>180 companies
Page 15Page 15
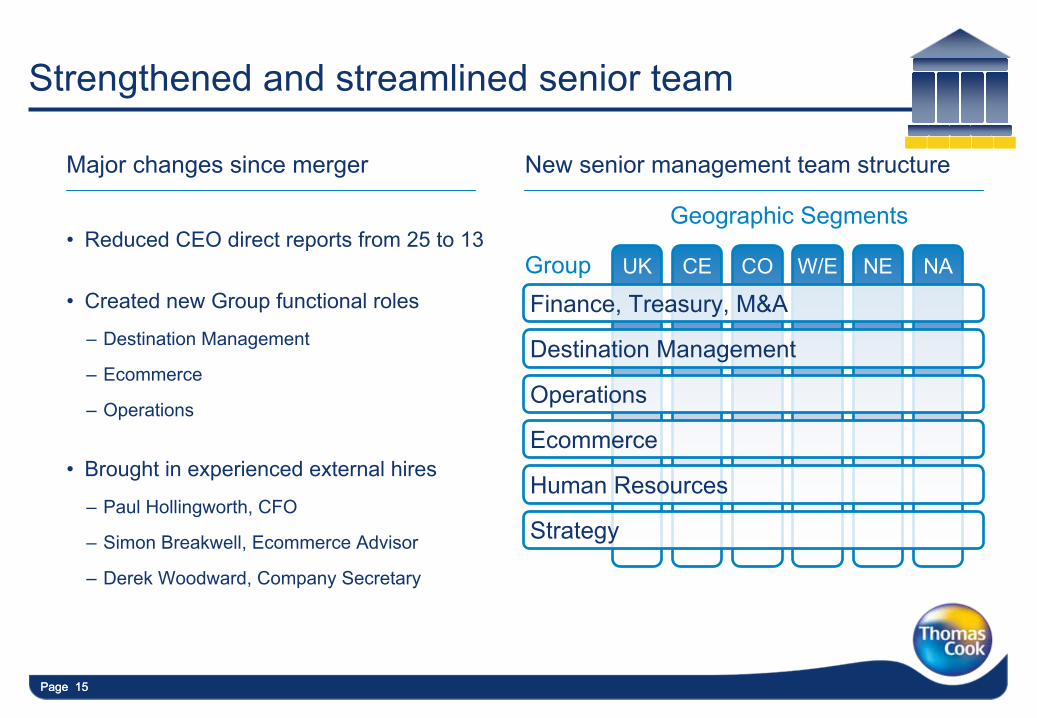
Strengthened and streamlined senior team
Major changes since merger New senior management team structure
•
Reduced CEO direct reports from 25 to 13
•
Created new Group functional roles
–
Destination Management
–
Ecommerce
–
Operations
•
Brought in experienced external hires
–
Paul Hollingworth, CFO
–
Simon Breakwell, Ecommerce Advisor
–
Derek Woodward, Company Secretary
Geographic Segments
UK CE CO W/E NE NA
Finance, Treasury, M&A
Destination Management
Operations
Ecommerce
Human Resources
Strategy
Group
Page 16Page 16
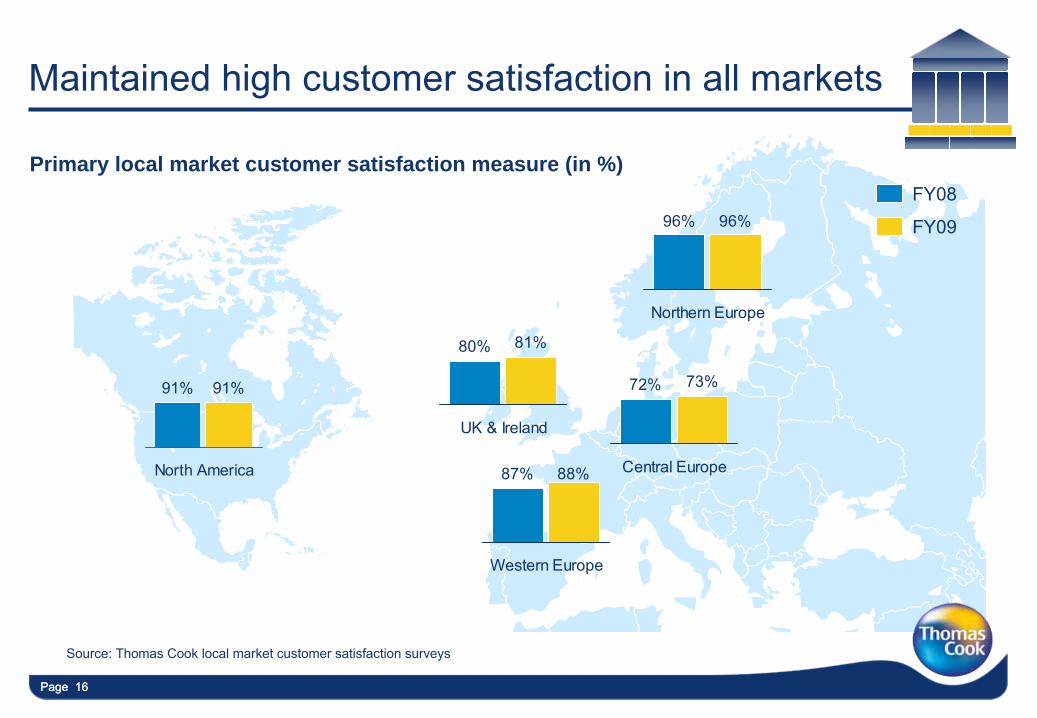
Maintained high customer satisfaction in all markets
Primary local market customer satisfaction measure (in %)
Source: Thomas Cook local market customer satisfaction surveys
FY08
FY09
91% 91%
North America 87% 88%
Western Europe
80% 81%
UK & Ireland
96% 96%
Northern Europe
72% 73%
Central Europe
Page 17
Received extensive trade and consumer recognition
Page 18
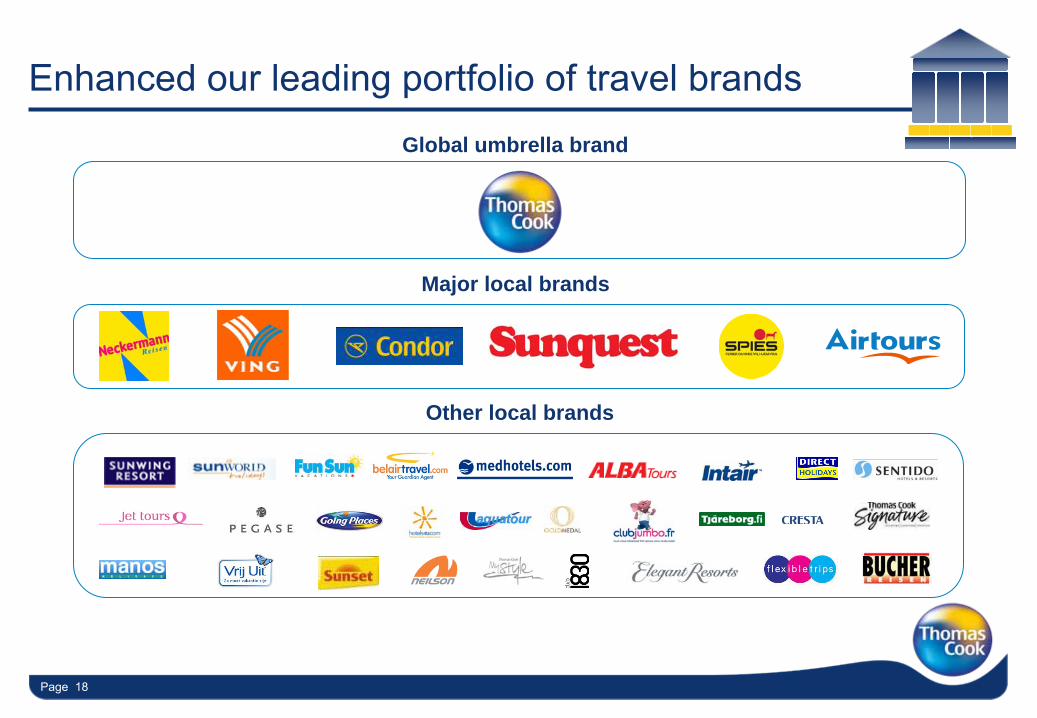
Enhanced our leading portfolio of travel brandsGlobal umbrella brand
Major local brands
Other local brands
Page 19Page 19
Made material progress in maximising mainstream
•
Increased mainstream travel revenues by 11%, despite capacity cuts
•
Grew mainstream travel EBIT margin by over 30%
•
Increased online distribution to more than 60% in some markets
•
Grew controlled distribution to more than 80% in some markets
•
Strengthened strategic destinations, particularly medium haul
•
Focused product on 4/5*, all inclusive and exclusive & differentiated concepts
Source: Management analysis and estimates
Page 20Page 20
Grew independent revenues by over 50%
•
Increased independent travel revenues by over 50%
•
Created one of the leading wholesale travel businesses–
Hotels4U, Gold Medal and TriWest deals strengthened position
•
Continued to be a leader in cruise retail
•
Built thomascook.com
into a top travel website with 3m users a month¹
•
Strengthened position in scheduled package market through acquisitions
Note: ¹Monthly unique users in the UKSource: Management analysis and estimates
Page 21Page 21
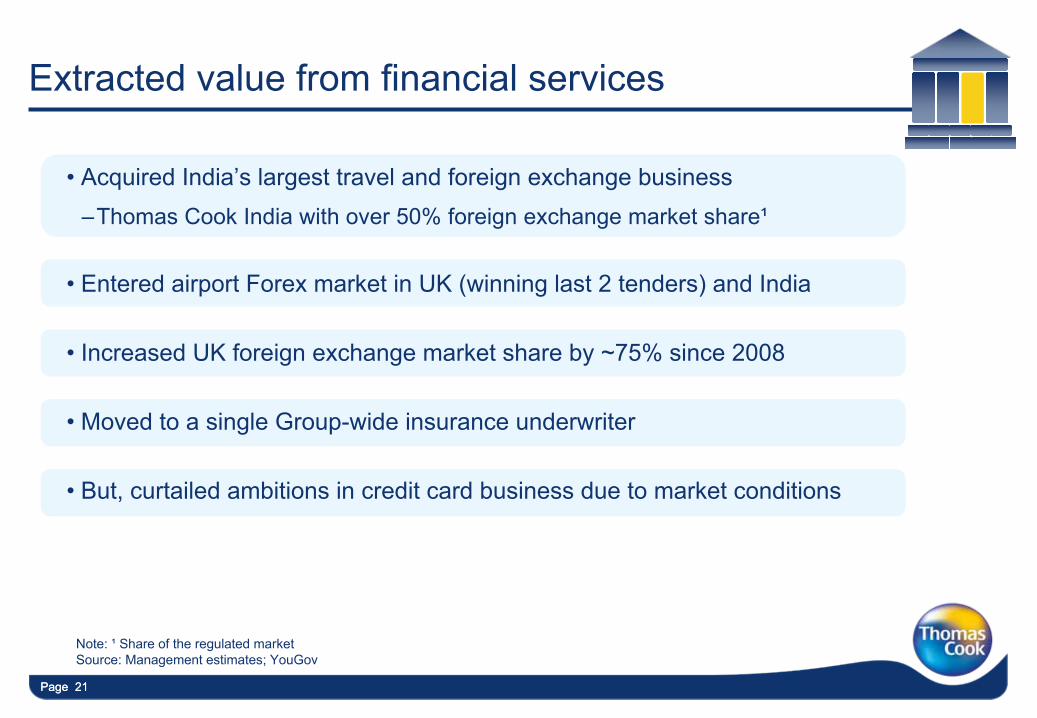
Extracted value from financial services
•
Acquired India’s largest travel and foreign exchange business–Thomas Cook India with over 50% foreign exchange market share¹
•
Entered airport Forex market in UK (winning last 2 tenders) and India
•
Increased UK foreign exchange market share by ~75% since 2008
•
Moved to a single Group-wide insurance underwriter
•
But, curtailed ambitions in credit card business due to market conditions
Note: ¹
Share of the regulated marketSource: Management estimates; YouGov
Page 22Page 22
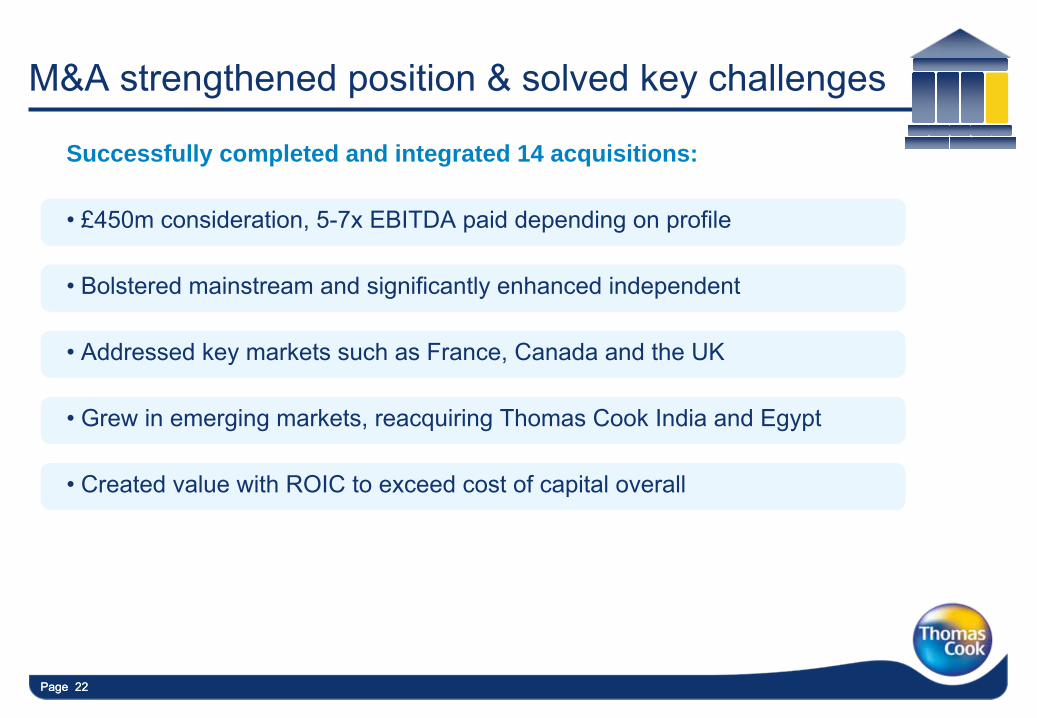
M&A strengthened position & solved key challenges
Successfully completed and integrated 14 acquisitions:
•
£450m consideration, 5-7x EBITDA paid depending on profile
•
Bolstered mainstream and significantly enhanced independent
•
Addressed key markets such as France, Canada and the UK
•
Grew in emerging markets, reacquiring Thomas Cook India and Egypt
•
Created value with ROIC to exceed cost of capital overall
Page 23Page 23
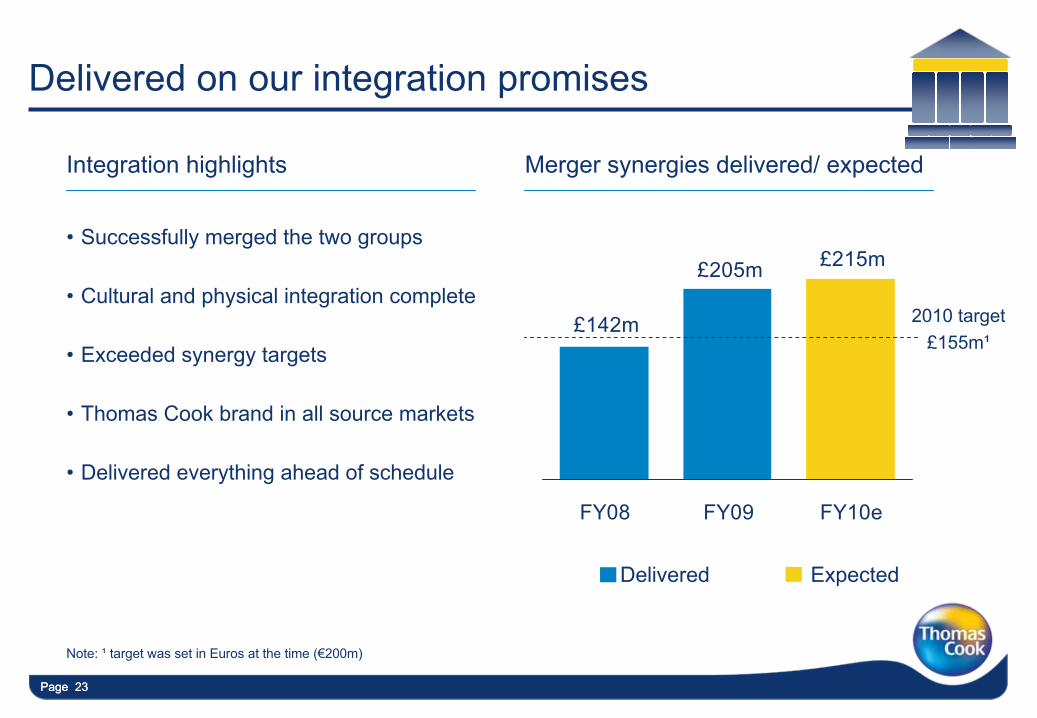
Delivered on our integration promises
•
Successfully merged the two groups
•
Cultural and physical integration complete
•
Exceeded synergy targets
•
Thomas Cook brand in all source markets
•
Delivered everything ahead of schedule
Note: ¹
target was set in Euros at the time (€200m)
Delivered
Integration highlights Merger synergies delivered/ expected
£215m£205m
£142m
FY08 FY09 FY10e
2010 target£155m¹
Expected
Page 24Page 24
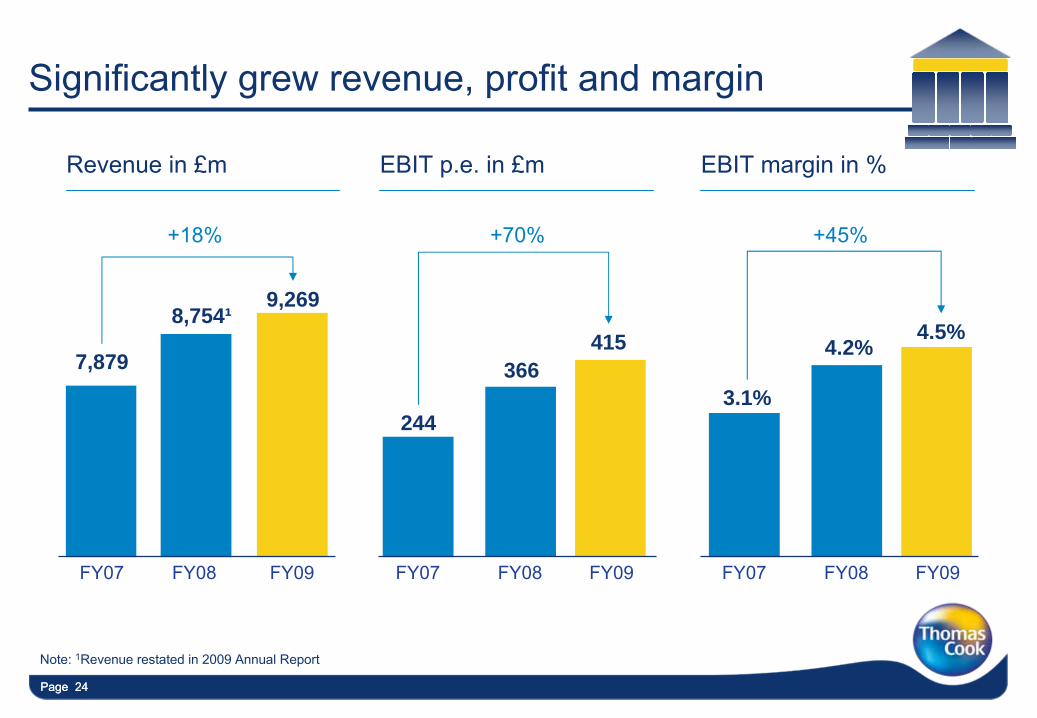
FY07 FY08
8,754¹
7,879 366
244
FY07 FY08
4.2%
3.1%
FY07 FY08FY09
9,269
FY09
4.5%
FY09
+70%+18% +45%
415
Revenue in £m EBIT p.e. in £m EBIT margin in %
Significantly grew revenue, profit and margin
Note: 1Revenue restated in 2009 Annual Report
Page 25Page 25
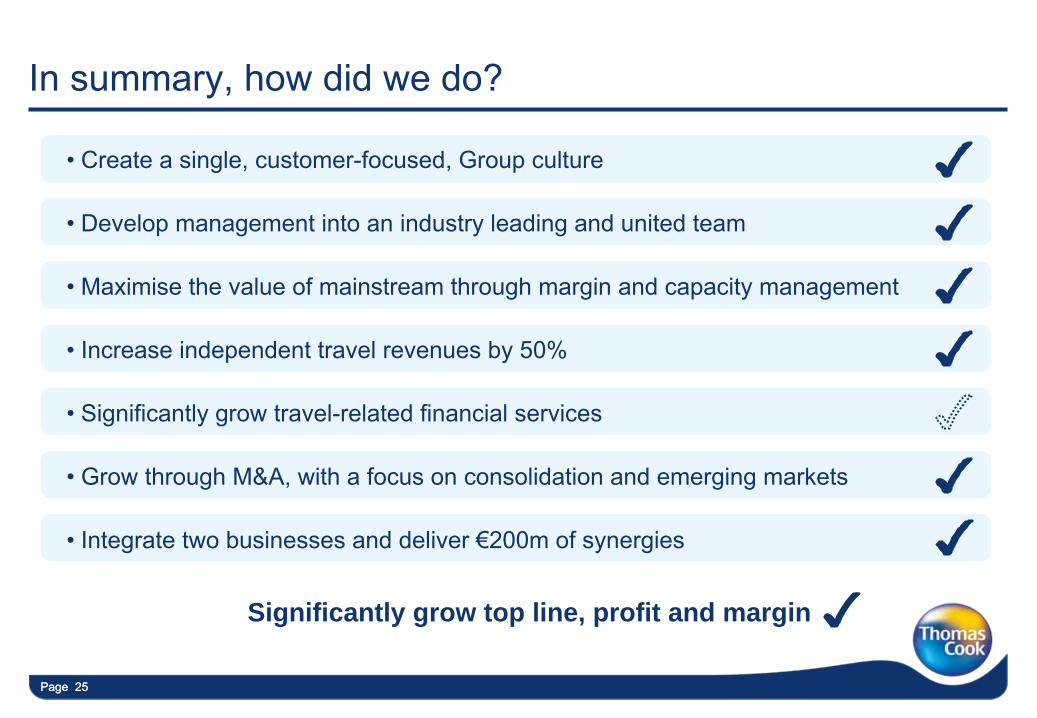
In summary, how did we do?
Significantly grow top line, profit and margin
•
Create a single, customer-focused, Group culture
•
Develop management into an industry leading and united team
•
Maximise the value of mainstream through margin and capacity management
•
Increase independent travel revenues by 50%
•
Significantly grow travel-related financial services
•
Grow through M&A, with a focus on consolidation and emerging markets
•
Integrate two businesses and deliver €200m of synergies

Strategic progress case studies
Page 27Page 27
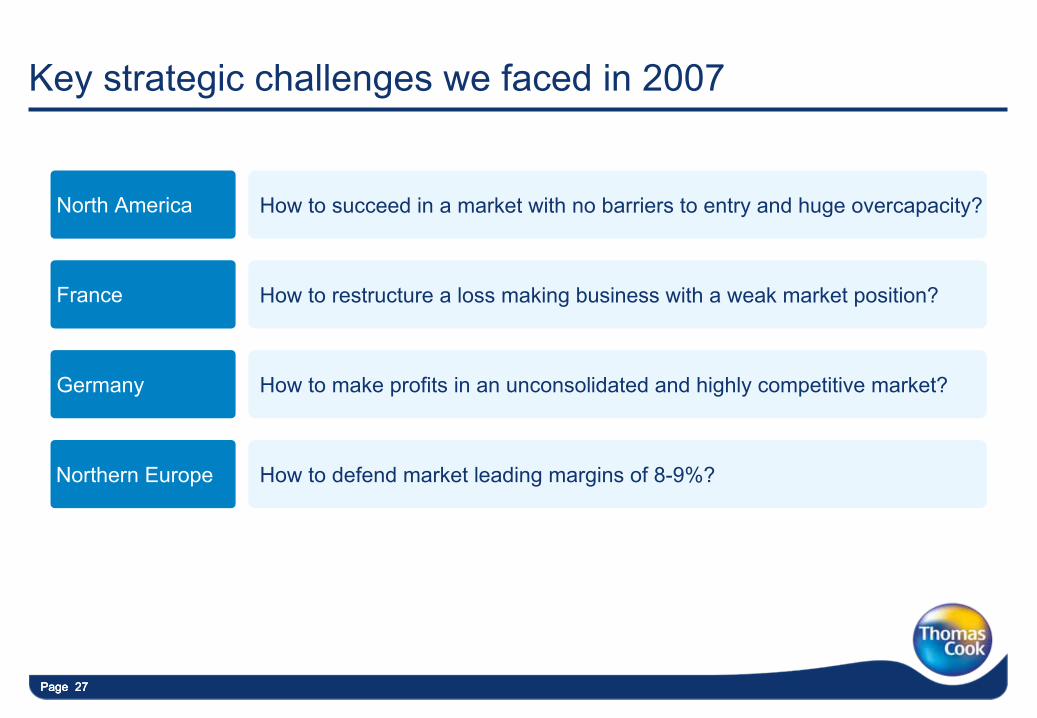
Key strategic challenges we faced in 2007
Page 27
How to make profits in an unconsolidated and highly competitive market?Germany
How to defend market leading margins of 8-9%?Northern Europe
How to succeed in a market with no barriers to entry and huge overcapacity?North America
How to restructure a loss making business with a weak market position?France
Page 28Page 28
How to succeed in a Canadian market with no barriers to entry and huge overcapacity?
Michael Friisdahl –
CEO North America
Page 29Page 29
North America objectives
•
Strengthen leadership position in leisure travel market
•
Reduce risk stemming from mainstream overcapacity
•
Achieve 5% margin
Page 29
Page 30Page 30Page 30
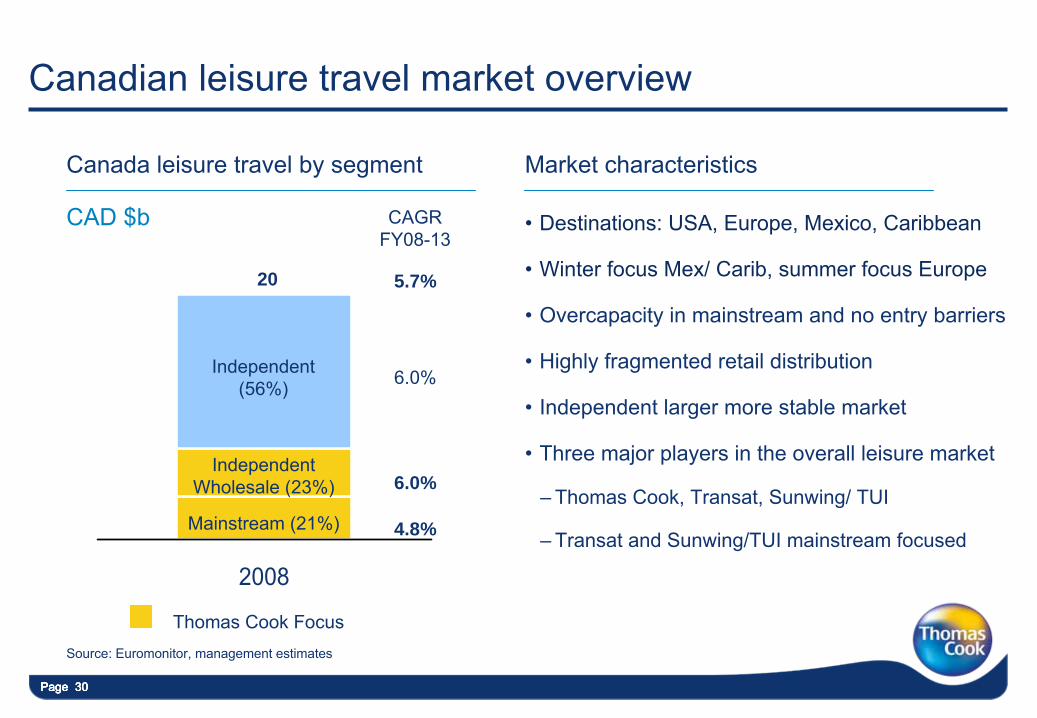
Canadian leisure travel market overview
Page 30
2008
20
6.0%
4.8%
5.7%
Mainstream (21%)
Independent
(56%)
Source: Euromonitor, management estimates
Independent
Wholesale (23%) 6.0%
Thomas Cook Focus
CAGR
FY08-13
Canada leisure travel by segment Market characteristics
•
Destinations: USA, Europe, Mexico, Caribbean
•
Winter focus Mex/ Carib, summer focus Europe
•
Overcapacity in mainstream and no entry barriers
•
Highly fragmented retail distribution
•
Independent larger more stable market
•
Three major players in the overall leisure market
–
Thomas Cook, Transat, Sunwing/ TUI
–
Transat and Sunwing/TUI mainstream focused
CAD $b
Page 31Page 31Page 31
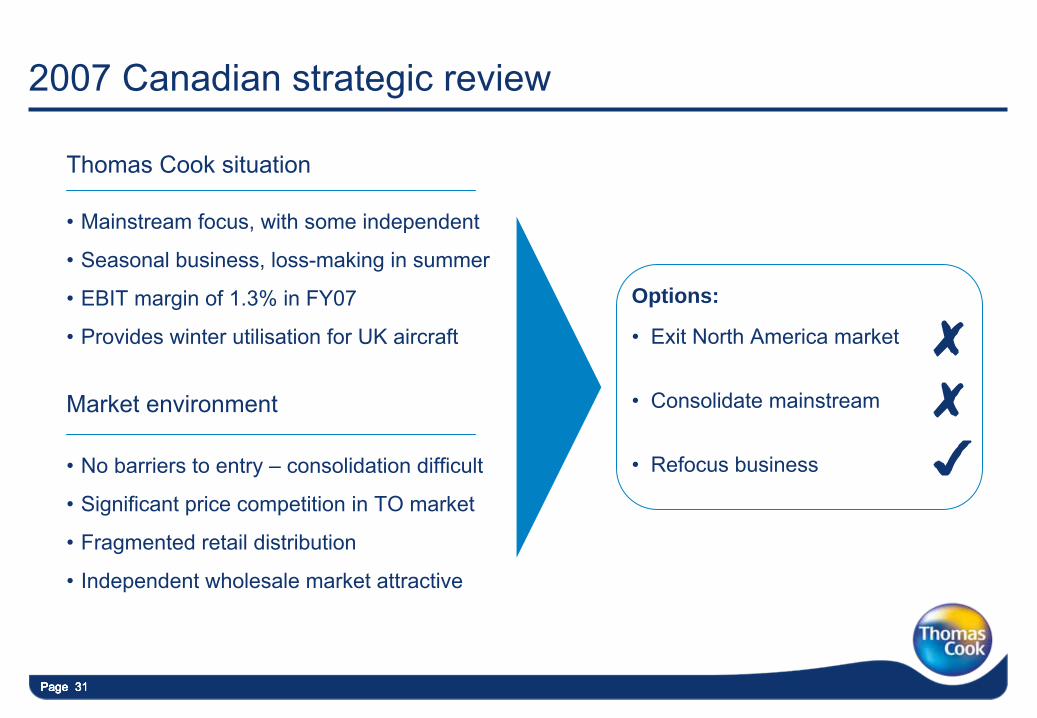
2007 Canadian strategic review
Page 31
Market environment
•
No barriers to entry –
consolidation difficult
•
Significant price competition in TO market
•
Fragmented retail distribution
•
Independent wholesale market attractive
Thomas Cook situation
•
Mainstream focus, with some independent
•
Seasonal business, loss-making in summer
•
EBIT margin of 1.3% in FY07
•
Provides winter utilisation for UK aircraft •
Exit North America market
•
Consolidate mainstream
•
Refocus business
Options:
Page 32Page 32
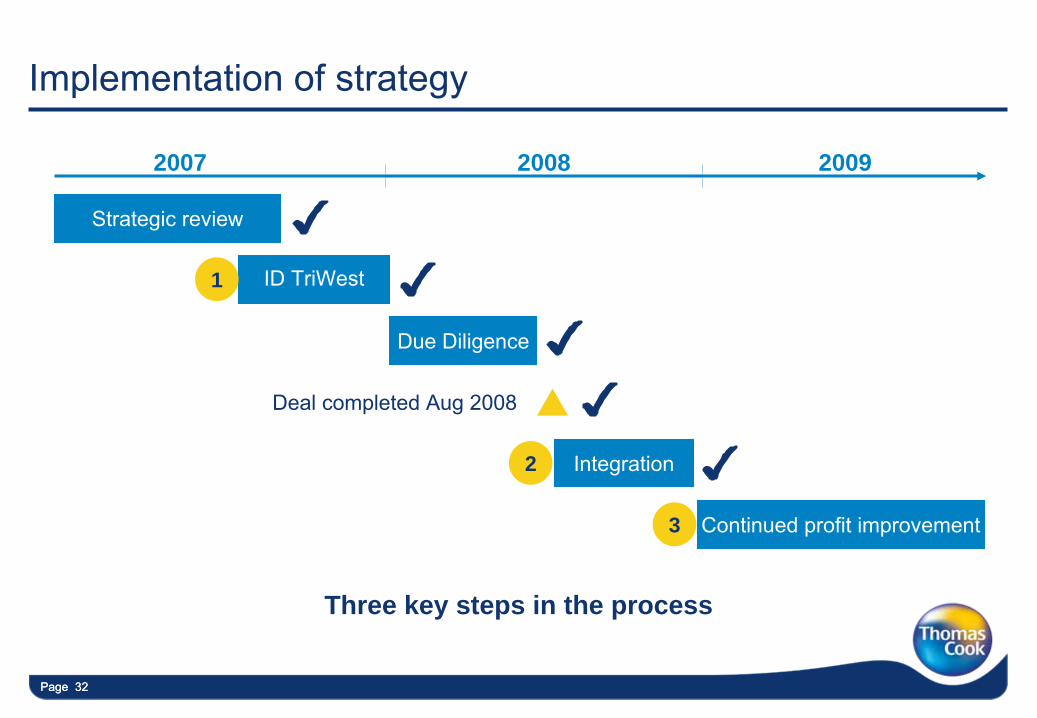
Implementation of strategy
2007 2008 2009
Strategic review
ID TriWest
Continued profit improvement
Due Diligence
Integration
Deal completed Aug 2008
1
2
3
Three key steps in the process
Page 33Page 33Page 33Page 33Page 33
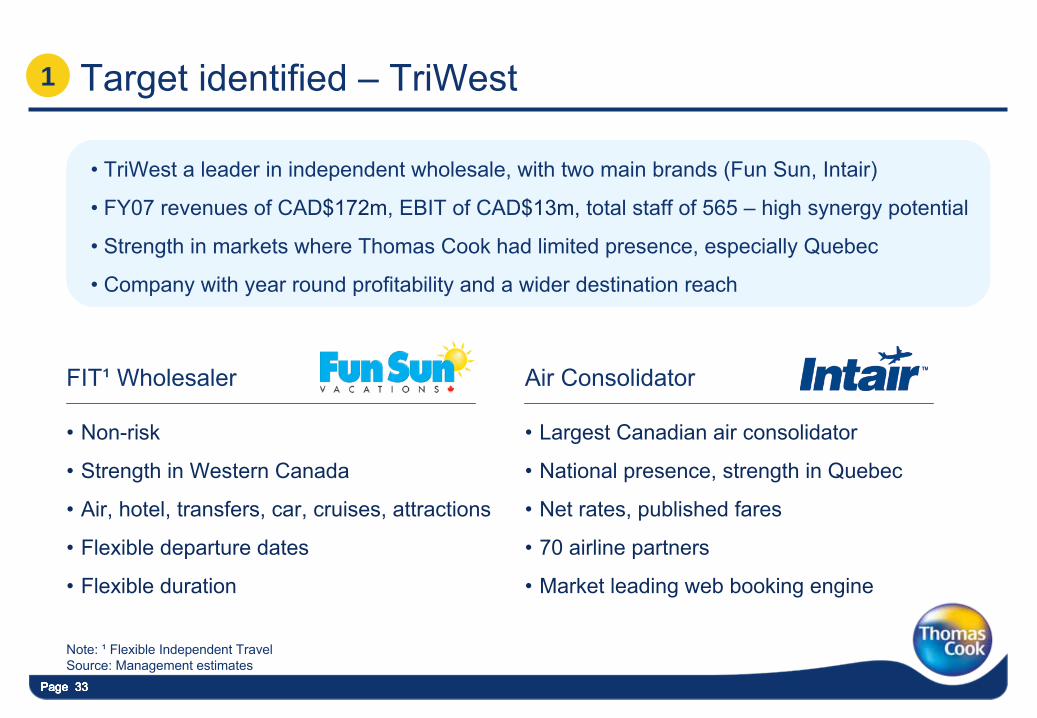
Target identified –
TriWest1
Note: ¹
Flexible Independent TravelSource: Management estimates
•
TriWest a leader in independent wholesale, with two main brands (Fun Sun, Intair)
•
FY07 revenues of CAD$172m, EBIT of CAD$13m,
total staff of 565 –
high synergy potential
•
Strength in markets where Thomas Cook had limited presence, especially Quebec
•
Company with year round profitability and a wider destination reach
FIT¹
Wholesaler Air Consolidator
•
Non-risk
•
Strength in Western Canada
•
Air, hotel, transfers, car, cruises, attractions
•
Flexible departure dates
•
Flexible duration
•
Largest Canadian air consolidator
•
National presence, strength in Quebec
•
Net rates, published fares
•
70 airline partners
•
Market leading web booking engine
Page 34Page 34Page 34Page 34Page 34
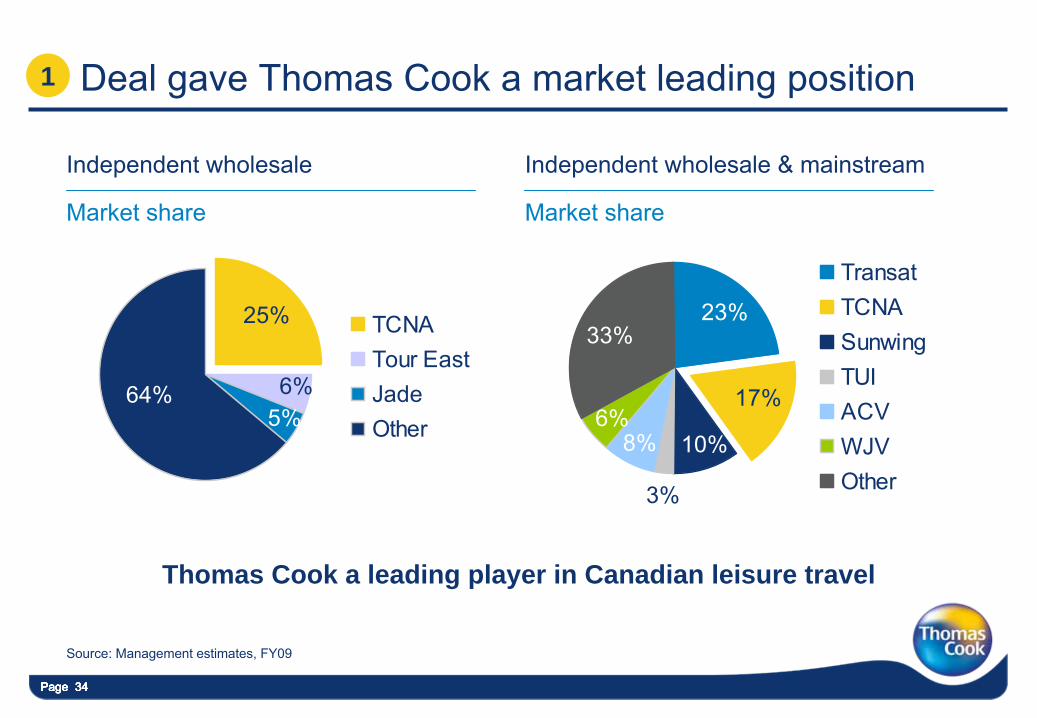
Deal gave Thomas Cook a market leading position
Source: Management estimates, FY09
3%
23%
17%
10%8%6%
33%
TransatTCNASunwingTUIACVWJVOther
64%
25%
6%5%
TCNATour EastJadeOther
Independent wholesale Independent wholesale & mainstream
Thomas Cook a leading player in Canadian leisure travel
1
Market share Market share
Page 35Page 35Page 35Page 35Page 35
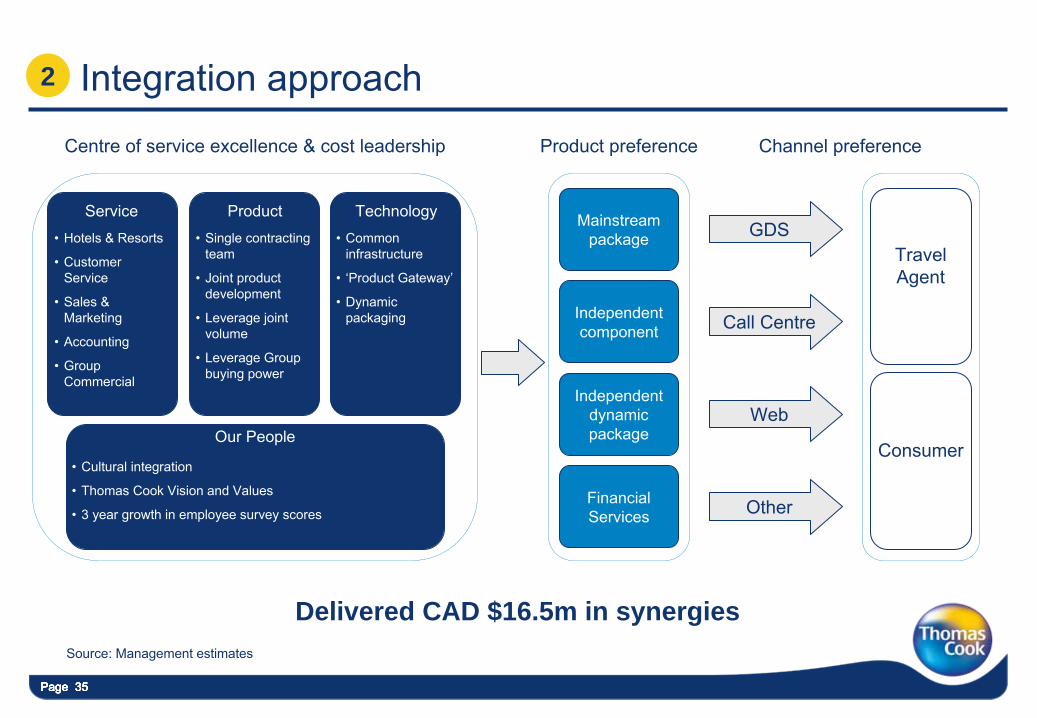
Integration approach2
Source: Management estimates
Mainstream
package
Independent
component
Independent
dynamic
package
FinancialServices
Web
GDS
Call Centre
Other
Our People
•
Hotels & Resorts
•
Customer Service
•
Sales & Marketing
•
Accounting
•
Group Commercial
•
Single contracting team
•
Joint product development
•
Leverage joint volume
•
Leverage Group buying power
•
Common infrastructure
•
‘Product Gateway’
•
Dynamic packaging
Service Product Technology
TravelAgent
Consumer
Centre of service excellence & cost leadership Channel preferenceProduct preference
Delivered CAD $16.5m in synergies
•
Cultural integration
•
Thomas Cook Vision and Values
•
3 year growth in employee survey scores
Page 36Page 36Page 36
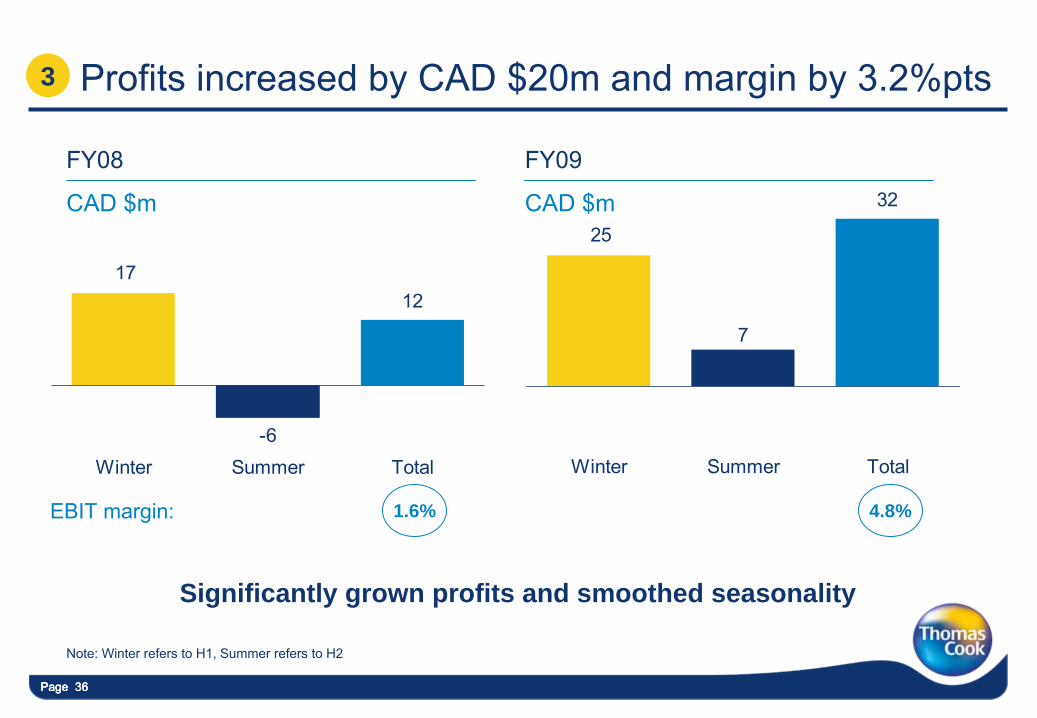
1217
-6Winter Summer Total
32
7
25
Winter Summer Total
Profits increased by CAD $20m and margin by 3.2%pts
FY08
CAD $m
1.6% 4.8%EBIT margin:
Note: Winter refers to H1, Summer refers to H2
Significantly grown profits and smoothed seasonality
3
FY09
CAD $m
Page 37Page 37Page 37Page 37
Future growth
•
Leverage the Thomas Cook brand to drive consumer awareness and revenue growth
•
Grow independent travel through Thomas Cook online strategy (including B2C)
•
Improve mainstream profitability through product exclusivity and
cost savings
•
Continue to develop and leverage service excellence and cost leadership
•
Grow Thomas Cook Financial Services
Maintain market leading margins
Page 38
How to restructure a loss making French business with a weak market position?
Thomas Döring –
CEO West/East Europe
Page 39
France objectives
Focus on mainstream travel:
•
Turnaround loss making French business
•
Create a platform for future profitable growth
Page 40Page 40
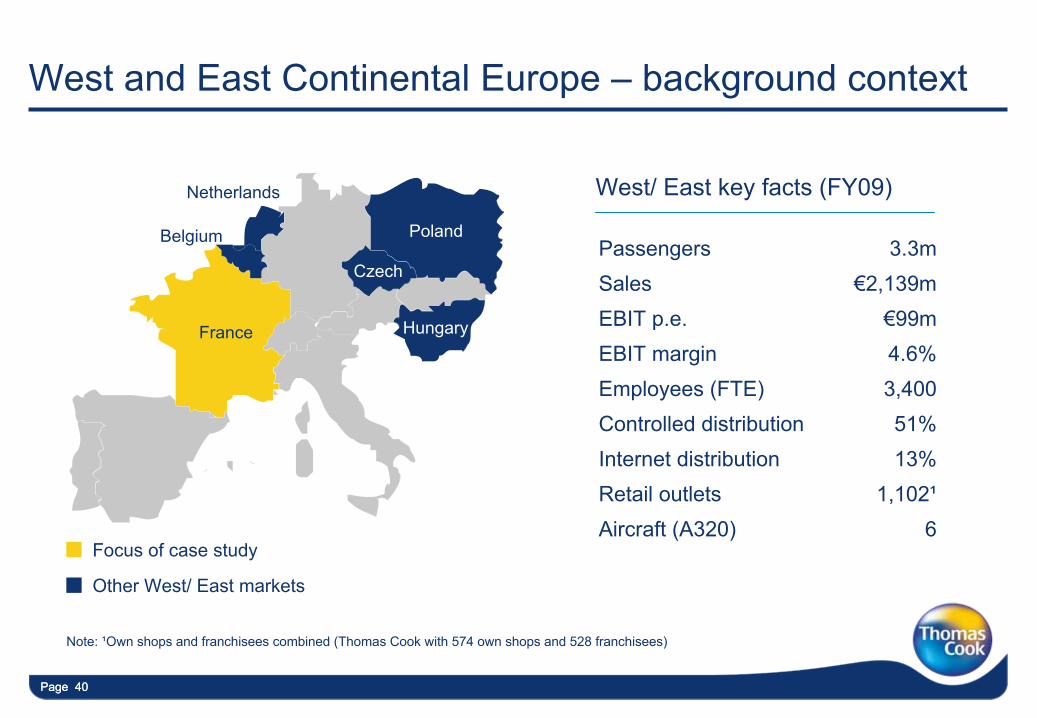
West and East Continental Europe –
background context
Poland Belgium
Netherlands
France Hungary
Czech
Hungary
Other West/ East markets
Passengers 3.3mSales €2,139mEBIT p.e. €99mEBIT margin 4.6%Employees (FTE) 3,400Controlled distribution 51%Internet distribution 13%Retail outlets 1,102¹Aircraft (A320) 6
West/ East key facts (FY09)
Focus of case study
Note: ¹Own shops and franchisees combined (Thomas Cook with 574 own shops and 528 franchisees)
Page 41Page 4141
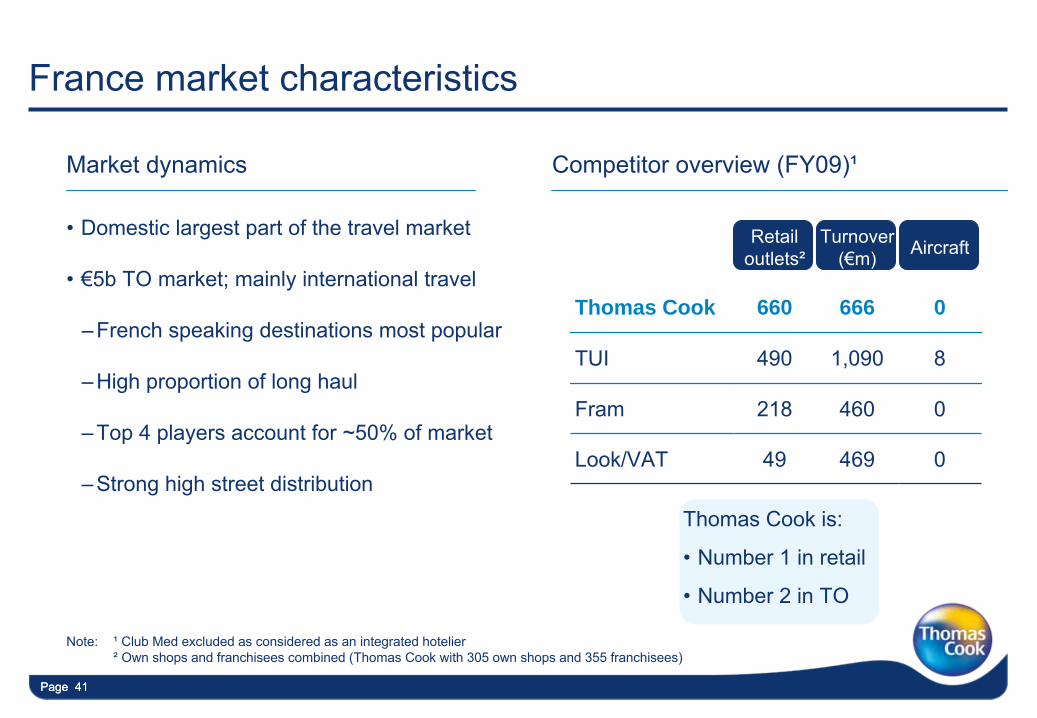
France market characteristics
•
Domestic largest part of the travel market
•
€5b TO market; mainly international travel
–French speaking destinations most popular
–High proportion of long haul
–Top 4 players account for ~50% of market
–Strong high street distribution
Note: ¹
Club Med excluded as considered as an integrated hotelier
²
Own shops and franchisees combined (Thomas Cook with 305 own shops and 355 franchisees)
Market dynamics
Retail outlets²
Turnover (€m) Aircraft
Thomas Cook 660 666 0
TUI 490 1,090 8
Fram 218 460 0
Look/VAT 49 469 0
Competitor overview (FY09)¹
Thomas Cook is:
•
Number 1 in retail
•
Number 2 in TO
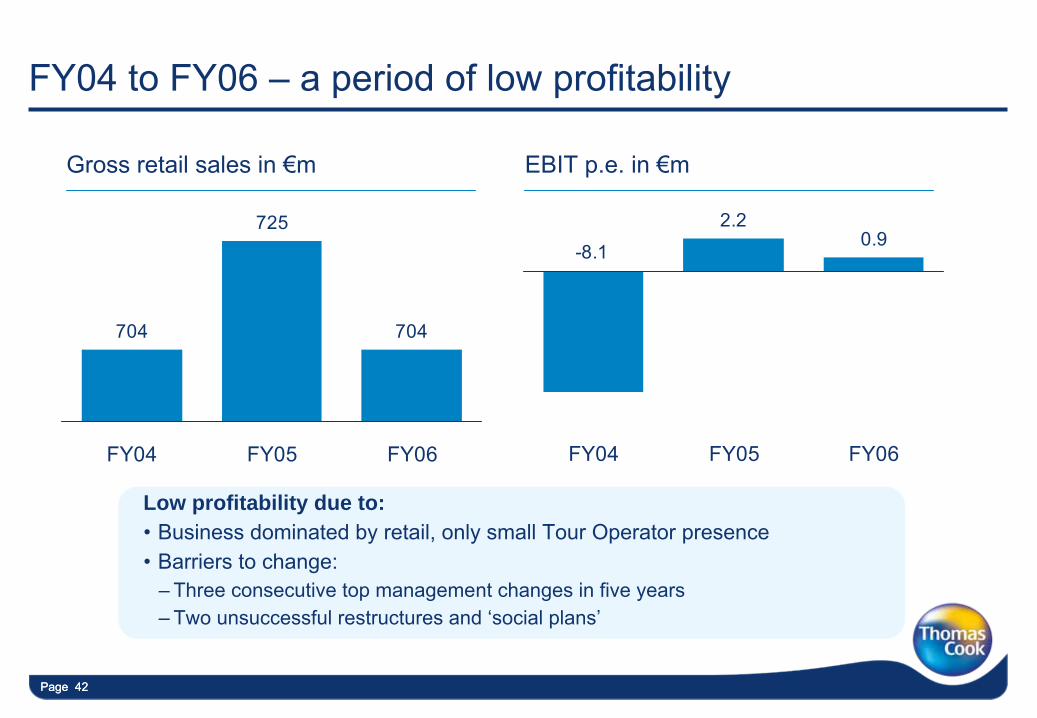
Page 42Page 42
FY04 to FY06 –
a period of low profitability
704
725
704
FY04 FY05 FY06
Gross retail sales in €m EBIT p.e. in €m
2.20.9
-8.1
FY04 FY05 FY06
Low profitability due to:•
Business dominated by retail, only small Tour Operator presence•
Barriers to change: –
Three consecutive top management changes in five years–
Two unsuccessful restructures and ‘social plans’
Page 43
Transformation plan launched in FY06
•
Restructure existing business
•
Grow Tour Operator
–
Growth of in-house Thomas Cook Tour Operator
–
Acquisition of Jet Tours
1
2
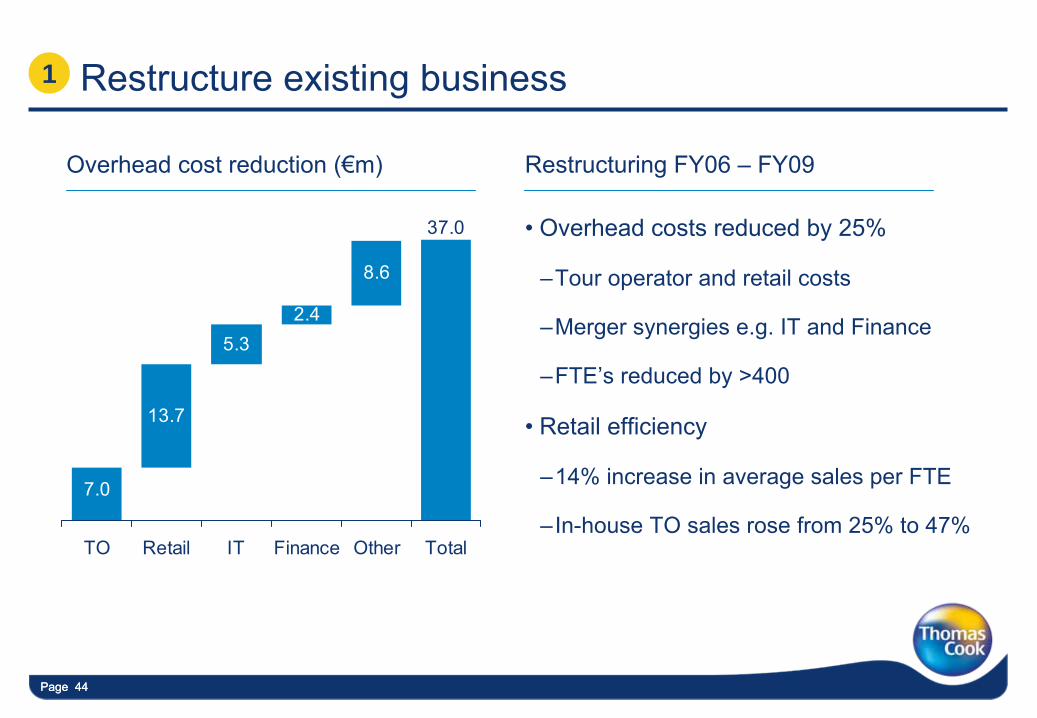
Page 44Page 44
13.7
5.32.4
8.6
37.0
7.0
TO Retail IT Finance Other Total
Overhead cost reduction (€m)
Restructure existing business1
Restructuring FY06 –
FY09
•
Overhead costs reduced by 25%
–Tour operator and retail costs
–Merger synergies e.g. IT and Finance
–FTE’s reduced by >400
•
Retail efficiency
–14% increase in average sales per FTE
–In-house TO sales rose from 25% to 47%
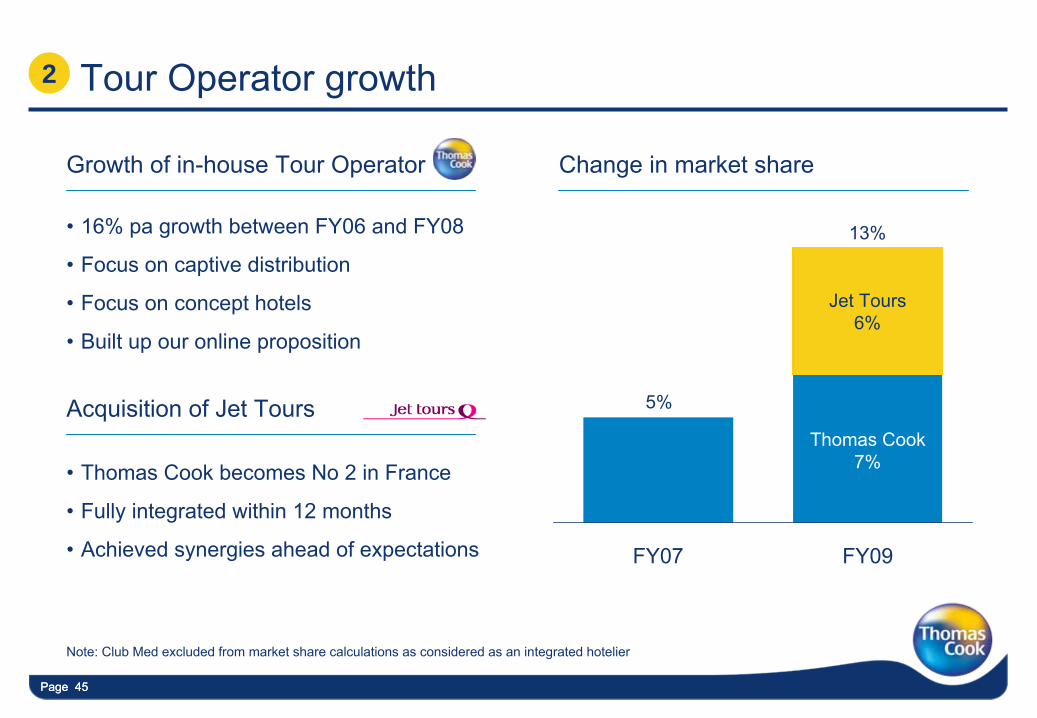
Page 45Page 45
Growth of in-house Tour Operator
Tour Operator growth2
Change in market share
•
16% pa growth between FY06 and FY08
•
Focus on captive distribution
•
Focus on concept hotels
•
Built up our online proposition
Acquisition of Jet Tours
•
Thomas Cook becomes No 2 in France
•
Fully integrated within 12 months
•
Achieved synergies ahead of expectations
Note: Club Med excluded from market share calculations as considered as an integrated hotelier
5%
13%
FY07 FY09
Jet Tours6%
Thomas Cook7%
Page 46Page 4646
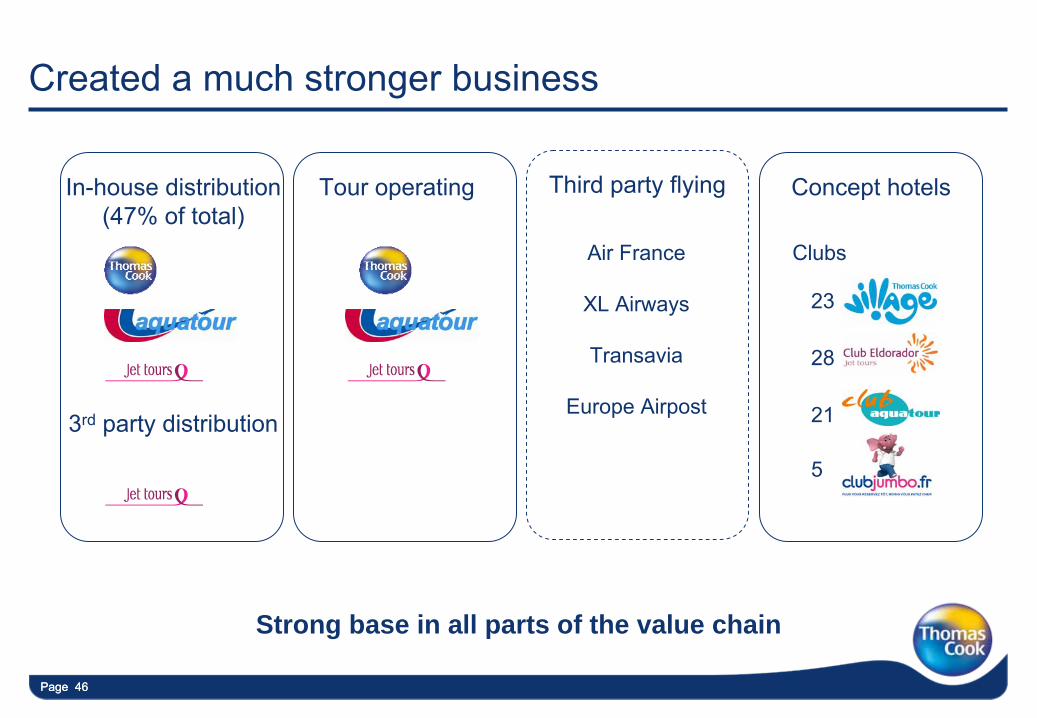
Created a much stronger business
3rd
party distribution
Third party flying
Clubs
In-house distribution(47% of total)
Tour operating Concept hotels
5
28
23
21
Air France
XL Airways
Transavia
Europe Airpost
Strong base in all parts of the value chain
Page 47Page 47
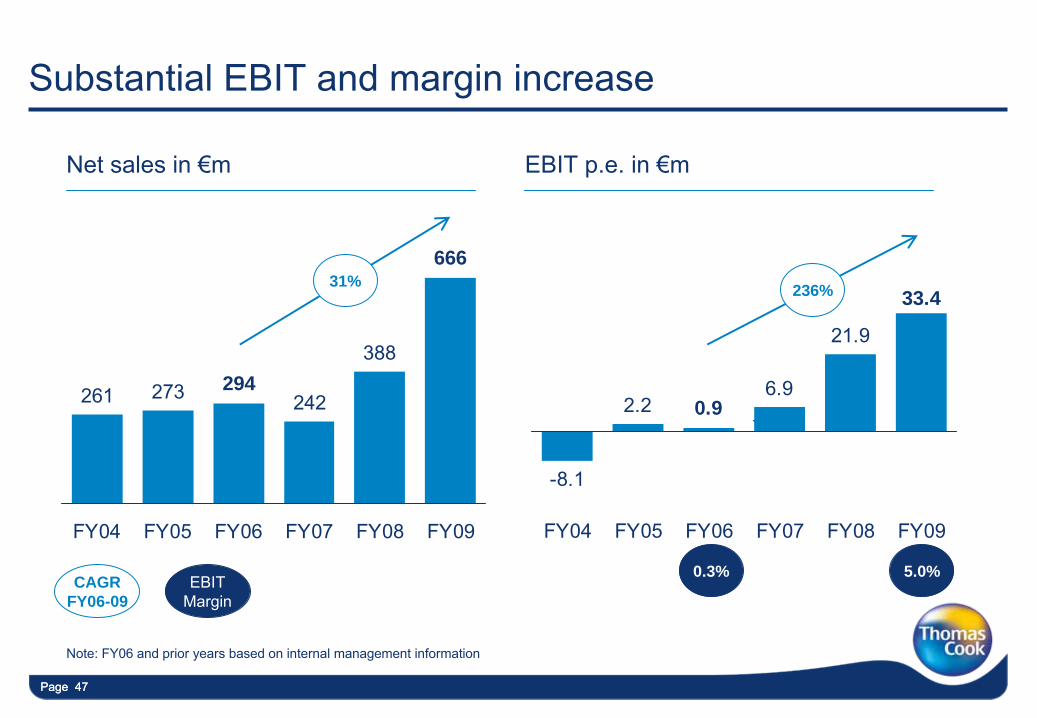
Substantial EBIT and margin increase
261 273 242
388294
666
FY04 FY05 FY06 FY07 FY08 FY09
-8.1
2.26.9
21.9
33.4
0.9
FY04 FY05 FY06 FY07 FY08 FY09
`
0.3%
Net sales in €m EBIT p.e. in €m
31%
CAGR FY06-09
EBIT Margin
5.0%
Note: FY06 and prior years based on internal management information
236%
Page 48Page 48
Future growth
•
Growth of Thomas Cook online
•
Growth of Jet Tours by leveraging restructured third party distribution
•
Growth and margin through more and new club products e.g.
•
Maintain cost leadership and drive further efficiency improvements
Page 49
How to make profits in an unconsolidated and highly competitive German market?
Peter Fankhauser –
CEO Central Europe
Page 50
Germany objectives
•
Turnaround a €160m loss making business
•
Become the most profitable German travel company
•
Create platform for future profitable growth
Page 51Page 51
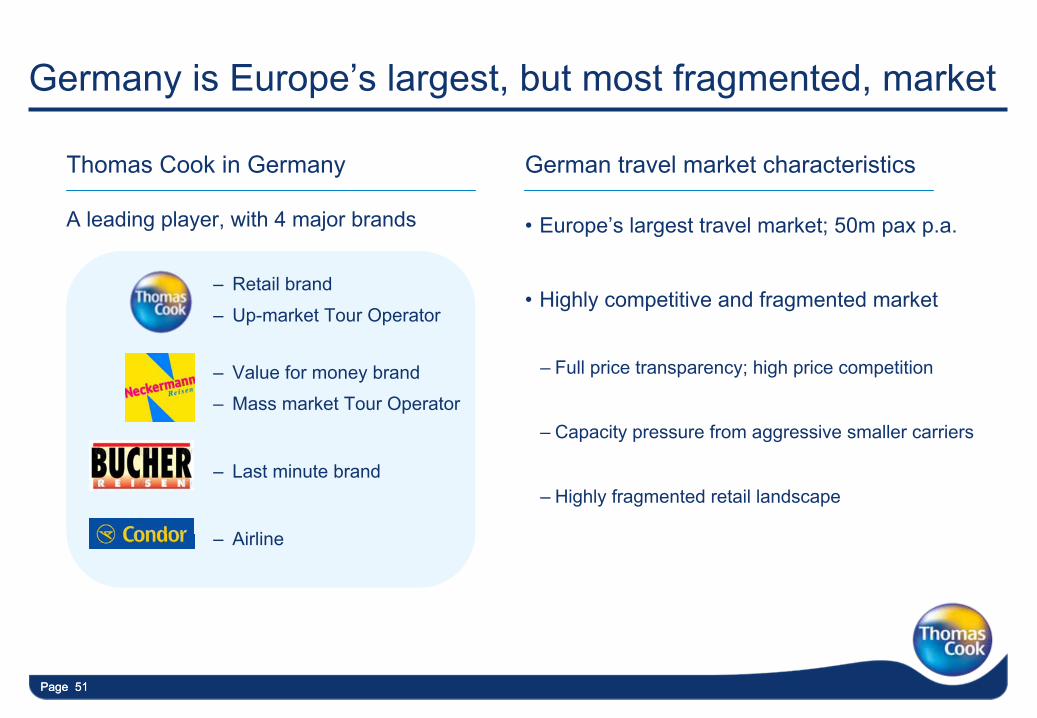
Thomas Cook in Germany
Germany is Europe’s largest, but most fragmented, market
German travel market characteristics
•
Europe’s largest travel market; 50m pax
p.a.
•
Highly competitive and fragmented market
–
Full price transparency; high price competition
–
Capacity pressure from aggressive smaller carriers
–
Highly fragmented retail landscape
–
Retail brand
–
Up-market Tour Operator
A leading player, with 4 major brands
–
Value for money brand
–
Mass market Tour Operator
–
Last minute brand
–
Airline
Page 52Page 52
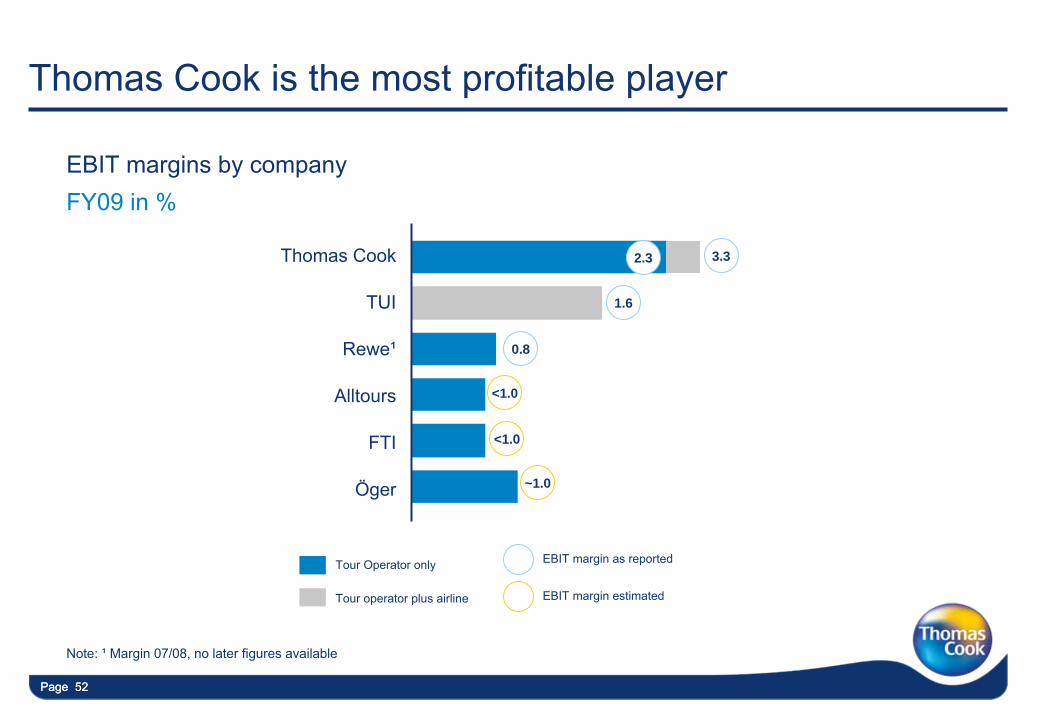
Thomas Cook is the most profitable player
EBIT margins by company FY09 in %
Thomas Cook
TUI
Alltours
Rewe¹
FTI
Öger
EBIT margin as reportedTour Operator only
Tour operator plus airline EBIT margin estimated
3.3
1.6
<1.0
<1.0
~1.0
0.8
2.3
Note: ¹
Margin 07/08, no later figures available
Page 53Page 53
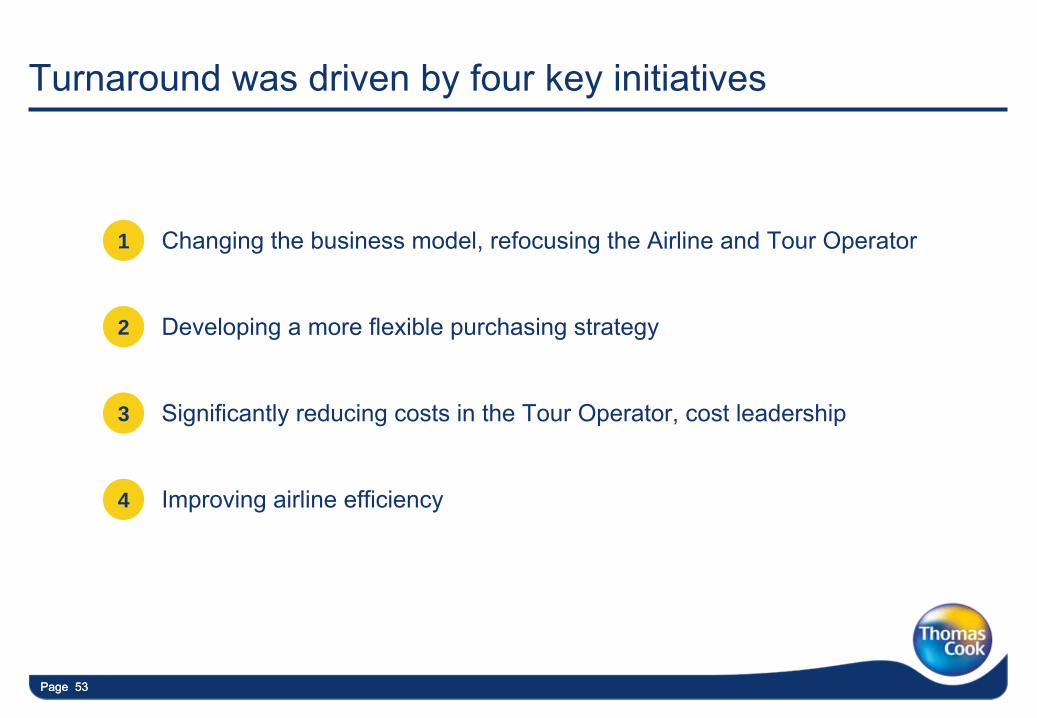
Turnaround was driven by four key initiatives
•
Changing the business model, refocusing the Airline and Tour Operator
•
Developing a more flexible purchasing strategy
•
Significantly reducing costs in the Tour Operator, cost leadership
•
Improving airline efficiency
1
2
3
4
Page 54Page 54
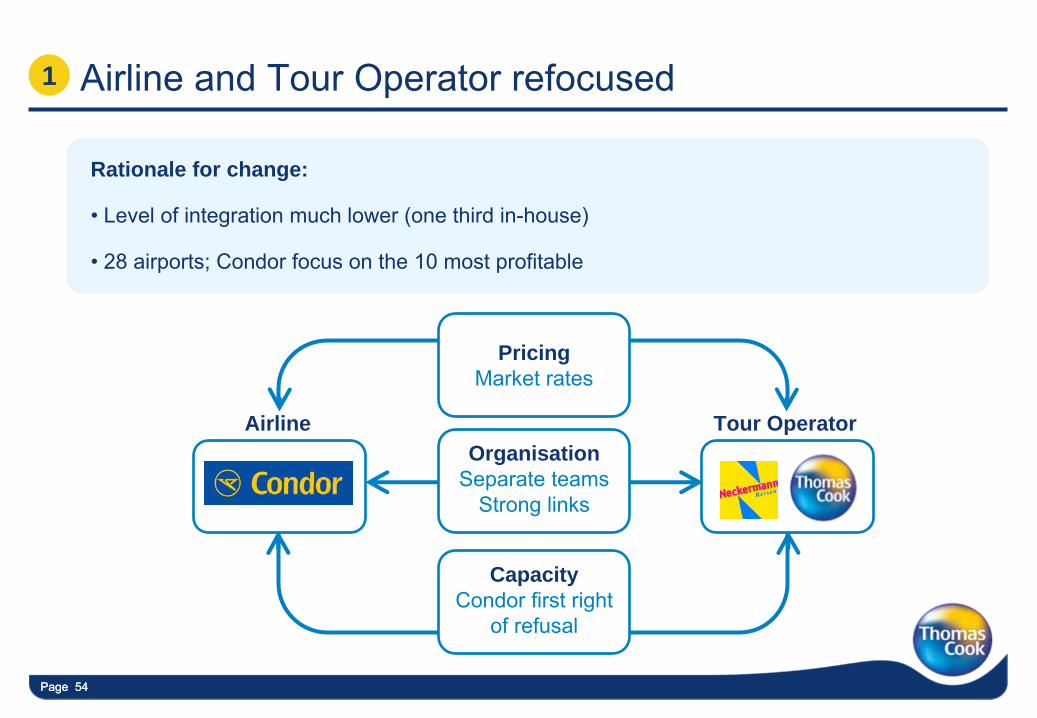
Rationale for change:
•
Level of integration much lower (one third in-house)
•
28 airports; Condor focus on the 10 most profitable
Airline and Tour Operator refocused1
Tour OperatorAirlineOrganisation
Separate teamsStrong links
PricingMarket rates
CapacityCondor first right
of refusal
Page 55Page 55
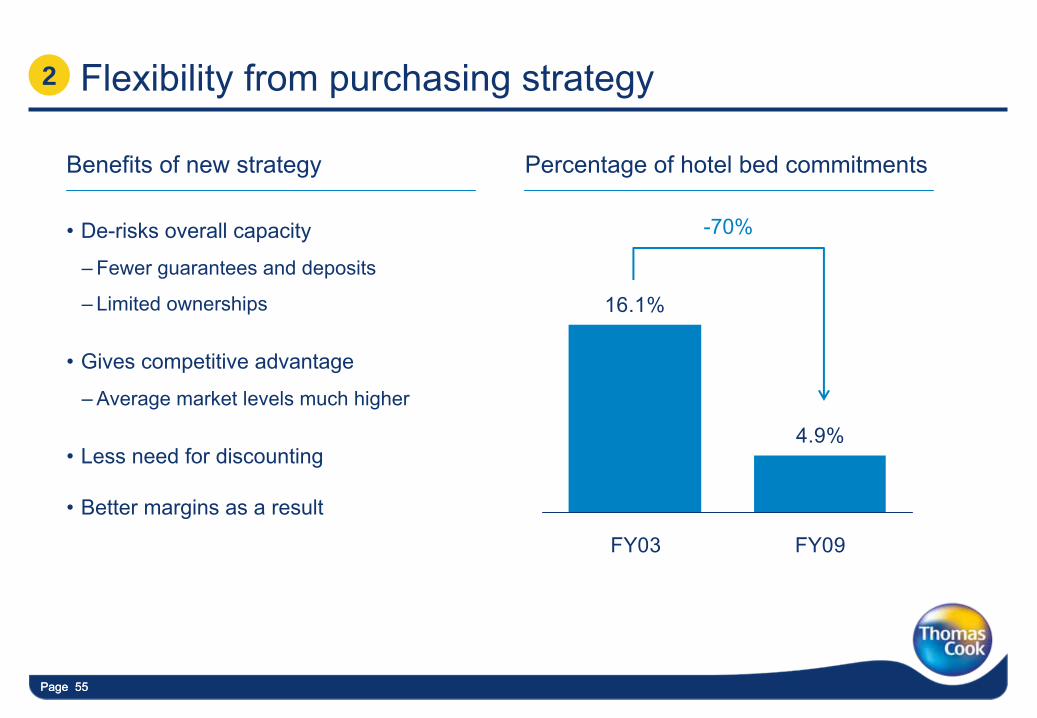
Flexibility from purchasing strategy
•
De-risks overall capacity
–
Fewer guarantees and deposits
–
Limited ownerships
•
Gives competitive advantage
–
Average market levels much higher
•
Less need for discounting
•
Better margins as a result
Benefits of new strategy Percentage of hotel bed commitments
16.1%
4.9%
FY03 FY09
-70%
2
Page 56Page 56
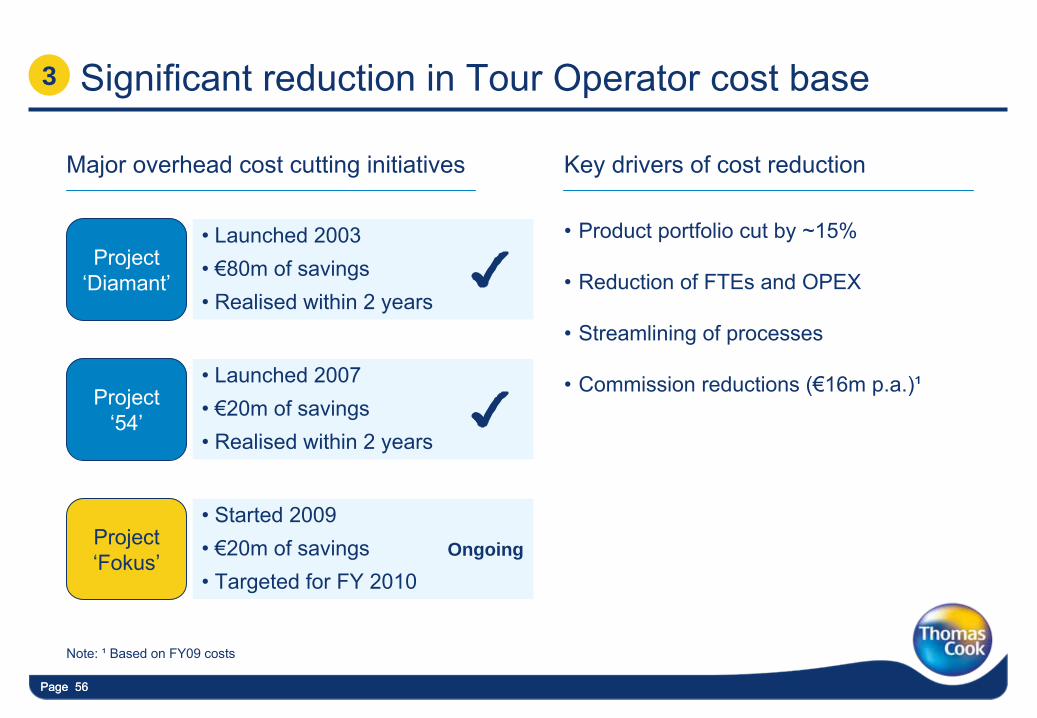
•
Launched 2003 •
€80m of savings•
Realised within 2 years
•
Launched 2007 •
€20m of savings•
Realised within 2 years
•
Started 2009 •
€20m of savings•
Targeted for FY 2010
Significant reduction in Tour Operator cost base
•
Product portfolio cut by ~15%
•
Reduction of FTEs and OPEX
•
Streamlining of processes
•
Commission reductions (€16m p.a.)¹
Major overhead cost cutting initiatives
3
Project ‘Diamant’
Project ‘54’
Project ‘Fokus’
Ongoing
Key drivers of cost reduction
Note: ¹
Based on FY09 costs
Page 57Page 57
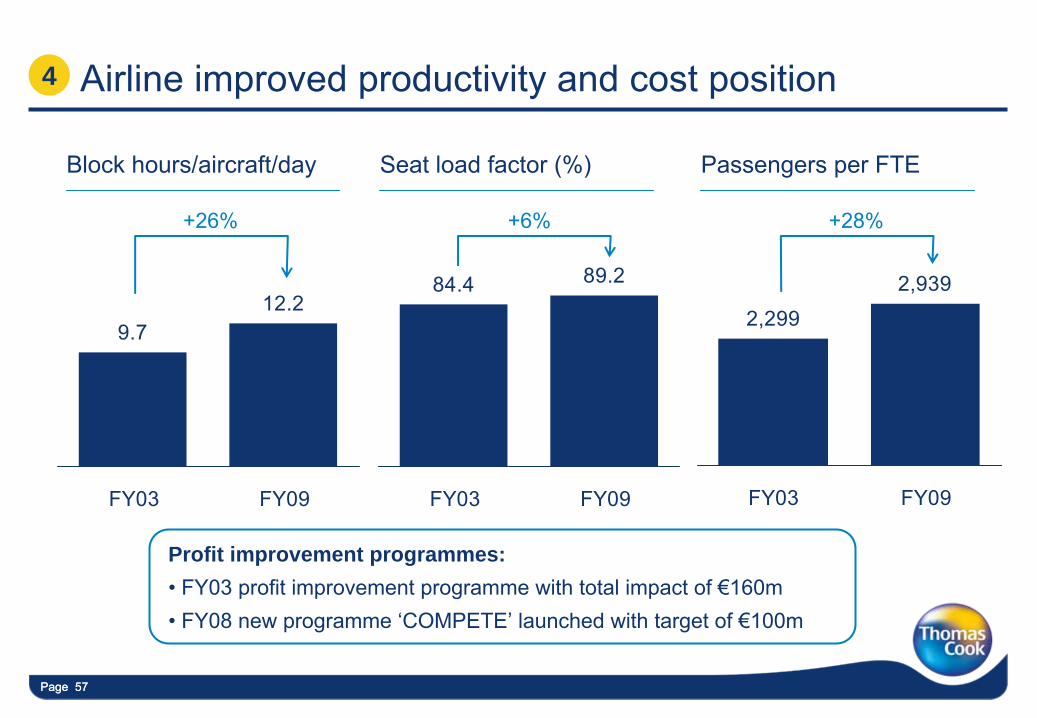
Airline improved productivity and cost position
Block hours/aircraft/day Seat load factor (%) Passengers per FTE
4
9.712.2
FY03 FY09
+26%
84.4 89.2
FY03 FY09
2,299
2,939
FY03 FY09
Profit improvement programmes:•
FY03 profit improvement programme with total impact of €160m•
FY08 new programme ‘COMPETE’
launched with target of €100m
+6% +28%
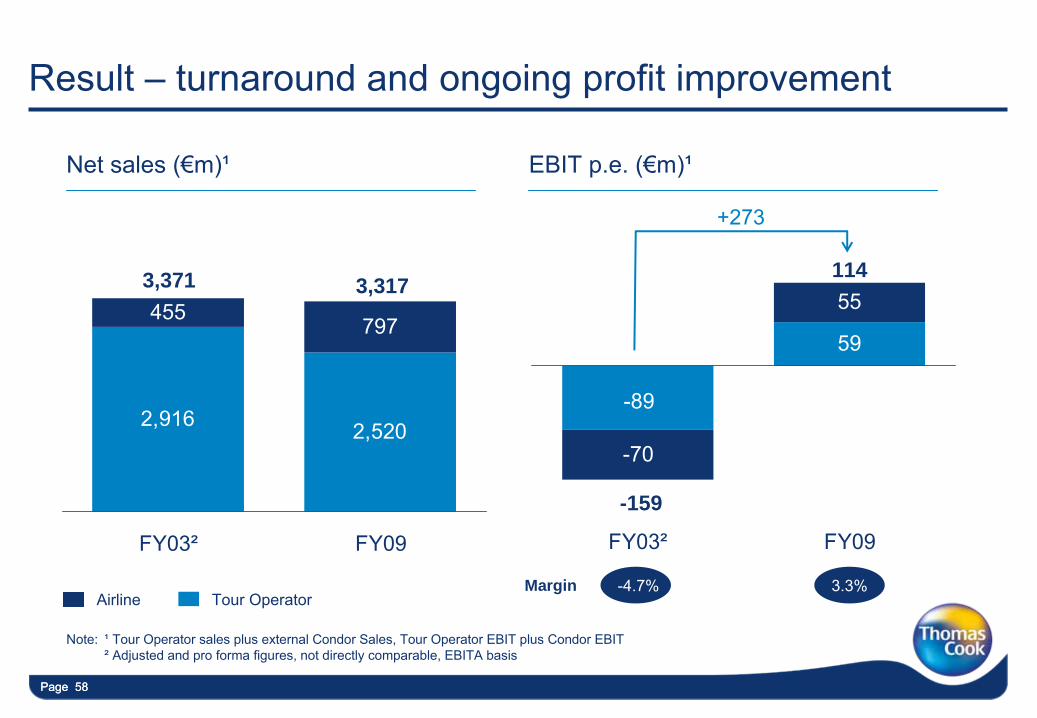
Page 58Page 58
Result –
turnaround and ongoing profit improvement
2,916 2,520
455797
FY03² FY09
Net sales (€m)¹
3,371 3,317
Tour Operator
Note: ¹
Tour Operator sales plus external Condor Sales, Tour Operator EBIT plus Condor EBIT ²
Adjusted and pro forma figures, not directly comparable, EBITA basis
Airline
EBIT p.e. (€m)¹
59
-70
55
-89
FY03² FY09
-159
114
-4.7% 3.3%Margin
+273
Page 59Page 59
Future growth
•
Extend mainstream ‘live pricing’
model to drive growth
•
Expand online share, introduce ePackaging and grow OTA business
•
Extend exclusive and differentiated concepts like
•
Continue to drive cultural change through Group values
•
Centralise overseas purchasing and functions to reduce costs
•
Continue to look for opportunities to consolidate the market

Page 60
How to defend market leading margins of 8-9% in Nordic markets?
Sam Weihagen –
CEO Northern Europe
Page 61
Northern Europe objectives
•
Defend industry leading margins in mainstream
•
Strengthen market leading position
•
Create platform for future growth
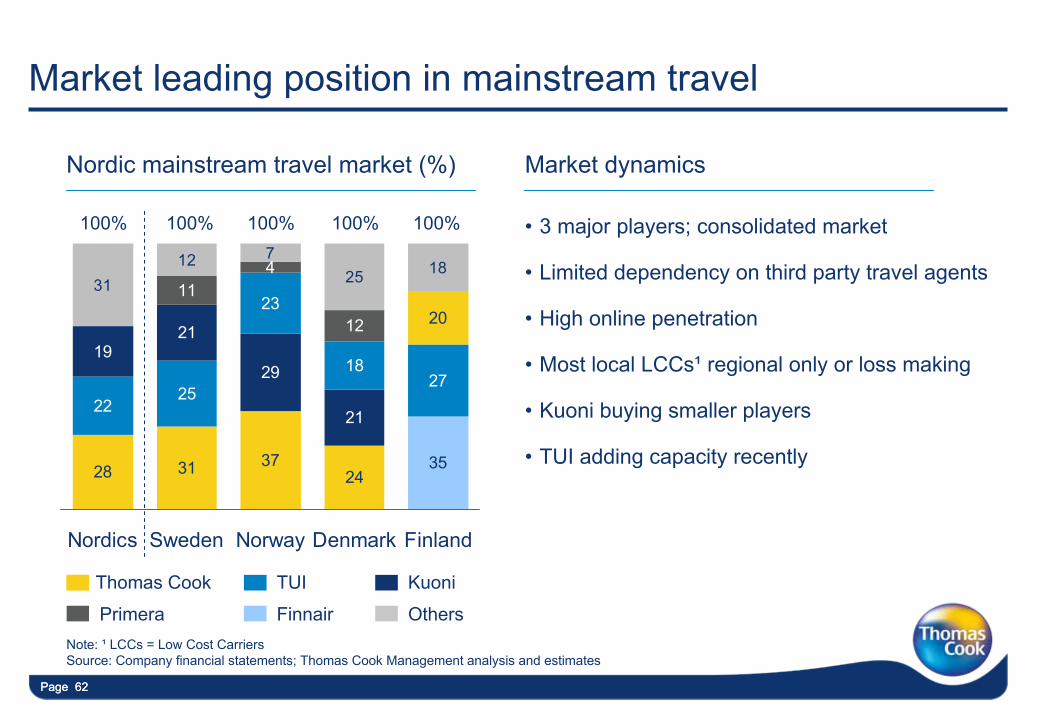
Page 62Page 62
•
3 major players; consolidated market
•
Limited dependency on third party travel agents
•
High online penetration
•
Most local LCCs¹
regional only or loss making
•
Kuoni
buying smaller players
•
TUI adding capacity recently
Market leading position in mainstream travel
Nordic mainstream travel market (%) Market dynamics
Thomas Cook TUI Kuoni
Primera Finnair Others
3524
373128
2725
22
20
21
29
2119
18
2312
411
1825712
31
FinlandDenmarkNorwaySwedenNordics
100% 100% 100% 100% 100%
Note: ¹
LCCs = Low Cost Carriers
Source: Company financial statements; Thomas Cook Management analysis and estimates
Page 63Page 63
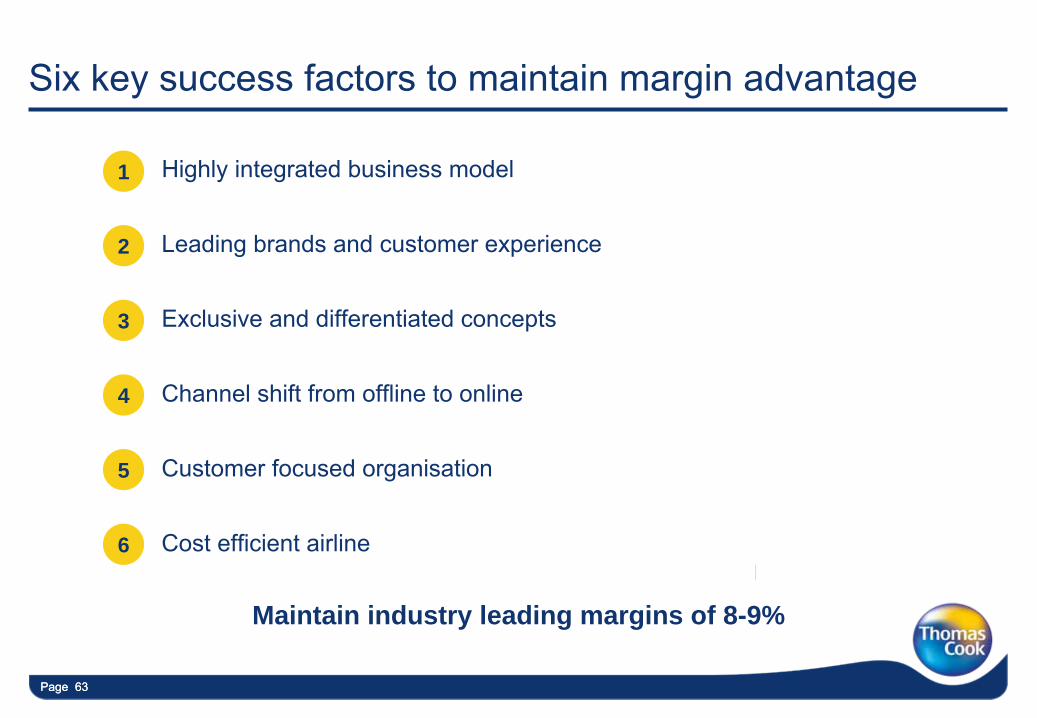
Six key success factors to maintain margin advantage
•
Highly integrated business model
•
Leading brands and customer experience
•
Exclusive and differentiated concepts
•
Channel shift from offline to online
•
Customer focused organisation
•
Cost efficient airline
1
2
3
4
5
Maintain industry leading margins of 8-9%
6
Page 64Page 64
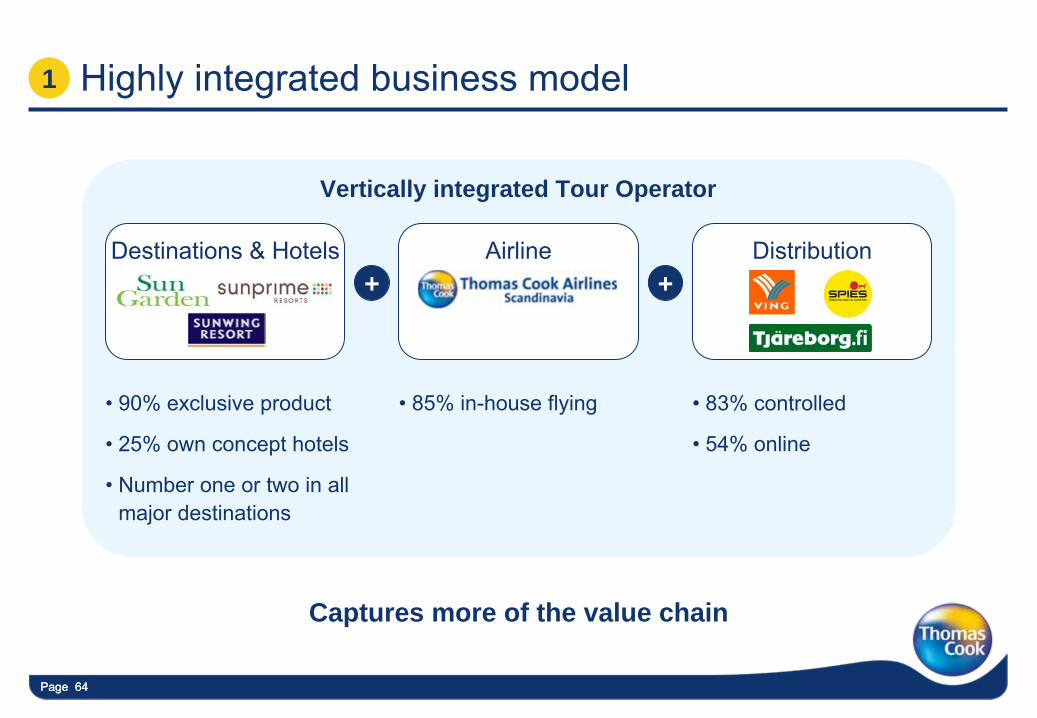
Highly integrated business model1
Destinations & Hotels Airline Distribution+ +
Vertically integrated Tour Operator
•
90% exclusive product
•
25% own concept hotels
•
Number one or two in all major destinations
•
85% in-house flying •
83% controlled
•
54% online
Captures more of the value chain
Page 65Page 65
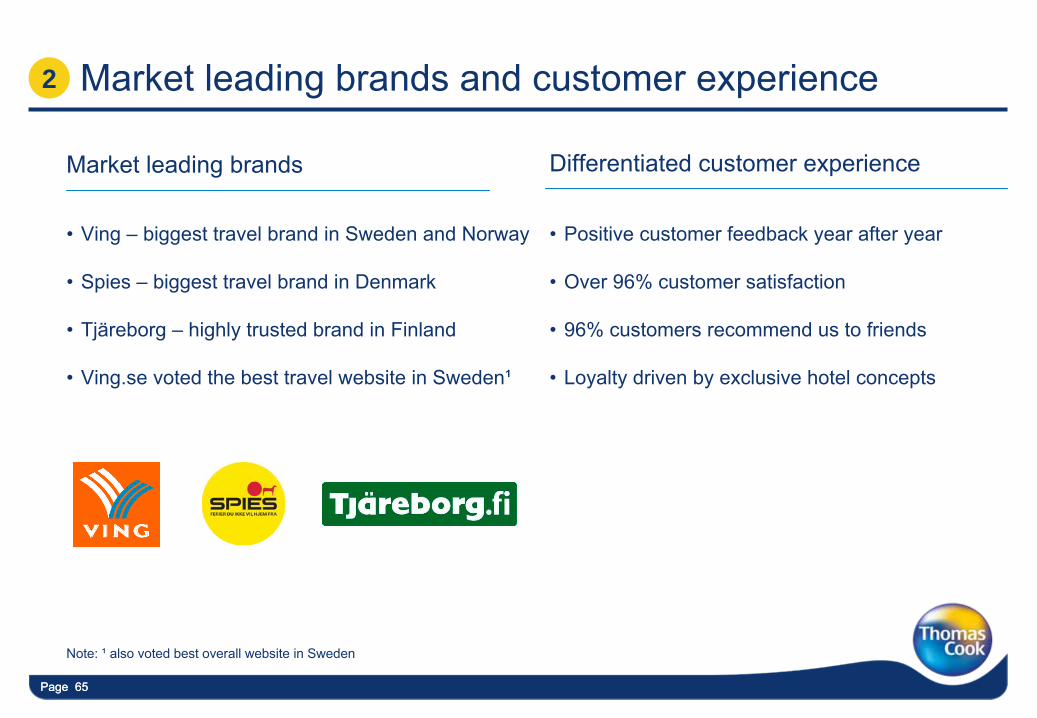
Market leading brands and customer experience
•
Ving
–
biggest travel brand in Sweden and Norway
•
Spies –
biggest travel brand in Denmark
•
Tjäreborg
–
highly trusted brand in Finland
•
Ving.se
voted the best travel website in Sweden¹
•
Positive customer feedback year after year
•
Over 96% customer satisfaction
•
96% customers recommend us to friends
•
Loyalty driven by exclusive hotel concepts
Market leading brands Differentiated customer experience
2
Page 65
Note: ¹
also voted best overall website in Sweden
Page 66
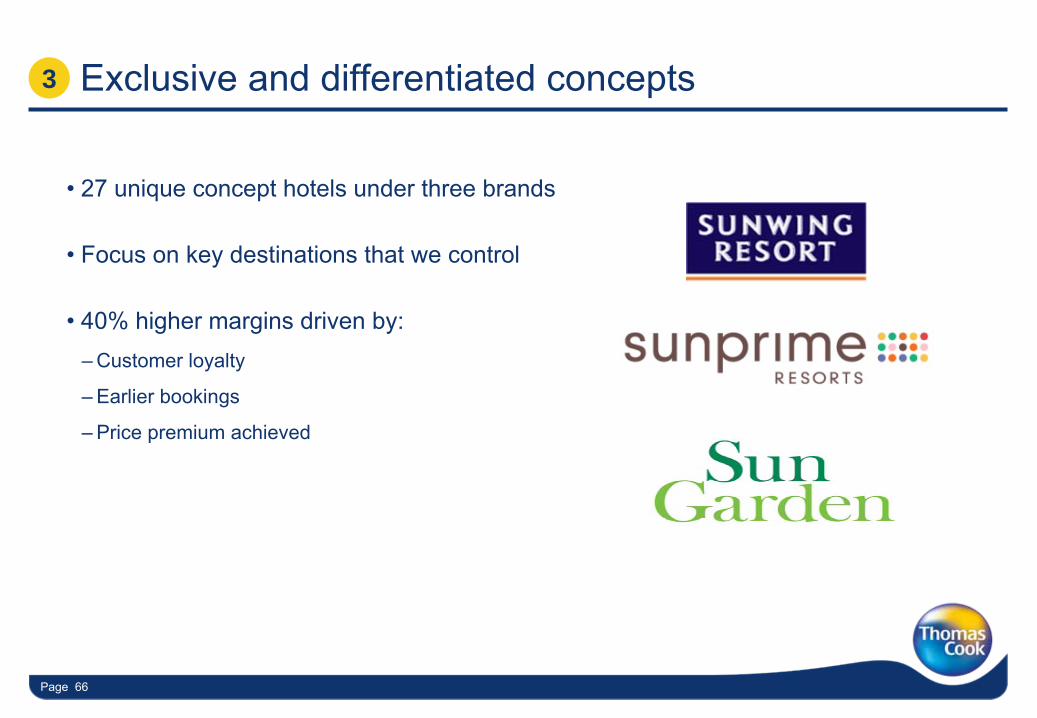
Exclusive and differentiated concepts
•
27 unique concept hotels under three brands
•
Focus on key destinations that we control
•
40% higher margins driven by:–
Customer loyalty
–
Earlier bookings
–
Price premium achieved
- 66 -
3
Page 67Page 67
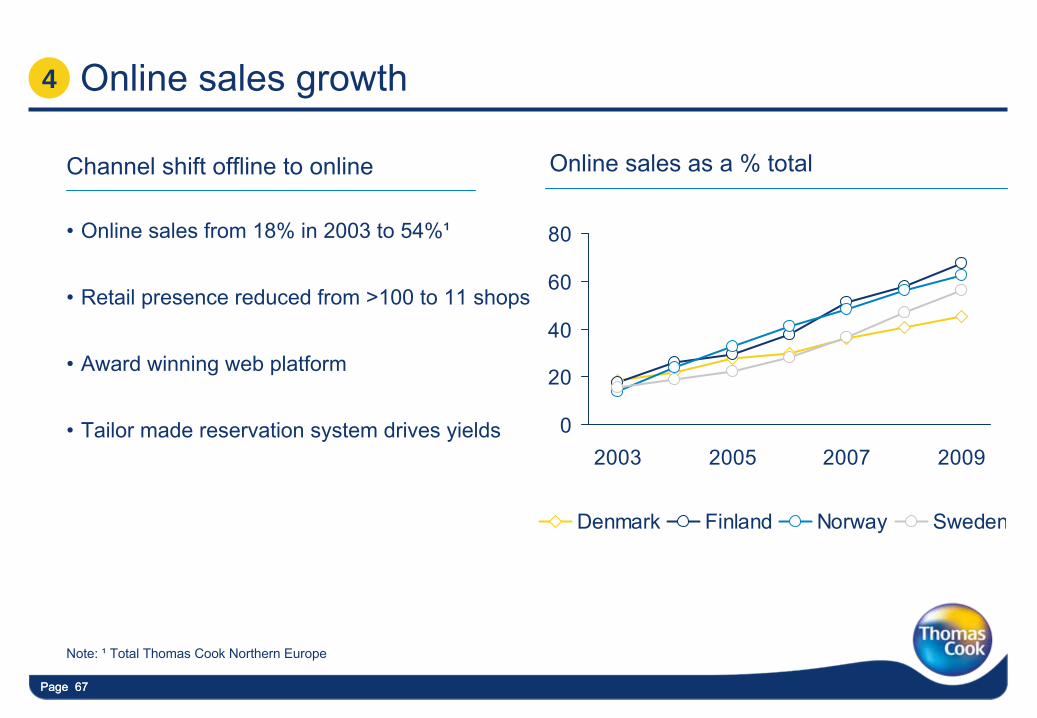
Online sales growth
•
Online sales from 18% in 2003 to 54%¹
•
Retail presence reduced from >100 to 11 shops
•
Award winning web platform
•
Tailor made reservation system drives yields
Channel shift offline to online
4
Online sales as a % total
0
20
40
60
80
2003 2005 2007 2009
Denmark Finland Norway Sweden
Note: ¹
Total Thomas Cook Northern Europe
Page 68Page 68
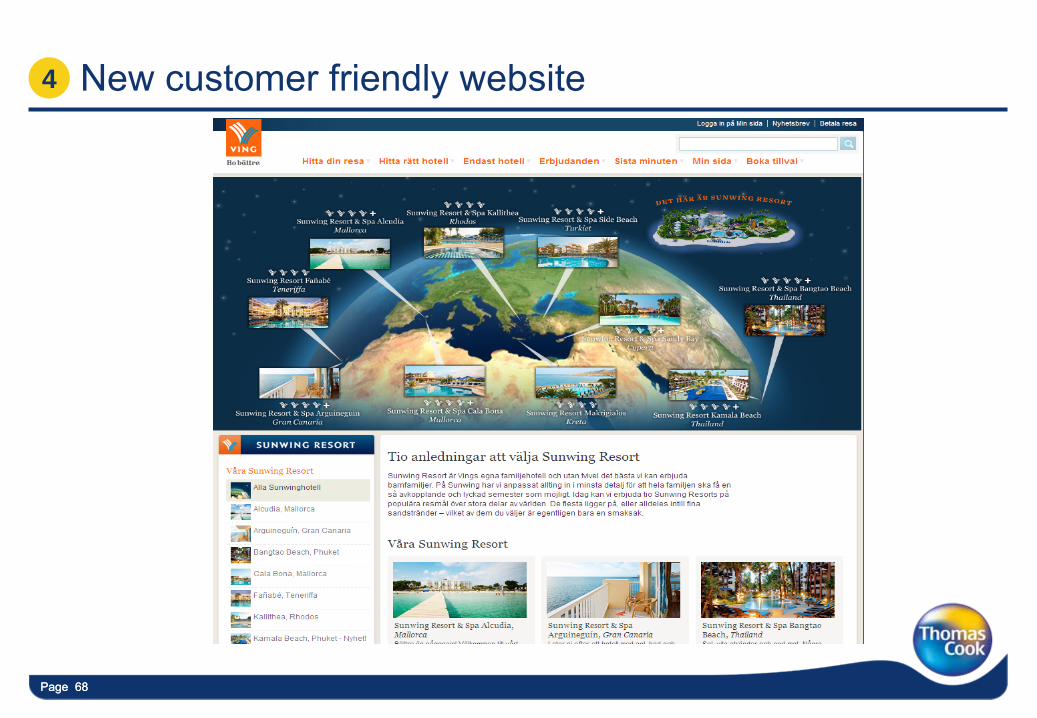
New customer friendly website 4
Page 69Page 69
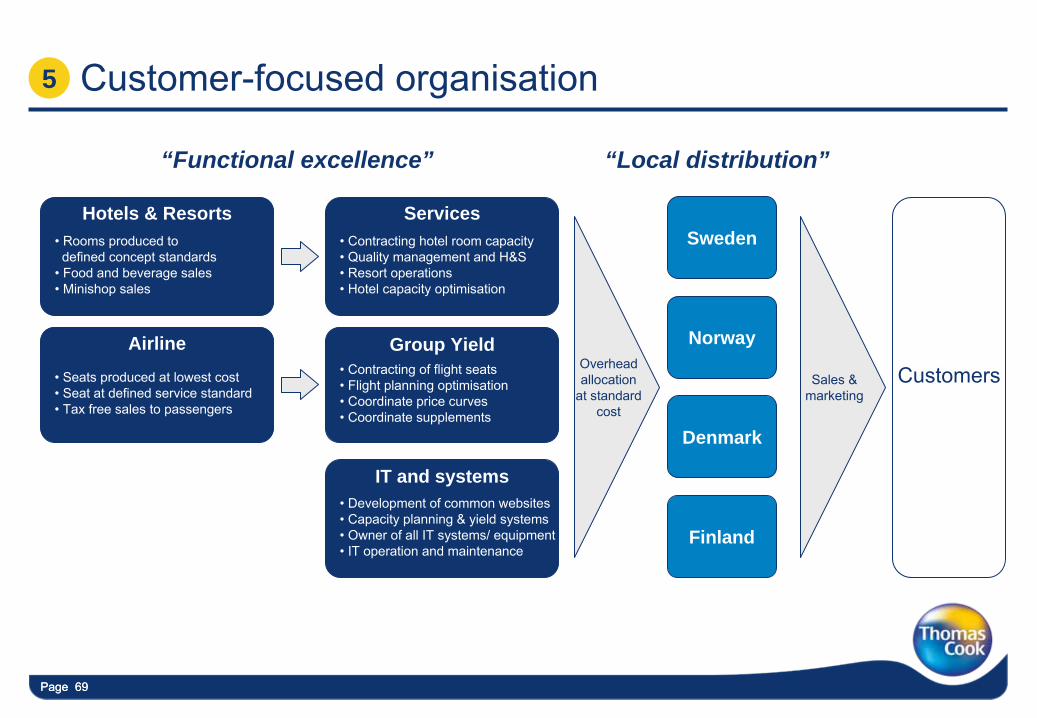
“Functional excellence” “Local distribution”
Customers• Seats produced at lowest cost• Seat at defined service standard• Tax free sales to passengers
•
Rooms produced to defined concept standards
• Food and beverage sales• Minishop
sales
Sweden
Norway
Denmark
Finland
Overhead allocation
at standard cost
Sales & marketing
• Development of common websites• Capacity planning & yield systems• Owner of all IT systems/ equipment• IT operation and maintenance
• Contracting of flight seats• Flight planning optimisation• Coordinate price curves• Coordinate supplements
• Contracting hotel room capacity• Quality management and H&S• Resort operations• Hotel capacity optimisation
Services
Group Yield
IT and systems
Hotels & Resorts
Airline
5 Customer-focused organisation
Page 70
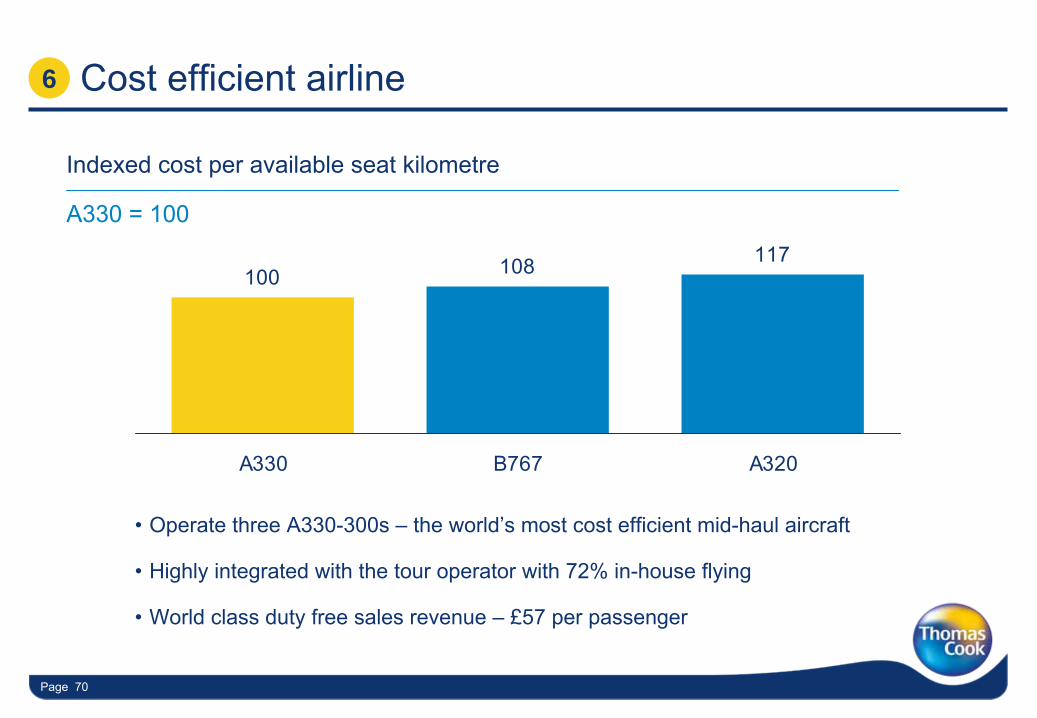
Cost efficient airline
- 70 -
6
•
Operate three A330-300s –
the world’s most cost efficient mid-haul aircraft
•
Highly integrated with the tour operator with 72% in-house flying
•
World class duty free sales revenue –
£57 per passenger
100 108 117
A330 B767 A320
A330 = 100
Indexed cost per available seat kilometre
Page 71Page 71
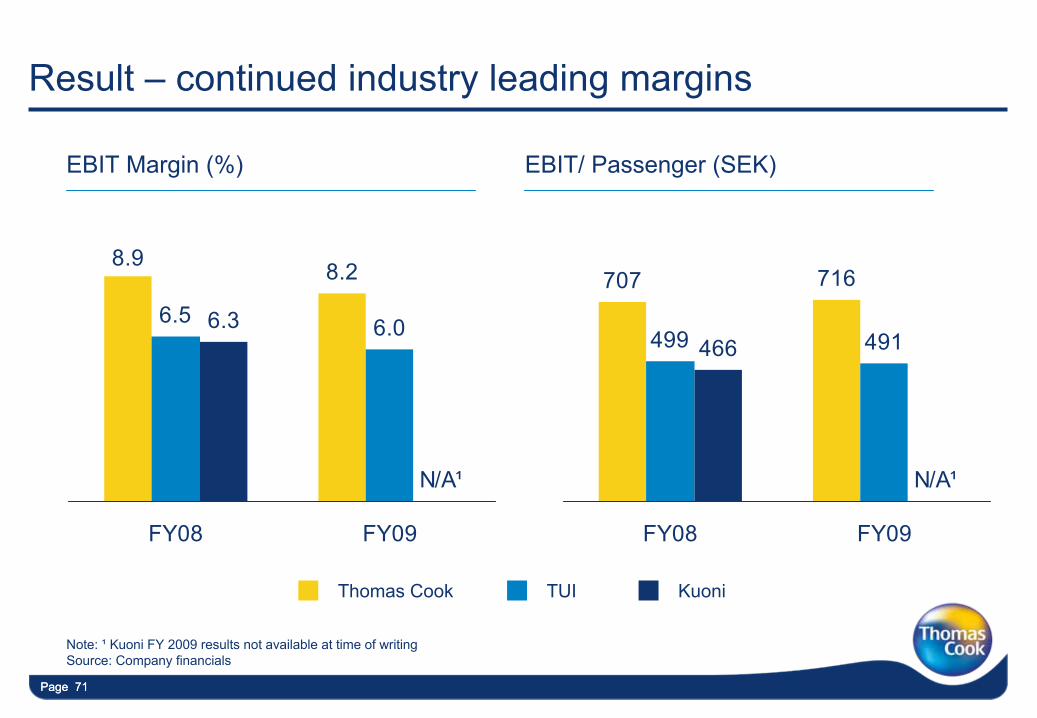
8.9 8.2
6.5 6.06.3
N/A¹
FY08 FY09
Result –
continued industry leading margins
EBIT Margin (%) EBIT/ Passenger (SEK)
Note: ¹
Kuoni
FY 2009 results not available at time of writing
Source: Company financials
707 716
499 491466
N/A¹
FY08 FY09
Thomas Cook TUI Kuoni
Page 72
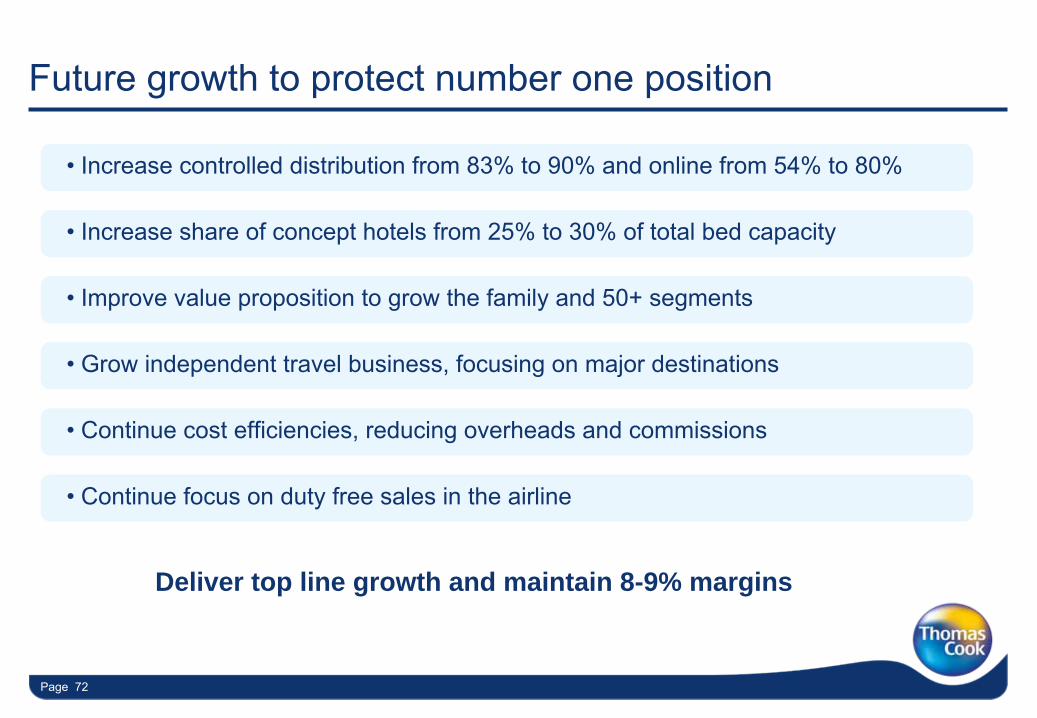
Future growth to protect number one position
•
Increase controlled distribution from 83% to 90% and online from
54% to 80%
•
Increase share of concept hotels from 25% to 30% of total bed capacity
•
Improve value proposition to grow the family and 50+ segments
•
Grow independent travel business, focusing on major destinations
•
Continue cost efficiencies, reducing overheads and commissions
•
Continue focus on duty free sales in the airline
Deliver top line growth and maintain 8-9% margins
Page 73
Summary
Manny Fontenla-Novoa –
Group CEO
Page 74Page 74
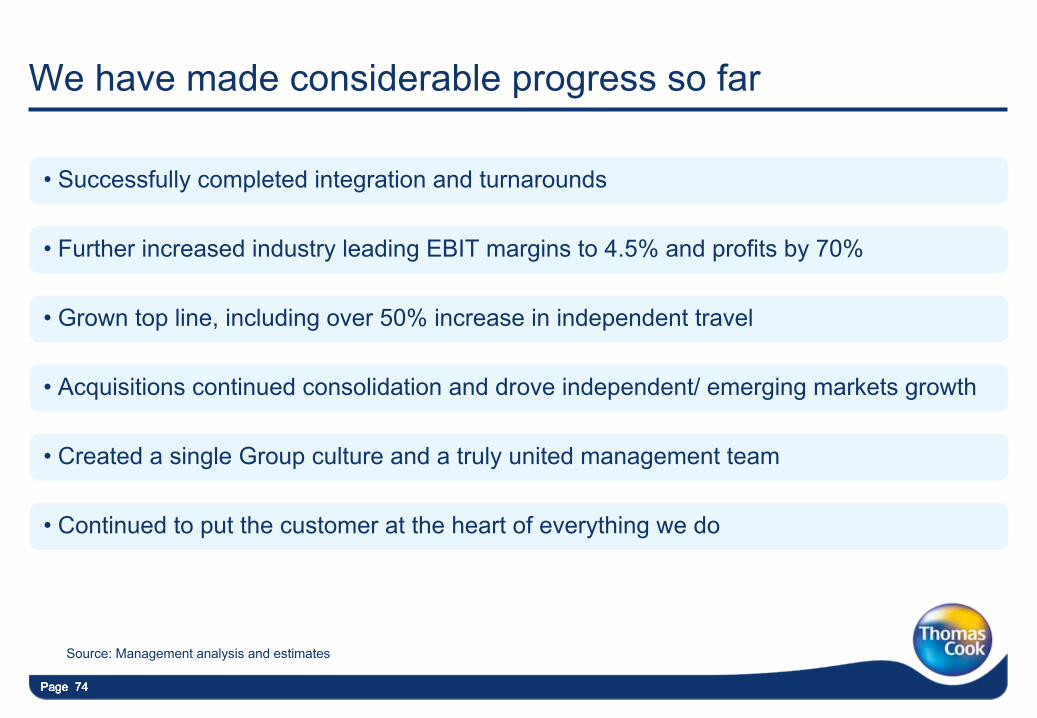
We have made considerable progress so far
Page 74
•
Successfully completed integration and turnarounds
•
Further increased industry leading EBIT margins to 4.5% and profits by 70%
•
Grown top line, including over 50% increase in independent travel
•
Acquisitions continued consolidation and drove independent/ emerging markets growth
•
Created a single Group culture and a truly united management team
•
Continued to put the customer at the heart of everything we do
Source: Management analysis and estimates
Page 75Page 75
We have the strategy, structure, people, brands, scale and ambition to
significantly grow top and bottom lines
Strategy for Growth
Page 77Page 77
What we will cover in this section
•
Key trends in our market place
•
Our strategy for growing top and bottom line
•
Case studies of major strategic initiatives
•
Summary of our medium term growth potential
Page 77
Page 78
Key trends in our market place
Jürgen Büser –
Group Strategy
Director
Page 79Page 79
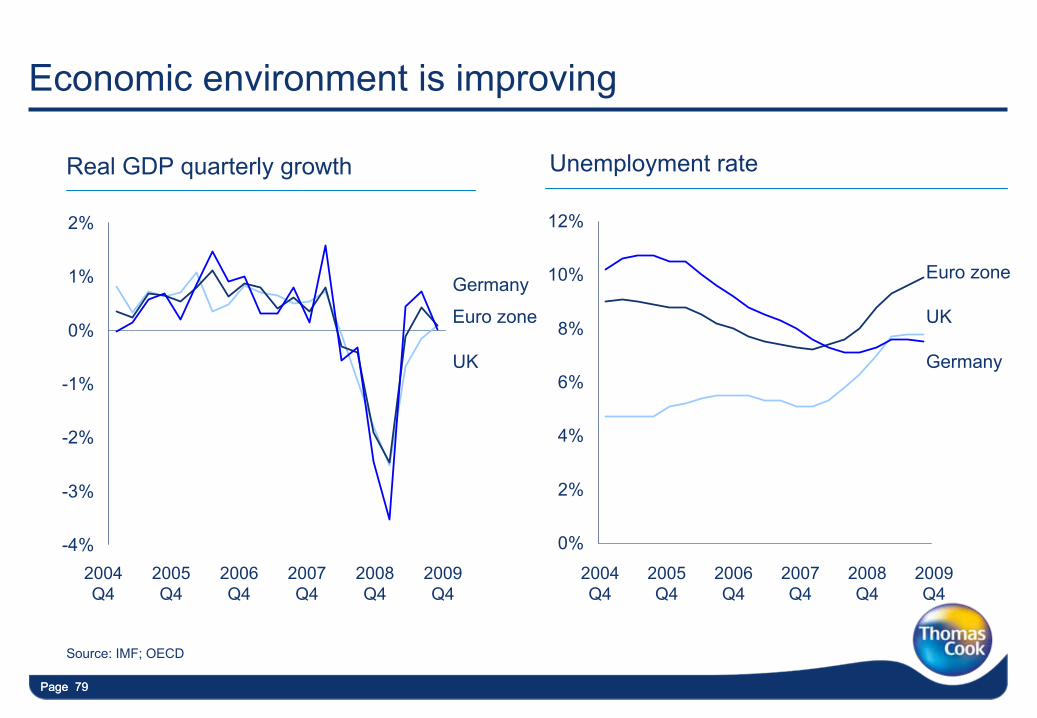
Economic environment is improving
Source: IMF; OECD
Real GDP quarterly growth Unemployment rate
2004 Q4
2005 Q4
2006 Q4
2007 Q4
2008 Q4
2009 Q4
Euro zone
-4%
-3%
-2%
-1%
0%
1%
2%
UK
2004 Q4
2005 Q4
2006 Q4
2007 Q4
2008 Q4
2009 Q4
0%
2%
4%
6%
8%
10%
12%
UK
Euro zone
Germany
Germany
Page 80
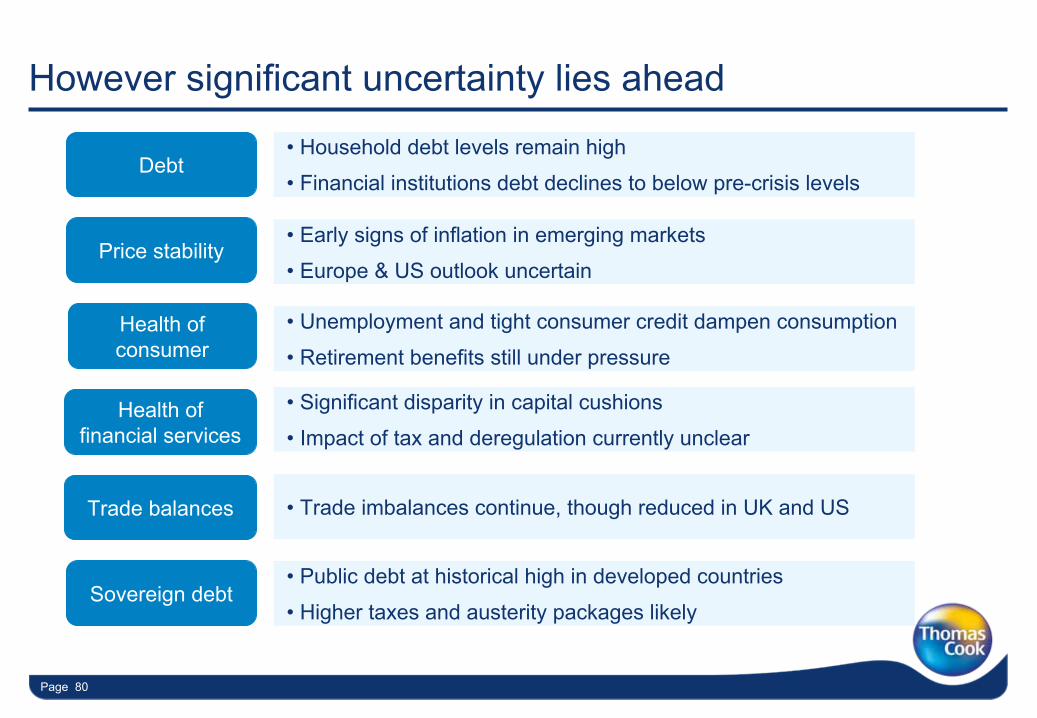
However significant uncertainty lies ahead
Debt
Price stability• Early signs of inflation in emerging markets
• Europe & US outlook uncertain
Health of consumer
• Unemployment and tight consumer credit dampen consumption
• Retirement benefits still under pressure
Health of financial services
• Significant disparity in capital cushions
• Impact of tax and deregulation currently unclear
Trade balances • Trade imbalances continue, though reduced in UK and US
Sovereign debt• Public debt at historical high in developed countries
• Higher taxes and austerity packages likely
• Household debt levels remain high
• Financial institutions debt declines to below pre-crisis levels
Page 81
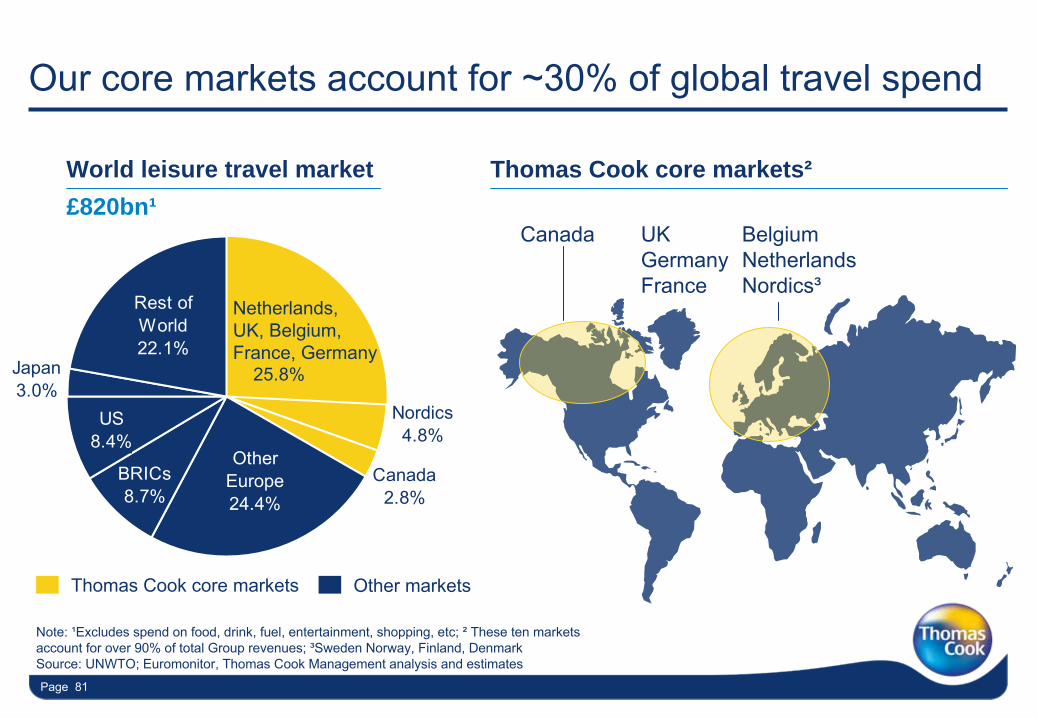
Our core markets account for ~30% of global travel spend
Leisure
CorporateCorporate
Leisure
Leisure
Corporate
Canada UKGermanyFrance
BelgiumNetherlandsNordics³
Note: ¹Excludes spend on food, drink, fuel, entertainment, shopping, etc; ²
These ten markets account for over 90% of total Group revenues; ³Sweden Norway, Finland, DenmarkSource: UNWTO; Euromonitor, Thomas Cook Management analysis and estimates
Thomas Cook core markets²
Japan3.0%
25.8%
Other Europe24.4%
Rest of World22.1%
US8.4%
BRICs8.7%
Canada2.8%
Nordics4.8%
World leisure travel market £820bn¹
Netherlands, UK, Belgium, France, Germany
Thomas Cook core markets Other markets
Page 82Page 82
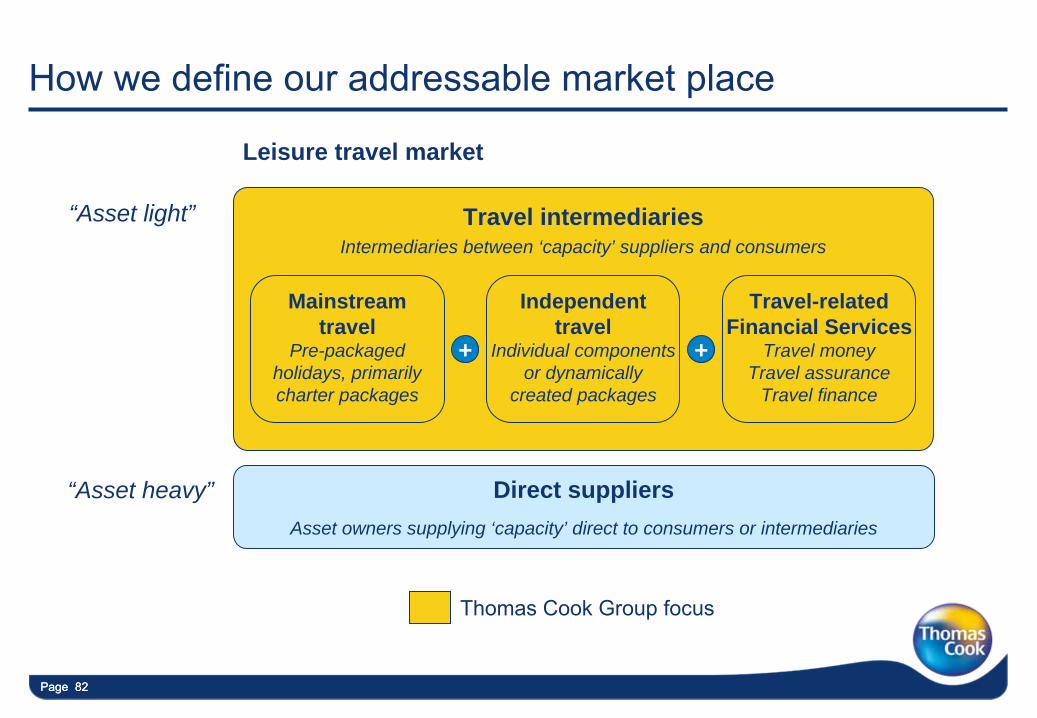
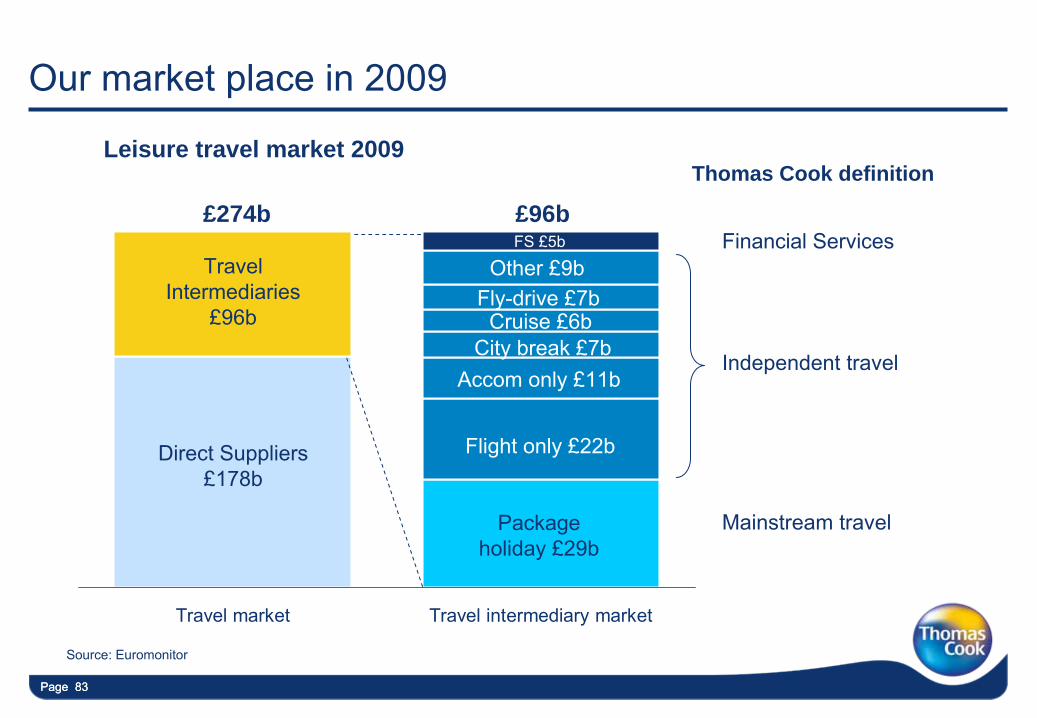
How we define our addressable market place
Thomas Cook Group focus
Travel intermediaries Intermediaries between ‘capacity’ suppliers and consumers
Direct suppliersAsset owners supplying ‘capacity’ direct to consumers or intermediaries
Mainstream travel
Pre-packaged holidays, primarily charter packages
Independent travel
Individual components or dynamically
created packages
Travel-related Financial Services
Travel money Travel assurance
Travel finance
+ +
“Asset light”
“Asset heavy”
Leisure travel market
Page 83Page 83
Leisure travel market 2009
Our market place in 2009
Travel market Travel intermediary market
Mainstream travel
Independent travel
Financial Services£274b £96b
Source: Euromonitor
Thomas Cook definition
Travel
Intermediaries£96b
Direct Suppliers£178b
Other £9bFly-drive £7b
City break £7bAccom
only £11b
Flight only £22b
Cruise £6b
Package holiday £29b
FS £5b
Page 84
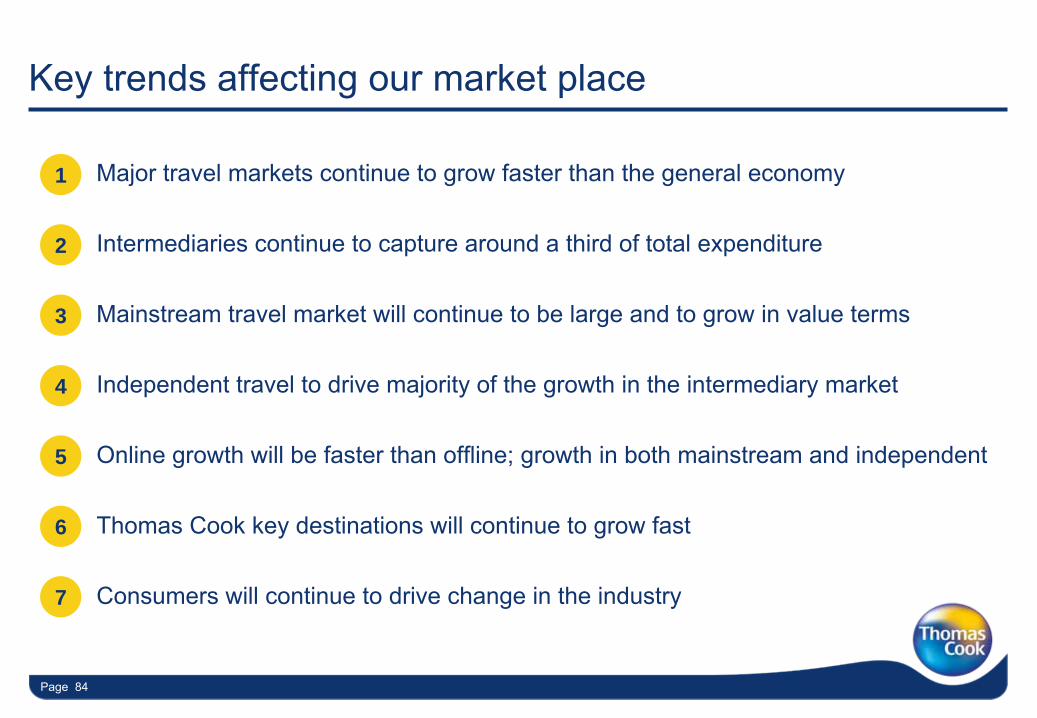
Key trends affecting our market place
Major travel markets continue to grow faster than the general economy
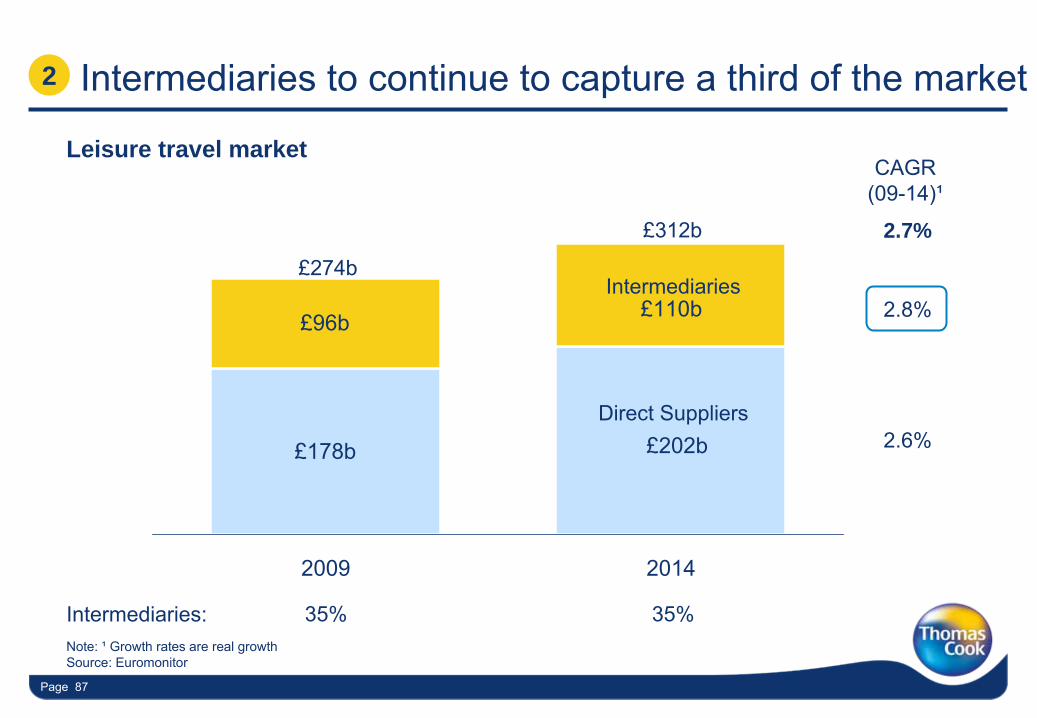
Intermediaries continue to capture around a third of total expenditure
Mainstream travel market will continue to be large and to grow in value terms
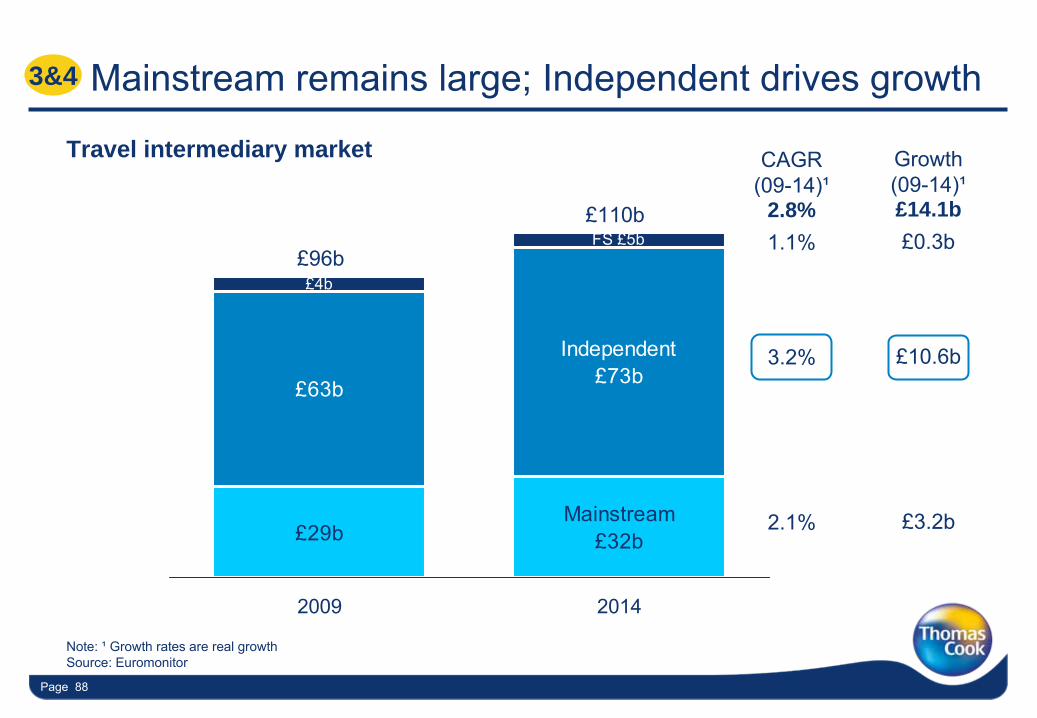
Independent travel to drive majority of the growth in the intermediary market
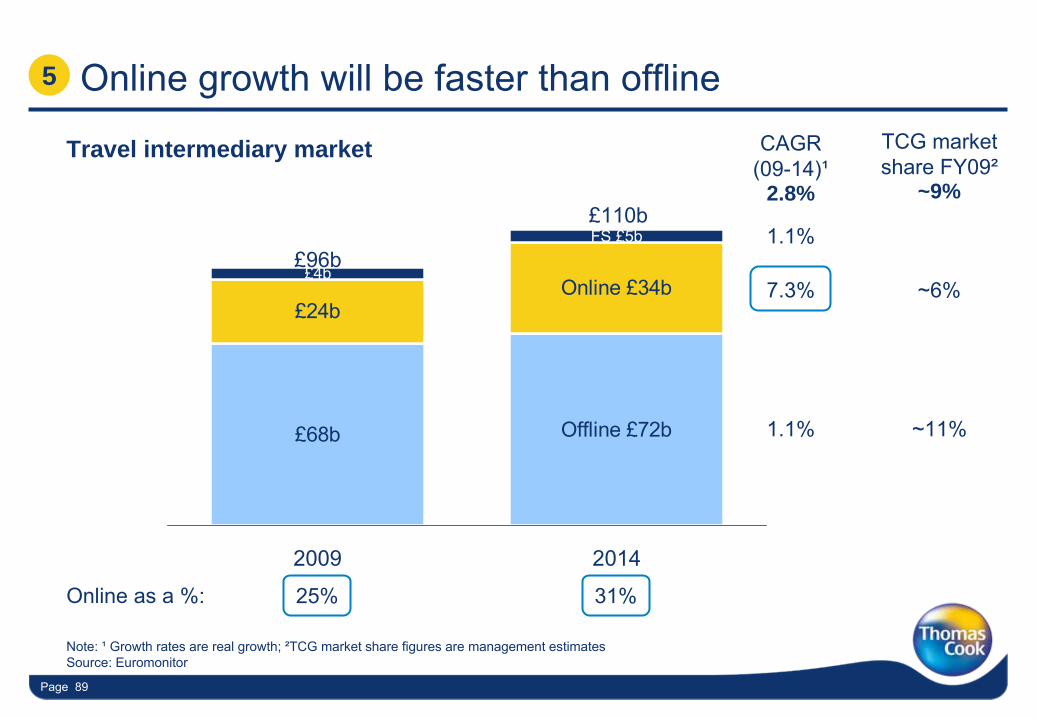
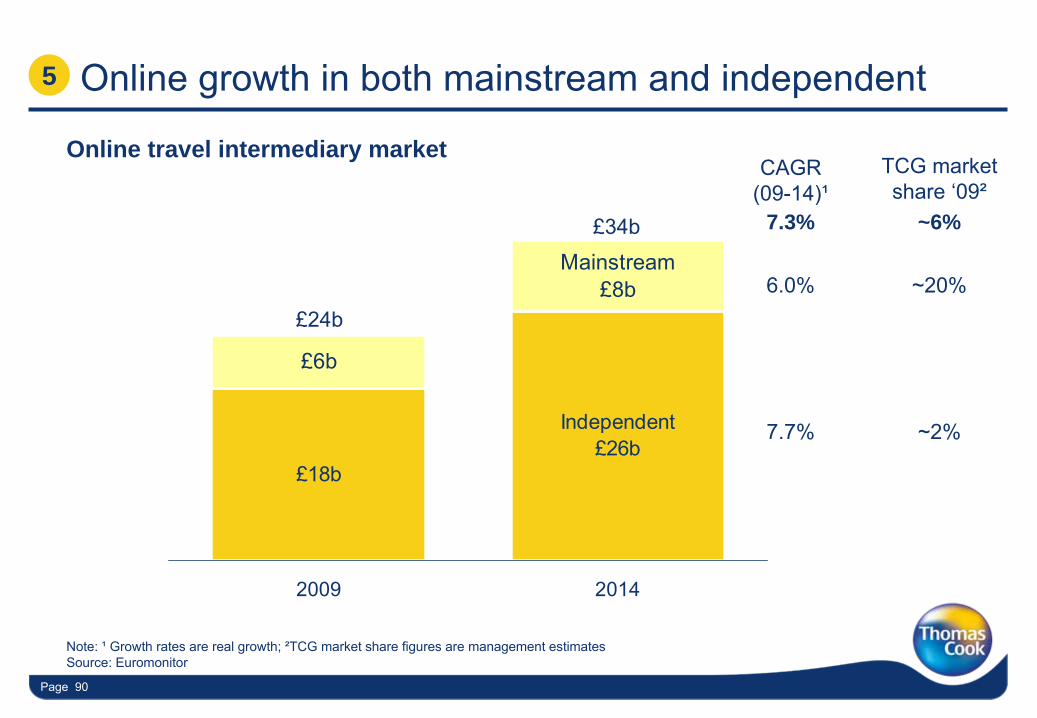
Online growth will be faster than offline; growth in both mainstream and independent
Thomas Cook key destinations will continue to grow fast
Consumers will continue to drive change in the industry
1
2
3
4
5
7
6
Page 85
50
100
150
200
250
300
350
'80 '82 '84 '86 '88 '90 '92 '94 '96 '98 '00 '02 '04 '06 '08
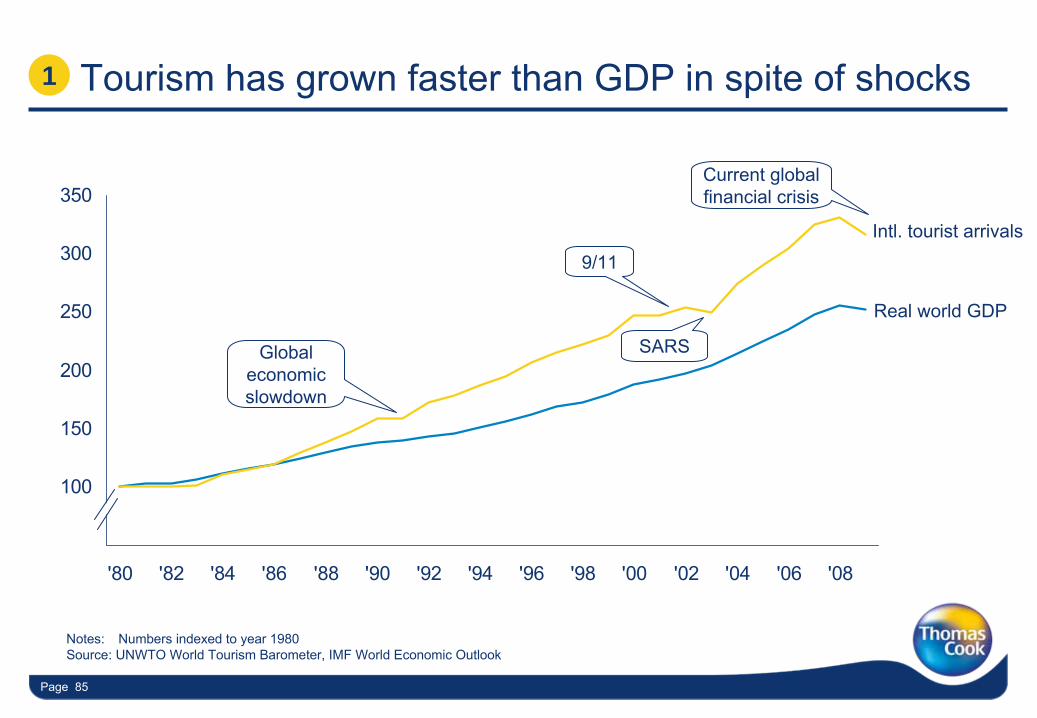
Tourism has grown faster than GDP in spite of shocks
Notes:
Numbers indexed to year 1980Source: UNWTO World Tourism Barometer, IMF World Economic Outlook
Real world GDP
Intl. tourist arrivals
9/11
SARSGlobal economic slowdown
Current global financial crisis
1
Page 86
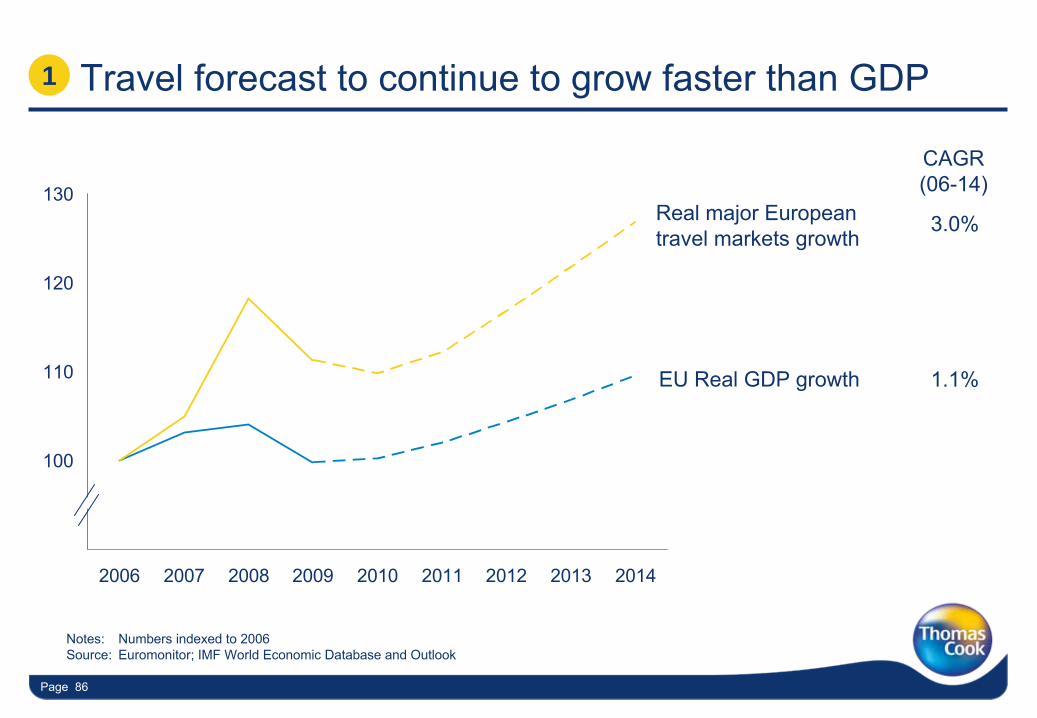
Travel forecast to continue to grow faster than GDP
Notes:
Numbers indexed to 2006Source: Euromonitor; IMF World Economic Database and Outlook
Real major European travel markets growth
EU Real GDP growth
CAGR
(06-14)
3.0%
1.1%
90
100
110
120
130
2006 2007 2008 2009 2010 2011 2012 2013 2014
1
Page 87
£202b£178b
£110b£96b
2009 2014
CAGR(09-14)¹
£274b
Note: ¹
Growth rates are real growthSource: Euromonitor
£312b
2.6%
2.8%
2.7%
Intermediaries: 35% 35%
2
Intermediaries
Direct Suppliers
Intermediaries to continue to capture a third of the market
Leisure travel market
Page 88
Mainstream £32b
Independent £73b
FS £5b
£29b
£63b
£4b
2009 2014
CAGR(09-14)¹
3.2%
£96b
Travel intermediary market
£110b
2.1%
2.8%1.1%
Growth(09-14)¹
£10.6b
£3.2b
£14.1b£0.3b
3&4 Mainstream remains large; Independent drives growth
Note: ¹
Growth rates are real growthSource: Euromonitor
Page 89
Online growth will be faster than offline
Offline £72b
Online £34b
FS £5b
£68b
£24b
£4b
2009 2014
7.3%
Online as a %: 25% 31%
£96b
£110b
1.1%
2.8%
1.1%
TCG market share FY09²
~6%
~11%
5
~9%
CAGR(09-14)¹
Travel intermediary market
Note: ¹
Growth rates are real growth; ²TCG market share figures are management estimatesSource: Euromonitor
Page 90
Online growth in both mainstream and independent
Independent £26b
Mainstream £8b
£18b
£6b
2009 2014
6.0%£24b
£34b
7.7%
7.3%
~20%
~2%
5
~6%
TCG market share ‘09²
CAGR(09-14)¹
Online travel intermediary market
Note: ¹
Growth rates are real growth; ²TCG market share figures are management estimatesSource: Euromonitor
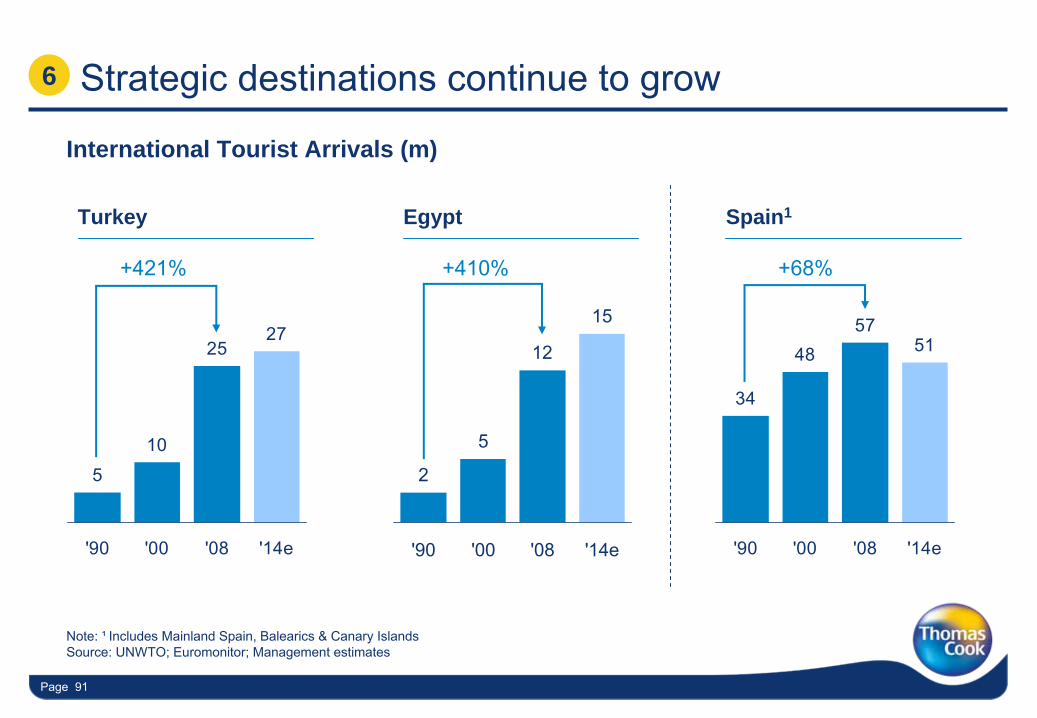
Page 91
5
10
2527
'90 '00 '08 '14e
2
5
12
15
'90 '00 '08 '14e
Turkey Egypt
+421% +410%
Strategic destinations continue to grow
Note: ¹
Includes Mainland Spain, Balearics & Canary IslandsSource: UNWTO; Euromonitor; Management estimates
6
International Tourist Arrivals (m)
34
4857
51
'90 '00 '08 '14e
Spain1
+68%
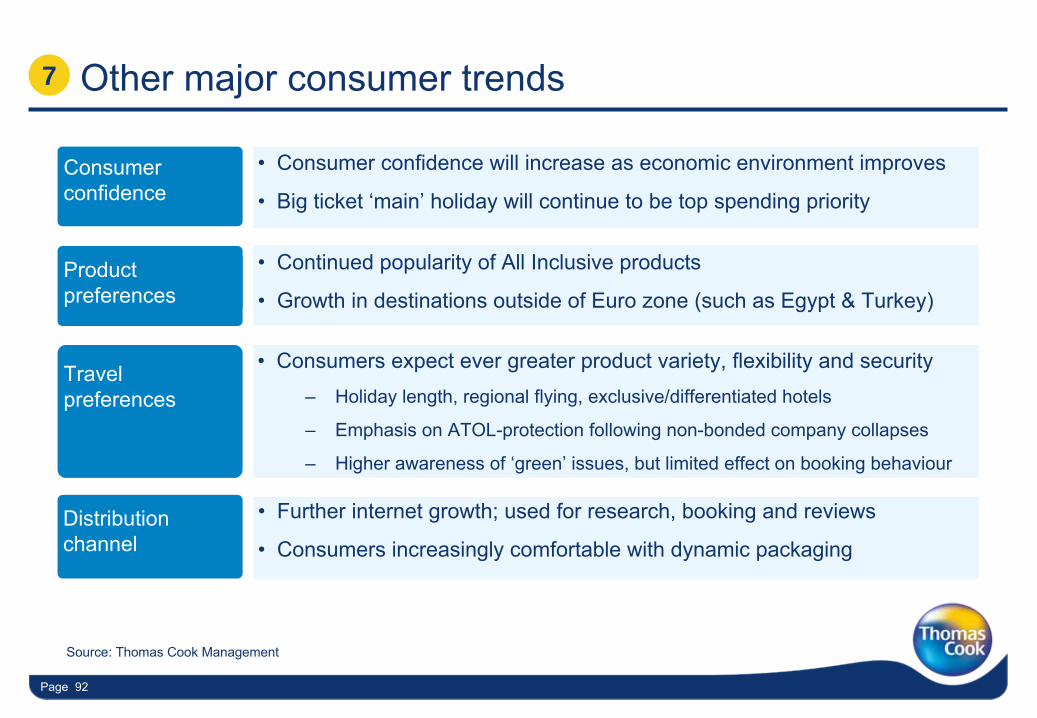
Page 92
Other major consumer trends7
•
Further internet growth; used for research, booking and reviews
•
Consumers increasingly comfortable with dynamic packagingDistribution
channel
•
Consumers expect ever greater product variety, flexibility and security–
Holiday length, regional flying, exclusive/differentiated hotels
–
Emphasis on ATOL-protection following non-bonded company collapses
–
Higher awareness of ‘green’
issues, but limited effect on booking behaviour
Travel preferences
•
Consumer confidence will increase as economic environment improves
•
Big ticket ‘main’
holiday will continue to be top spending priorityConsumer confidence
•
Continued popularity of All Inclusive products
•
Growth in destinations outside of Euro zone (such as Egypt & Turkey)Product preferences
Source: Thomas Cook Management
Page 93
In summary, implications for Thomas Cook
•
Overall travel markets to return to growth, although economy may
impact short term
•
Mainstream travel stable in passenger terms, but growing in value
•
Strong growth in independent travel
•
Considerable growth in online distribution–
Mainstream growth enhanced by channel shift from offline to online
–
Independent growth from channel shift and OTA market share gain
•
Continued growth in medium haul destinations, All Inclusive and 4/5*
Thomas Cook strategy addresses all these points
Page 94
Medium Term Growth Strategy
Paul Hollingworth –
Group CFO
Page 95Page 95
Observations
•
Operations –
large complex business focused on the customer
•
People –
wealth and depth of experience
•
Finance –
renewed focus on cash management
•
Corporate –
fairly new to public company life
•
Open to change –
ambitious change programme; sign of greater organisational maturity
Lots of energy, lots to do, lots of opportunity
Page 96
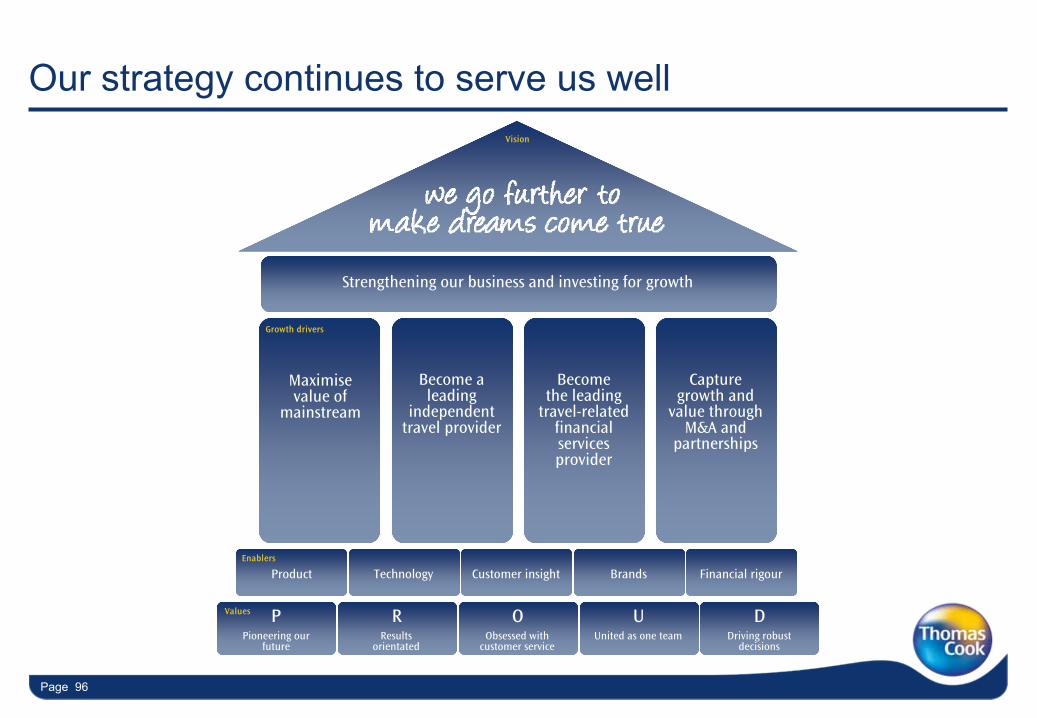
Our strategy continues to serve us well
Strategic objectives
Strengthening our business and investing for growth
Financial rigourBrandsCustomer insightTechnology
Results orientated
Obsessed with customer service
United as one team Driving robust decisions
Pioneering our future
Values
ProductEnablers
Become a leading
independent travel provider
Become the leading
travel-related financial services provider
Capture growth and
value through M&A and
partnerships
Maximisevalue of
mainstream
Growth drivers
Vision
P R O U D
Page 97
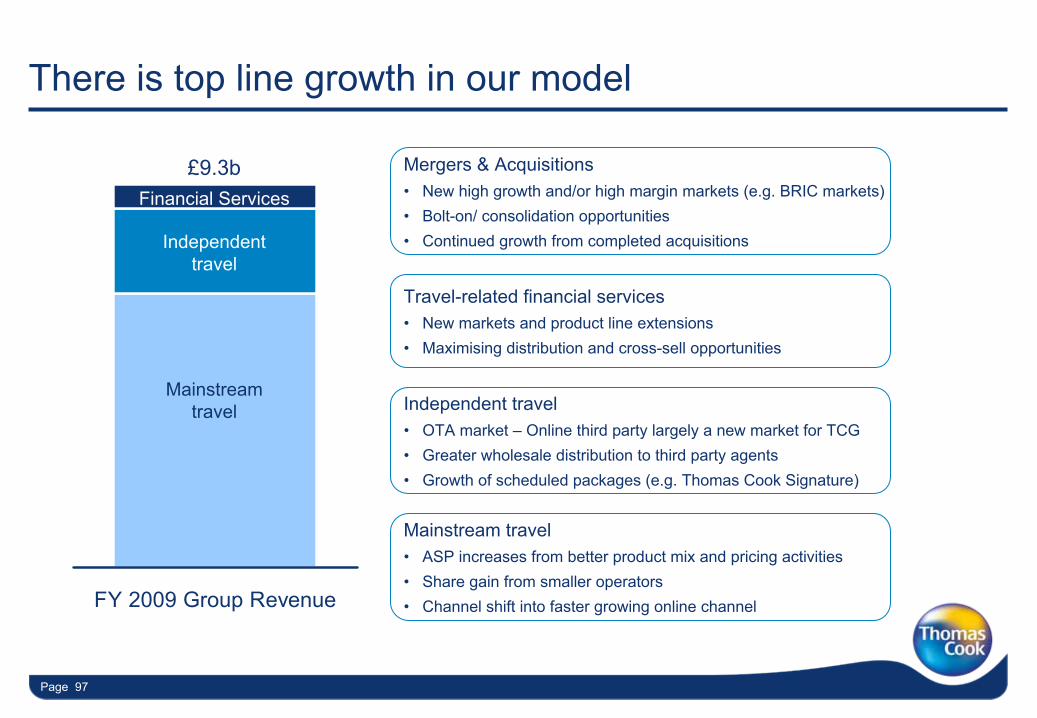
There is top line growth in our model
FY 2009 Group Revenue
£9.3b
Mainstream
travel
Independent
travel
Financial Services
Mergers & Acquisitions•
New high growth and/or high margin markets (e.g. BRIC markets)•
Bolt-on/ consolidation opportunities•
Continued growth from completed acquisitions
Travel-related financial services•
New markets and product line extensions•
Maximising distribution and cross-sell opportunities
Independent travel•
OTA market –
Online third party largely a new market for TCG•
Greater wholesale distribution to third party agents•
Growth of scheduled packages (e.g. Thomas Cook Signature)
Mainstream travel•
ASP increases from better product mix and pricing activities•
Share gain from smaller operators•
Channel shift into faster growing online channel
Page 98
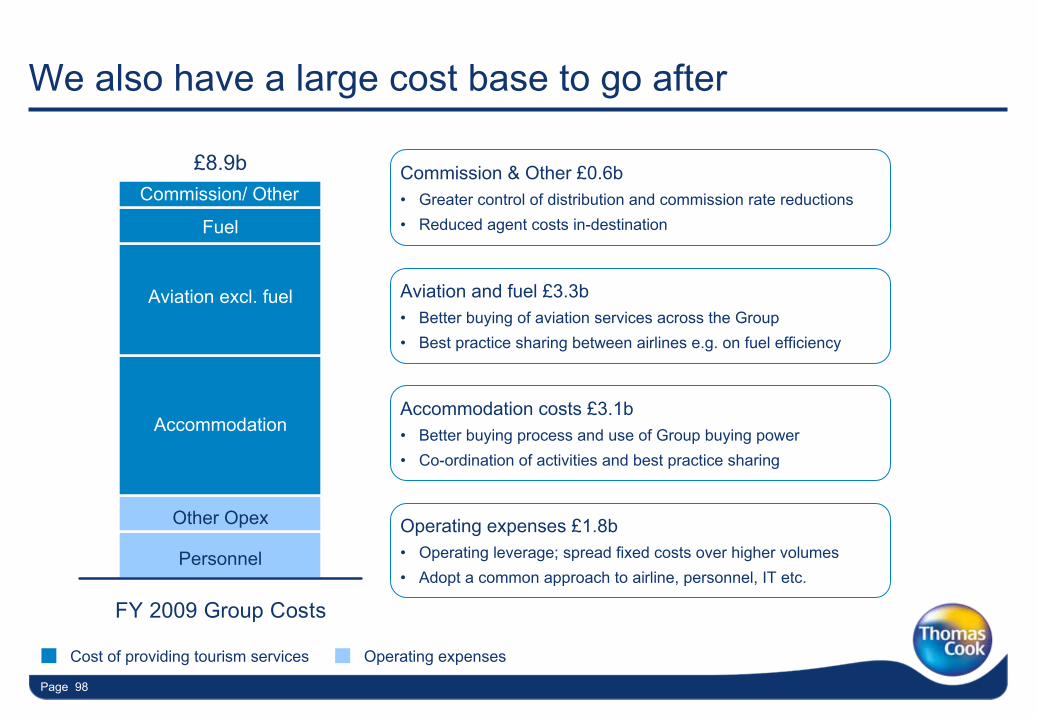
We also have a large cost base to go after
Cost of providing tourism services Operating expenses
FY 2009 Group Costs
£8.9b
Other Opex
Accommodation
Personnel
Aviation excl. fuel
Fuel
Commission/ OtherCommission & Other £0.6b•
Greater control of distribution and commission rate reductions•
Reduced agent costs in-destination
Aviation and fuel £3.3b•
Better buying of aviation services across the Group•
Best practice sharing between airlines e.g. on fuel efficiency
Accommodation costs £3.1b•
Better buying process and use of Group buying power•
Co-ordination of activities and best practice sharing
Operating expenses £1.8b•
Operating leverage; spread fixed costs over higher volumes•
Adopt a common approach to airline, personnel, IT etc.
Page 99
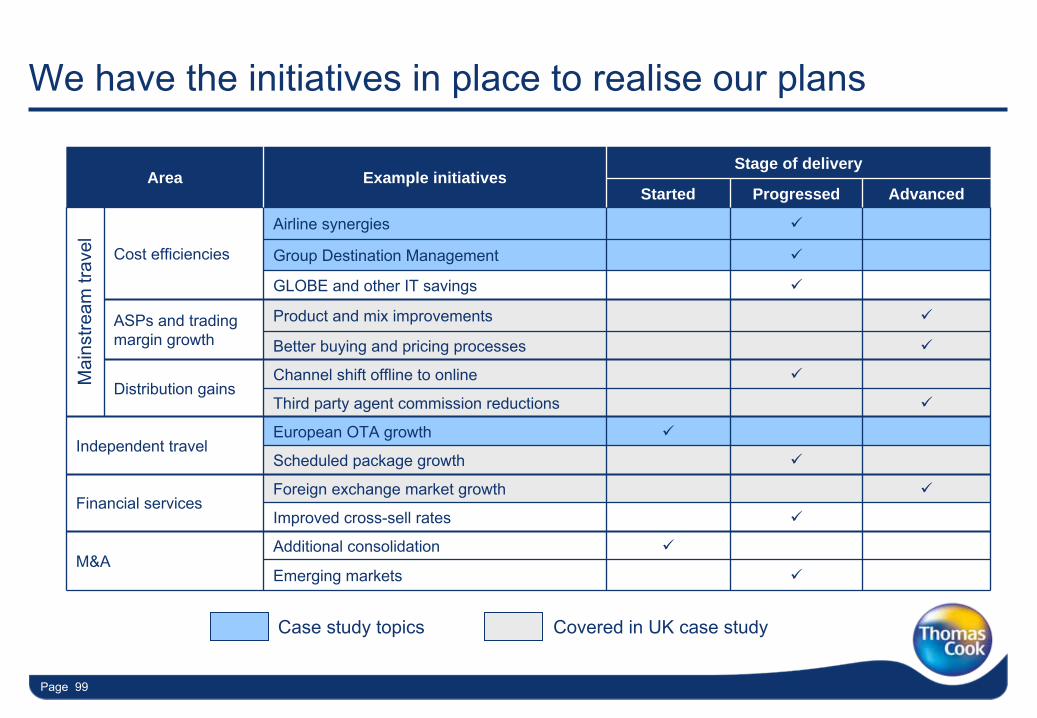
We have the initiatives in place to realise our plans
Area Example initiativesStage of delivery
Started Progressed Advanced
Cost efficiencies
Airline synergies
Group Destination Management
GLOBE and other IT savings
ASPs and trading margin growth
Product and mix improvements
Better buying and pricing processes
Distribution gainsChannel shift offline to online
Third party agent commission reductions
Independent travelEuropean OTA growth
Scheduled package growth
Financial servicesForeign exchange market growth
Improved cross-sell rates
M&AAdditional consolidation
Emerging markets
Case study topics
Mai
nstre
am tr
avel
Covered in UK case study
Page 100
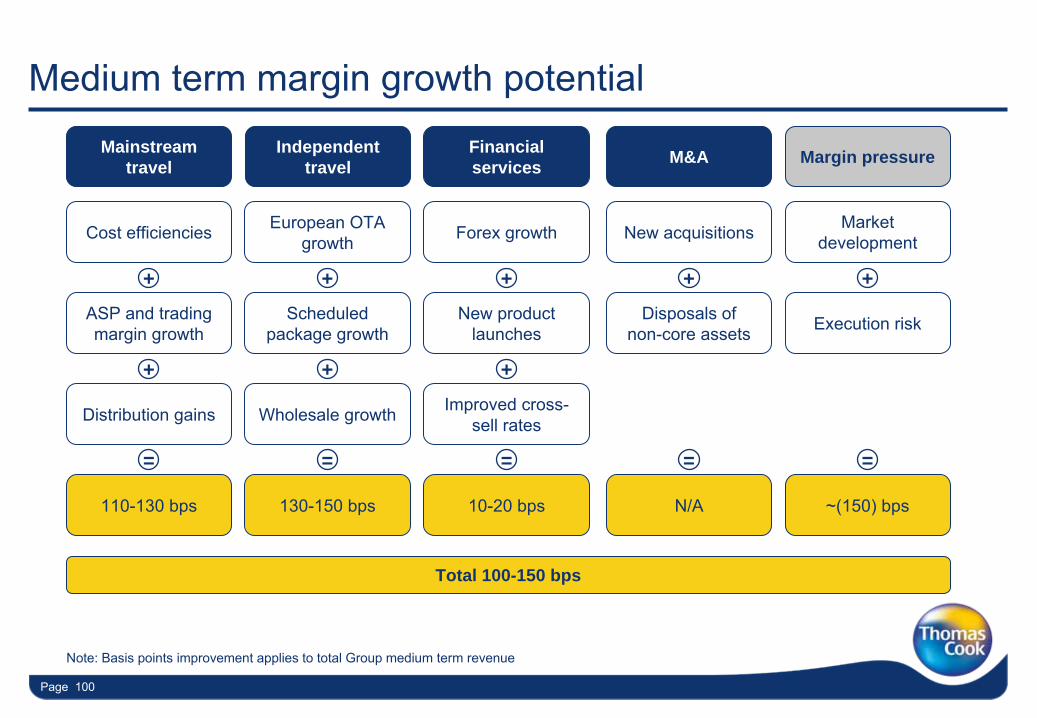
Medium term margin growth potential
+ + +
Total 100-150 bps
+ + + + +
= = = = =
110-130 bps 130-150 bps 10-20 bps N/A ~(150) bps
Mainstream travel
Independent travel
Financial services M&A Margin pressure
Cost efficiencies European OTA growth Forex growth Market
developmentNew acquisitions
Distribution gains Improved cross-
sell ratesWholesale growth
ASP and trading margin growth
New product launches Execution riskScheduled
package growthDisposals of
non-core assets
Note: Basis points improvement applies to total Group medium term revenue
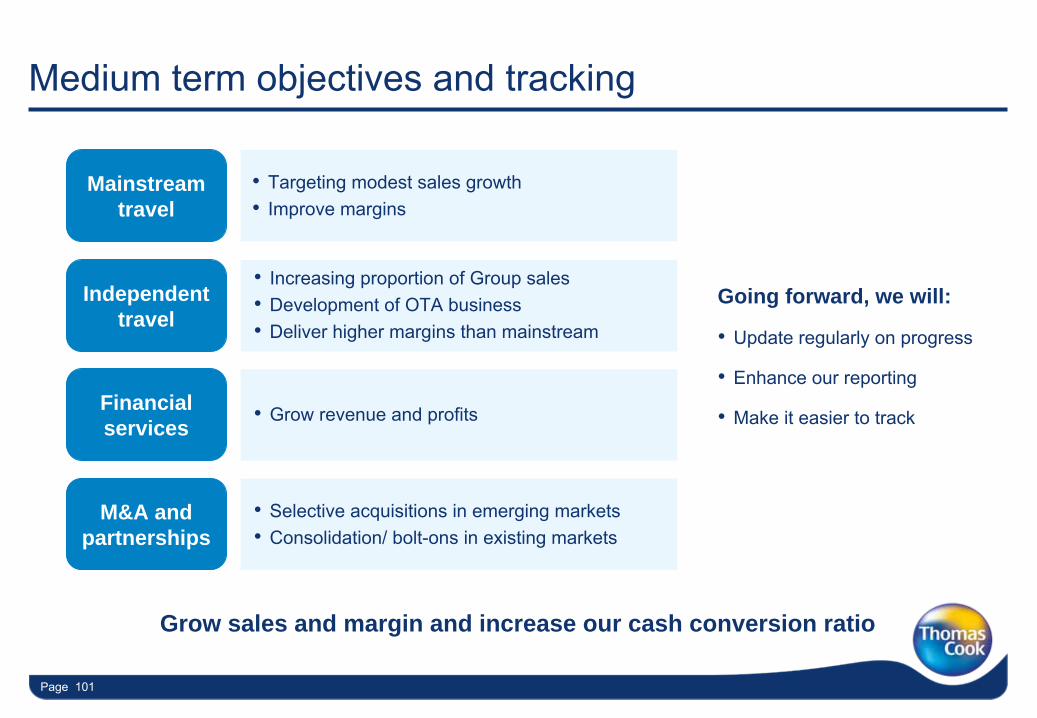
Page 101
•
Increasing proportion of Group sales•
Development of OTA business
•
Deliver higher margins than mainstream
Mainstream travel
M&A and partnerships
Independent travel
Financial services
•
Targeting modest sales growth•
Improve margins
•
Selective acquisitions in emerging markets•
Consolidation/ bolt-ons
in existing markets
•
Grow revenue and profits
Going forward, we will:
•
Update regularly on progress
•
Enhance our reporting
•
Make it easier to track
Grow sales and margin and increase our cash conversion ratio
Medium term objectives and tracking
Page 102Page 102
M&A continues to be part of our strategy
•
Capture growth and value
–
Maximise value in current business
–
New initiatives in existing markets
–
Entry in other emerging markets
Page 103Page 103
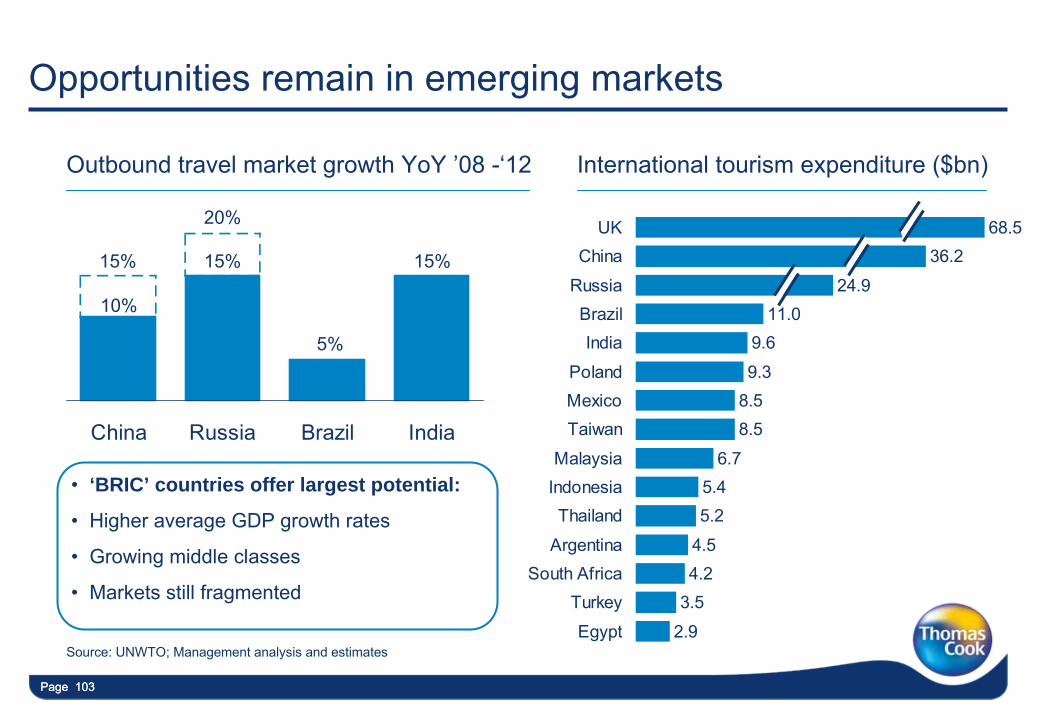
China Russia Brazil India
Opportunities remain in emerging markets
Outbound travel market growth YoY
’08 -‘12 International tourism expenditure ($bn)
2.9
3.54.24.5
5.25.4
6.7
8.58.59.3
9.611.0
68.536.2
24.9
Egypt
TurkeySouth Africa
Argentina
ThailandIndonesiaMalaysia
TaiwanMexicoPoland
IndiaBrazil
Russia
ChinaUK
10%
15% 15%
20%
5%
15%
•
‘BRIC’ countries offer largest potential:
•
Higher average GDP growth rates
•
Growing middle classes
•
Markets still fragmented
Source: UNWTO; Management analysis and estimates
Page 104Page 104
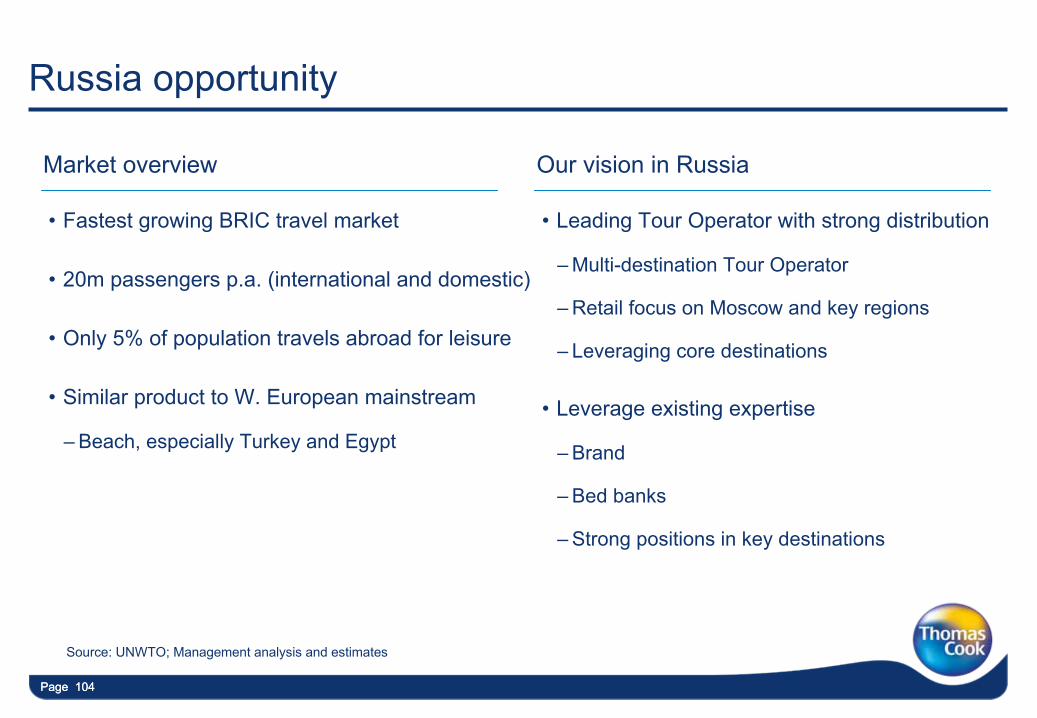
Russia opportunity
•
Fastest growing BRIC travel market
•
20m passengers p.a. (international and domestic)
•
Only 5% of population travels abroad for leisure
•
Similar product to W. European mainstream
–
Beach, especially Turkey and Egypt
Sources: Russian Federal Tourism Agency, expert estimates
Market overview
•
Leading Tour Operator with strong distribution
–
Multi-destination Tour Operator
–
Retail focus on Moscow and key regions
–
Leveraging core destinations
•
Leverage existing expertise
–
Brand
–
Bed banks
–
Strong positions in key destinations
Our vision in Russia
Source: UNWTO; Management analysis and estimates
Page 105Page 105
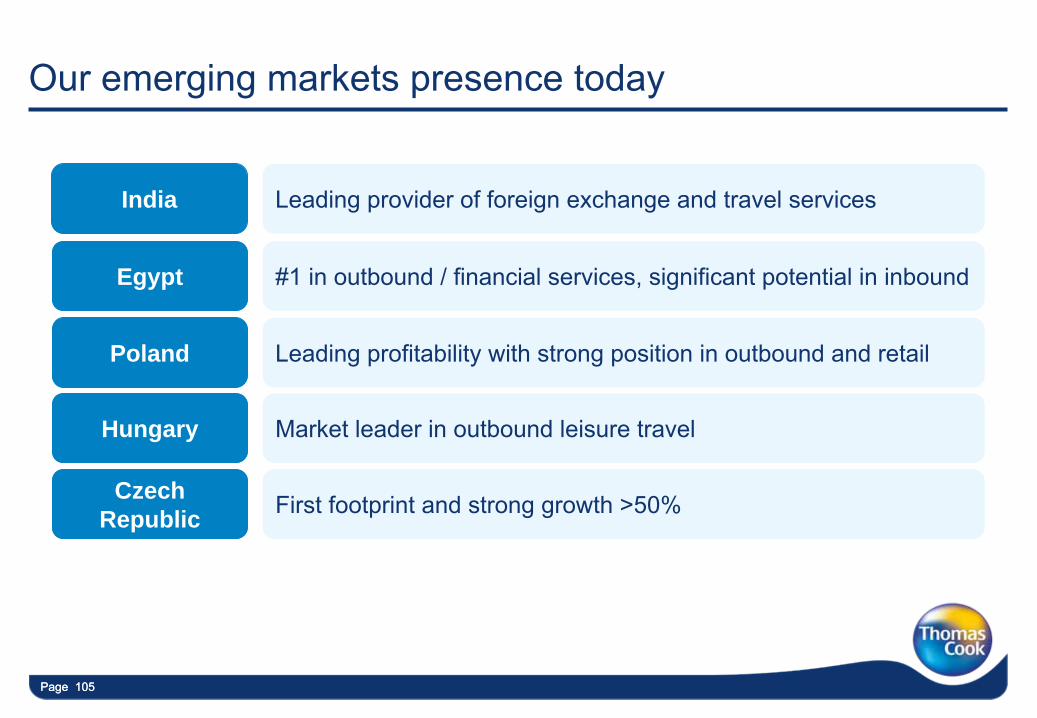
Leading provider of foreign exchange and travel services
#1 in outbound / financial services, significant potential in inbound
Leading profitability with strong position in outbound and retail
Market leader in outbound leisure travel
First footprint and strong growth >50%
Our emerging markets presence today
India
Egypt
Poland
Hungary
Czech Republic
Page 106Page 106
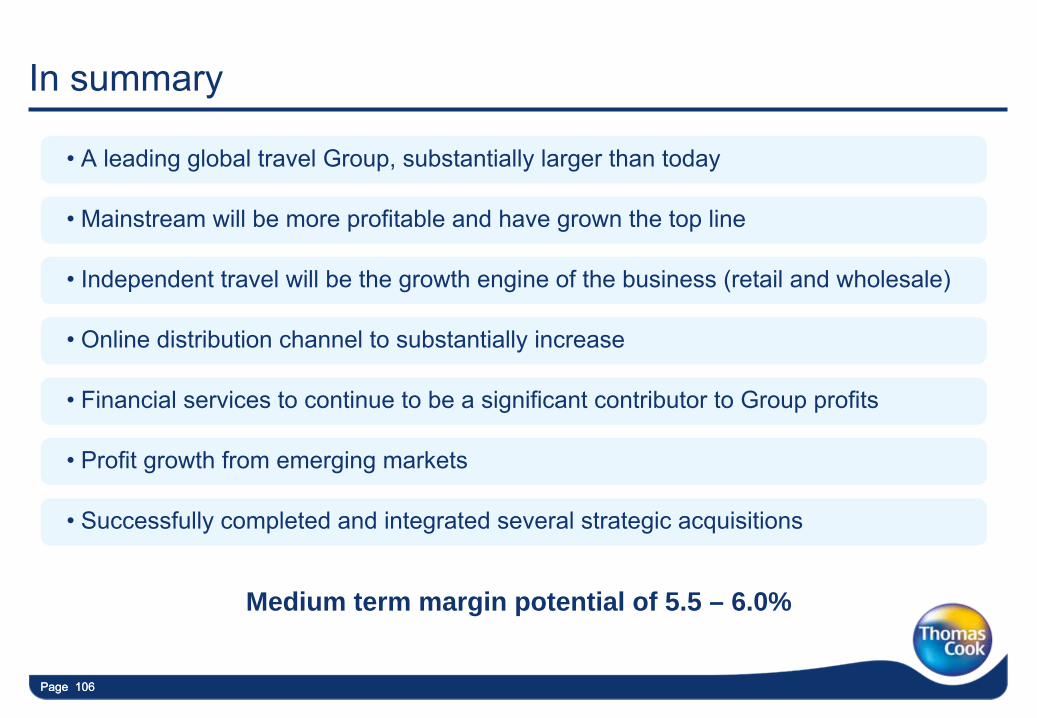
In summary
•
A leading global travel Group, substantially larger than today
•
Mainstream will be more profitable and have grown the top line
•
Independent travel will be the growth engine of the business (retail and wholesale)
•
Online distribution channel to substantially increase
•
Financial services to continue to be a significant contributor to Group profits
•
Profit growth from emerging markets
•
Successfully completed and integrated several strategic acquisitions
Medium term margin potential of 5.5 – 6.0%

Page 107
Refreshments
Page 108Page 108
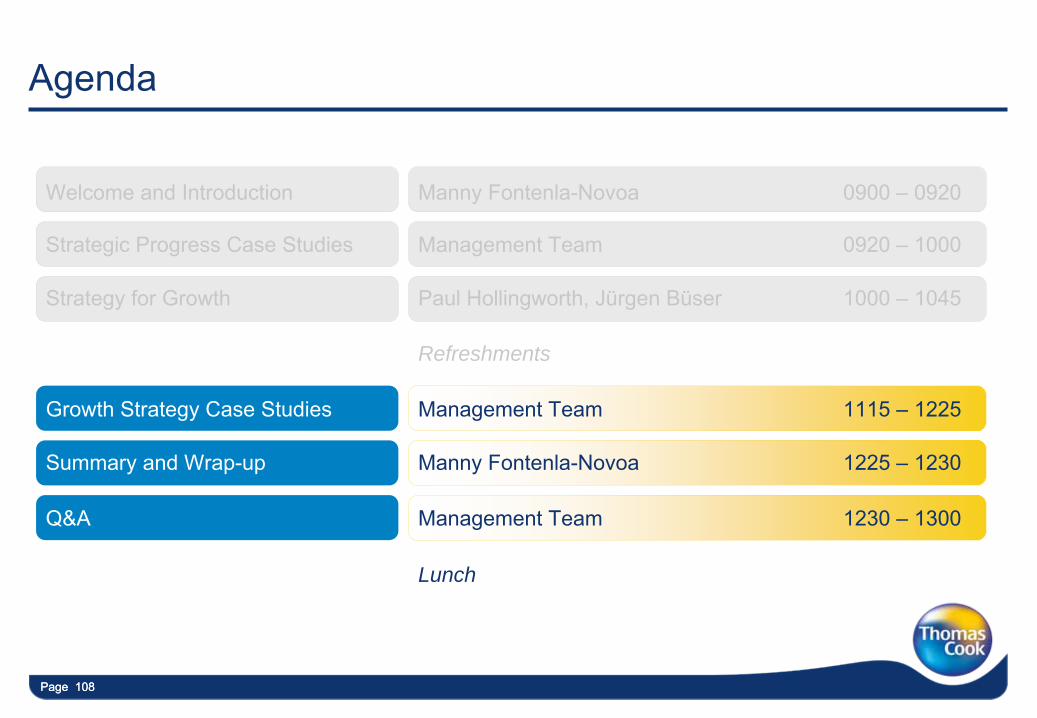
Agenda
Welcome and Introduction Manny Fontenla-Novoa 0900 –
0920
Strategic Progress Case Studies Management Team 0920 –
1000
Strategy for Growth Paul Hollingworth, Jürgen Büser 1000 –
1045
Refreshments
Growth Strategy Case Studies Management Team 1115 –
1225
Summary and Wrap-up Manny Fontenla-Novoa 1225 –
1230
Q&A Management Team 1230 –
1300
Lunch
Growth strategy case studies
Page 110Page 110
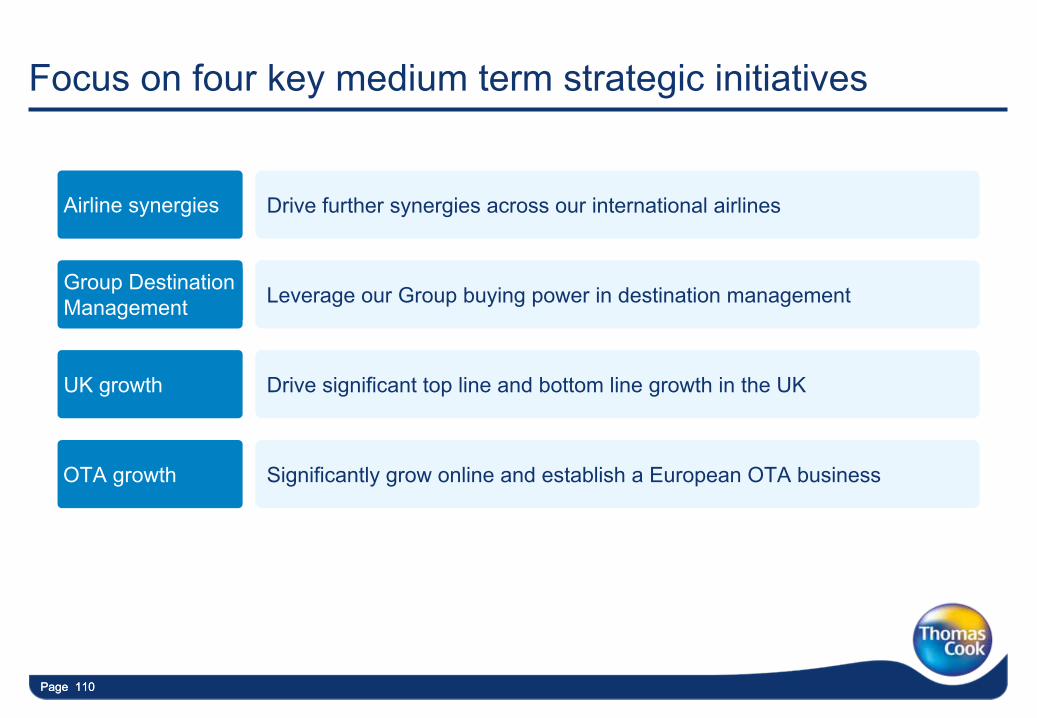
Significantly grow online and establish a European OTA businessOTA growth
Focus on four key medium term strategic initiatives
Drive significant top line and bottom line growth in the UKUK growth
Drive further synergies across our international airlinesAirline synergies
Leverage our Group buying power in destination managementGroup Destination Management
Page 111
Drive further synergies across our international airlines
Ralf Teckentrup –
CEO Airlines Germany
Page 112
Airline synergies objectives
Note: Majority of benefits are in mainstream, although seat-only business part of independent
•
Reduce overall costs of Group airlines through:
– Better Group-wide coordination
– Greater use of Group buying power
– Best practice sharing
– Working more closely together
Page 113Page 113
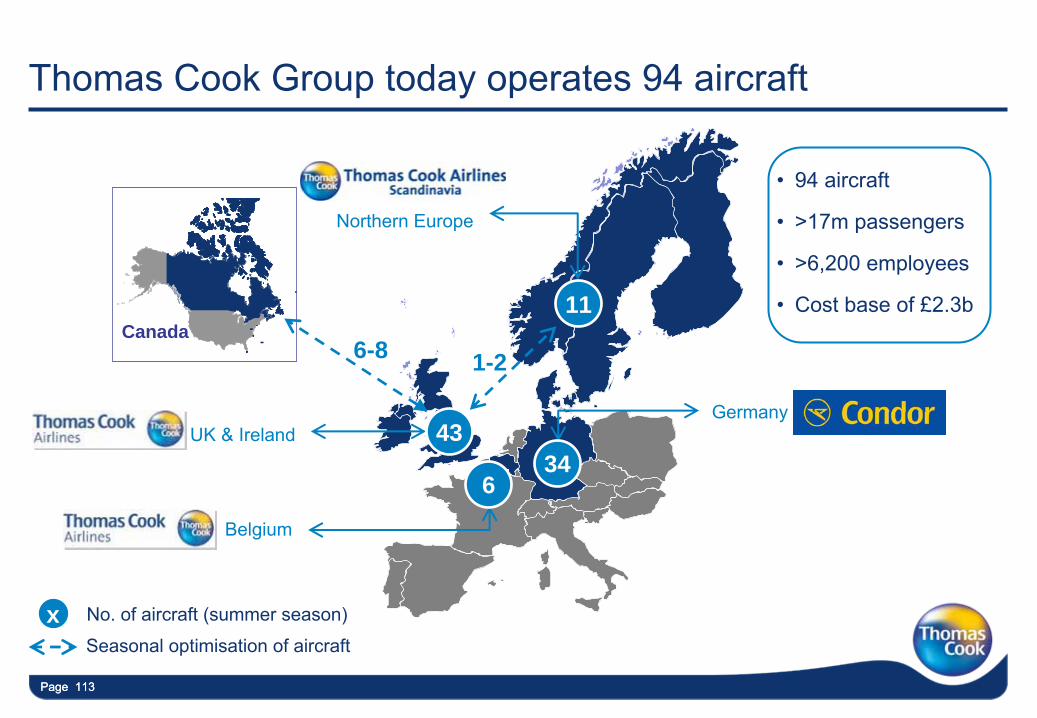
Thomas Cook Group today operates 94 aircraft
No. of aircraft (summer season)
Northern Europe
UK & IrelandGermany
Belgium
Canada6-8 1-2
Seasonal optimisation of aircraft
•
94 aircraft
•
>17m passengers
•
>6,200 employees
•
Cost base of £2.3b11
3443
6
x
Page 114Page 114
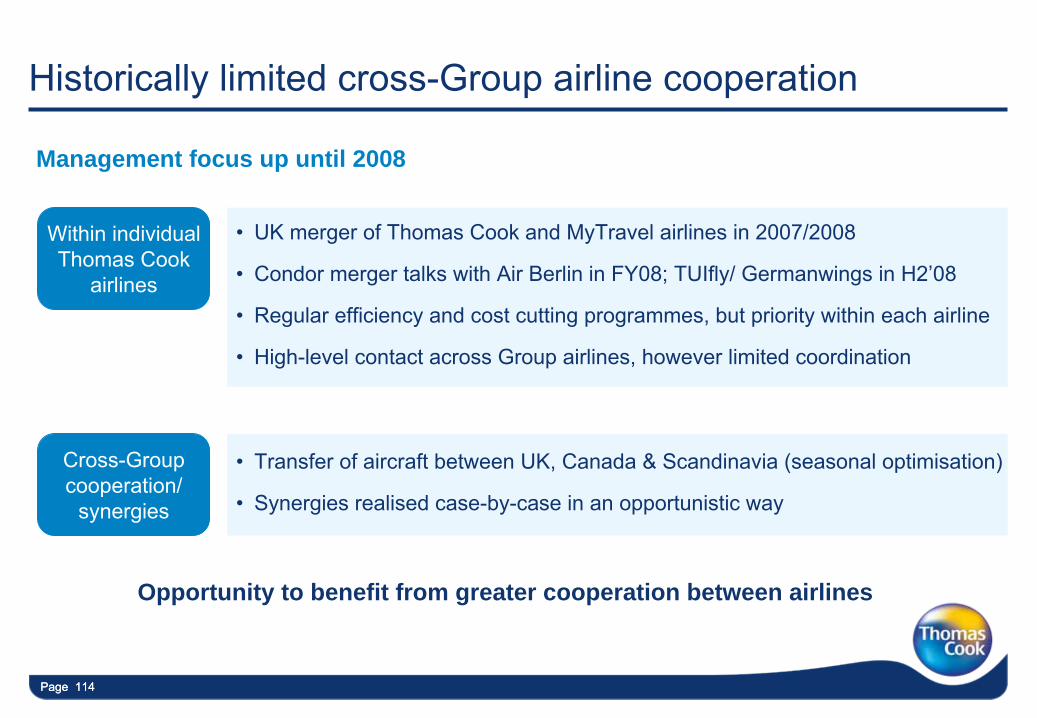
•
UK merger of Thomas Cook and MyTravel airlines in 2007/2008
•
Condor merger talks with Air Berlin in FY08; TUIfly/ Germanwings
in H2’08
•
Regular efficiency and cost cutting programmes, but priority within each airline
•
High-level contact across Group airlines, however limited coordination
•
Transfer of aircraft between UK, Canada & Scandinavia (seasonal optimisation)
•
Synergies realised case-by-case in an opportunistic way
Historically limited cross-Group airline cooperation
Within individual
Thomas Cook
airlines
Cross-Group cooperation/
synergies
Management focus up until 2008
Opportunity to benefit from greater cooperation between airlines
Page 115Page 115
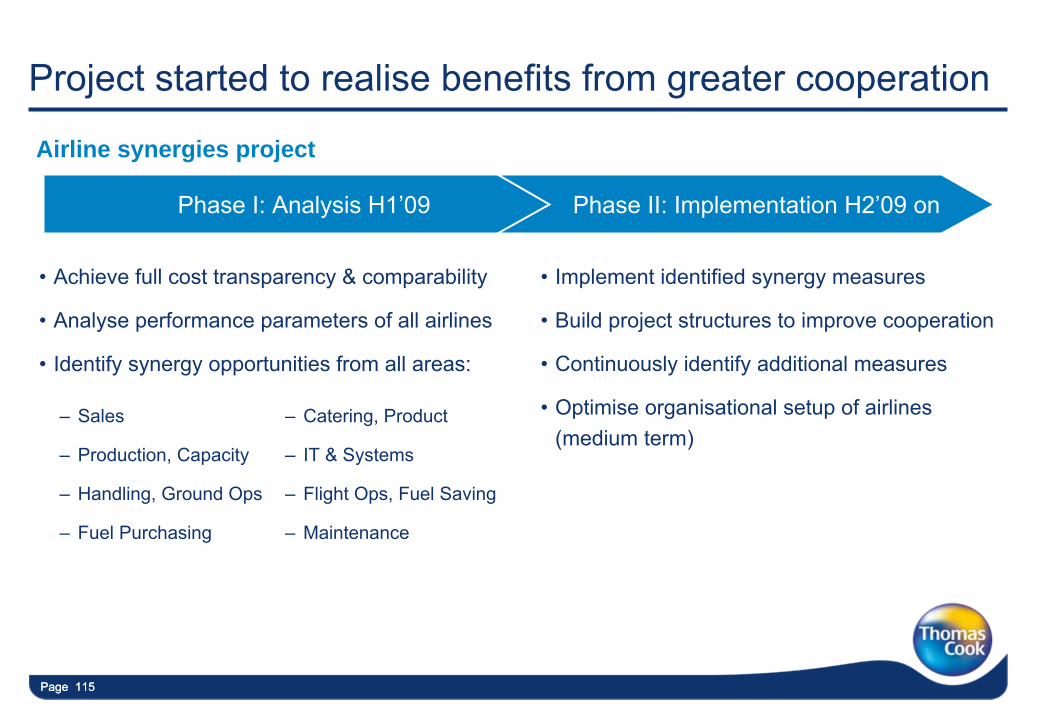
Project started to realise benefits from greater cooperation
•
Implement identified synergy measures
•
Build project structures to improve cooperation
•
Continuously identify additional measures
•
Optimise organisational setup of airlines (medium term)
•
Achieve full cost transparency & comparability
•
Analyse performance parameters of all airlines
•
Identify synergy opportunities from all areas:
–
Sales
–
Production, Capacity
–
Handling, Ground Ops
–
Fuel Purchasing
–
Catering, Product
–
IT & Systems
–
Flight Ops, Fuel Saving
–
Maintenance
Phase I: Analysis H1’09 Phase II: Implementation H2’09 on
Airline synergies project
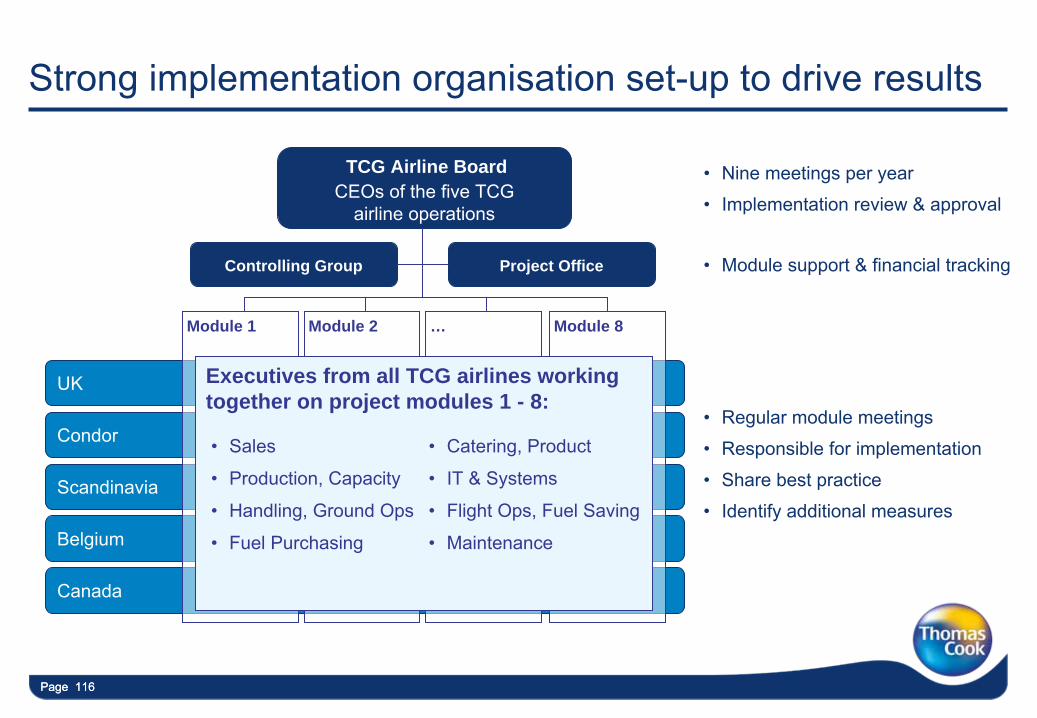
Page 116Page 116
UK
Condor
Scandinavia
Belgium
Canada
Project OfficeControlling Group
Module 1 Module 2 … Module 8
Executives from all TCG airlines working together on project modules 1 - 8:
TCG Airline Board
•
Sales
•
Production, Capacity
•
Handling, Ground Ops
•
Fuel Purchasing
•
Catering, Product
•
IT & Systems
•
Flight Ops, Fuel Saving
•
Maintenance
•
Nine meetings per year
•
Implementation review & approval
•
Module support & financial tracking
•
Regular module meetings
•
Responsible for implementation
•
Share best practice
•
Identify additional measures
CEOs
of the five TCG airline operations
Strong implementation organisation set-up to drive results
Page 117Page 117
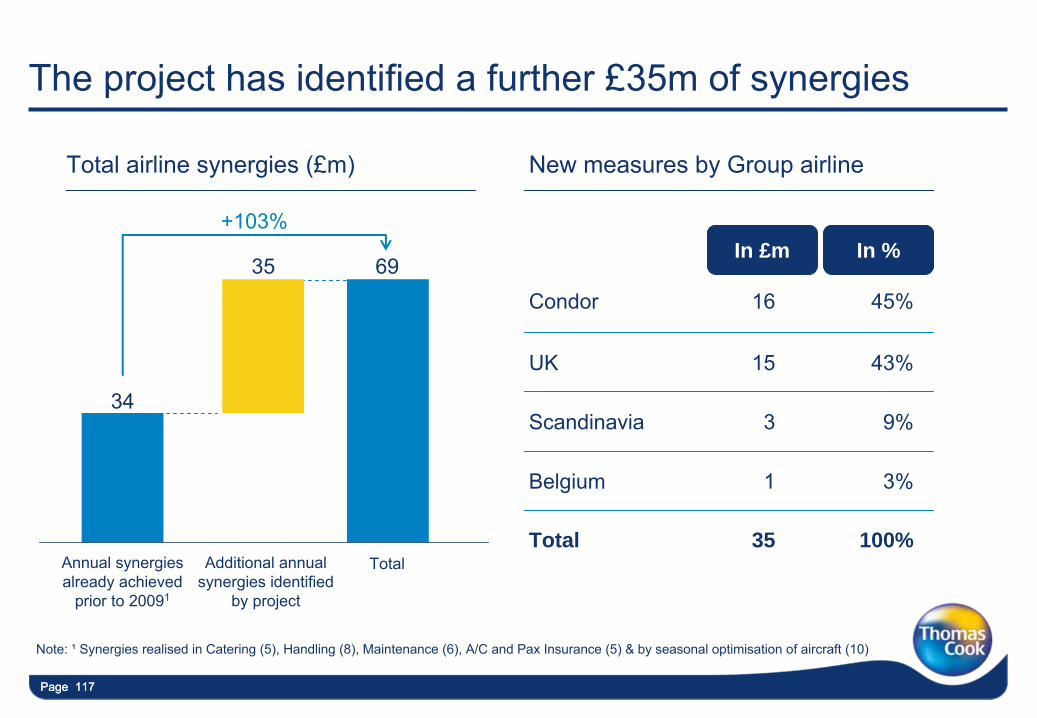
UK 15 43%
Condor 16 45%
The project has identified a further £35m of synergies
34
Annual synergies already achieved
prior to 20091
35
Additional annual synergies identified
by project
69
Total
+103%
Note: ¹
Synergies realised in Catering (5), Handling (8), Maintenance (6), A/C and Pax
Insurance (5) & by seasonal optimisation of aircraft (10)
Scandinavia
Belgium
3
1
35
9%
3%
Total airline synergies (£m) New measures by Group airline
Total
In £m
100%
In %
Page 118Page 118
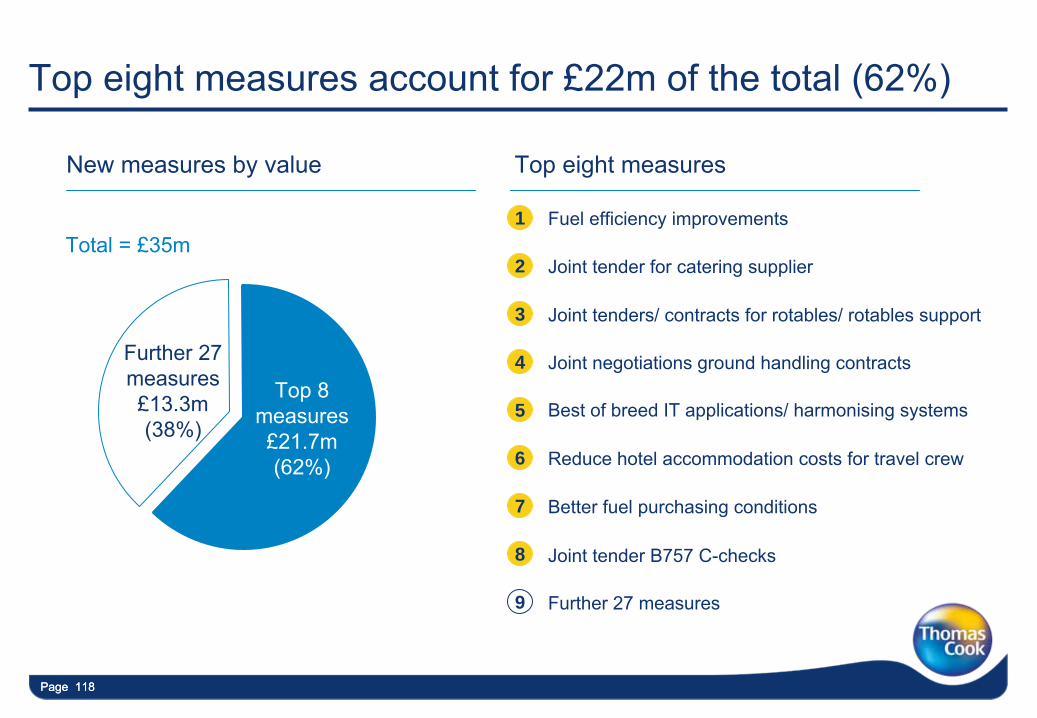
New measures by value
Top eight measures account for £22m of the total (62%)
Top 8measures£21.7m(62%)
Further 27measures£13.3m(38%)
Total = £35mFuel efficiency improvements
Joint tender for catering supplier
Reduce hotel accommodation costs for travel crew
Joint tenders/ contracts for rotables/ rotables
support
Joint tender B757 C-checks
Better fuel purchasing conditions
Best of breed IT applications/ harmonising systems
Joint negotiations ground handling contracts
Further 27 measures
1
2
3
4
5
6
7
8
9
Top eight measures
Page 119Page 119
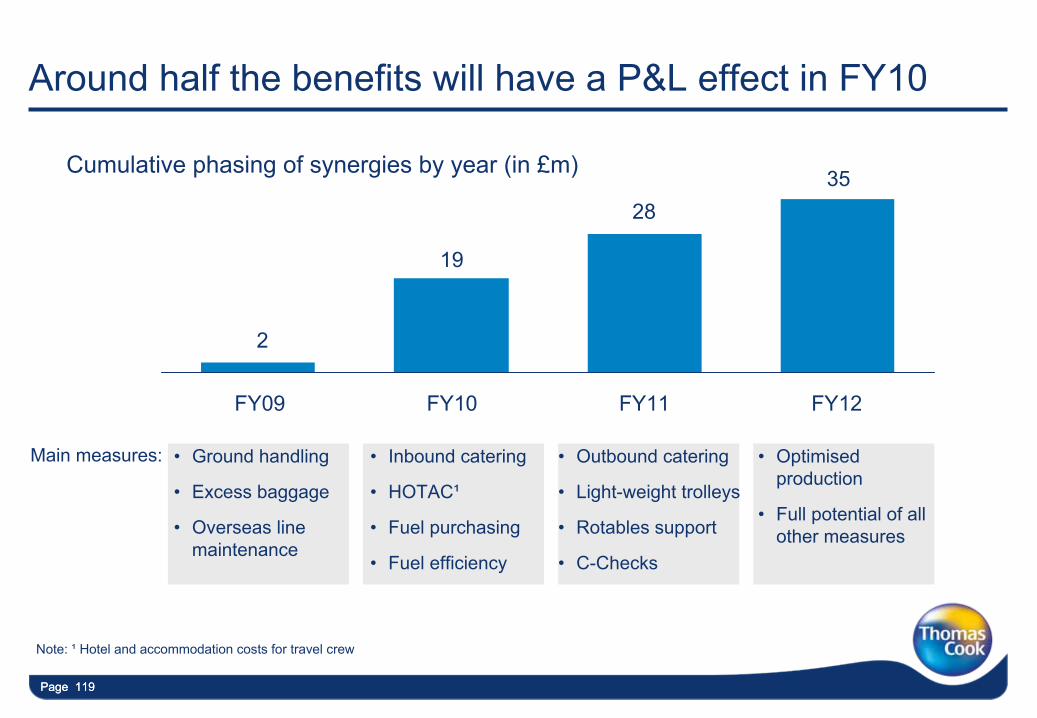
Around half the benefits will have a P&L effect in FY10
2
FY09
19
FY10
28
FY11
35
FY12
•
Inbound catering
•
HOTAC¹
•
Fuel purchasing
•
Fuel efficiency
•
Outbound catering
•
Light-weight trolleys
•
Rotables
support
•
C-Checks
•
Optimised production
•
Full potential of all other measures
•
Ground handling
•
Excess baggage
•
Overseas line maintenance
Main measures:
Cumulative phasing of synergies by year (in £m)
Note: ¹
Hotel and accommodation costs for travel crew
Page 120Page 120
In summary
•
Project generates significant additional benefits from airline cooperation
•
Strong implementation organisation in place to deliver
•
Target for FY09 met
•
On track to hit targets in FY10 through to FY12
•
Hard to replicate
Project structure will deliver more savings in the medium term
Page 121
Leverage our Group buying power in destination management
Pete Constanti –
CEO Group Destination
Management
Page 122
Group destination management objectives
•
Unlock value through greater Group coordination
•
Reduce accommodation costs
•
Reduce other destination-related overheads
•
Protect and enhance product portfolio
Page 123
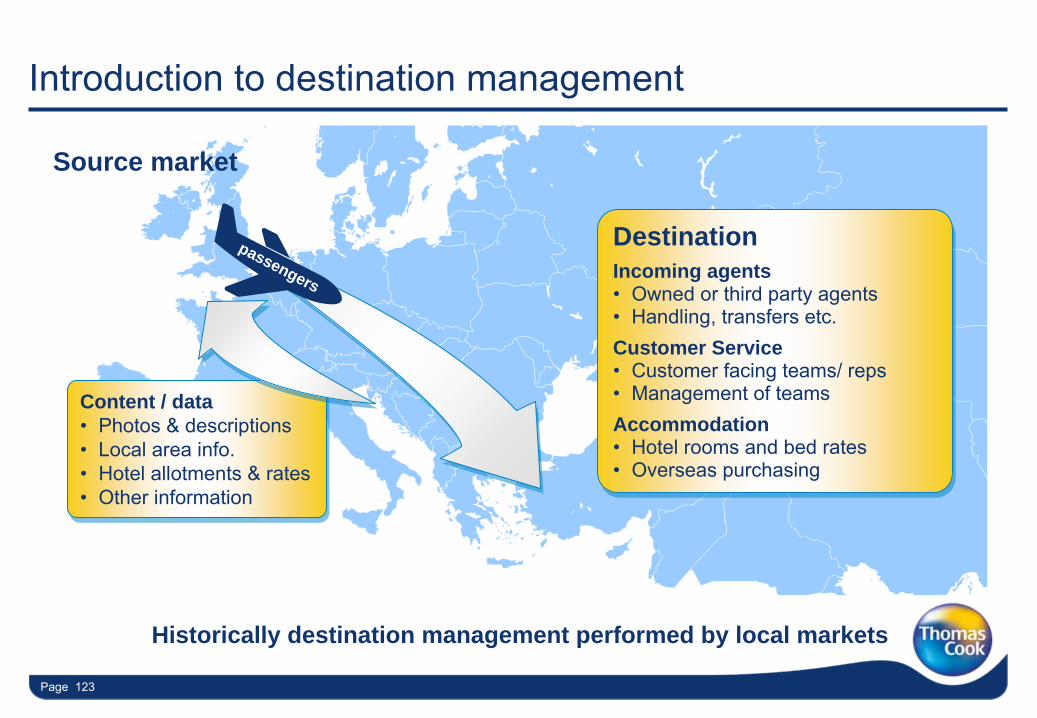
Introduction to destination management
Historically destination management performed by local markets
Source market
passengers
Content / data•
Photos & descriptions•
Local area info.•
Hotel allotments & rates•
Other information
Content / data•
Photos & descriptions•
Local area info.•
Hotel allotments & rates•
Other information
DestinationIncoming agents•
Owned or third party agents•
Handling, transfers etc.Customer Service•
Customer facing teams/ reps•
Management of teamsAccommodation•
Hotel rooms and bed rates•
Overseas purchasing
DestinationIncoming agents•
Owned or third party agents•
Handling, transfers etc.Customer Service•
Customer facing teams/ reps•
Management of teamsAccommodation•
Hotel rooms and bed rates•
Overseas purchasing
Page 124Page 124
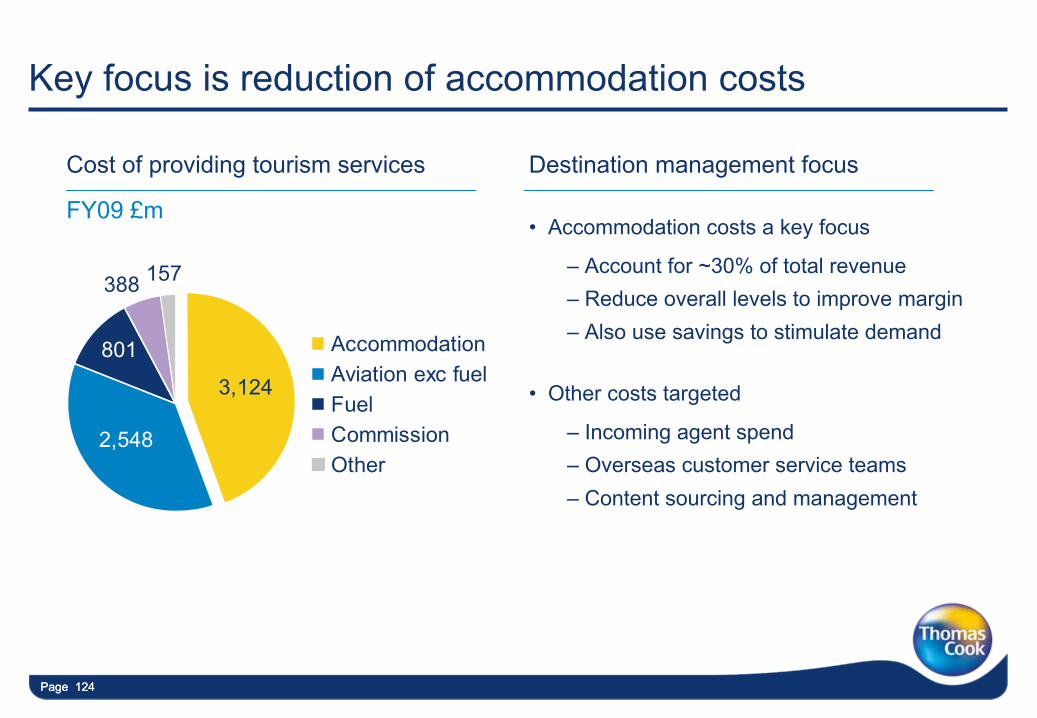
Key focus is reduction of accommodation costs
2,548
801
3,124
388 157
AccommodationAviation exc fuelFuelCommissionOther
FY09 £m
Cost of providing tourism services Destination management focus
•
Accommodation costs a key focus
–
Account for ~30% of total revenue–
Reduce overall levels to improve margin–
Also use savings to stimulate demand
•
Other costs targeted
–
Incoming agent spend–
Overseas customer service teams–
Content sourcing and management
Page 125
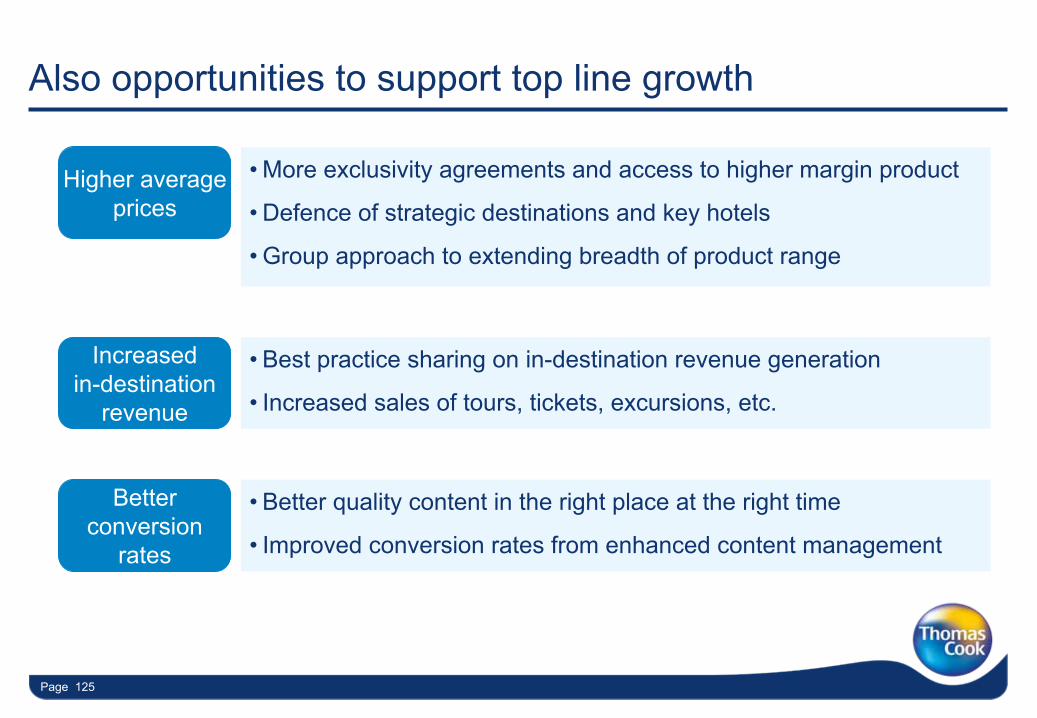
Also opportunities to support top line growth
Higher average prices
•
More exclusivity agreements and access to higher margin product
•
Defence of strategic destinations and key hotels
•
Group approach to extending breadth of product range
Increased in-destination
revenue
•
Best practice sharing on in-destination revenue generation
•
Increased sales of tours, tickets, excursions, etc.
Better conversion
rates
•
Better quality content in the right place at the right time
•
Improved conversion rates from enhanced content management
Page 126
Four major activities to unlock value
•
Move to a single incoming agent per destination
•
Create a single management structure for overseas teams
•
Take a Group approach to content sourcing and management
•
Take a more centralised approach to overseas purchasing
1
2
3
4
Page 127
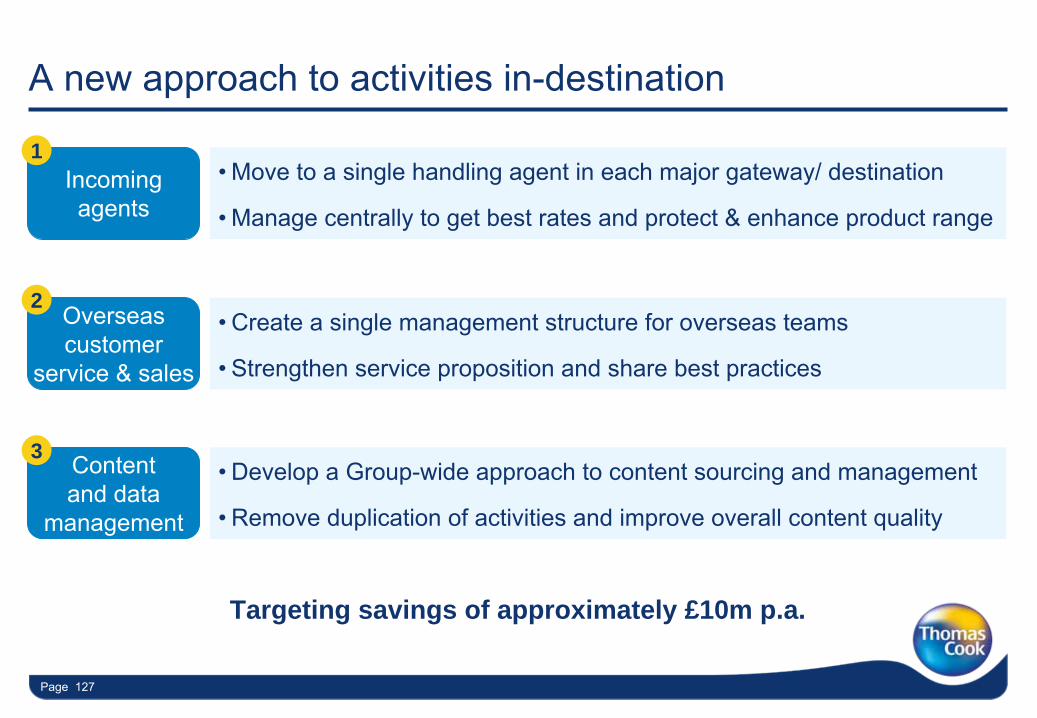
A new approach to activities in-destination
Targeting savings of approximately £10m p.a.
Incoming agents
•
Move to a single handling agent in each major gateway/ destination
•
Manage centrally to get best rates and protect & enhance product
range
1
Overseas customer service & sales
•
Create a single management structure for overseas teams
•
Strengthen service proposition and share best practices
2
Content and data
management
•
Develop a Group-wide approach to content sourcing and management
•
Remove duplication of activities and improve overall content quality
3
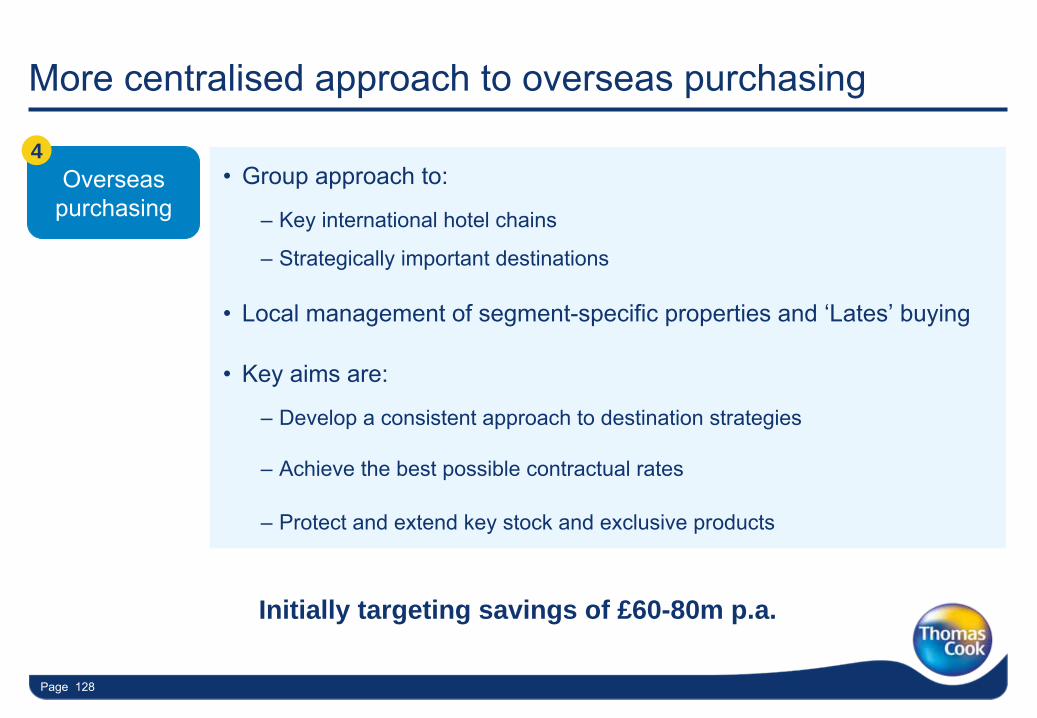
Page 128
•
Group approach to:
–
Key international hotel chains
–
Strategically important destinations
•
Local management of segment-specific properties and ‘Lates’
buying
•
Key aims are:
–
Develop a consistent approach to destination strategies
–
Achieve the best possible contractual rates
–
Protect and extend key stock and exclusive products
Overseas purchasing
4
More centralised approach to overseas purchasing
Initially targeting savings of £60-80m p.a.
Page 129Page 129
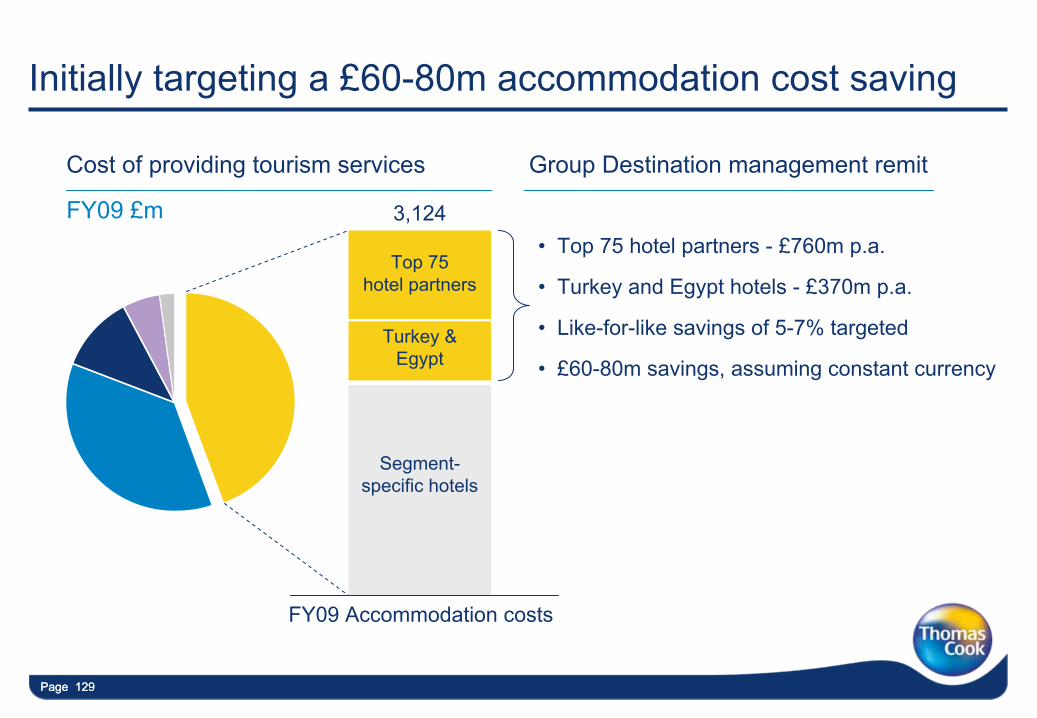
Initially targeting a £60-80m accommodation cost saving
Turkey & Egypt
Top 75
hotel partners
Segment-
specific hotels
3,124
FY09 Accommodation costs
•
Top 75 hotel partners -
£760m p.a.
•
Turkey and Egypt hotels -
£370m p.a.
•
Like-for-like savings of 5-7% targeted
•
£60-80m savings, assuming constant currency
FY09 £m
Cost of providing tourism services Group Destination management remit
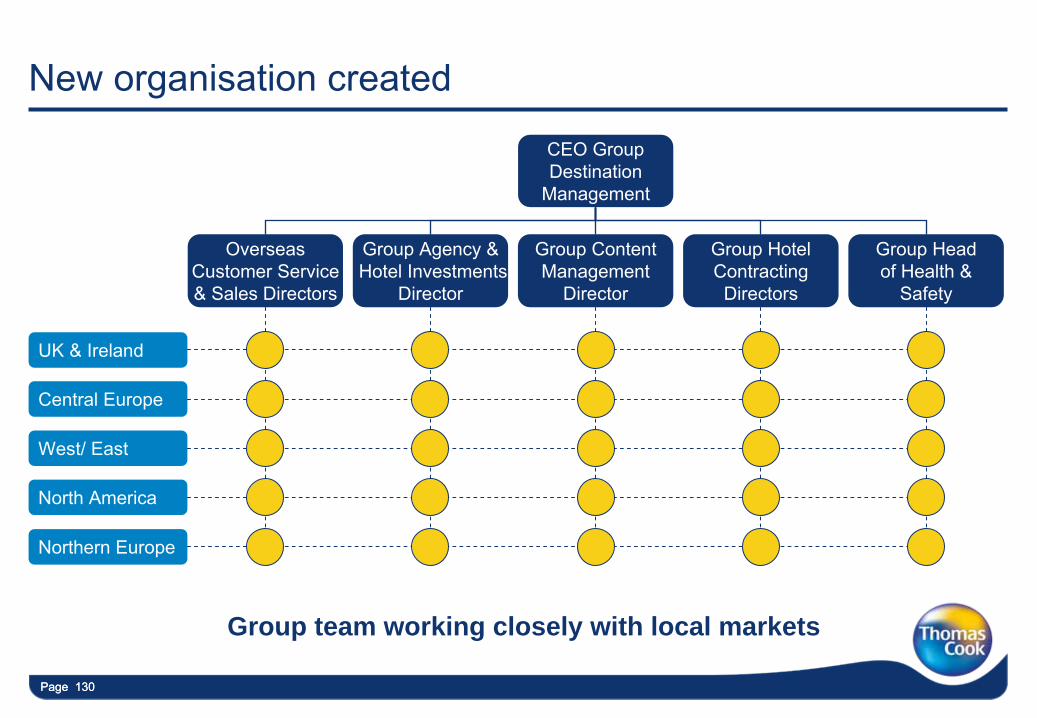
Page 130
Northern Europe
North America
UK & Ireland
Central Europe
West/ East
Page 130
New organisation created
Group team working closely with local markets
CEO Group
Destination
Management
Overseas
Customer Service
& Sales Directors
Group Agency &
Hotel Investments
Director
Group Content
Management
Director
Group Hotel Contracting
Directors
Group Head
of Health &
Safety
Page 131
In summary
•
A significant change to the way we do business
•
Group hotel purchasing organisation for biggest hotel chains and
strategic destinations
•
Customer service organisation under a single management structure
•
Single agent per gateway in major destinations
•
Single content management system and process
•
Group destination management working closely with the segments
Leveraging our position through a world class approach

Page 132
Drive significant top line and bottom line growth in the UK & Ireland
Ian Derbyshire –
CEO UK & Ireland
Page 133
UK & Ireland objectives
•
Significantly grow top line & target industry leading margins
•
Continue mainstream product focus & margin improvement
•
Significantly grow independent travel online and offline
•
Continue to build financial services business
Page 134Page 134
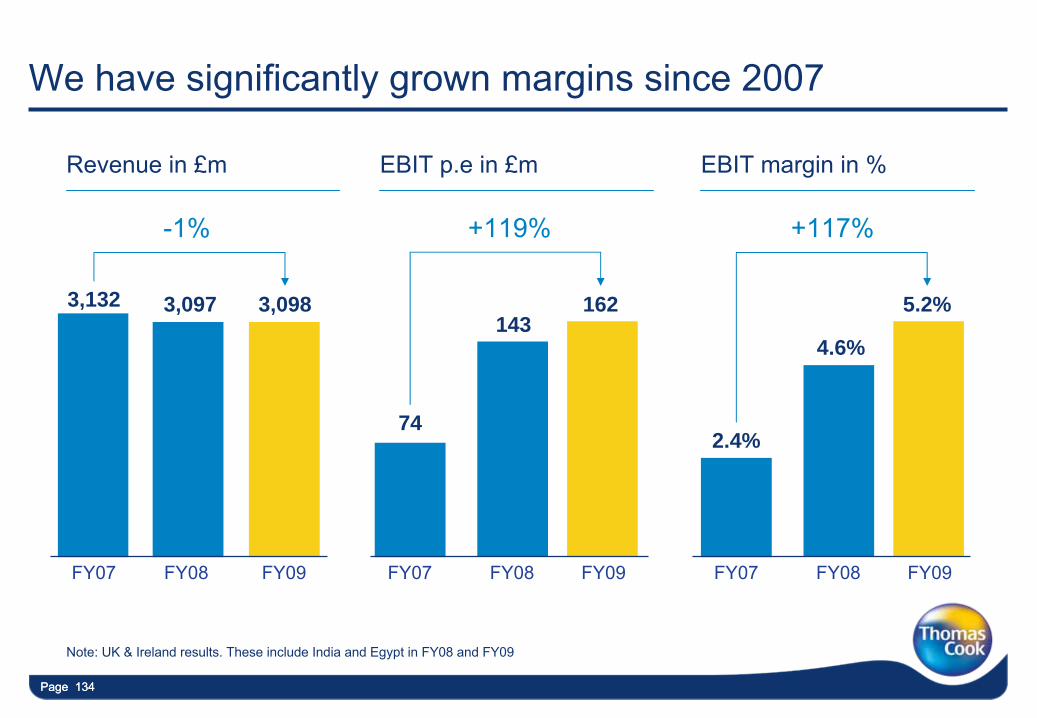
Note: UK & Ireland results. These include India and Egypt in FY08 and FY09
FY07 FY08
3,0973,132143
74
FY07 FY08
4.6%
2.4%
FY07 FY08FY09
3,098
FY09
5.2%
FY09
+119%-1% +117%
162
We have significantly grown margins since 2007
Revenue in £m EBIT p.e in £m EBIT margin in %
Page 135Page 135
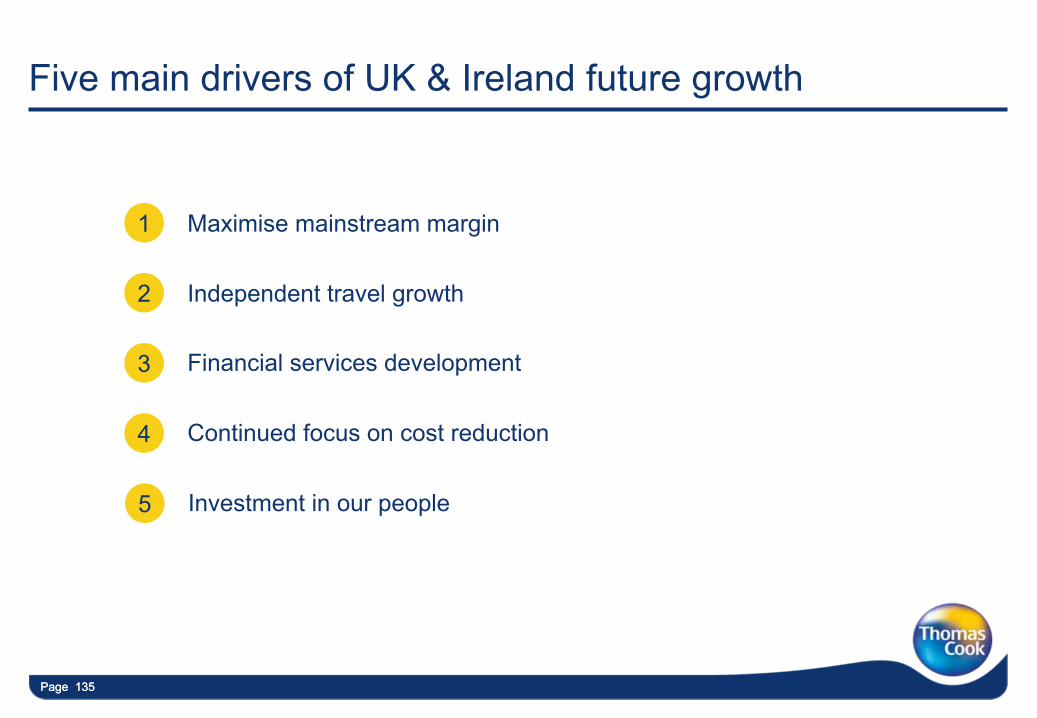
Maximise mainstream margin1
Independent travel growth2
Financial services development 3
Continued focus on cost reduction4
Five main drivers of UK & Ireland future growth
Investment in our people5
Page 136Page 136
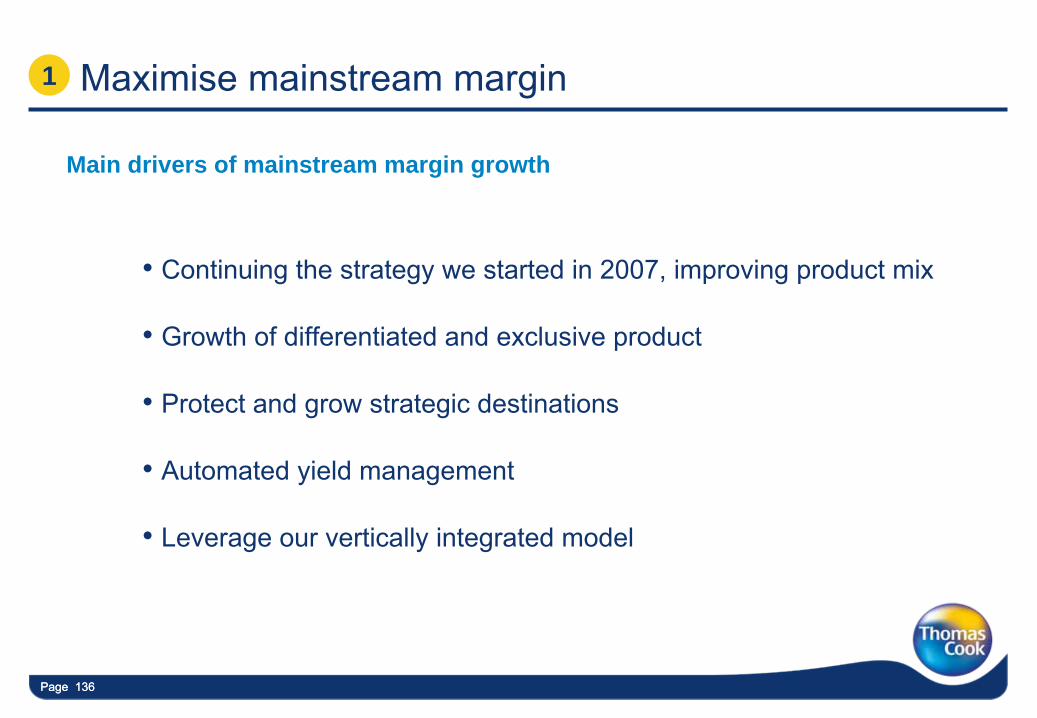
•
Continuing the strategy we started in 2007, improving product mix
•
Growth of differentiated and exclusive product
•
Protect and grow strategic destinations
•
Automated yield management
•
Leverage our vertically integrated model
Maximise mainstream margin1
Main drivers of mainstream margin growth
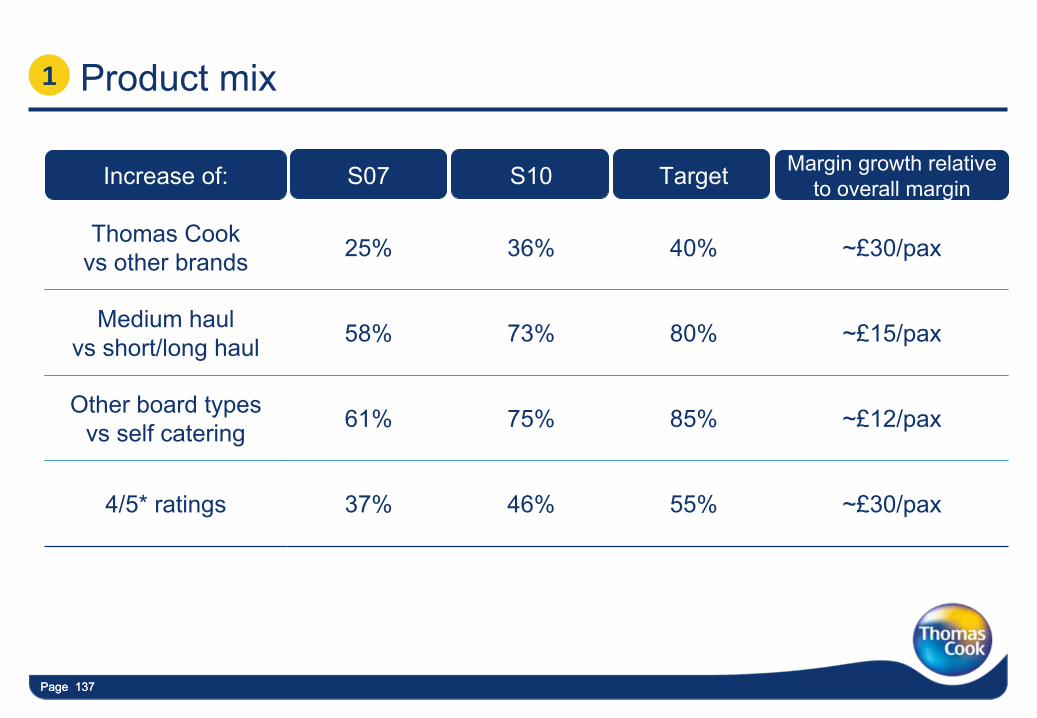
Page 137Page 137
Increase of: S07 S10 Target Margin growth relative
to overall margin
Thomas Cook vs
other brands 25% 36% 40% ~£30/pax
Medium haul vs
short/long haul 58% 73% 80% ~£15/pax
Other board types vs
self catering 61% 75% 85% ~£12/pax
4/5* ratings 37% 46% 55% ~£30/pax
Product mix1
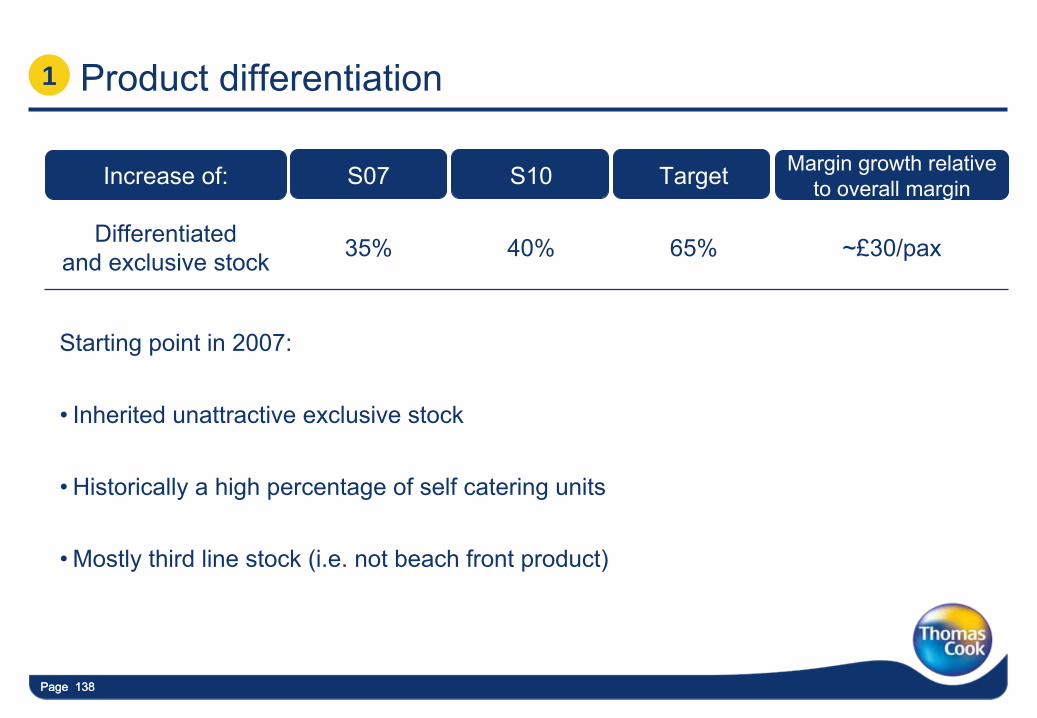
Page 138Page 138
Increase of: S07 S10 Target Margin growth relative
to overall margin
Differentiatedand exclusive stock 35% 40% 65% ~£30/pax
Product differentiation1
Starting point in 2007:
•
Inherited unattractive exclusive stock
•
Historically a high percentage of self catering units
•
Mostly third line stock (i.e. not beach front product)
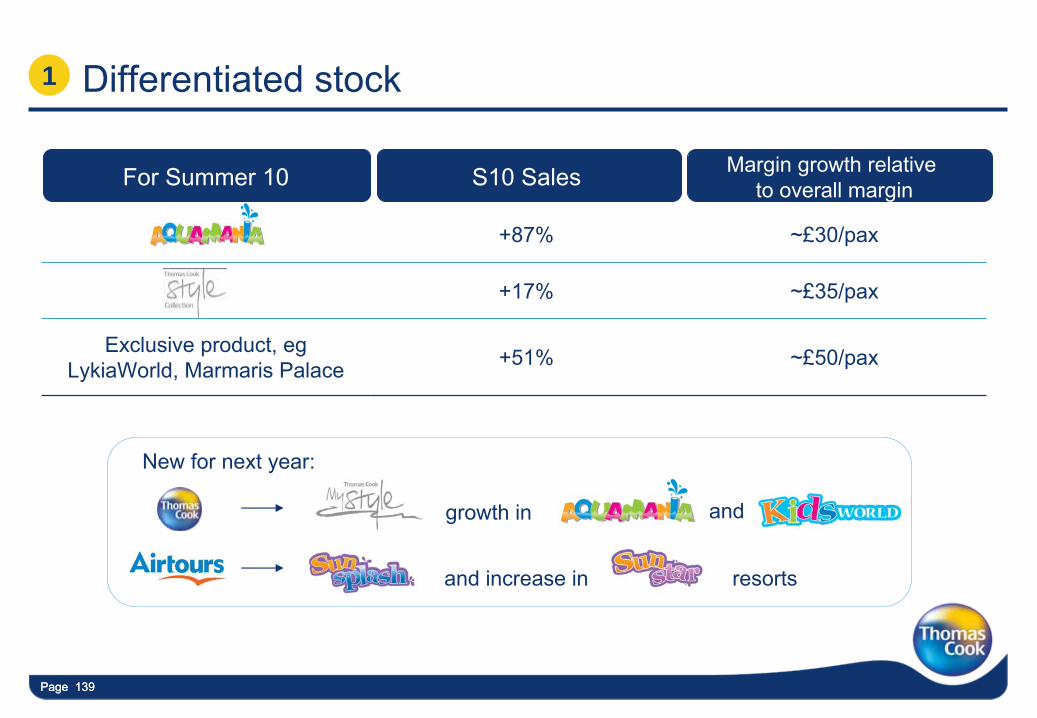
Page 139Page 139
Differentiated stock
For Summer 10 S10 Sales Margin growth relative to overall margin
+87% ~£30/pax
+17% ~£35/pax
Exclusive product, egLykiaWorld, Marmaris
Palace +51% ~£50/pax
New for next year:
growth in
and increase in resorts
and
1
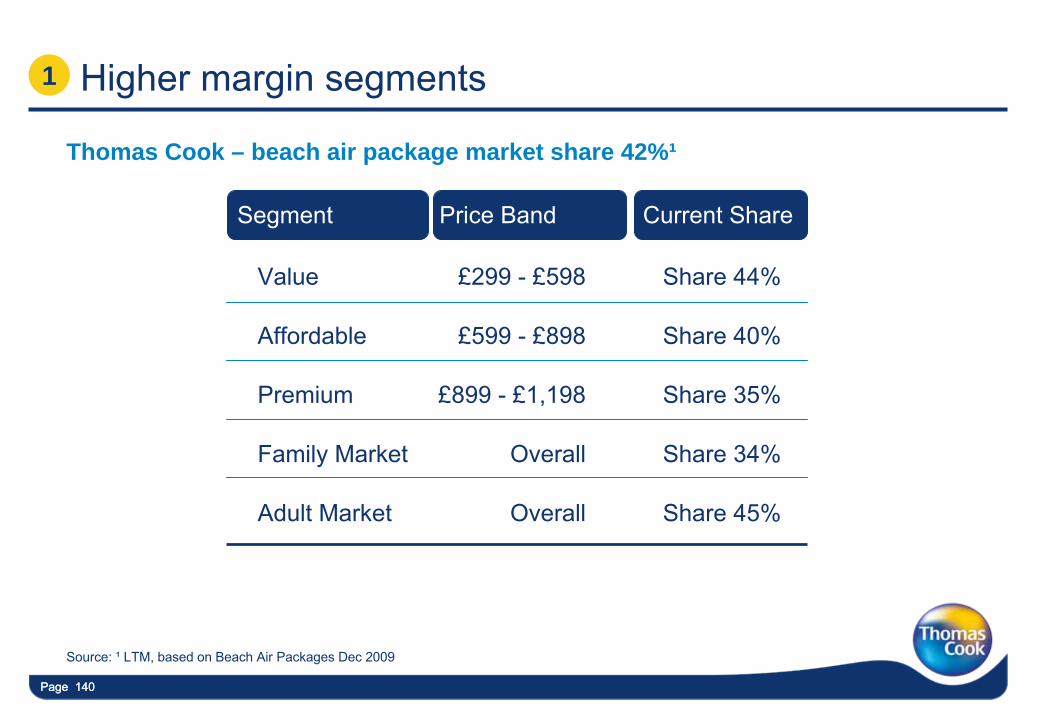
Page 140Page 140
Higher margin segments
Thomas Cook – beach air package market share 42%¹
Value £299 -
£598
Affordable £599 -
£898
Premium £899 -
£1,198
Family Market Overall
Adult Market Overall
Source: ¹
LTM, based on Beach Air Packages Dec 2009
Share 44%
Share 40%
Share 35%
Share 34%
Share 45%
Segment Price Band Current Share
1
Page 141Page 141
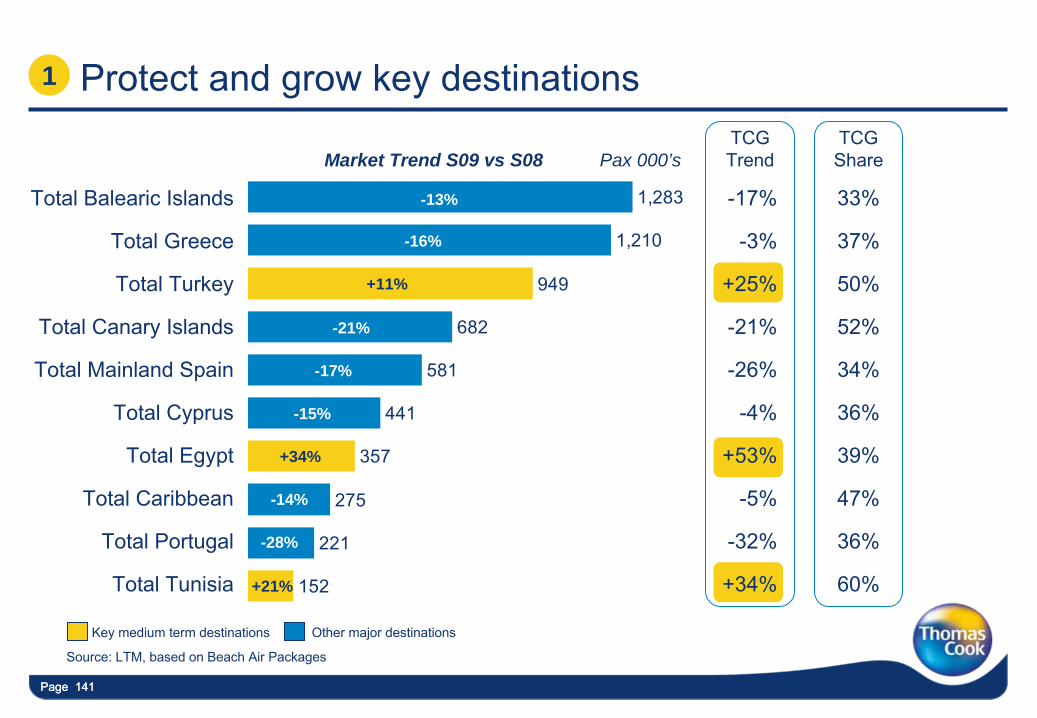
Protect and grow key destinations
152
221
275
357
441
581
682
949
1,210
1,283Total Balearic Islands
Total Greece
Total Turkey
Total Canary Islands
Total Mainland Spain
Total Cyprus
Total Egypt
Total Caribbean
Total Portugal
Total Tunisia
Source: LTM, based on Beach Air Packages
-17%
-3%
+25%
-21%
-26%
-4%
+53%
-5%
-32%
+34%
33%
37%
50%
52%
34%
36%
39%
47%
36%
60%
TCG Trend
TCG ShareMarket Trend S09 vs S08 Pax 000’s
-13%
-16%
+11%
-21%
-17%
-15%
+34%
-14%
-28%
+21%
1
Key medium term destinations Other major destinations
Page 142Page 142Page 142
Automated yield management
•
Holiday combinations (~ 7m) analysed overnight for demand forecast and optimal price
•
Where rate of sale is too low prices are lowered automatically
•
Prices are also maximised where strong demand exists
•
Automation of price changes directly in reservation system
•
Frees up Yield team for more strategic interventions and value adding activities
1
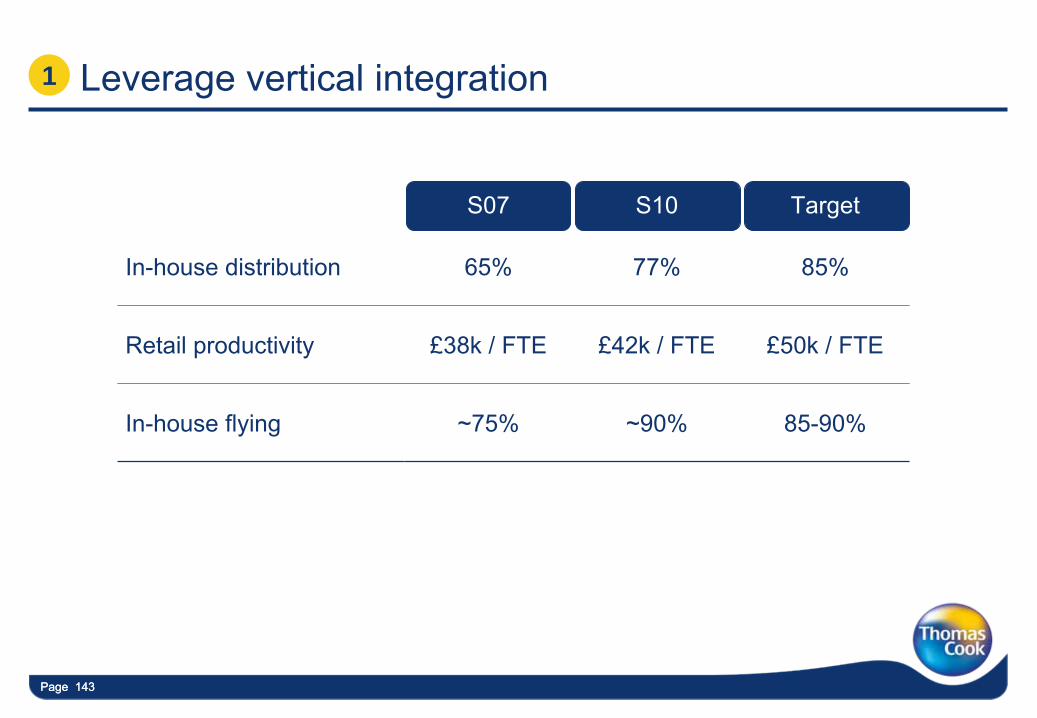
Page 143Page 143
Board Basis S07 S10 Target
In-house distribution 65% 77% 85%
Retail productivity £38k / FTE £42k / FTE £50k / FTE
In-house flying ~75% ~90% 85-90%
Leverage vertical integration1
Page 144Page 144
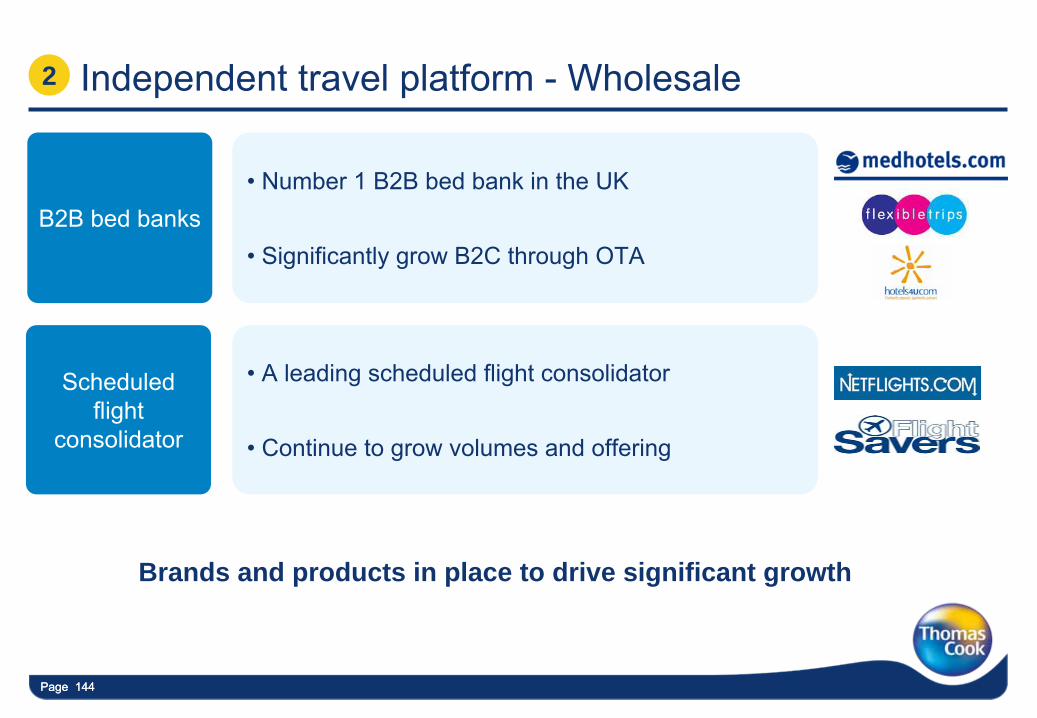
Independent travel platform -
Wholesale2
• Number 1 B2B bed bank in the UK
• Significantly grow B2C through OTAB2B bed banks
• A leading scheduled flight consolidator
• Continue to grow volumes and offering
Scheduled flight
consolidator
Brands and products in place to drive significant growth
Page 145Page 145
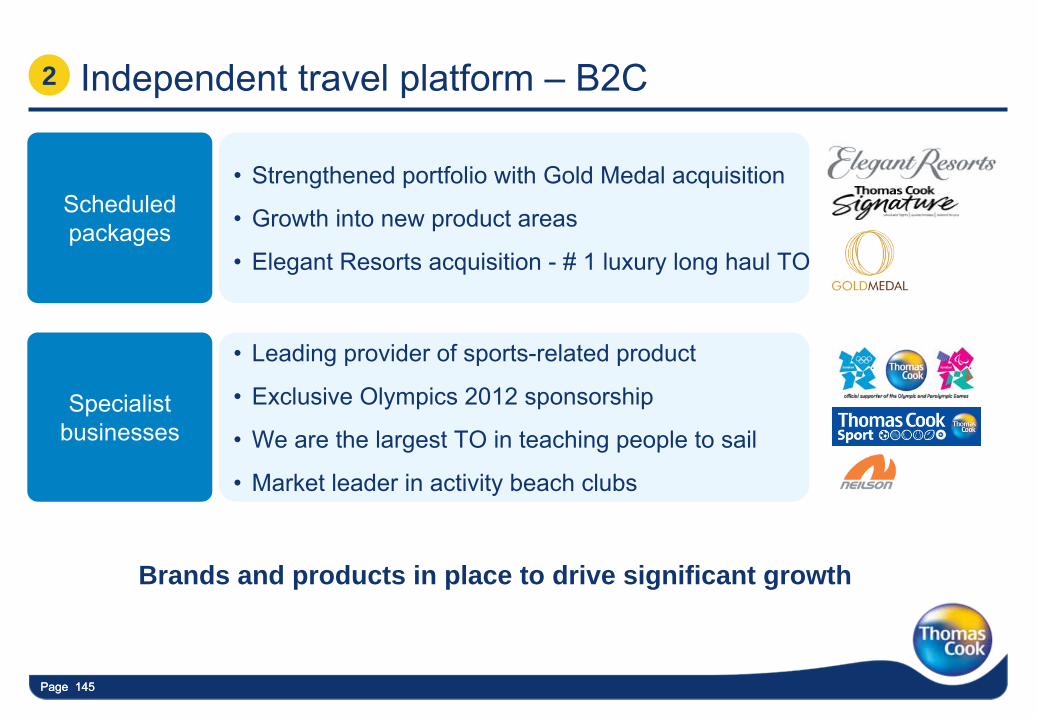
Independent travel platform –
B2C 2
•
Leading provider of sports-related product
•
Exclusive Olympics 2012 sponsorship
•
We are the largest TO in teaching people to sail
•
Market leader in activity beach clubs
Specialist businesses
•
Strengthened portfolio with Gold Medal acquisition
•
Growth into new product areas
•
Elegant Resorts acquisition -
# 1 luxury long haul TO
Scheduled packages
Brands and products in place to drive significant growth
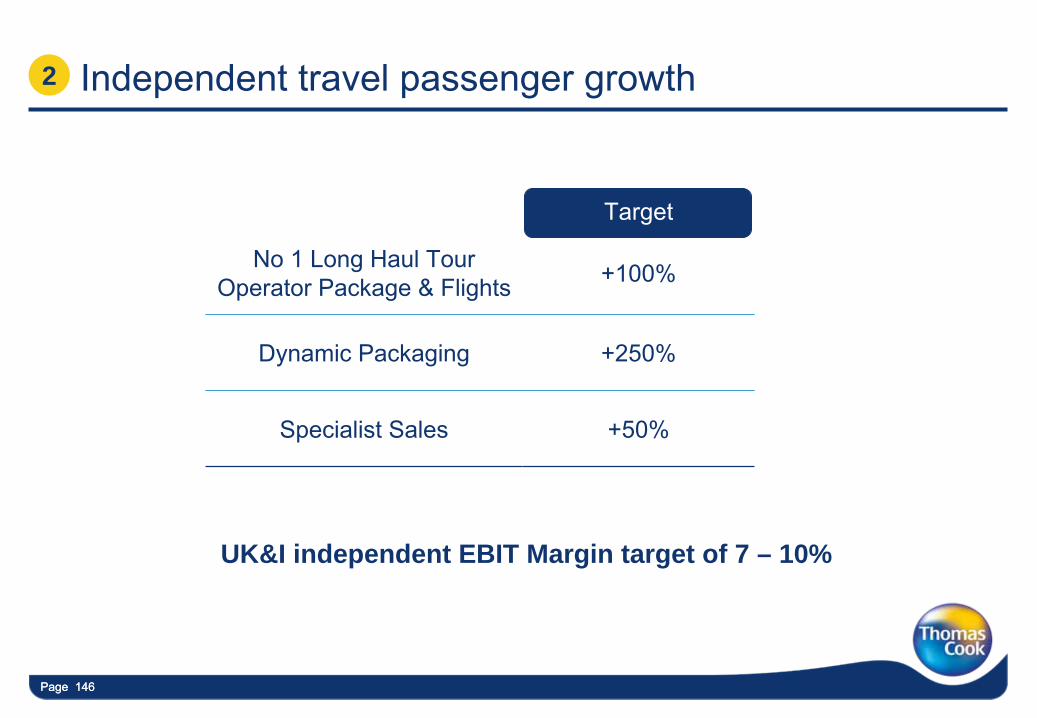
Page 146Page 146
Independent travel passenger growth
Board Basis Target
No 1 Long Haul TourOperator Package & Flights +100%
Dynamic Packaging +250%
Specialist Sales +50%
2
UK&I independent EBIT Margin target of 7 – 10%
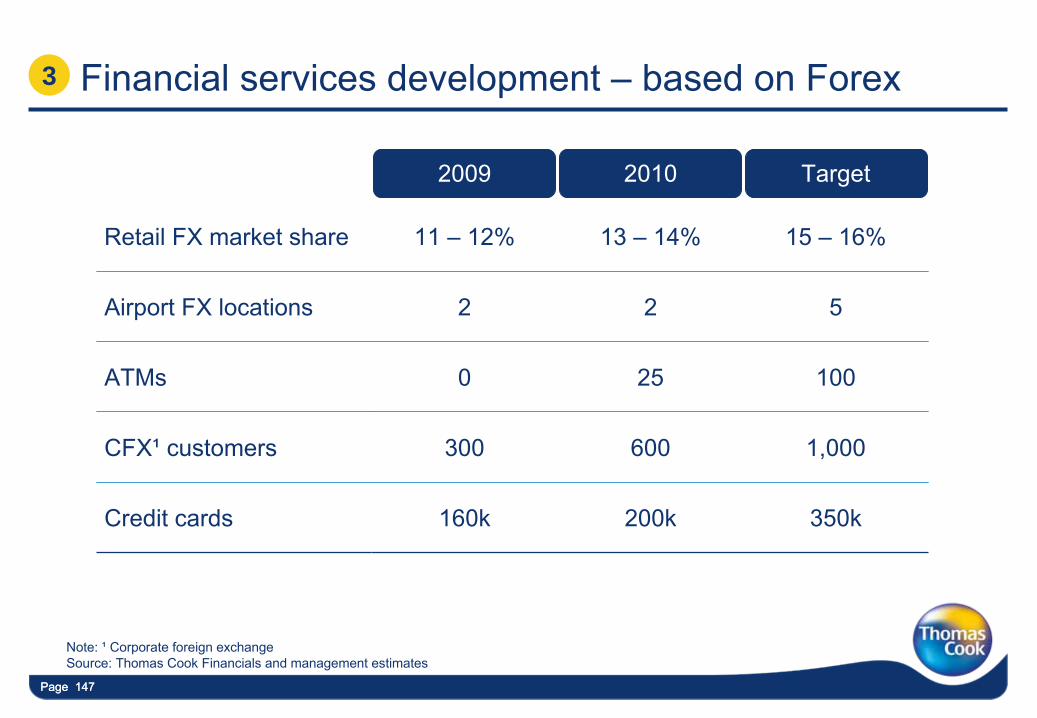
Page 147Page 147
Financial services development –
based on Forex
2009 2010 Target
Retail FX market share 11 –
12% 13 –
14% 15 –
16%
Airport FX locations 2 2 5
ATMs 0 25 100
CFX¹
customers 300 600 1,000
Credit cards 160k 200k 350k
Note: ¹
Corporate foreign exchange Source: Thomas Cook Financials and management estimates
3
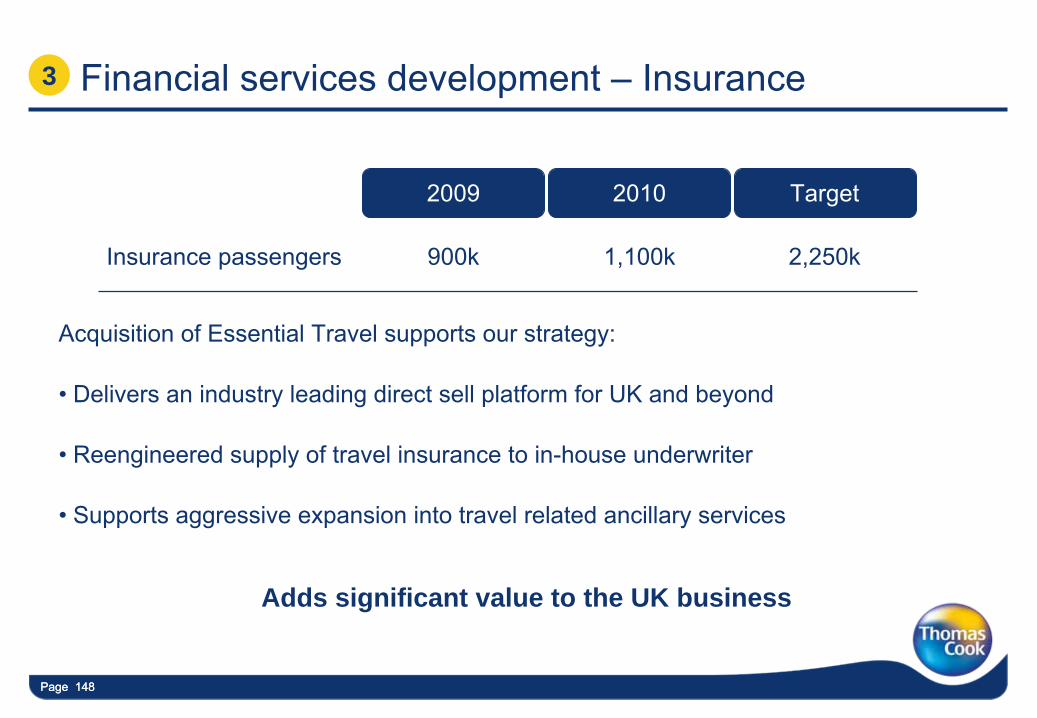
Page 148Page 148
Financial services development –
Insurance
2009 2010 Target
Insurance passengers 900k 1,100k 2,250k
Acquisition of Essential Travel supports our strategy:
•
Delivers an industry leading direct sell platform for UK and beyond
•
Reengineered supply of travel insurance to in-house underwriter
•
Supports aggressive expansion into travel related ancillary services
3
Adds significant value to the UK business
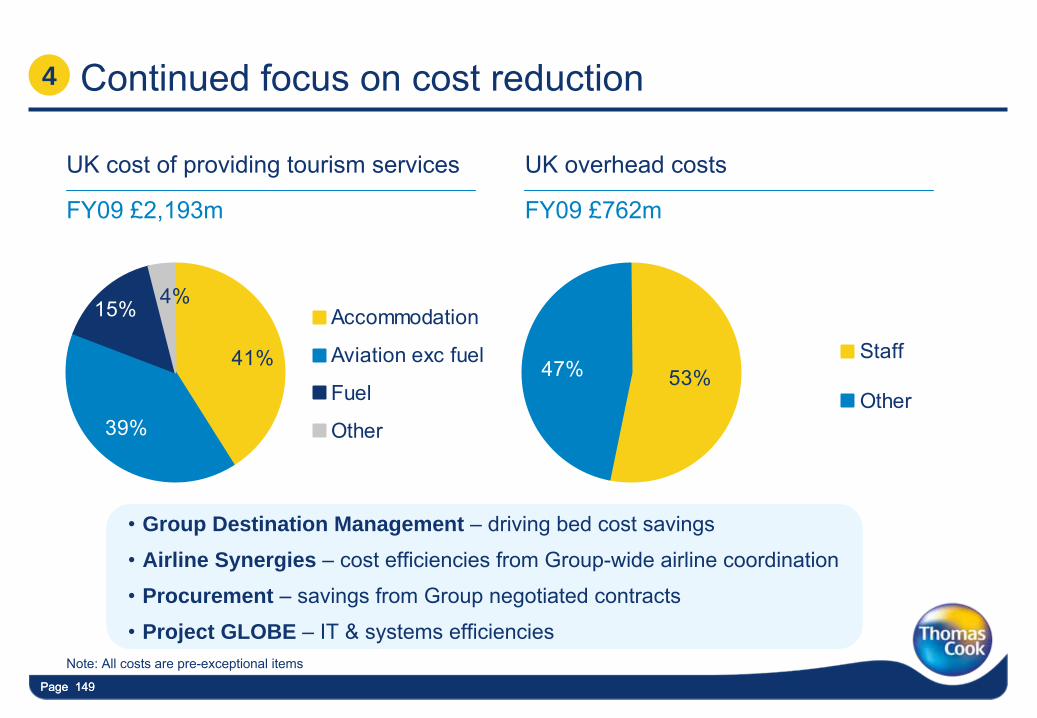
Page 149Page 149
Continued focus on cost reduction
4%
39%
15%
41%
Accommodation
Aviation exc fuel
Fuel
Other
4
UK cost of providing tourism services UK overhead costs
FY09 £2,193m FY09 £762m
47% 53%Staff
Other
•
Group Destination Management –
driving bed cost savings
•
Airline Synergies –
cost efficiencies from Group-wide airline coordination
•
Procurement –
savings from Group negotiated contracts
•
Project GLOBE –
IT & systems efficienciesNote: All costs are pre-exceptional items
Page 150Page 150
Investing in our people is core to everything we do
•
ECHO Survey –
driving employee engagement levels to 3.86 “Excellent”
range
•
–
range of e-learning and training programmes
•
Inspire and Sustain –
senior management development programme
•
Thomas Cook Vision –
rolled out across the UK&I to 17,000 employees
5
Page 151Page 151Page 151
In summary
•
We will continue to drive benefits from original mainstream strategy set in 2007
•
We will increase margin performance by securing differentiated &
exclusive product
•
Significant volume growth will continue in independent travel
•
Redefining of our financial services proposition will drive growth
Create the UK’s leading travel business
Page 152
Significantly grow online and establish a European OTA business
Simon Breakwell –
Ecommerce Advisor
Page 153
European OTA objectives
•
Thomas Cook online to become a top 3 European OTA
•
Targeting £3-3.5b incremental gross sales
•
Significant profit to come from OTA growth
Page 154
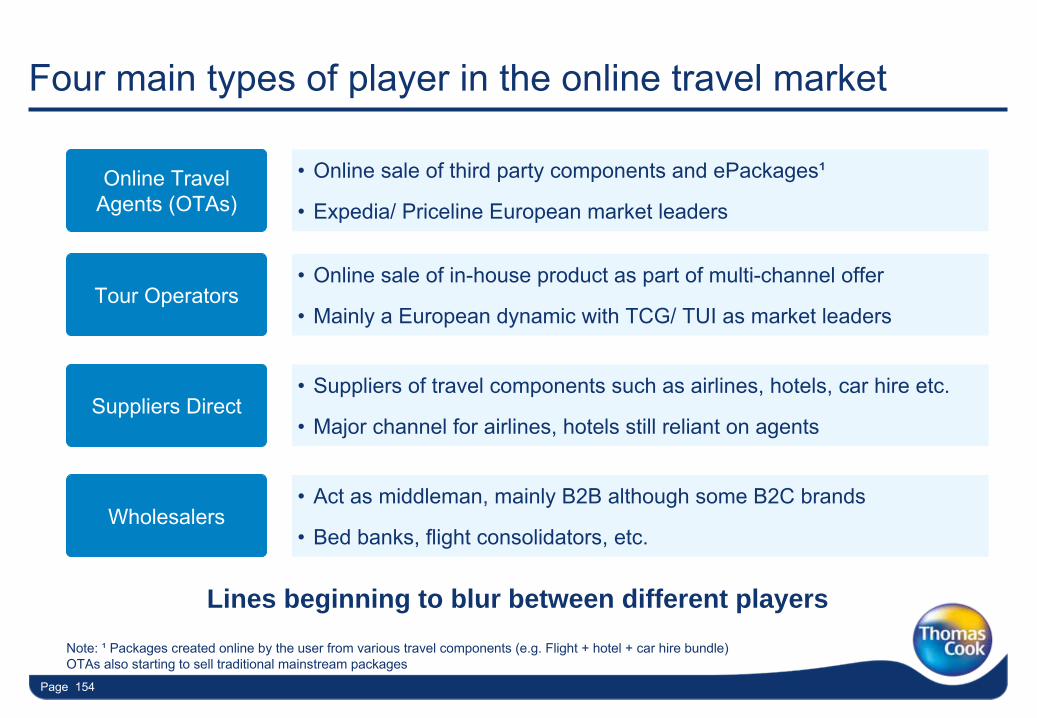
•
Online sale of in-house product as part of multi-channel offer
•
Mainly a European dynamic with TCG/ TUI as market leaders
•
Suppliers of travel components such as airlines, hotels, car hire etc.
•
Major channel for airlines, hotels still reliant on agents
•
Act as middleman, mainly B2B although some B2C brands
•
Bed banks, flight consolidators, etc.
Note: ¹
Packages created online by the user from various travel components (e.g. Flight + hotel + car hire bundle)
OTAs
also starting to sell traditional mainstream packages
Online Travel Agents (OTAs)
•
Online sale of third party components and ePackages¹
•
Expedia/ Priceline European market leaders
Lines beginning to blur between different players
Tour Operators
Suppliers Direct
Wholesalers
Four main types of player in the online travel market
Page 155
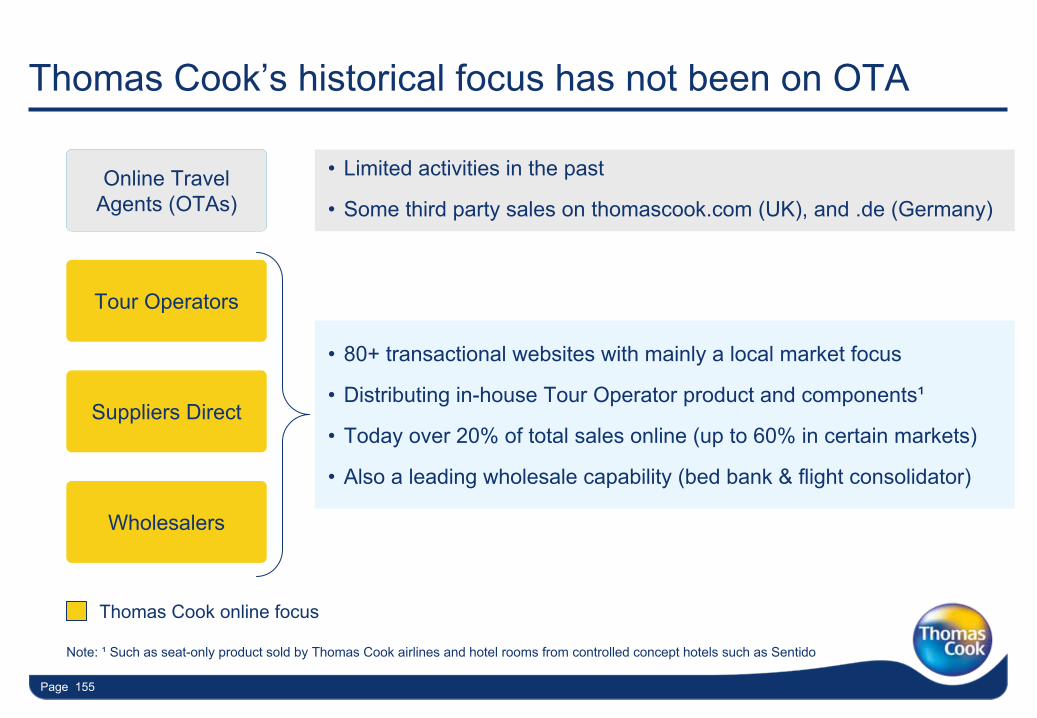
Online Travel Agents
•
80+ transactional websites with mainly a local market focus
•
Distributing in-house Tour Operator product and components¹
•
Today over 20% of total sales online (up to 60% in certain markets)
•
Also a leading wholesale capability (bed bank & flight consolidator)
•
Limited activities in the past
•
Some third party sales on thomascook.com
(UK), and .de (Germany)Online Travel
Agents (OTAs)
Tour Operators
Suppliers Direct
Wholesalers
Note: ¹
Such as seat-only product sold by Thomas Cook airlines and hotel rooms from controlled concept hotels such as Sentido
Thomas Cook online focus
Thomas Cook’s historical focus has not been on OTA
Page 156
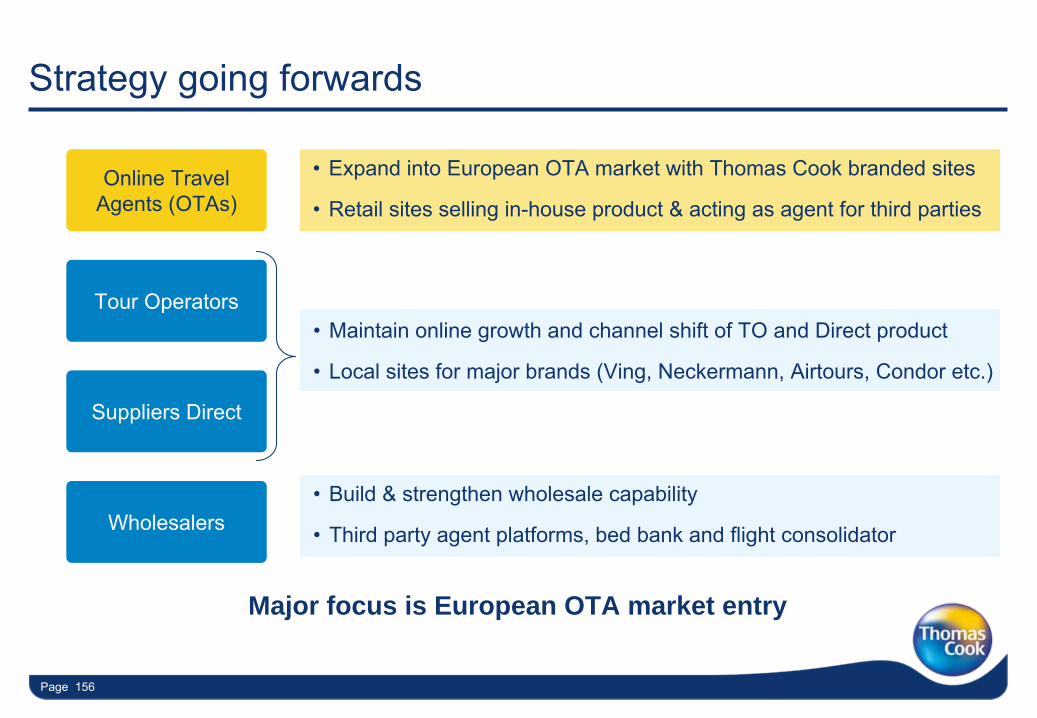
•
Expand into European OTA market with Thomas Cook branded sites
•
Retail sites selling in-house product & acting as agent for third partiesOnline Travel
Agents (OTAs)
Strategy going forwards
•
Maintain online growth and channel shift of TO and Direct product
•
Local sites for major brands (Ving, Neckermann, Airtours, Condor etc.)
Tour Operators
Suppliers Direct
Wholesalers•
Build & strengthen wholesale capability
•
Third party agent platforms, bed bank and flight consolidator
Major focus is European OTA market entry
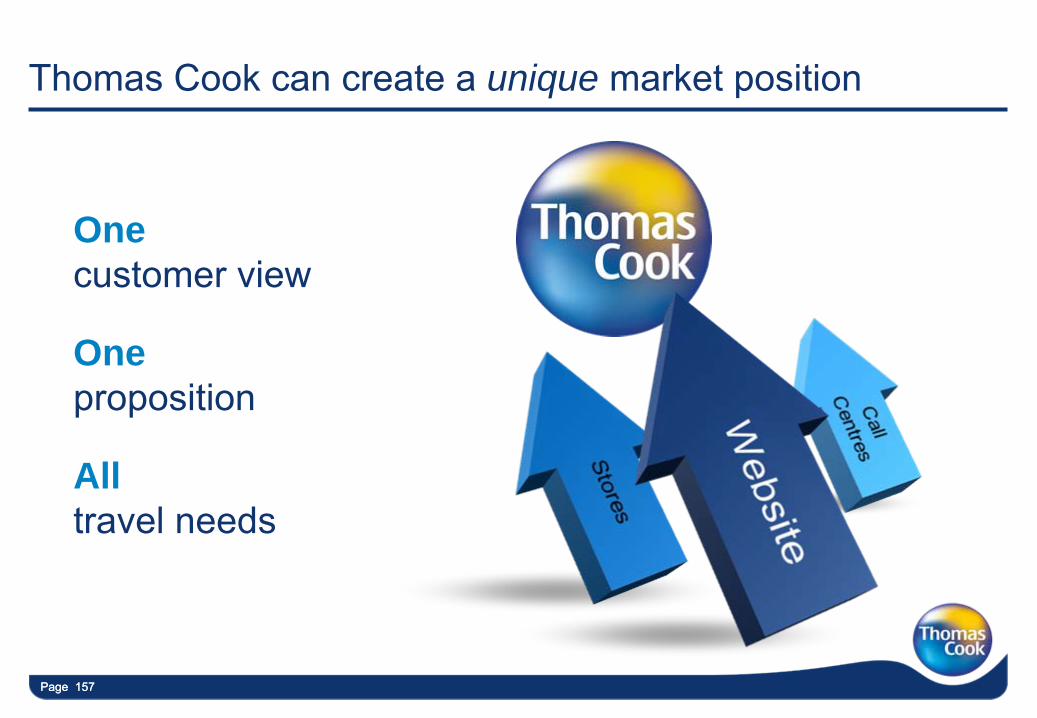
Page 157Page 157
Thomas Cook can create a unique market position
One customer view
One proposition
All travel needs
Page 158Page 158
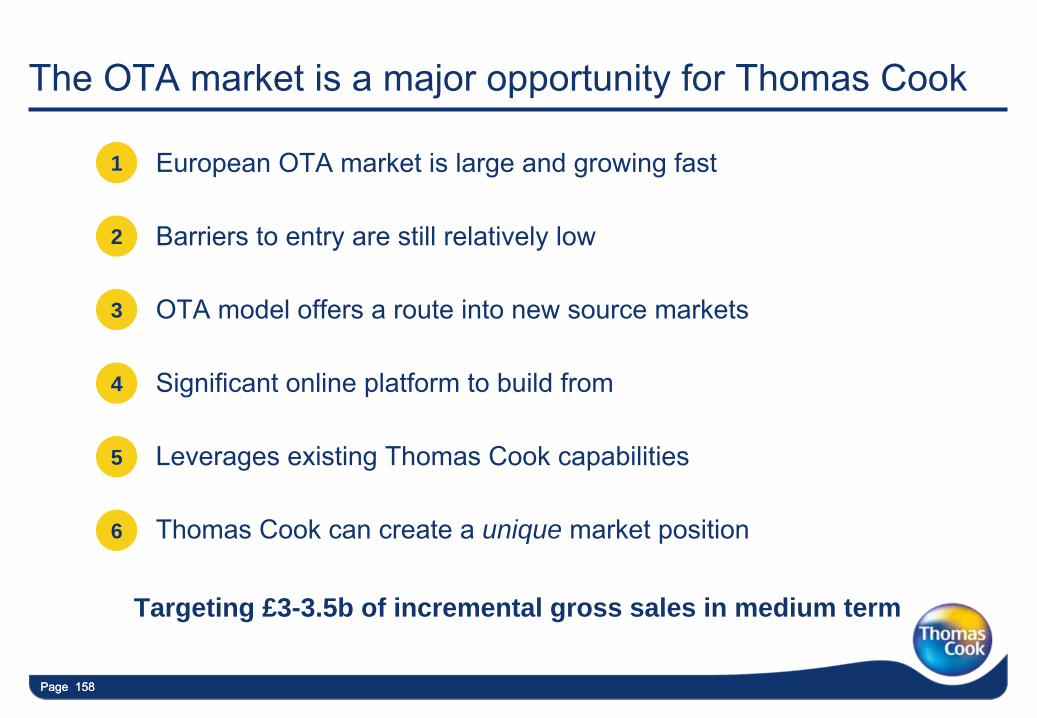
The OTA market is a major opportunity for Thomas Cook
• European OTA market is large and growing fast
• Barriers to entry are still relatively low
• OTA model offers a route into new source markets
• Significant online platform to build from
• Leverages existing Thomas Cook capabilities
• Thomas Cook can create a unique market position
1
2
3
4
6
Targeting £3-3.5b of incremental gross sales in medium term
5
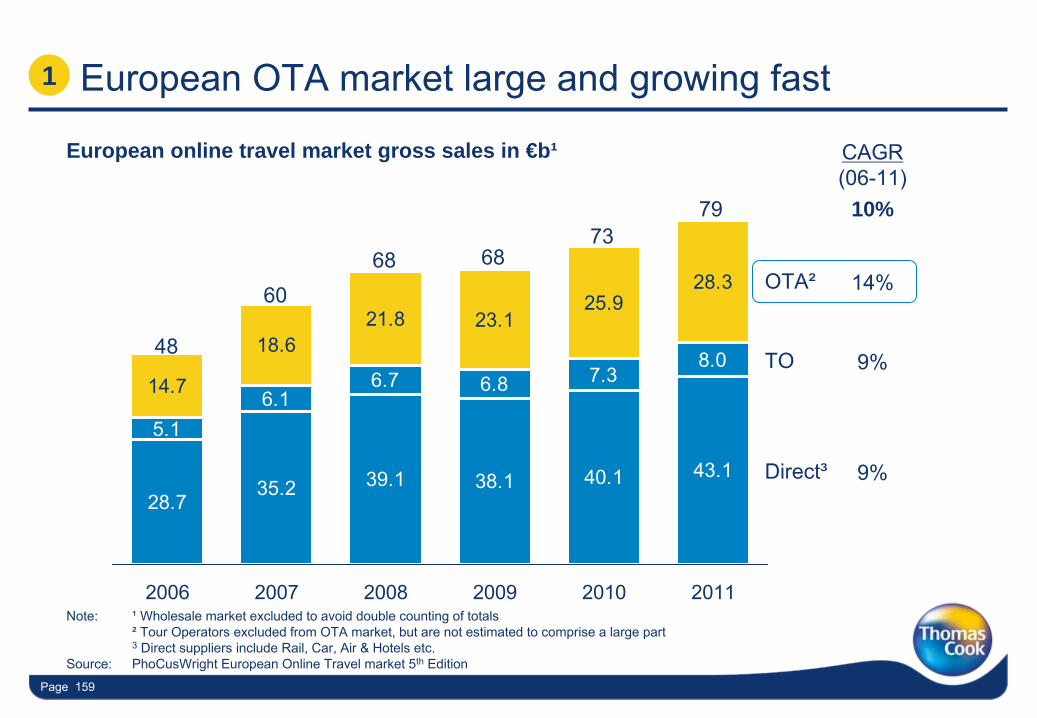
Page 159
28.735.2 39.1 38.1 40.1 43.1
5.16.1
6.7 6.8 7.38.0
14.7
18.621.8 23.1
25.928.3
2006 2007 2008 2009 2010 2011
79
European OTA market large and growing fast
European online travel market gross sales in €b¹
Note:
¹
Wholesale market excluded to avoid double counting of totals²
Tour Operators excluded from OTA market, but are not estimated to comprise a large part3
Direct suppliers include Rail, Car, Air & Hotels etc.Source: PhoCusWright
European Online Travel market 5th
Edition
CAGR(06-11)
9%
6873
6860
48
OTA²
Direct³
TO
9%
14%
10%
1
Page 160Page 160
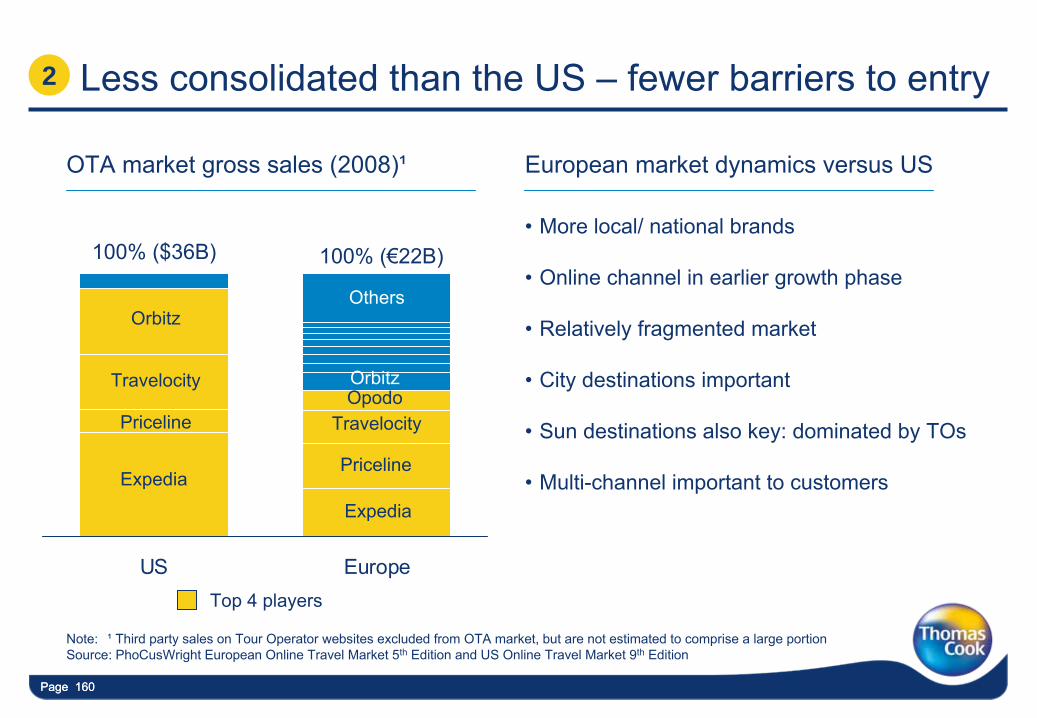
•
More local/ national brands
•
Online channel in earlier growth phase
•
Relatively fragmented market
•
City destinations important
•
Sun destinations also key: dominated by TOs
•
Multi-channel important to customers
Less consolidated than the US –
fewer barriers to entry
OTA market gross sales (2008)¹ European market dynamics versus US
2
Note:
¹
Third party sales on Tour Operator websites excluded from OTA market, but are not estimated to comprise a large portionSource: PhoCusWright
European Online Travel Market 5th
Edition and US Online Travel Market 9th
Edition
US Europe
100% (€22B)
Expedia
Priceline
TravelocityOpodo
100% ($36B)
Expedia
Priceline
Travelocity
Orbitz
Top 4 players
Orbitz
Others
Page 161Page 161
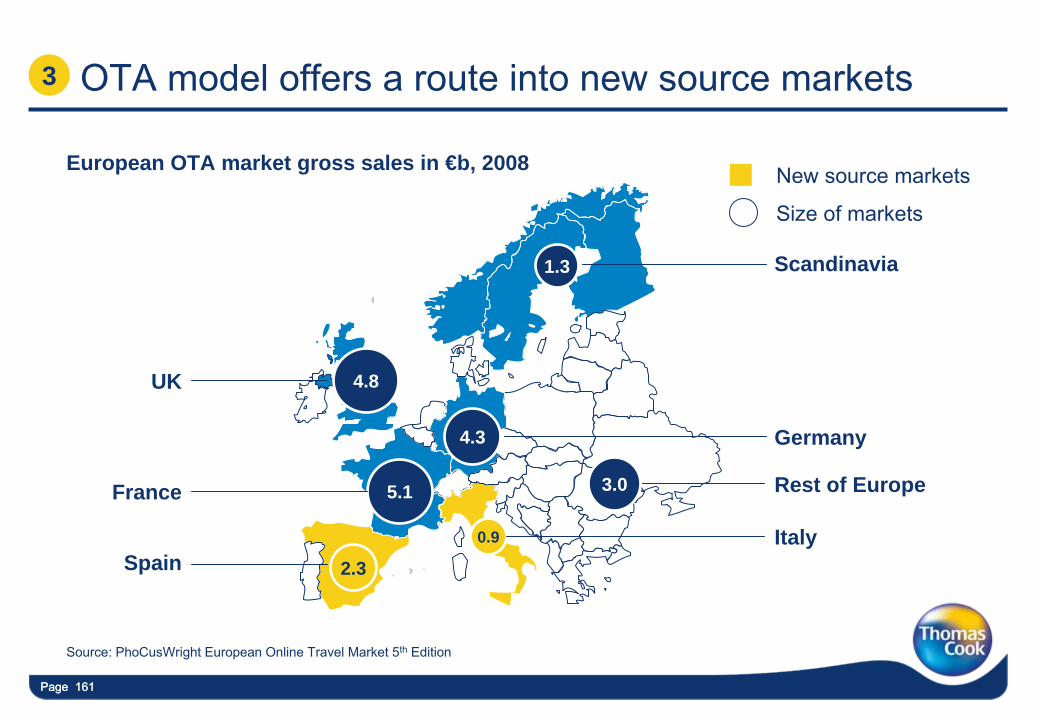
OTA model offers a route into new source markets
Source: PhoCusWright
European Online Travel Market 5th
Edition
3
1.3 Scandinavia
4.3 Germany
0.9
3.0 Rest of Europe
Italy2.3Spain
5.1France
4.8UK
New source markets
Size of markets
European OTA market gross sales in €b, 2008
Page 162
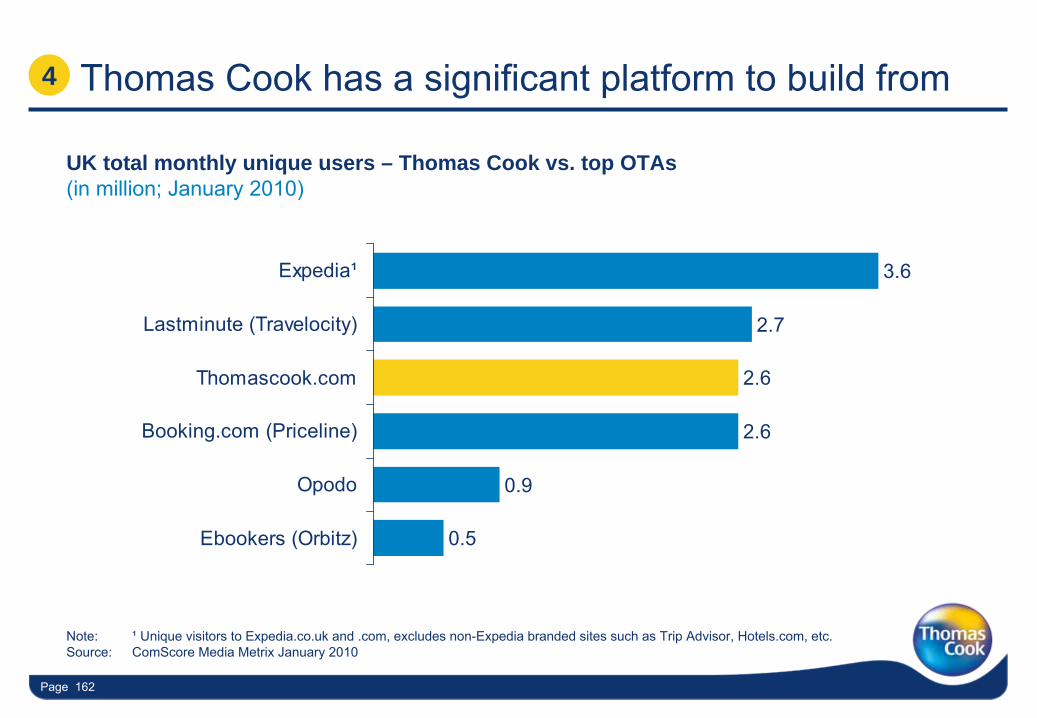
Thomas Cook has a significant platform to build from
UK total monthly unique users – Thomas Cook vs. top OTAs (in million; January 2010)
Note:
¹
Unique visitors to Expedia.co.uk
and .com, excludes non-Expedia branded sites such as Trip Advisor, Hotels.com, etc.Source: ComScore
Media Metrix
January 2010
4
0.5
0.9
2.6
2.6
2.7
3.6
Ebookers (Orbitz)
Opodo
Booking.com (Priceline)
Thomascook.com
Lastminute (Travelocity)
Expedia¹
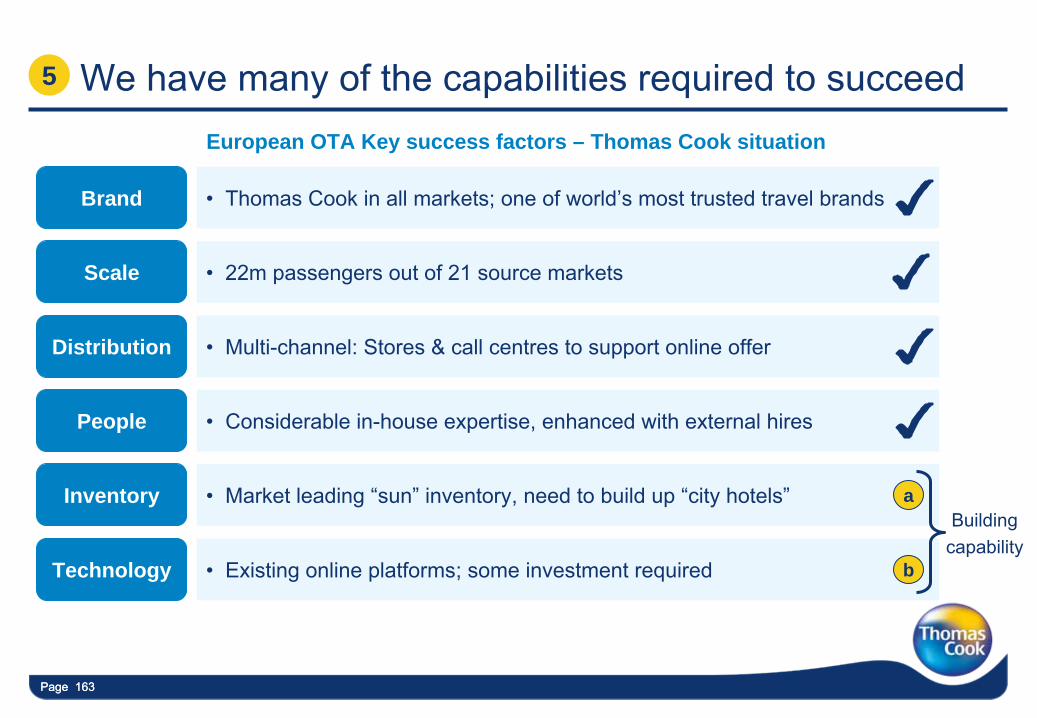
Page 163Page 163
We have many of the capabilities required to succeed
•
Market leading “sun”
inventory, need to build up “city hotels”Inventory a
•
Existing online platforms; some investment requiredTechnology b
European OTA Key success factors – Thomas Cook situation
•
Multi-channel: Stores & call centres to support online offerDistribution
•
Considerable in-house expertise, enhanced with external hiresPeople
•
Thomas Cook in all markets; one of world’s most trusted travel brandsBrand
•
22m passengers out of 21 source marketsScale
5
Building capability
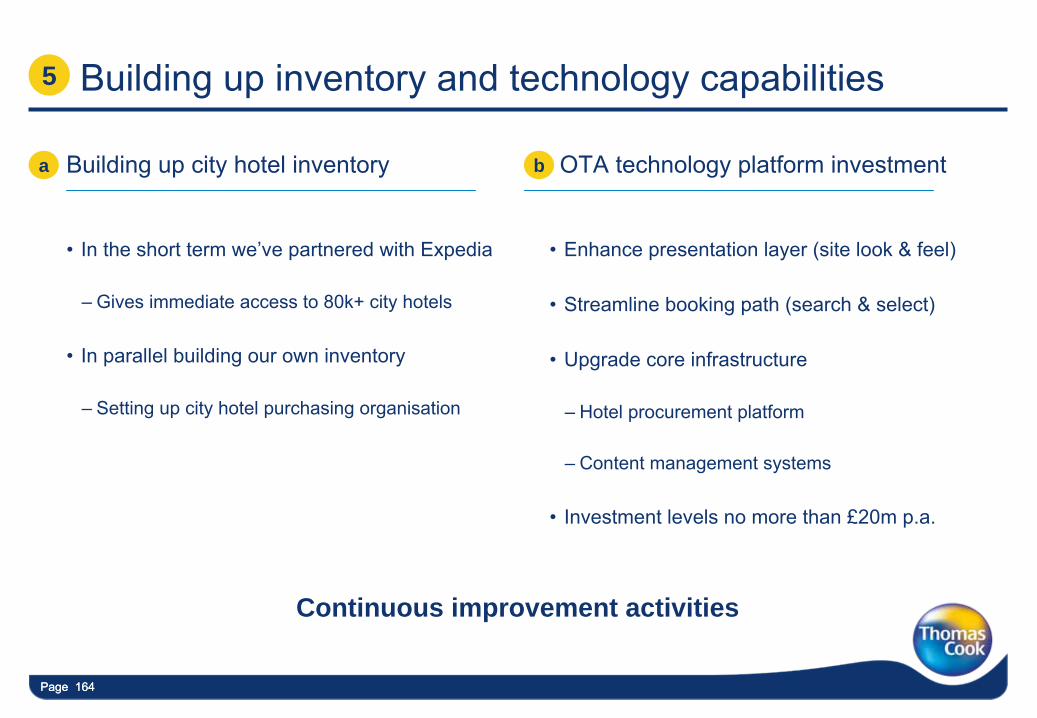
Page 164Page 164
Building up inventory and technology capabilities
Building up city hotel inventory OTA technology platform investmenta b
•
In the short term we’ve partnered with Expedia
–
Gives immediate access to 80k+ city hotels
•
In parallel building our own inventory
–
Setting up city hotel purchasing organisation
•
Enhance presentation layer (site look & feel)
•
Streamline booking path (search & select)
•
Upgrade core infrastructure
–
Hotel procurement platform
–
Content management systems
•
Investment levels no more than £20m p.a.
5
Continuous improvement activities
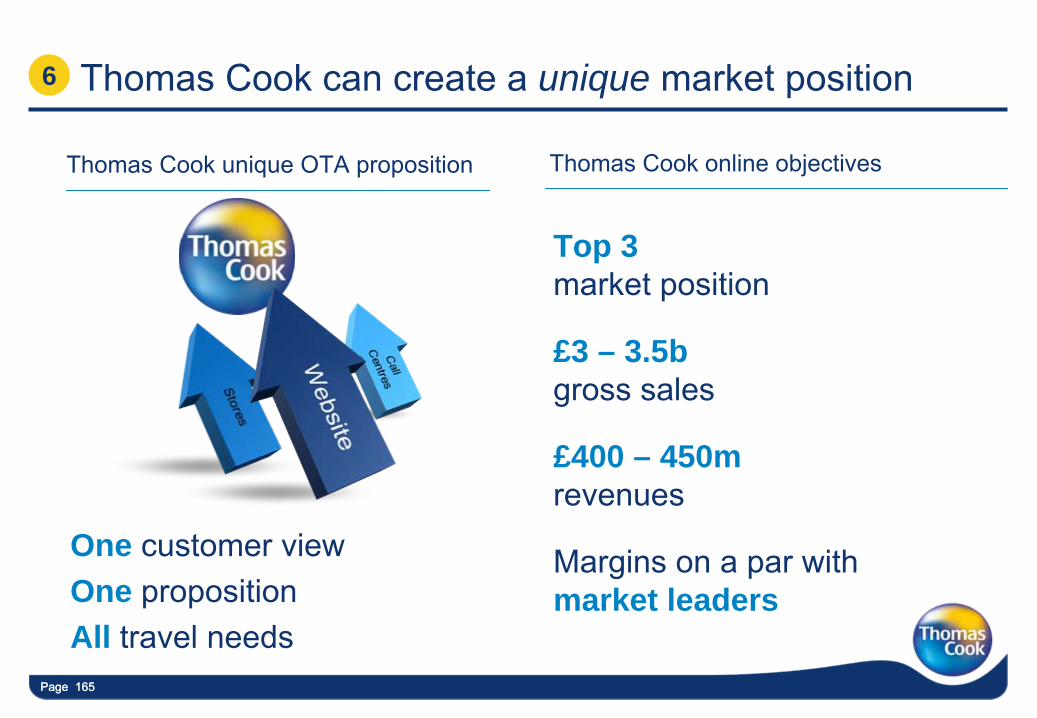
Page 165Page 165
Thomas Cook can create a unique market position
Thomas Cook unique OTA proposition Thomas Cook online objectives
6
Top 3 market position
£3 – 3.5b gross sales
£400 – 450m revenues
Margins on a par with market leaders
One customer viewOne propositionAll travel needs
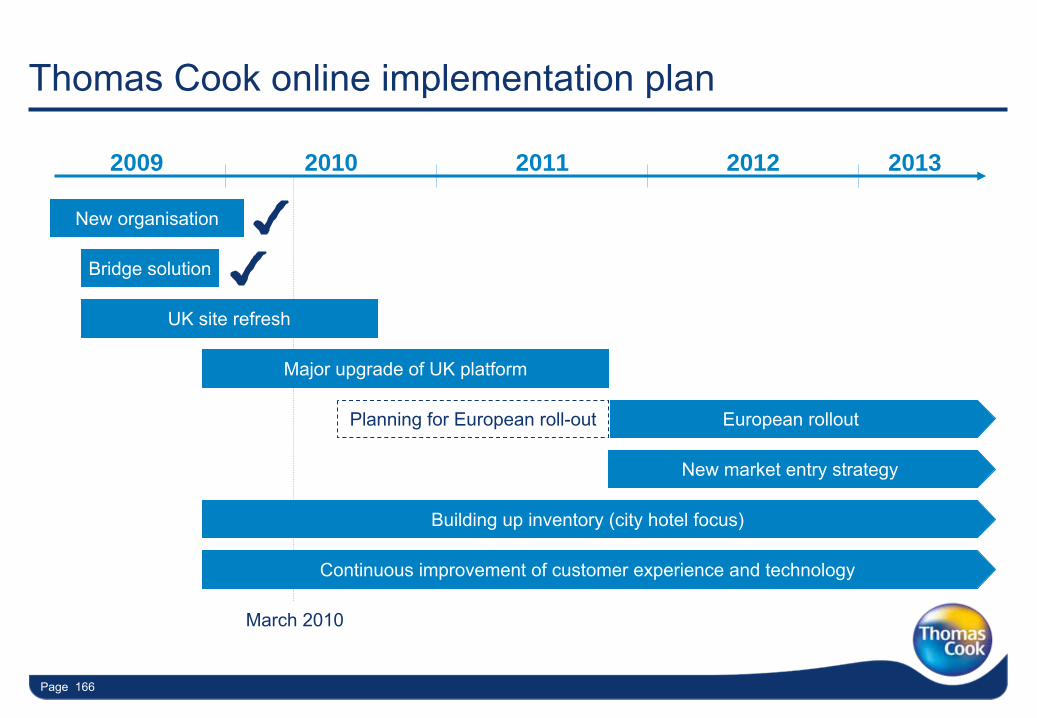
Page 166
Thomas Cook online implementation plan
2009 2010 2011
March 2010
New organisation
2012 2013
Bridge solution
UK site refresh
Major upgrade of UK platform
European rollout
Continuous improvement of customer experience and technology
Building up inventory (city hotel focus)
New market entry strategy
Planning for European roll-out
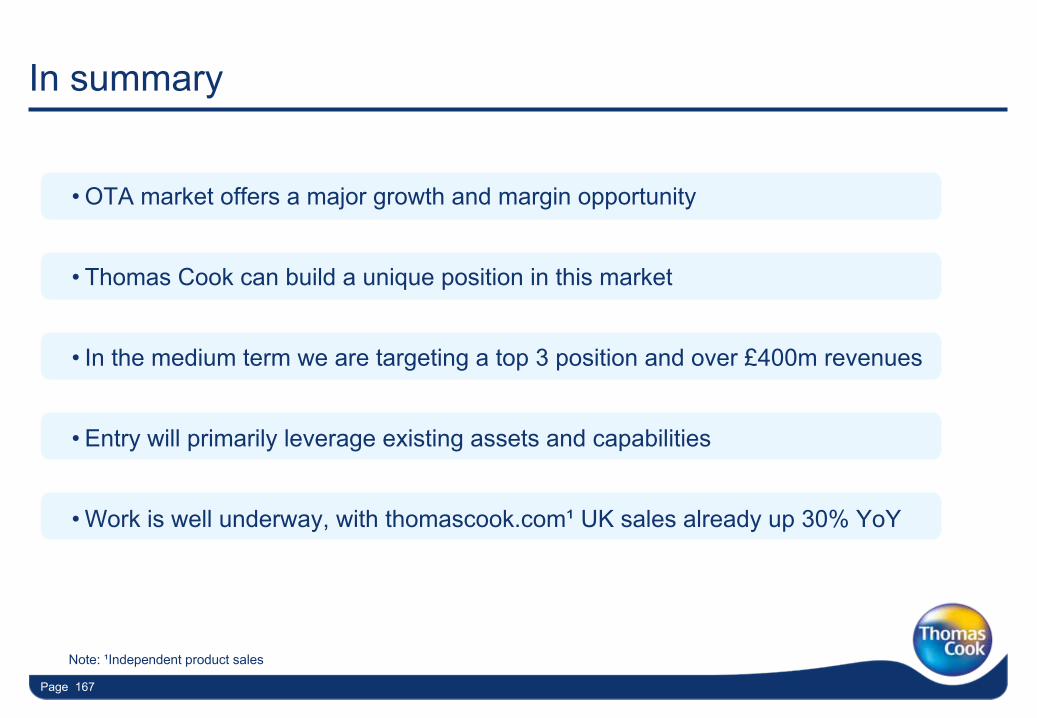
Page 167
In summary
•
OTA market offers a major growth and margin opportunity
•
Thomas Cook can build a unique position in this market
•
In the medium term we are targeting a top 3 position and over £400m revenues
•
Entry will primarily leverage existing assets and capabilities
•
Work is well underway, with thomascook.com¹
UK sales already up 30% YoY
Note: ¹Independent product sales

Summary and wrap-upManny Fontenla-Novoa, Group CEO
Page 169Page 169Page 169
•
One of the world’s leading travel and leisure companies
•
Highly talented and experienced management team
•
Strong market positions and great brands in all major source markets
•
Track record of delivering against strategy
•
Ability to successfully complete and integrate acquisitions
•
Market leading margins and clear path for continued top & bottom
line growth
Thomas Cook in summary

Page 170Page 170
We have the strategy, structure, people, brands, scale and ambition to
significantly grow top and bottom lines
Page 171
Thank you

Q&A
Page 173
Notes

Page 174
Notes
Page 175
Notes

Page 176
Notes
Page 177
Appendix– General segment information
– Strategic initiatives detail
– Other supporting information

Page 178
General segment information
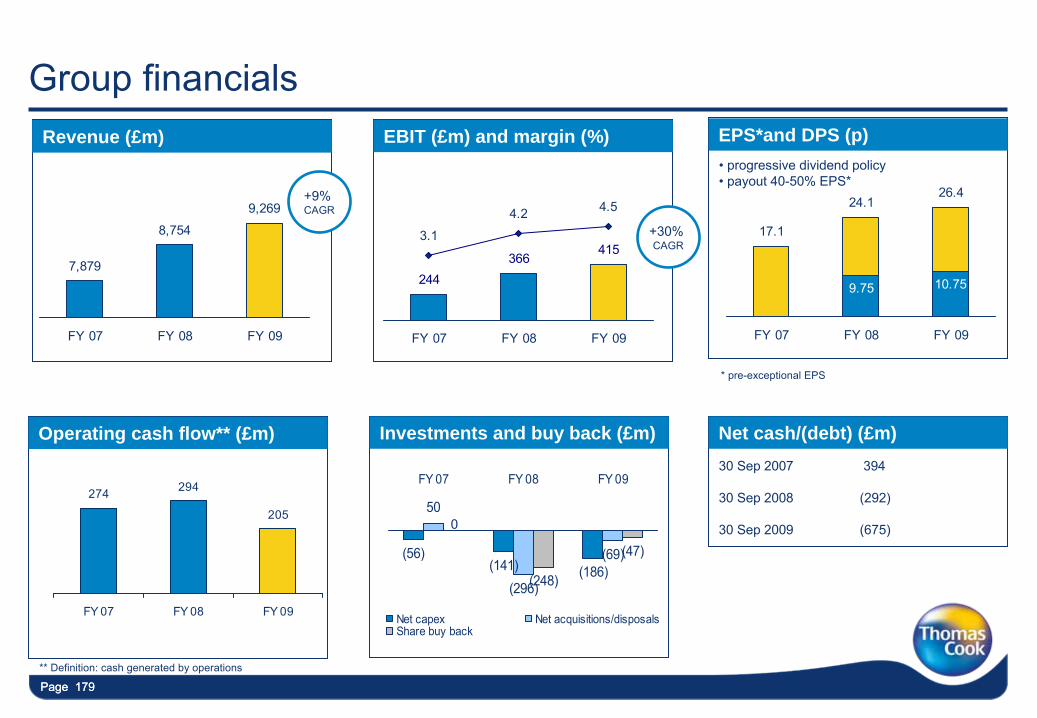
Page 179Page 179
Group financials
7,879
8,754
9,269
FY 07 FY 08 FY 09
244366
4153.1
4.2 4.5
FY 07 FY 08 FY 09
17.1
24.126.4
9.75 10.75
FY 07 FY 08 FY 09
274 294
205
FY 07 FY 08 FY 09
(56)(141) (186)
50
(296)
(69)
(248)
(47)
FY 07 FY 08 FY 09
Net capex Net acquisitions/disposalsShare buy back
Revenue - £m EBIT (£m) and margin (%)• progressive dividend policy• payout 40-50% EPS*
EPS*and DPS (p)
Operating cash flow** (£m) Investments and buy back (£m)30 Sep 2007
394
30 Sep 2008
(292)
30 Sep 2009
(675)
Net cash/(debt) (£m)
+9% CAGR
Revenue (£m)
+30% CAGR
* pre-exceptional EPS
0
** Definition: cash generated by operations
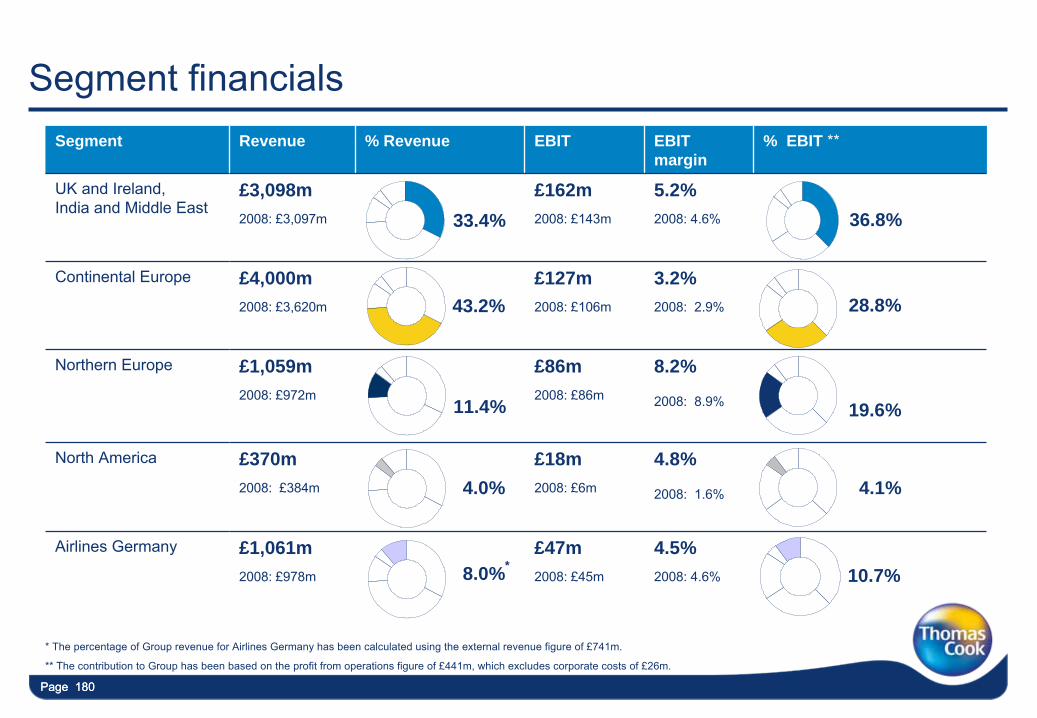
Page 180Page 180
Segment financialsSegment Revenue % Revenue EBIT EBIT
margin% EBIT **
UK and Ireland,India and Middle East
£3,098m2008: £3,097m
£162m2008: £143m
5.2%2008: 4.6%
Continental Europe £4,000m2008: £3,620m
£127m2008: £106m
3.2%2008: 2.9%
Northern Europe £1,059m2008: £972m
£86m2008: £86m
8.2%
2008: 8.9%
North America £370m2008: £384m
£18m2008: £6m
4.8%
2008: 1.6%
Airlines Germany £1,061m2008: £978m
£47m2008: £45m
4.5%2008: 4.6%
36.8%
28.8%
19.6%
4.1%
10.7%
33.4%
43.2%
11.4%
4.0%
8.0%*
* The percentage of Group revenue for Airlines Germany has been calculated using the external revenue figure of £741m.
** The contribution to Group has been based on the profit from operations figure of £441m, which excludes corporate costs of £26m.
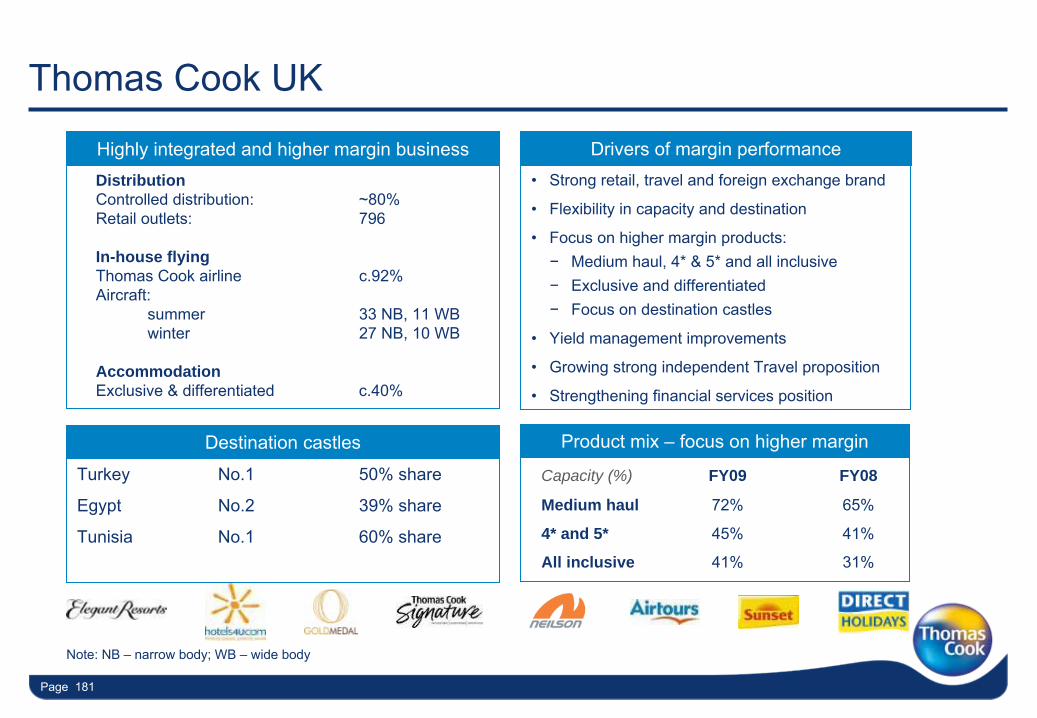
Page 181
Turkey
No.1 50% share
Egypt
No.2 39% share
Tunisia
No.1
60% share
Thomas Cook UK
Note: NB –
narrow body; WB –
wide body
Product mix –
focus on higher margin
Highly integrated and higher margin businessDistributionControlled distribution:
~80%Retail outlets: 796
In-house flyingThomas Cook airline
c.92%Aircraft:
summer
33 NB, 11 WBwinter
27 NB, 10 WB
AccommodationExclusive & differentiated
c.40%
Drivers of margin performance•
Strong retail, travel and foreign exchange brand
•
Flexibility in capacity and destination
•
Focus on higher margin products:−
Medium haul, 4* & 5* and all inclusive −
Exclusive and differentiated−
Focus on destination castles
•
Yield management improvements
•
Growing strong independent Travel proposition
•
Strengthening financial services position
Capacity (%) FY09 FY08
Medium haul 72% 65%
4* and 5* 45% 41%
All inclusive 41% 31%
Destination castles
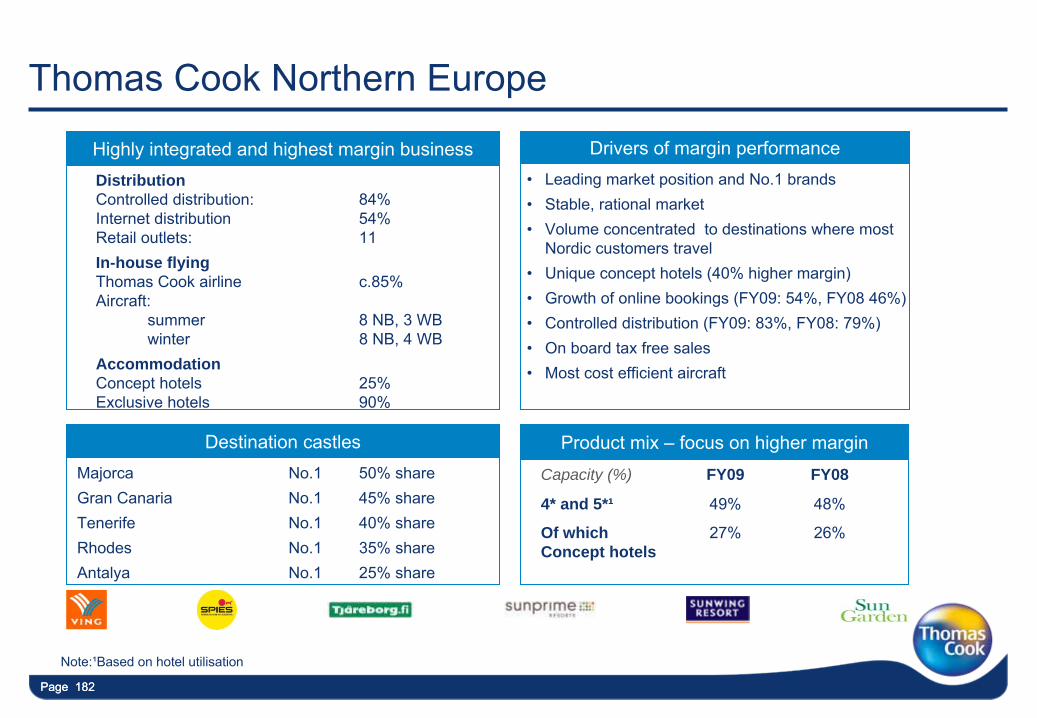
Page 182Page 182
DistributionControlled distribution:
84%Internet distribution 54%Retail outlets:
11In-house flyingThomas Cook airline
c.85%Aircraft:
summer
8 NB, 3 WBwinter
8 NB, 4 WBAccommodationConcept hotels
25%Exclusive hotels
90%
Majorca
No.1 50% shareGran Canaria
No.1 45% shareTenerife
No.1
40% shareRhodes
No.1
35% shareAntalya
No.1
25% share
Thomas Cook Northern Europe
Product mix –
focus on higher margin
Highly integrated and highest margin business Drivers of margin performance•
Leading market position and No.1 brands•
Stable, rational market•
Volume concentrated to destinations where most Nordic customers travel
•
Unique concept hotels (40% higher margin)•
Growth of online bookings (FY09: 54%, FY08 46%)•
Controlled distribution (FY09: 83%, FY08: 79%)•
On board tax free sales•
Most cost efficient aircraft
Capacity (%) FY09 FY08
4* and 5*¹ 49% 48%
Of which Concept hotels
27% 26%
Destination castles
Note:¹Based on hotel utilisation
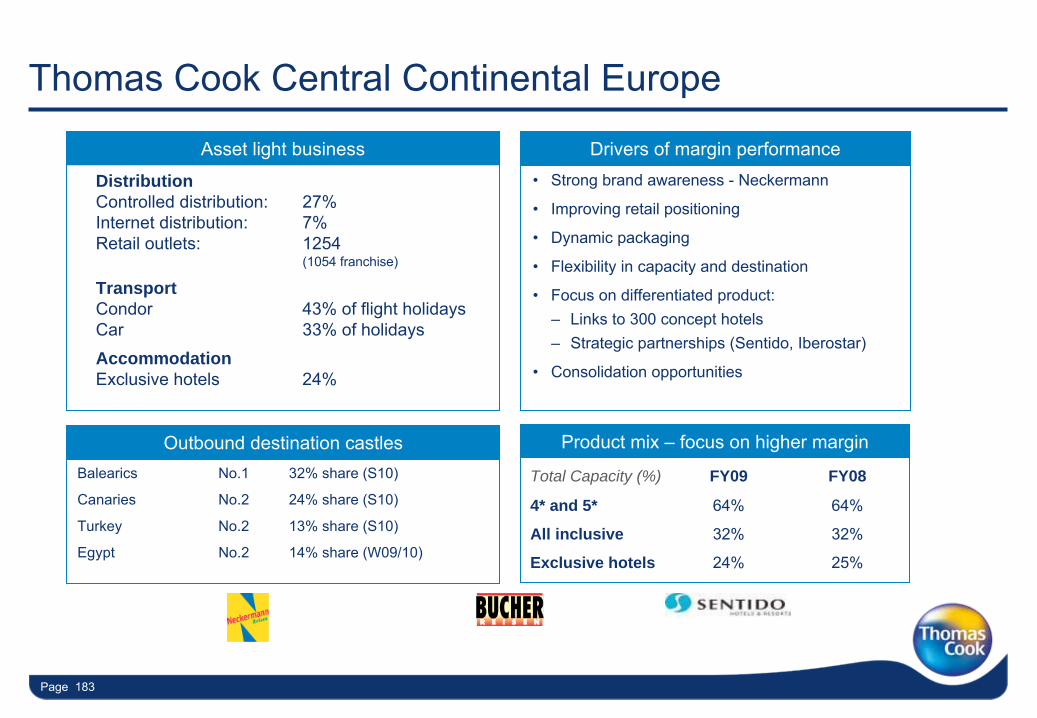
Page 183
Thomas Cook Central Continental Europe
Product mix –
focus on higher margin
Asset light business
DistributionControlled distribution:
27%Internet distribution:
7% Retail outlets: 1254
(1054 franchise)
TransportCondor
43% of flight holidaysCar
33% of holidaysAccommodationExclusive hotels
24%
Drivers of margin performance•
Strong brand awareness -
Neckermann
•
Improving retail positioning
•
Dynamic packaging
•
Flexibility in capacity and destination
•
Focus on differentiated product:–
Links to 300 concept hotels–
Strategic partnerships (Sentido, Iberostar)
•
Consolidation opportunities
Total Capacity (%) FY09 FY08
4* and 5* 64% 64%
All inclusive 32% 32%
Exclusive hotels 24% 25%
Outbound destination castlesBalearics
No.1 32% share (S10)
Canaries
No.2 24% share (S10)
Turkey
No.2
13% share (S10)
Egypt
No.2
14% share (W09/10)
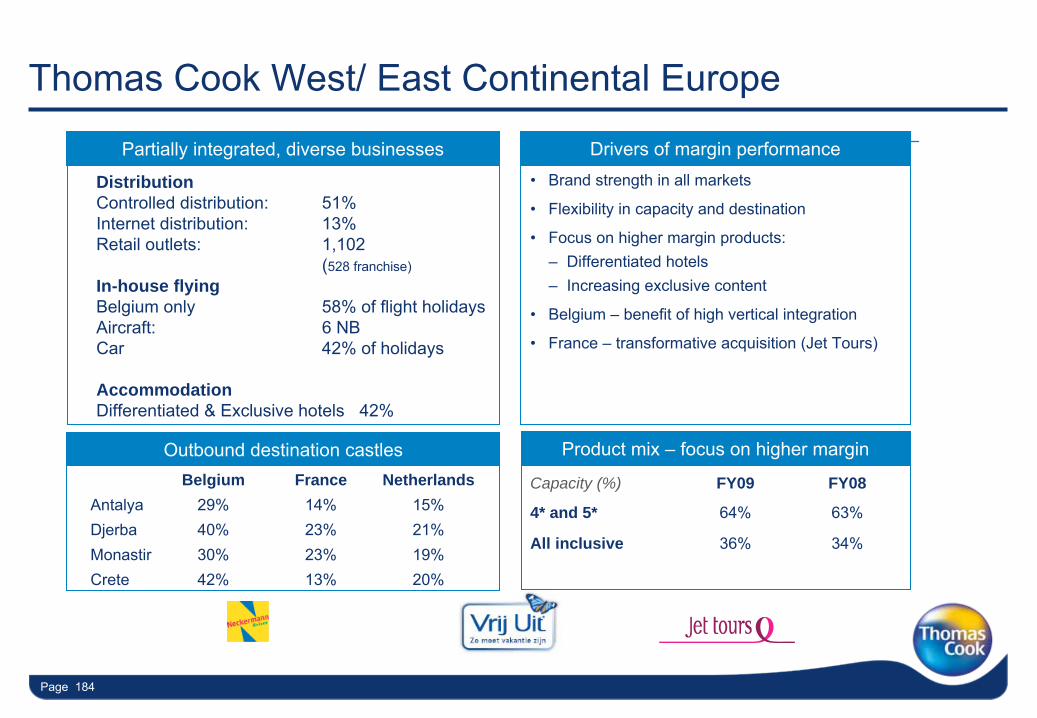
Page 184
Thomas Cook West/ East Continental Europe
Product mix –
focus on higher margin
Partially integrated, diverse businesses
Distribution Controlled distribution:
51%Internet distribution:
13% Retail outlets: 1,102
(528 franchise)In-house flyingBelgium only
58% of flight holidaysAircraft: 6 NBCar
42% of holidays
AccommodationDifferentiated & Exclusive hotels
42%
Drivers of margin performance•
Brand strength in all markets
•
Flexibility in capacity and destination
•
Focus on higher margin products: –
Differentiated hotels–
Increasing exclusive content
•
Belgium –
benefit of high vertical integration
•
France –
transformative acquisition (Jet Tours)
Capacity (%) FY09 FY08
4* and 5* 64% 63%
All inclusive 36% 34%
Outbound destination castlesBelgium France Netherlands
Antalya 29% 14% 15%Djerba 40% 23% 21%Monastir 30% 23% 19%Crete 42% 13% 20%
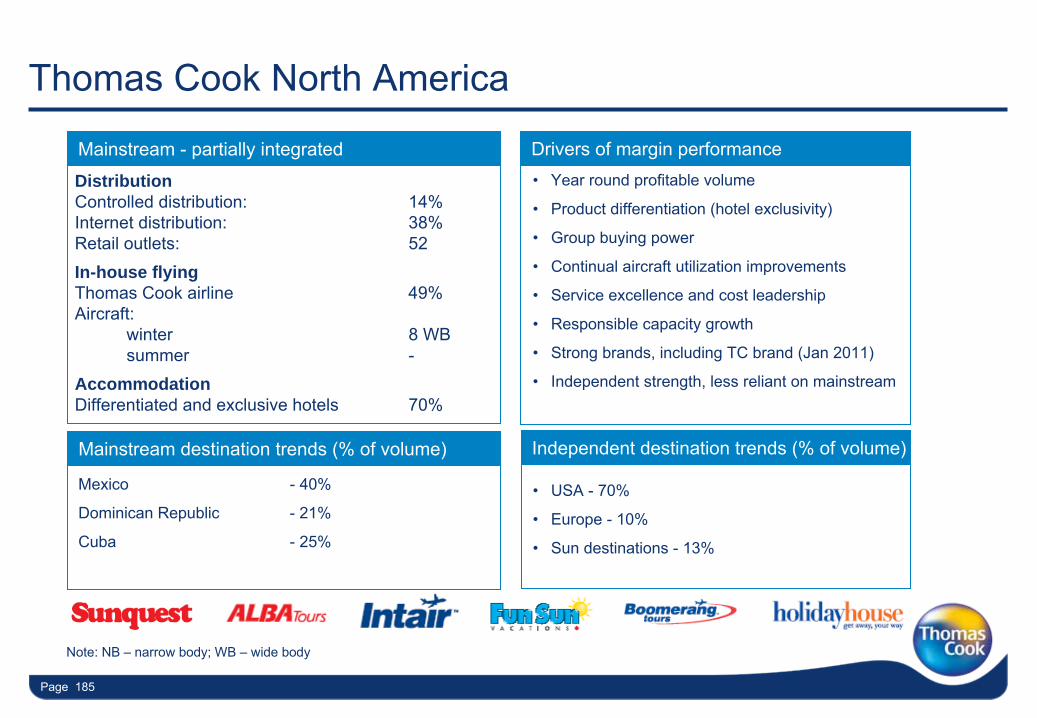
Page 185
DistributionControlled distribution:
14%Internet distribution:
38% Retail outlets: 52In-house flyingThomas Cook airline
49%Aircraft:
winter
8 WBsummer
-AccommodationDifferentiated and exclusive hotels
70%
Thomas Cook North America
Independent destination trends (% of volume)
Mainstream -
partially integrated Drivers of margin performance•
Year round profitable volume
•
Product differentiation (hotel exclusivity)
•
Group buying power
•
Continual aircraft utilization improvements
•
Service excellence and cost leadership
•
Responsible capacity growth
•
Strong brands, including TC brand (Jan 2011)
•
Independent strength, less reliant on mainstream
Mainstream destination trends (% of volume)
Mexico - 40%
Dominican Republic -
21%
Cuba - 25%
•
USA -
70%
•
Europe -
10%
•
Sun destinations -
13%
Note: NB –
narrow body; WB –
wide body
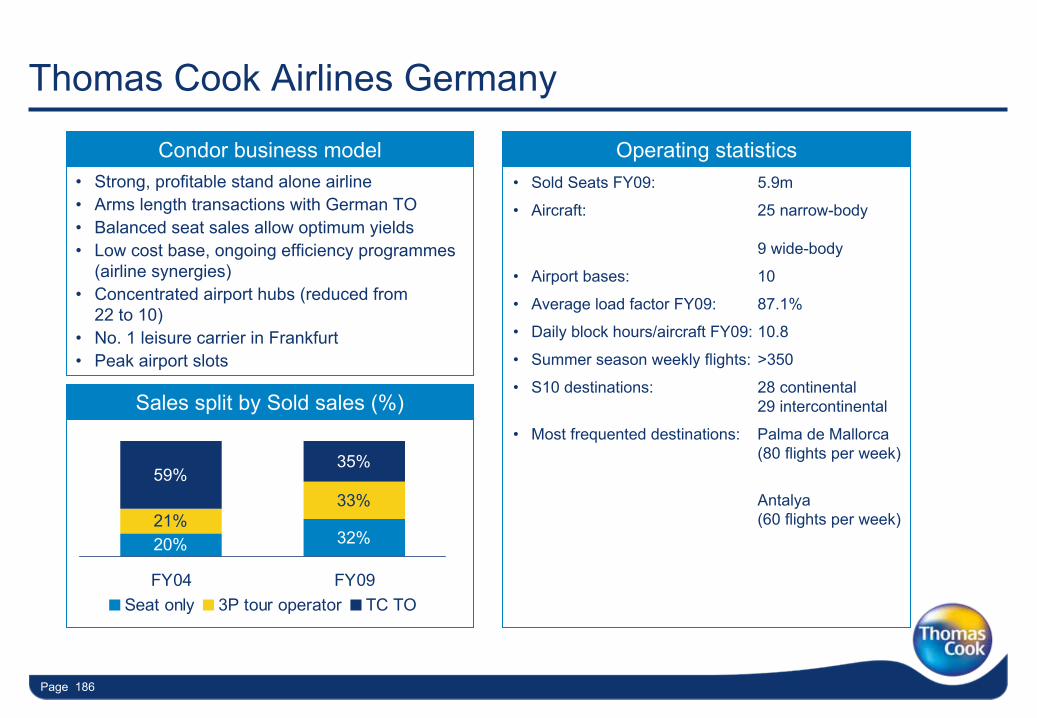
Page 186
Thomas Cook Airlines Germany
Condor business model
Sales split by Sold sales (%)
•
Sold Seats FY09: 5.9m
•
Aircraft: 25 narrow-body
9 wide-body
•
Airport bases:
10
•
Average load factor FY09: 87.1%
•
Daily block hours/aircraft FY09:
10.8
•
Summer season weekly flights: >350
•
S10 destinations: 28 continental
29 intercontinental
•
Most frequented destinations: Palma de Mallorca
(80 flights per week)
Antalya
(60 flights per week)
Operating statistics
20% 32%21%
33%59%
35%
FY04 FY09Seat only 3P tour operator TC TO
•
Strong, profitable stand alone airline•
Arms length transactions with German TO•
Balanced seat sales allow optimum yields•
Low cost base, ongoing efficiency programmes (airline synergies)
•
Concentrated airport hubs (reduced from 22 to 10)
•
No. 1 leisure carrier in Frankfurt•
Peak airport slots
Page 187
Strategic initiatives detail
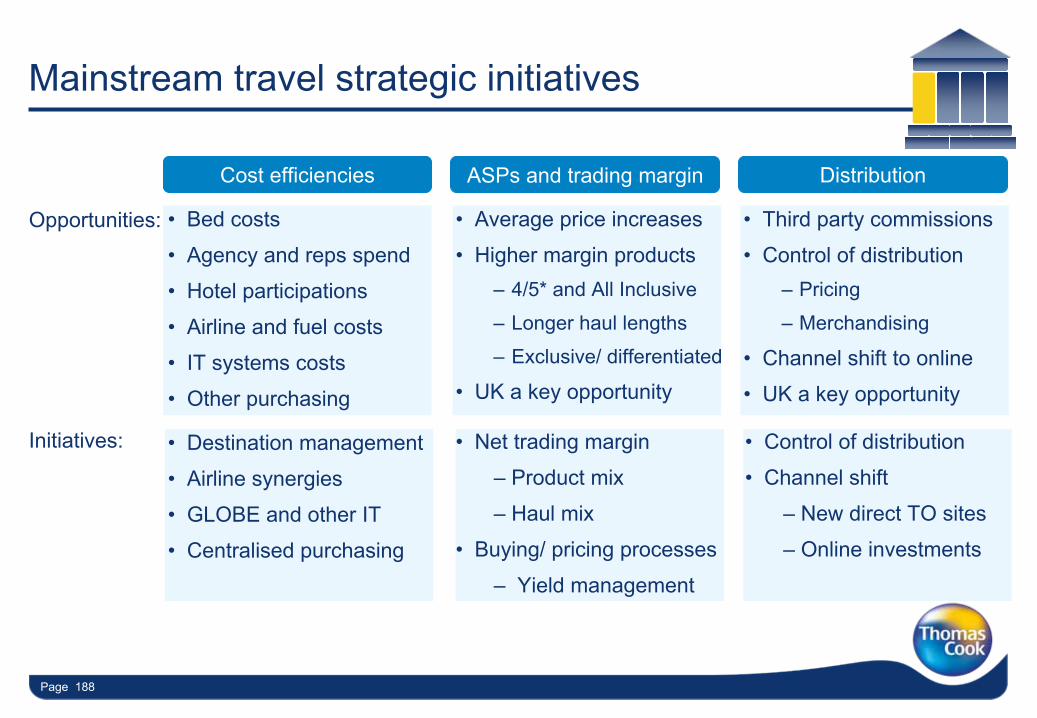
Page 188
Mainstream travel strategic initiatives
Cost efficiencies ASPs and trading margin Distribution
Opportunities: •
Bed costs
•
Agency and reps spend
•
Hotel participations
•
Airline and fuel costs
•
IT systems costs
•
Other purchasing
•
Average price increases
•
Higher margin products–
4/5* and All Inclusive
–
Longer haul lengths
–
Exclusive/ differentiated
•
UK a key opportunity
•
Third party commissions
•
Control of distribution–
Pricing
–
Merchandising
•
Channel shift to online
•
UK a key opportunity
•
Destination management
•
Airline synergies
•
GLOBE and other IT
•
Centralised purchasing
•
Net trading margin
–
Product mix
–
Haul mix
•
Buying/ pricing processes
–
Yield management
•
Control of distribution
•
Channel shift
–
New direct TO sites
–
Online investments
Initiatives:
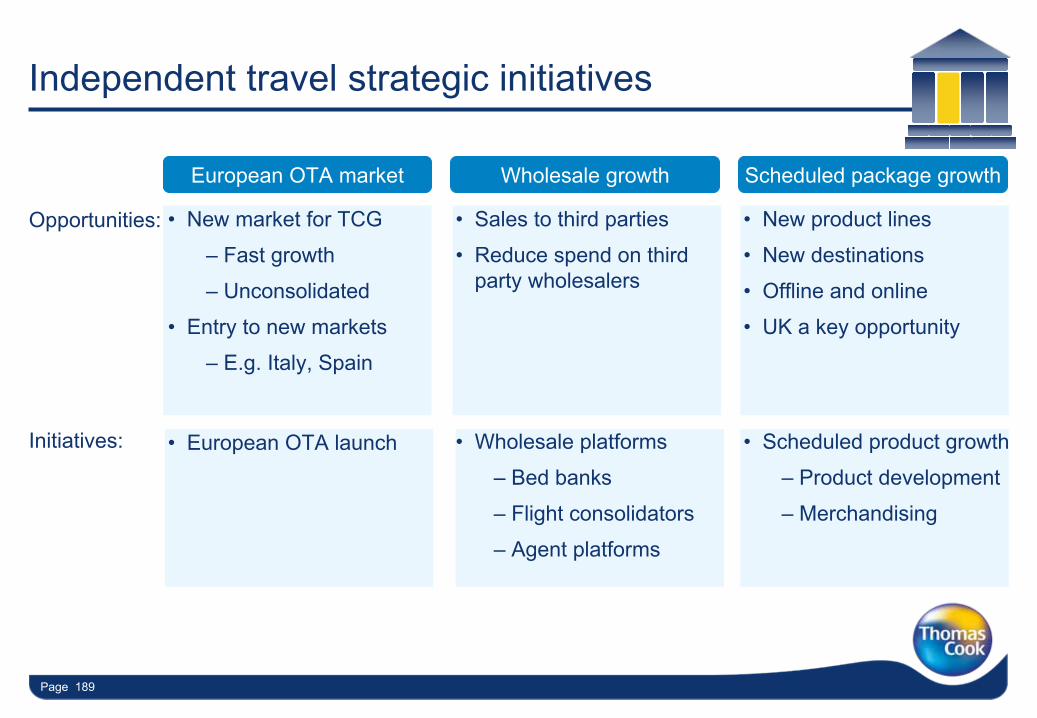
Page 189
Independent travel strategic initiatives
European OTA market Wholesale growth Scheduled package growth
Opportunities:
Initiatives:
•
New market for TCG
–
Fast growth
–
Unconsolidated
•
Entry to new markets
–
E.g. Italy, Spain
•
Sales to third parties
•
Reduce spend on third
party wholesalers
•
New product lines
•
New destinations
•
Offline and online
•
UK a key opportunity
•
European OTA launch •
Wholesale platforms
–
Bed banks
–
Flight consolidators
–
Agent platforms
•
Scheduled product growth
–
Product development
–
Merchandising
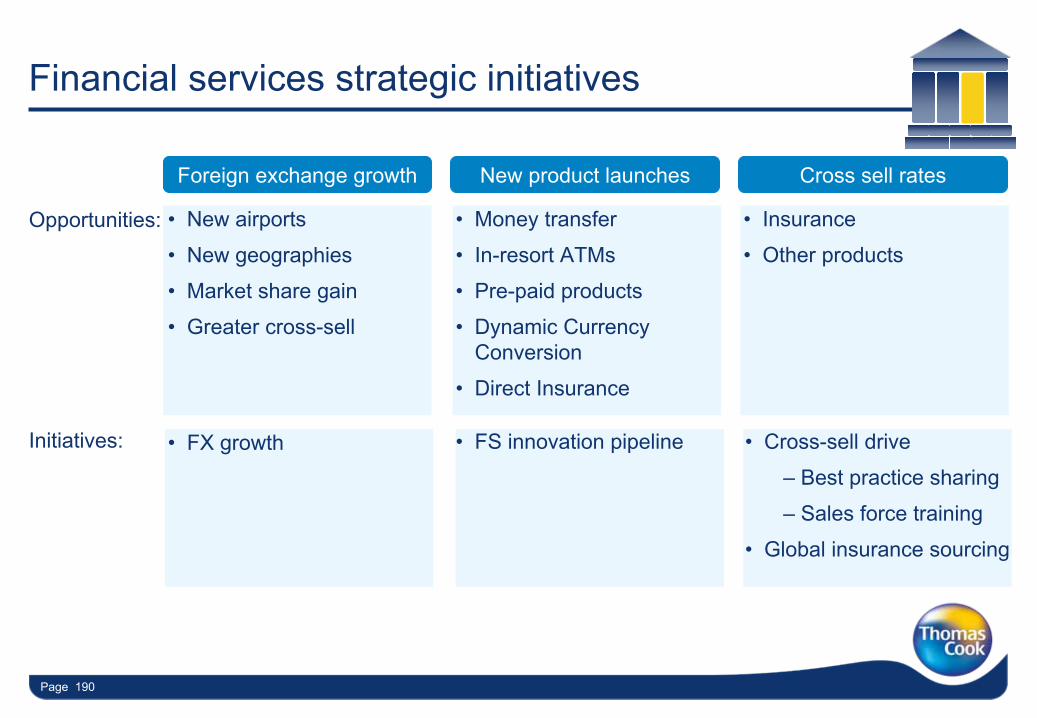
Page 190
Financial services strategic initiatives
Foreign exchange growth New product launches Cross sell rates
•
New airports
•
New geographies
•
Market share gain
•
Greater cross-sell
•
Money transfer
•
In-resort ATMs
•
Pre-paid products
•
Dynamic Currency Conversion
•
Direct Insurance
•
Insurance
•
Other products
•
FX growth •
FS innovation pipeline •
Cross-sell drive
–
Best practice sharing
–
Sales force training
•
Global insurance sourcing
Opportunities:
Initiatives:
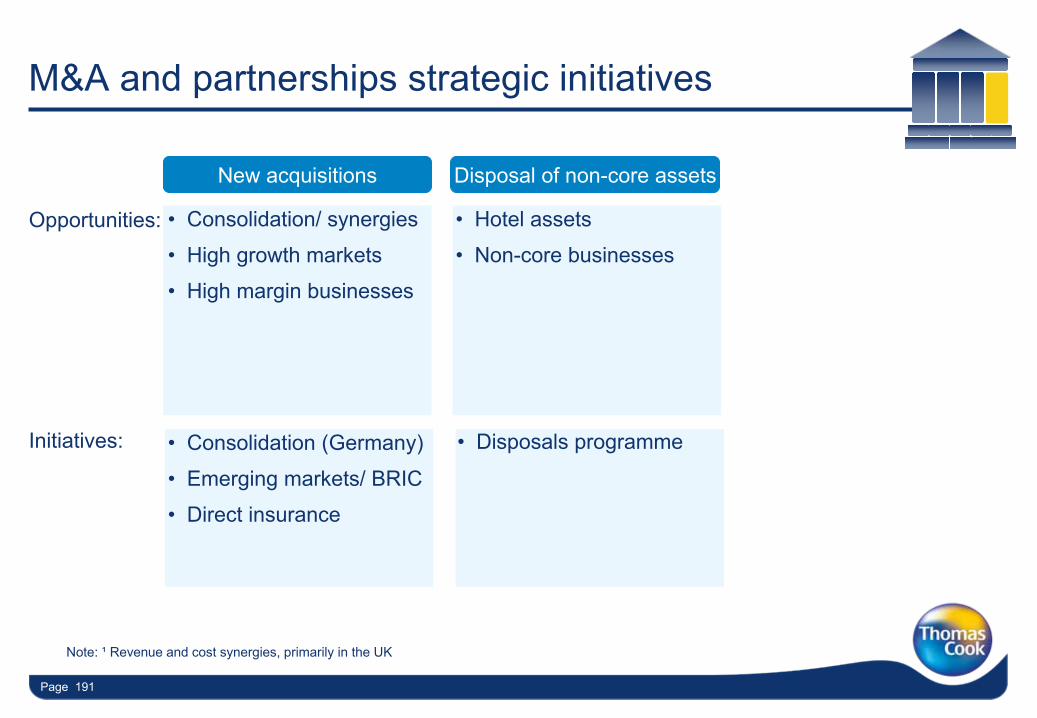
Page 191
Disposal of non-core assets
•
Hotel assets
•
Non-core businesses
•
Disposals programme
M&A and partnerships strategic initiatives
New acquisitions
•
Consolidation/ synergies
•
High growth markets
•
High margin businesses
•
Consolidation (Germany)
•
Emerging markets/ BRIC
•
Direct insurance
Note: ¹
Revenue and cost synergies, primarily in the UK
Opportunities:
Initiatives:

Page 192
Other supporting information
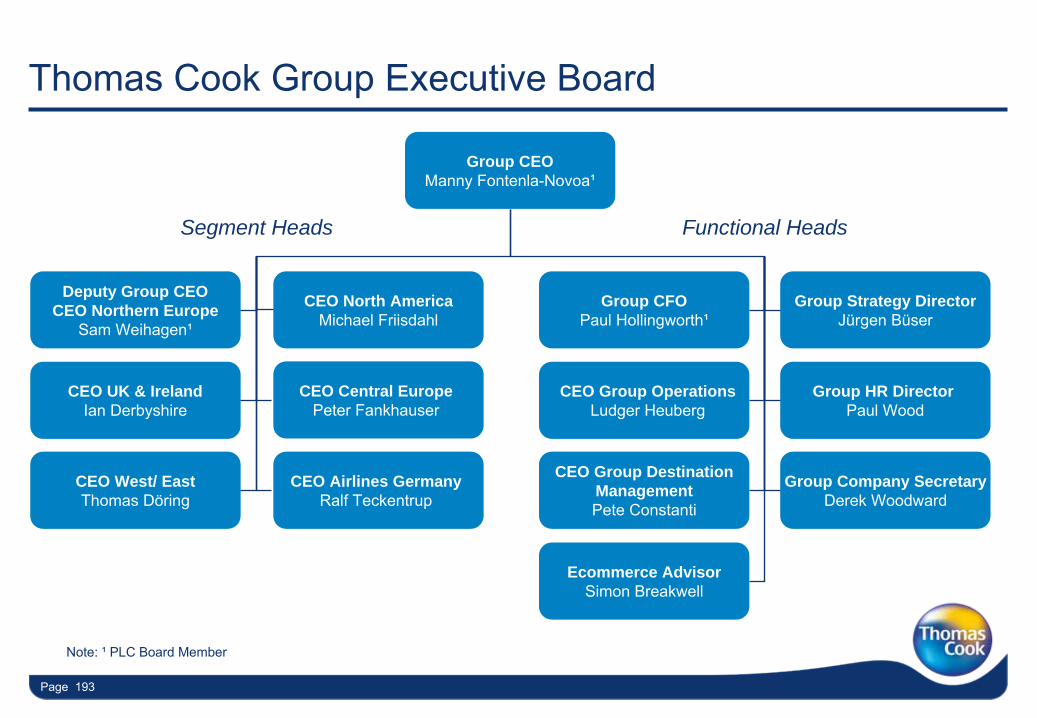
Page 193
CEO Airlines GermanyRalf Teckentrup
CEO Group OperationsLudger Heuberg
CEO UK & IrelandIan Derbyshire
Group CFOPaul Hollingworth¹
Group HR Director Paul Wood
CEO Group Destination ManagementPete Constanti
Group Strategy DirectorJürgen Büser
Deputy Group CEOCEO Northern Europe
Sam Weihagen¹
Group Company SecretaryDerek Woodward
CEO West/ EastThomas Döring
CEO Central EuropePeter Fankhauser
CEO North AmericaMichael Friisdahl
Group CEOManny Fontenla-Novoa¹
Thomas Cook Group Executive Board
Note: ¹
PLC Board Member
Segment Heads Functional Heads
Ecommerce AdvisorSimon Breakwell
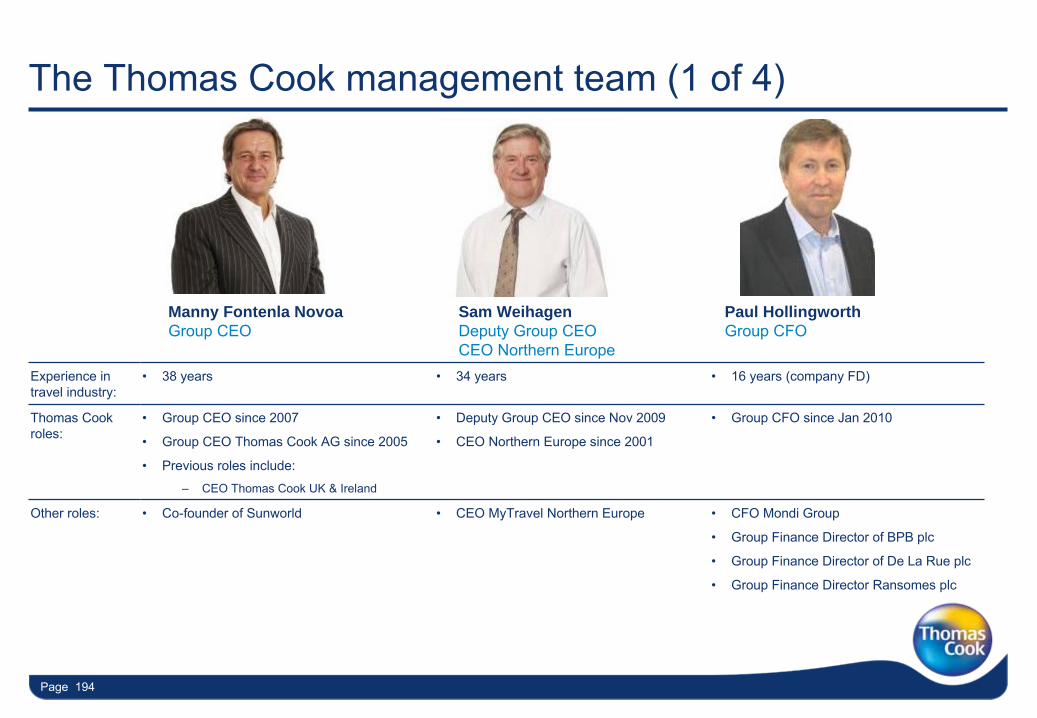
Page 194
The Thomas Cook management team (1 of 4)
Sam WeihagenDeputy Group CEO
CEO Northern Europe
Experience in travel industry:
•
38 years •
34 years •
16 years (company FD)
Thomas Cook roles:
•
Group CEO since 2007
•
Group CEO Thomas Cook AG since 2005
•
Previous roles include:
–
CEO Thomas Cook UK & Ireland
•
Deputy Group CEO since Nov 2009
•
CEO Northern Europe since 2001
•
Group CFO since Jan 2010
Other roles: •
Co-founder of Sunworld •
CEO MyTravel Northern Europe •
CFO Mondi Group
•
Group Finance Director of BPB plc
•
Group Finance Director of De La Rue plc
•
Group Finance Director Ransomes
plc
Paul HollingworthGroup CFO
Manny Fontenla NovoaGroup CEO
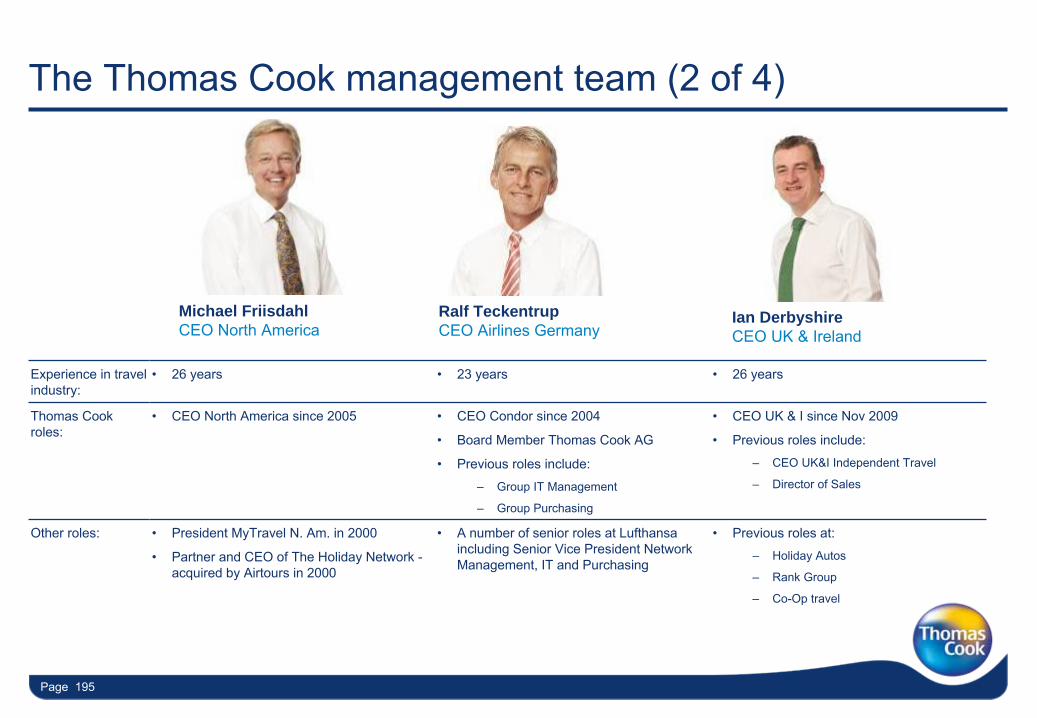
Page 195
The Thomas Cook management team (2 of 4)
Michael Friisdahl CEO North America
Ralf TeckentrupCEO Airlines Germany
Experience in travel industry:
•
26 years •
23 years •
26 years
Thomas Cook roles:
•
CEO North America since 2005 •
CEO Condor since 2004
•
Board Member Thomas Cook AG
•
Previous roles include:
–
Group IT Management
–
Group Purchasing
•
CEO UK & I since Nov 2009
•
Previous roles include:
–
CEO UK&I Independent Travel
–
Director of Sales
Other roles: •
President MyTravel N. Am. in 2000
•
Partner and CEO of The Holiday Network -
acquired by Airtours in 2000
•
A number of senior roles at Lufthansa including Senior Vice President Network Management, IT and Purchasing
•
Previous roles at:
–
Holiday Autos
–
Rank Group
–
Co-Op travel
Ian DerbyshireCEO UK & Ireland
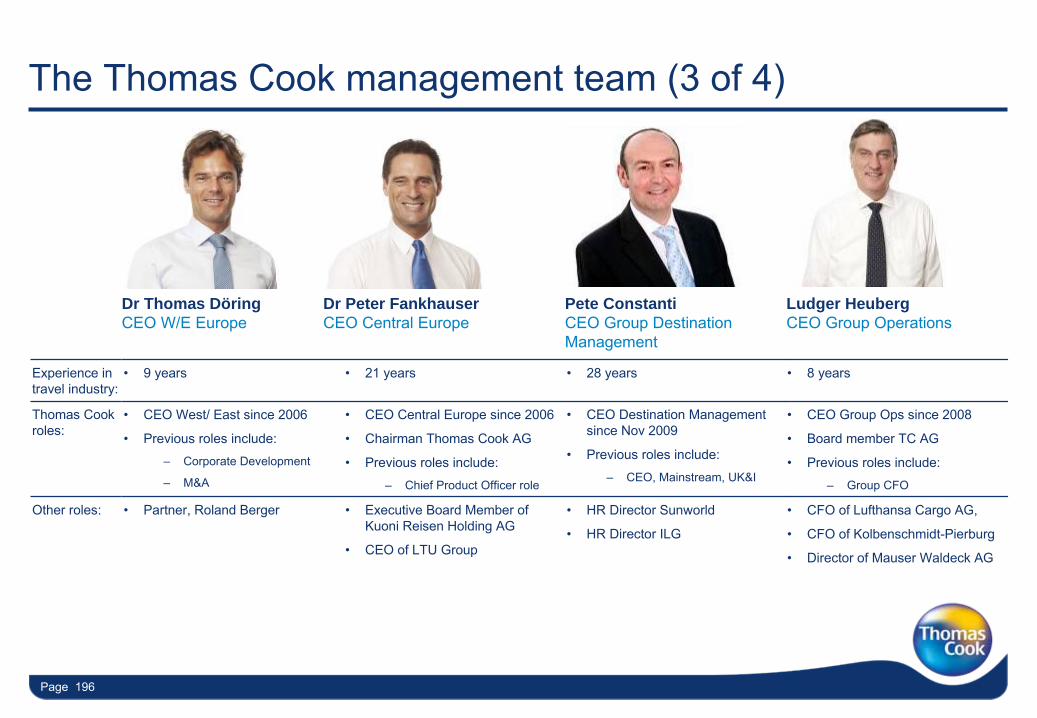
Page 196
Ludger HeubergCEO Group Operations
The Thomas Cook management team (3 of 4)
Pete ConstantiCEO Group Destination
Management
Experience in travel industry:
•
9 years •
21 years •
28 years •
8 years
Thomas Cook roles:
•
CEO West/ East since 2006
•
Previous roles include:
–
Corporate Development
–
M&A
•
CEO Central Europe since 2006
•
Chairman Thomas Cook AG
•
Previous roles include:
–
Chief Product Officer role
•
CEO Destination Management since Nov 2009
•
Previous roles include:
–
CEO, Mainstream, UK&I
•
CEO Group Ops since 2008
•
Board member TC AG
•
Previous roles include:
–
Group CFO
Other roles: •
Partner, Roland Berger •
Executive Board Member of Kuoni
Reisen
Holding AG
•
CEO of LTU Group
•
HR Director Sunworld
•
HR Director ILG
•
CFO of Lufthansa Cargo AG,
•
CFO of Kolbenschmidt-Pierburg
•
Director of Mauser
Waldeck
AG
Dr Thomas Döring CEO W/E Europe
Dr Peter FankhauserCEO Central Europe
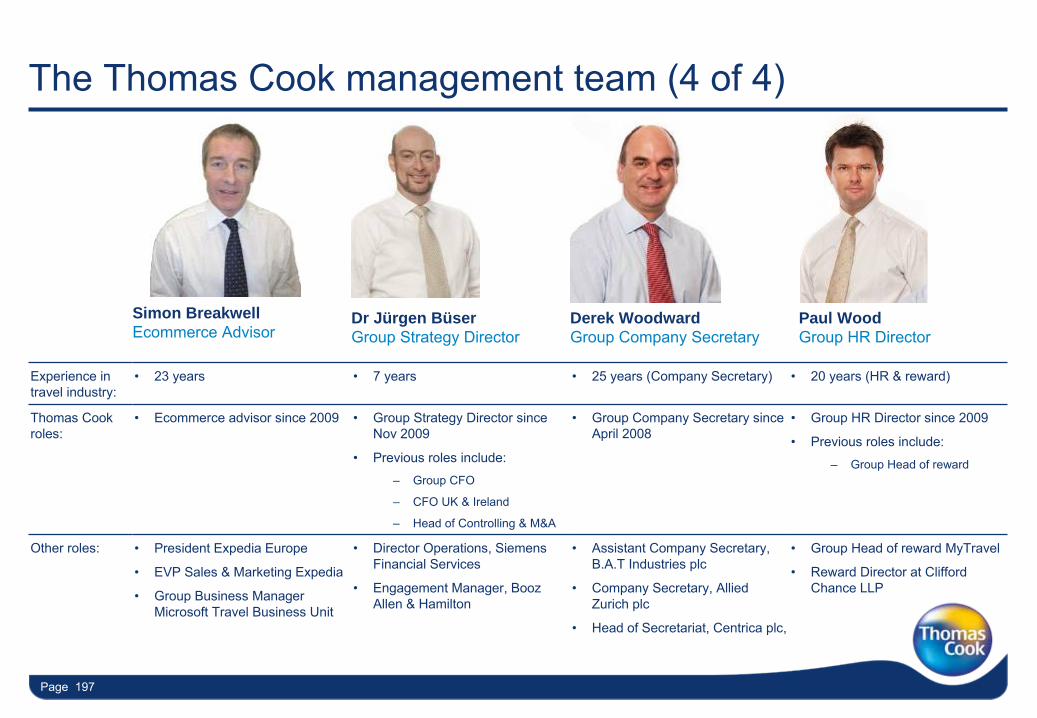
Page 197
The Thomas Cook management team (4 of 4)
Experience in travel industry:
•
23 years •
7 years •
25 years (Company Secretary) •
20 years (HR & reward)
Thomas Cook roles:
•
Ecommerce advisor since 2009 •
Group Strategy Director since Nov 2009
•
Previous roles include:
–
Group CFO
–
CFO UK & Ireland
–
Head of Controlling & M&A
•
Group Company Secretary since April 2008
•
Group HR Director since 2009
•
Previous roles include:
–
Group Head of reward
Other roles: •
President Expedia Europe
•
EVP Sales & Marketing Expedia
•
Group Business Manager Microsoft Travel Business Unit
•
Director Operations, Siemens Financial Services
•
Engagement Manager, Booz Allen & Hamilton
•
Assistant Company Secretary, B.A.T Industries plc
•
Company Secretary, Allied Zurich plc
•
Head of Secretariat, Centrica plc,
•
Group Head of reward MyTravel
•
Reward Director at Clifford Chance LLP
Simon BreakwellEcommerce Advisor
Dr Jürgen Büser Group Strategy Director
Paul Wood Group HR Director
Derek WoodwardGroup Company Secretary
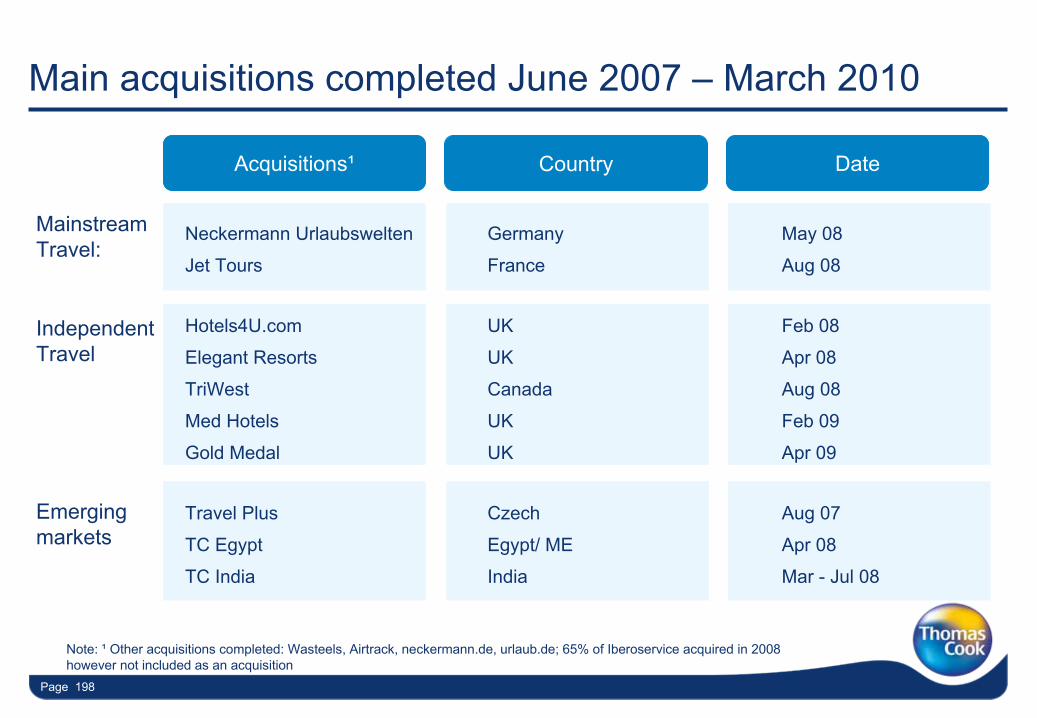
Page 198
Main acquisitions completed June 2007 –
March 2010
Acquisitions¹ Country Date
Mainstream Travel:
Independent Travel
Emerging markets
Neckermann
Urlaubswelten Germany May 08
Jet Tours France Aug 08
Hotels4U.com UK Feb 08
Elegant Resorts UK Apr 08
TriWest Canada Aug 08
Med Hotels UK Feb 09
Gold Medal UK Apr 09
Travel Plus Czech Aug 07
TC Egypt Egypt/ ME Apr 08
TC India India Mar -
Jul 08
Note: ¹
Other acquisitions completed: Wasteels, Airtrack, neckermann.de, urlaub.de; 65% of Iberoservice acquired in 2008 however not included as an acquisition
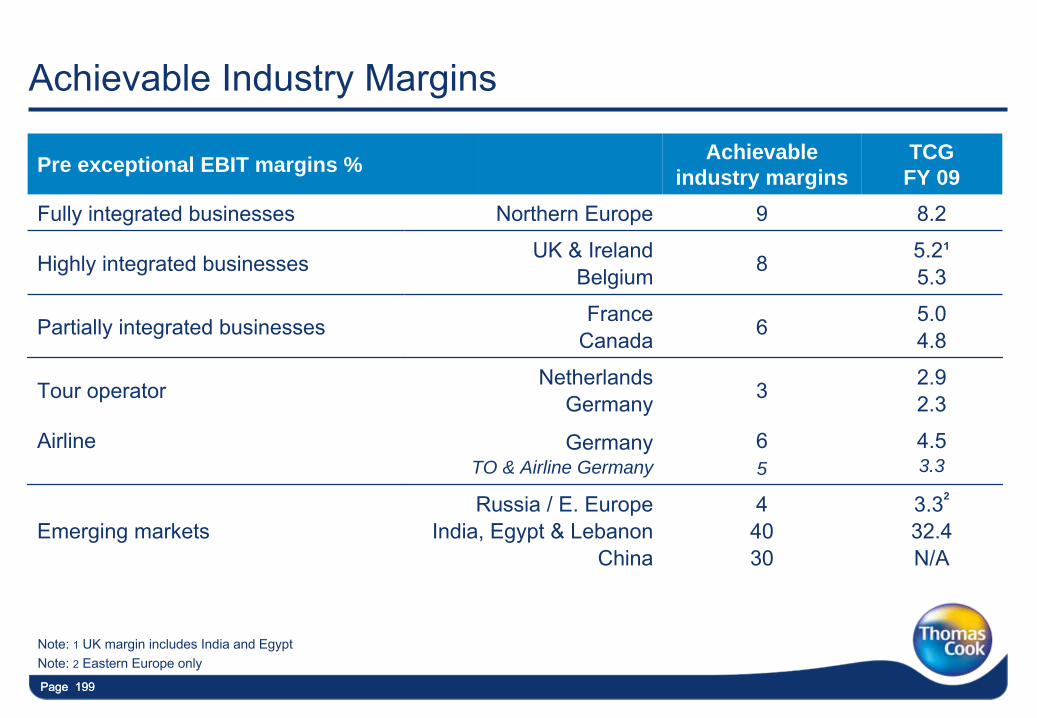
Page 199Page 199
Pre exceptional EBIT margins % Achievable industry margins
TCG FY 09
Fully integrated businesses Northern Europe 9 8.2
Highly integrated businesses UK & Ireland Belgium 8 5.2¹
5.3
Partially integrated businesses France
Canada 6 5.0
4.8
Tour operator Netherlands
Germany 3 2.9
2.3
Airline Germany
TO & Airline Germany6 5
4.5
3.3
Emerging marketsRussia / E. Europe
India, Egypt & Lebanon
China
4
40
30
3.32
32.4
N/A
Note: 1
UK margin includes India and EgyptNote: 2
Eastern Europe only
Achievable Industry Margins
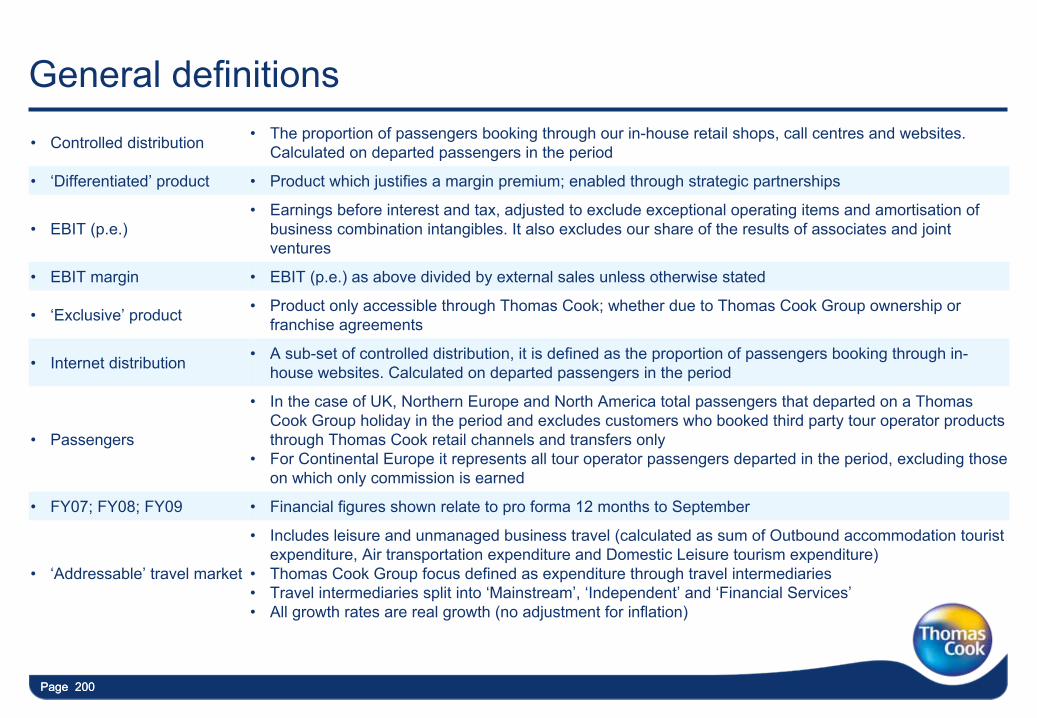
Page 200Page 200
•
Controlled distribution •
The proportion of passengers booking through our in-house retail shops, call centres and websites. Calculated on departed passengers in the period
•
‘Differentiated’
product •
Product which justifies a margin premium; enabled through strategic partnerships
•
EBIT (p.e.)•
Earnings before interest and tax, adjusted to exclude exceptional operating items and amortisation of business combination intangibles. It also excludes our share of the results of associates and joint ventures
•
EBIT margin •
EBIT (p.e.) as above divided by external sales unless otherwise stated
•
‘Exclusive’
product •
Product only accessible through Thomas Cook; whether due to Thomas Cook Group ownership or franchise agreements
•
Internet distribution •
A sub-set of controlled distribution, it is defined as the proportion of passengers booking through in-
house websites. Calculated on departed passengers in the period
•
Passengers
•
In the case of UK, Northern Europe and North America total passengers that departed on a Thomas Cook Group holiday in the period and excludes customers who booked third party tour operator products through Thomas Cook retail channels and transfers only
•
For Continental Europe it represents all tour operator passengers departed in the period, excluding those on which only commission is earned
•
FY07; FY08; FY09 •
Financial figures shown relate to pro forma 12 months to September
•
‘Addressable’
travel market
•
Includes leisure and unmanaged business travel (calculated as sum of Outbound accommodation tourist expenditure, Air transportation expenditure and Domestic Leisure
tourism expenditure)•
Thomas Cook Group focus defined as expenditure through travel intermediaries •
Travel intermediaries split into ‘Mainstream’, ‘Independent’
and ‘Financial Services’•
All growth rates are real growth (no adjustment for inflation)
General definitions
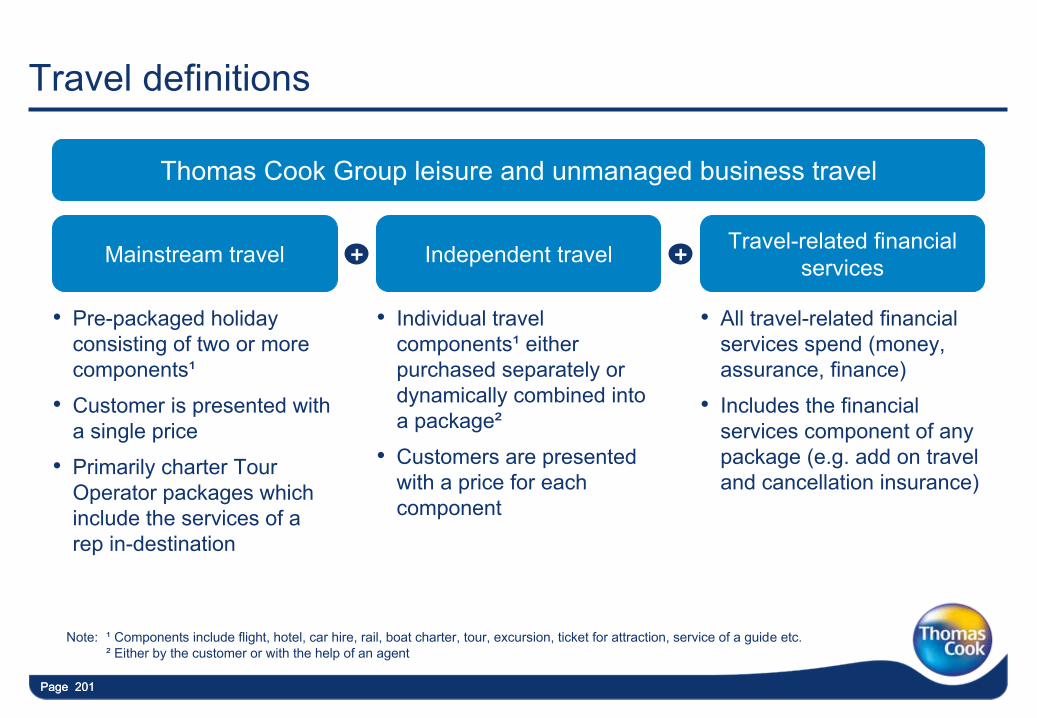
Page 201Page 201
•
Pre-packaged holiday consisting of two or more components¹
•
Customer is presented with a single price
•
Primarily charter Tour Operator packages which include the services of a rep in-destination
Independent travelMainstream travel Travel-related financial services+ +
•
Individual travel components¹
either purchased separately or dynamically combined into a package²
•
Customers are presented with a price for each component
•
All travel-related financial services spend (money, assurance, finance)
•
Includes the financial services component of any package (e.g. add on travel and cancellation insurance)
Note: ¹
Components include flight, hotel, car hire, rail, boat charter,
tour, excursion, ticket for attraction, service of a guide etc.
²
Either by the customer or with the help of an agent
Travel definitions
Thomas Cook Group leisure and unmanaged business travel