Embed Size (px)
Citation preview
Investor Day Presentationy
Tom GartlandPresident, North America
May 2012
Key MessagesKey Messages
Well-positioned in the North American hi l t l k tvehicle rental market
Strategic initiatives driving accelerated profit growth
Investing to drive sustainable long-termInvesting to drive sustainable long term growth
Focused on improving the customerFocused on improving the customer experience
89
AgendaAgenda
Th b i t dThe business today
Competitive strengthsCompetitive strengths
Growth driversGrowth drivers
90
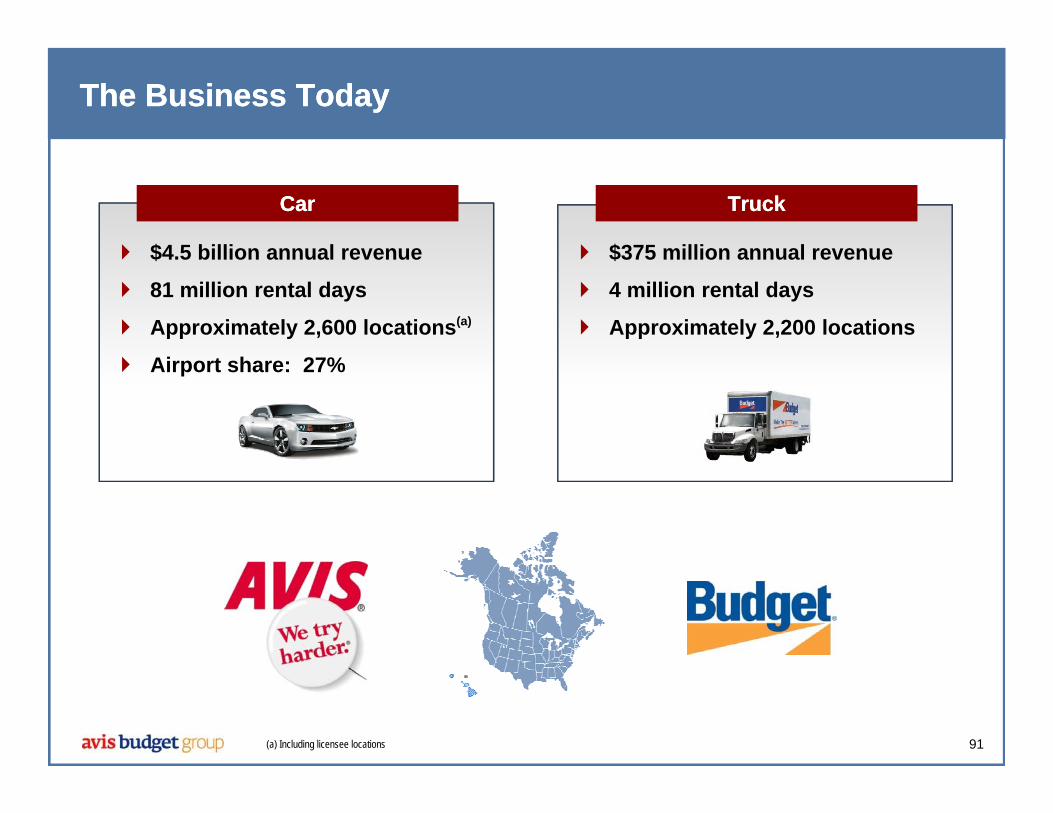
The Business TodayThe Business Today
TruckTruck
$375 million annual revenue
CarCar
$4 5 billion annual revenue $375 million annual revenue
4 million rental days
Approximately 2,200 locations
$4.5 billion annual revenue
81 million rental days
Approximately 2,600 locations(a)
Airport share: 27%
91(a) Including licensee locations

Diversified Revenue SourcesDiversified Revenue Sources
Avis vs. BudgetAvis vs. Budget Commercial vs. Commercial vs. LeisureLeisure
OnOn--Airport vs. Airport vs. OffOff--AirportAirport
Time & MileageTime & Mileagevs. Ancillaryvs. Ancillarypp yy
75%75%
Rental (T&M)
34%34%66%66% 54%54%46%46% 23%23%77%77%
11%11%14%14%
75%75%
11%11%14%14%AncillaryOther(a)
92(a) Other includes gasoline, pass-through and licensee revenue
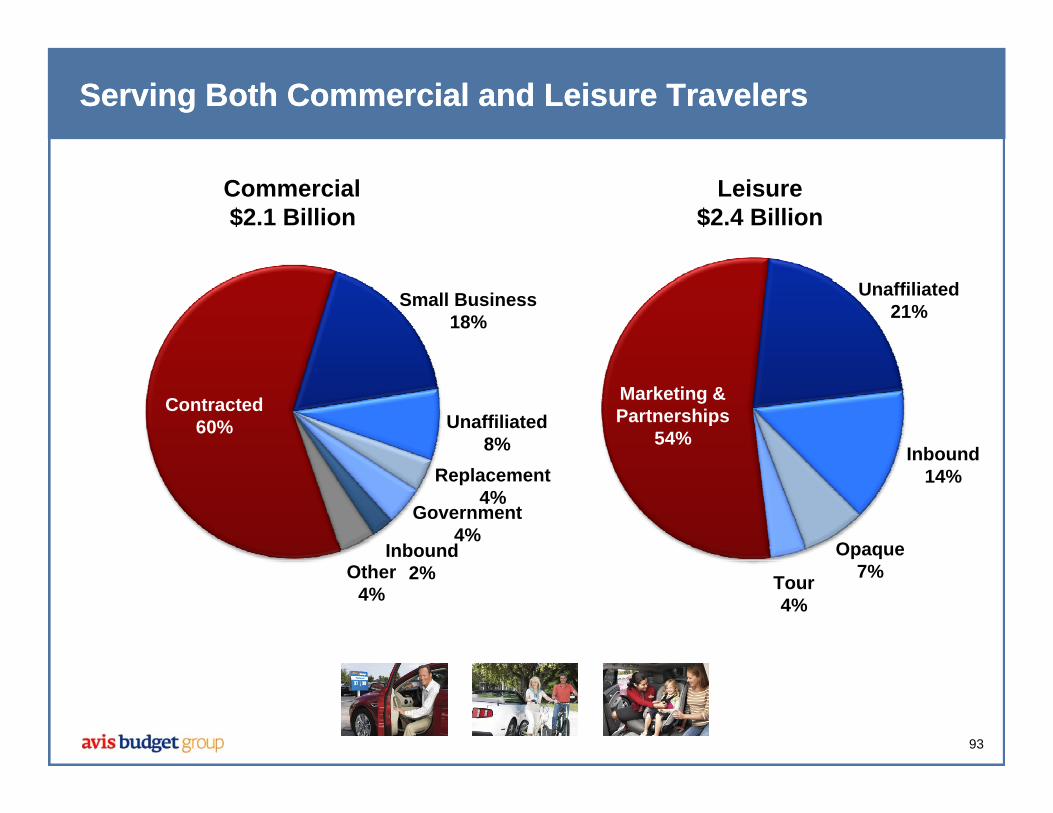
ServingServing Both Commercial and Leisure TravelersBoth Commercial and Leisure Travelers
Commercial$2.1 Billion
Leisure$2.4 Billion
Unaffiliated21%Small Business
18%
Marketing & Partnerships
54%Inbound
Unaffiliated8%
Contracted60%
Inbound14%
Opaque
Replacement4%
Government4%
Inbound7%Tour
4%
Other4%
2%
93
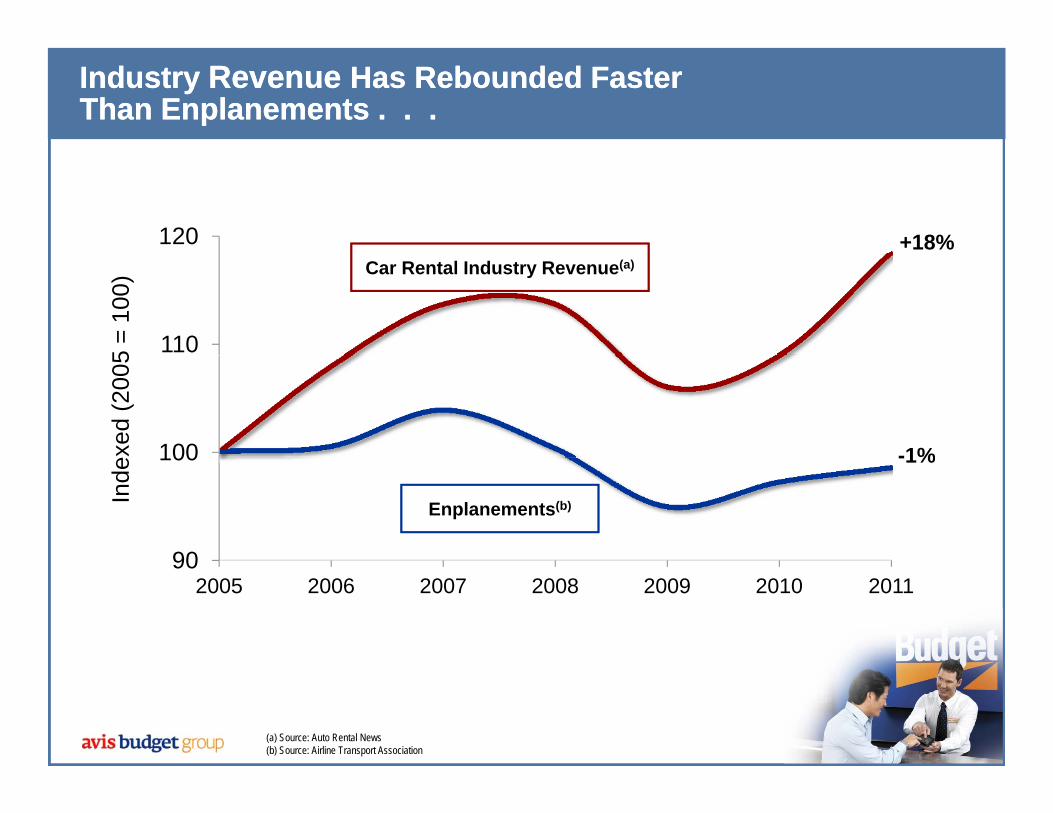
Industry Industry RevenueRevenue Has Rebounded Faster Has Rebounded Faster Than Enplanements . . . Than Enplanements . . .
120 +18%
1105 =
100)
Car Rental Industry Revenue(a)
100exed
(200
5
-1%
90
100
Inde
-1%
Enplanements(b)
902005 2006 2007 2008 2009 2010 2011
94(a) Source: Auto Rental News(b) Source: Airline Transport Association
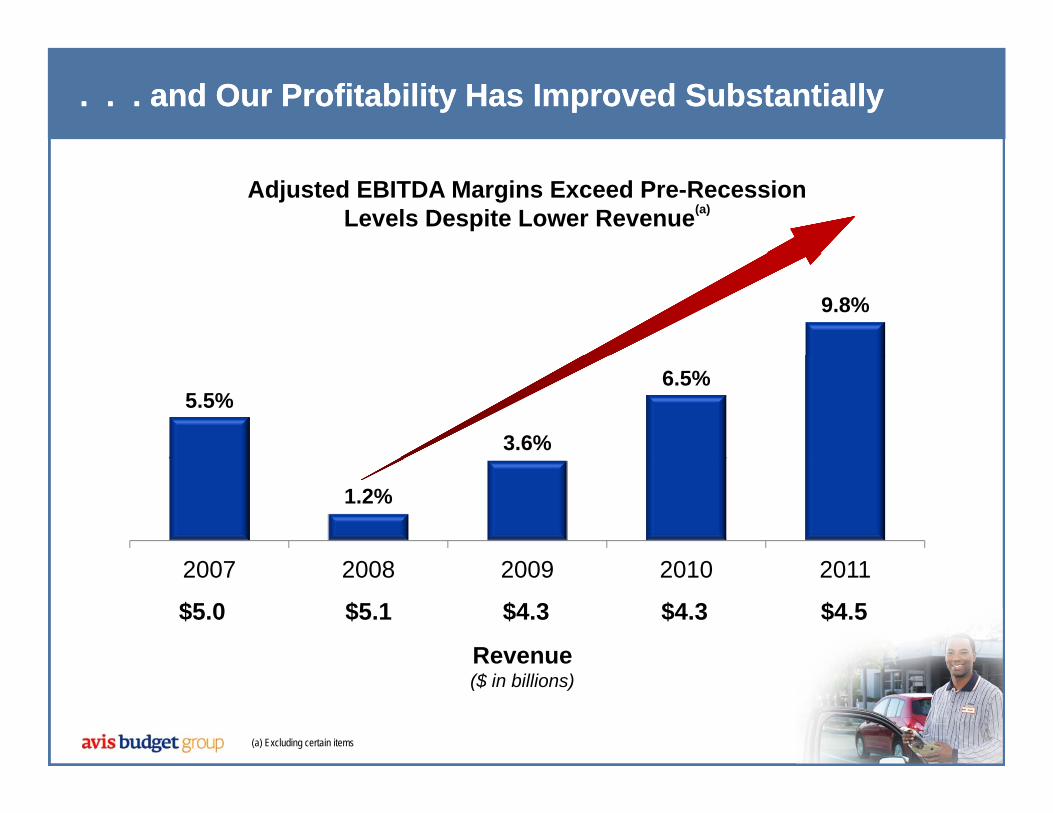
. . . and Our Profitability Has Improved Substantially. . . and Our Profitability Has Improved Substantially
Adjusted EBITDA Margins Exceed Pre-Recession Levels Despite Lower Revenue(a)
9.8%
5.5%
3.6%
6.5%
1.2%
200 2008 2009 2010 20112007 2008 2009 2010 2011
Revenue
$5.0 $5.1 $4.3 $4.3 $4.5
95(a) Excluding certain items
Revenue($ in billions)
AgendaAgenda
The business today
Competitive strengthsCompetitive strengths
Growth driversGrowth drivers
96
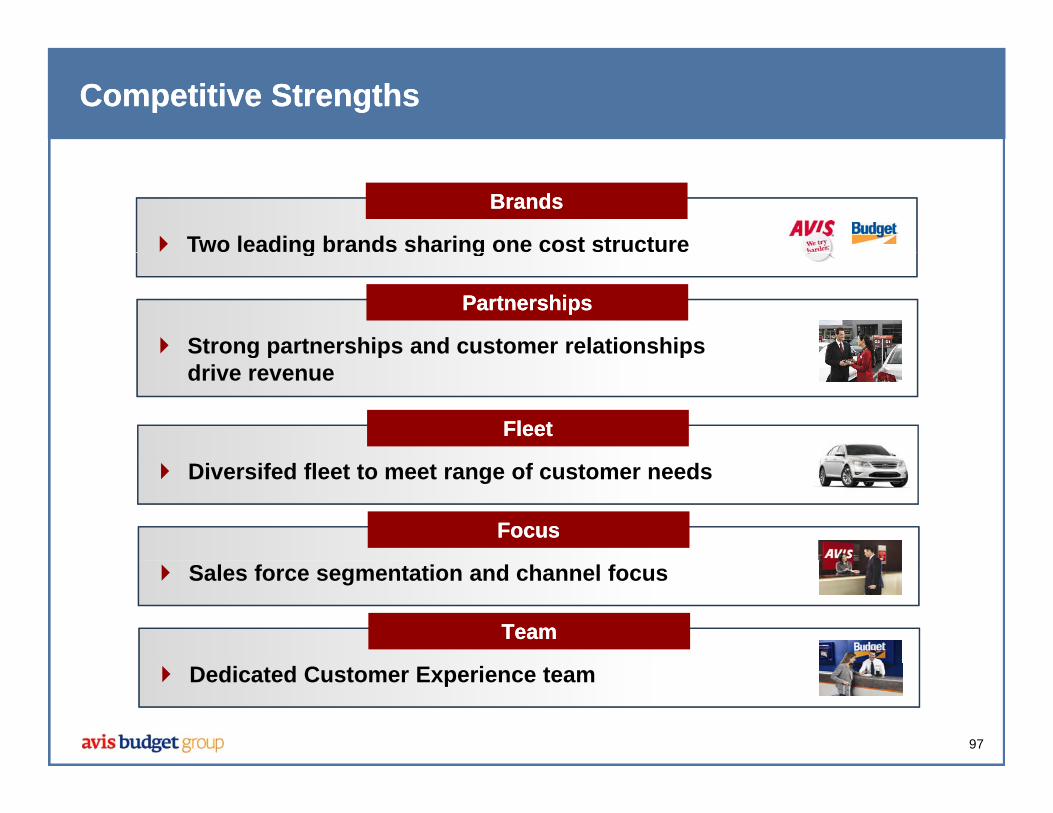
Competitive StrengthsCompetitive Strengths
BrandsBrands
Two leading brands sharing one cost structureg g
PartnershipsPartnerships
Strong partnerships and customer relationships g p p pdrive revenue
FleetFleet
Diversifed fleet to meet range of customer needs
FocusFocus
Sales force segmentation and channel focus
TeamTeam
97
Dedicated Customer Experience team
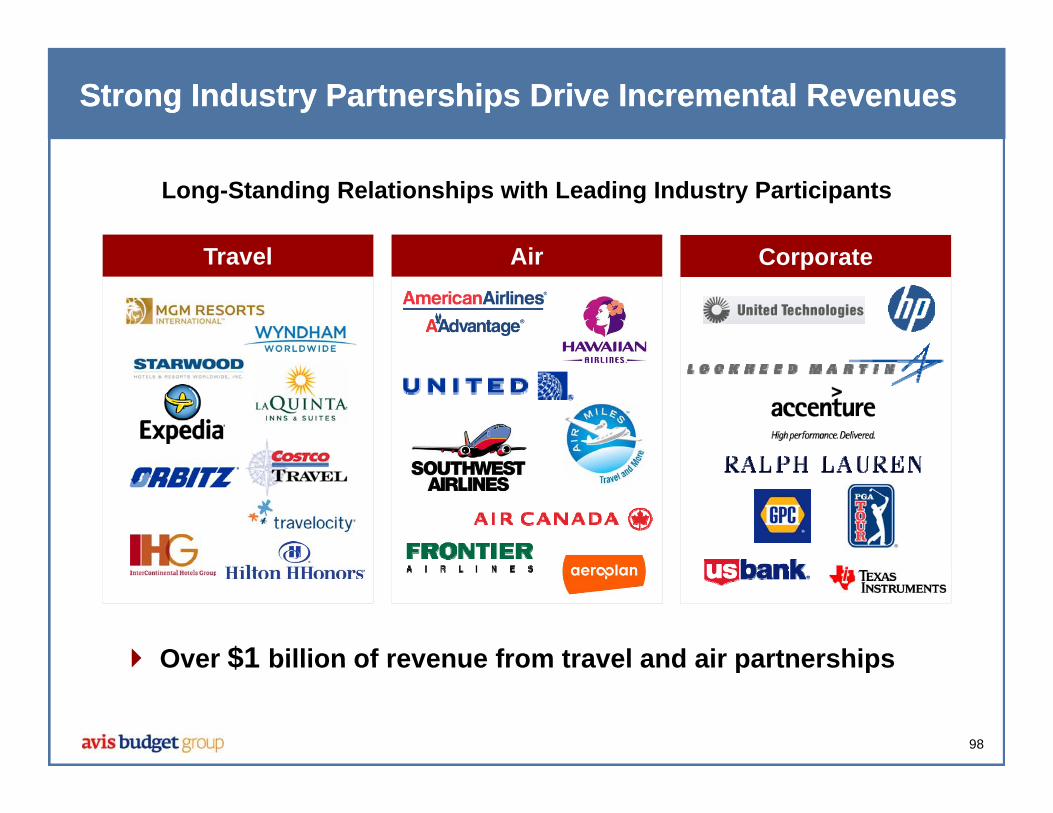
Strong Industry Partnerships Drive Incremental RevenuesStrong Industry Partnerships Drive Incremental Revenues
Long-Standing Relationships with Leading Industry Participants
Travel Air CorporateTravel Air Corporate
Over $1 billion of revenue from travel and air partnerships
98
Over $1 billion of revenue from travel and air partnerships
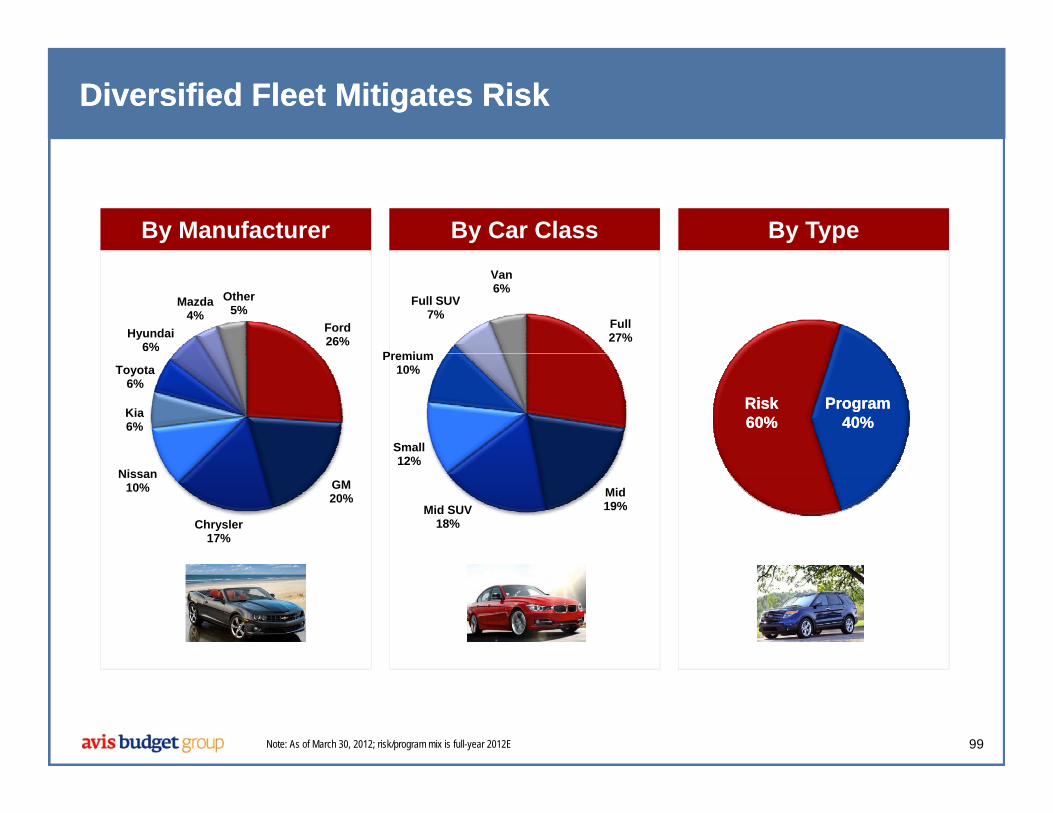
Diversified Fleet Mitigates RiskDiversified Fleet Mitigates Risk
By Manufacturer By Car Class By Type
Ford26%Hyundai
6%
Mazda4%
Other5%
Full27%
Premium
Full SUV7%
Van6%
Kia6%
Toyota6%
Small12%
Premium10%
RiskRisk60%60%
ProgramProgram40%40%
GM20%
Chrysler17%
Nissan10% Mid
19%Mid SUV18%
12%
99Note: As of March 30, 2012; risk/program mix is full-year 2012E
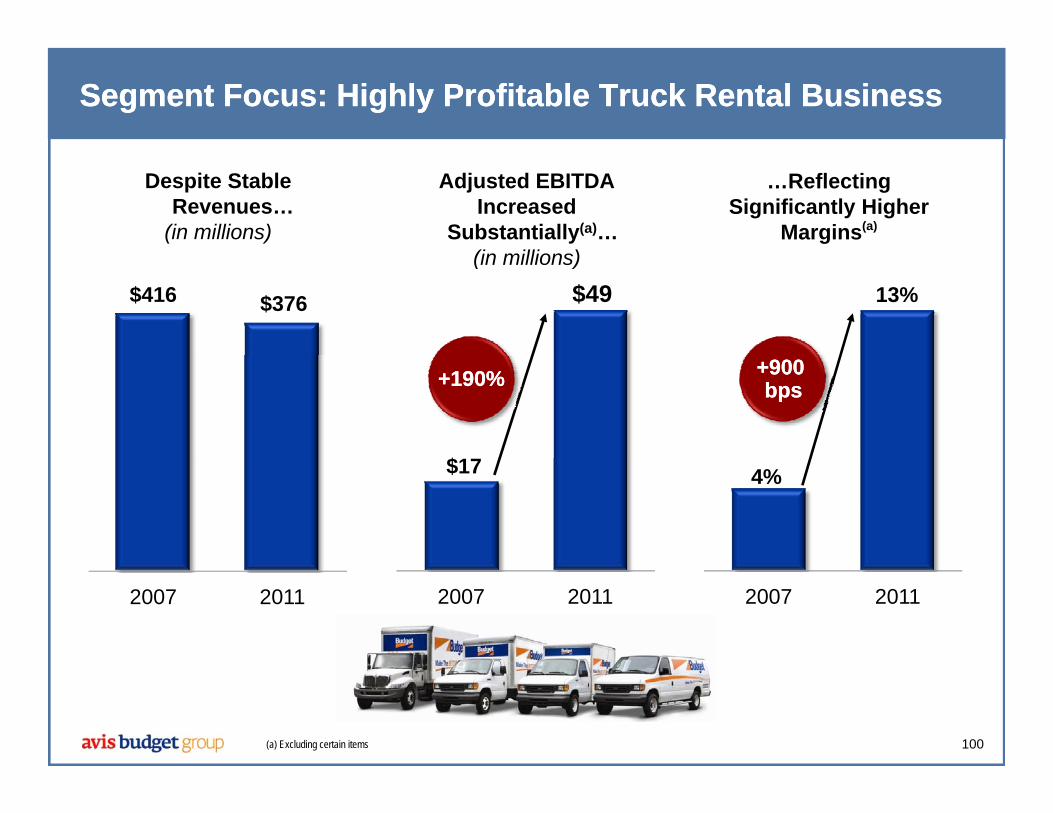
Segment Focus: Highly Profitable Truck Rental BusinessSegment Focus: Highly Profitable Truck Rental Business
Adjusted EBITDA Increased
Substantially(a)…(i illi )
…ReflectingSignificantly Higher
Margins(a)
Despite StableRevenues…
(in millions)
$49 13%$416 $376
(in millions)
$
+900 +900 bpsbps+190%+190%
$17 4%
2007 2011 2007 20112007 2011
100(a) Excluding certain items
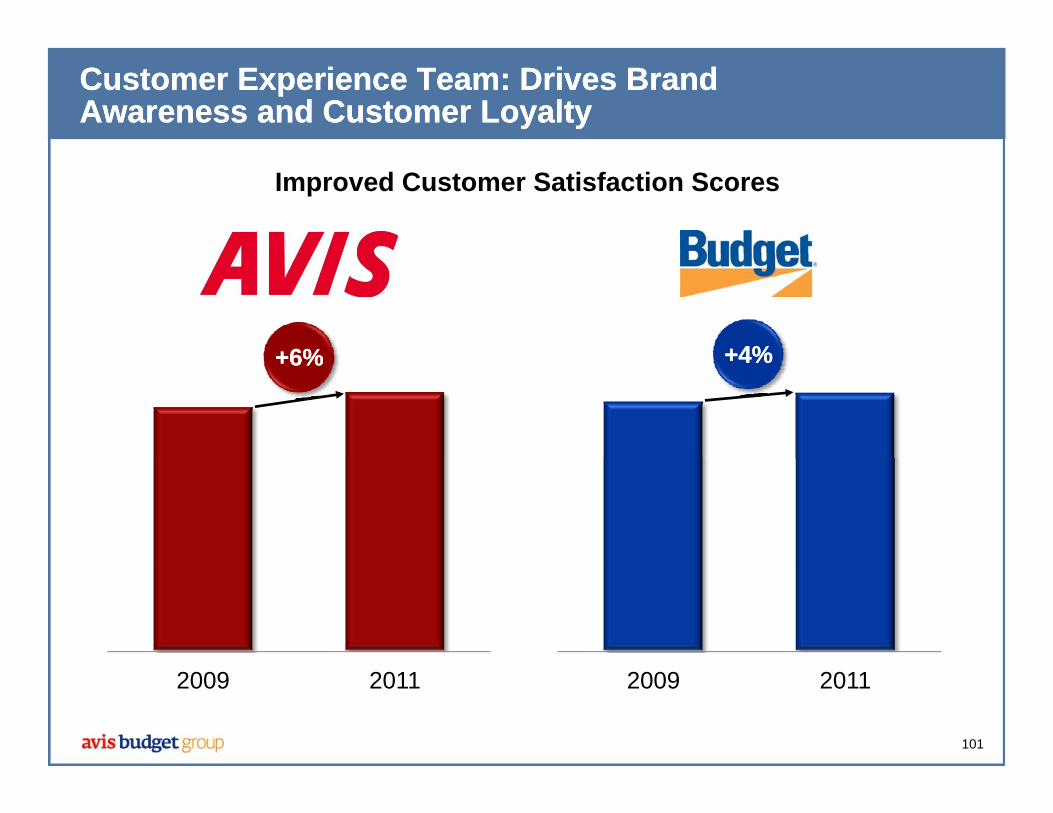
Customer Experience Team: Drives Brand Customer Experience Team: Drives Brand Awareness and Customer LoyaltyAwareness and Customer Loyalty
Improved Customer Satisfaction Scores
+6%+6% +4%+4%+6%+6% +4%+4%
101
2009 20112009 2011
AgendaAgenda
Th b i t dThe business today
Competitive strengthsCompetitive strengths
Growth driversGrowth drivers
102
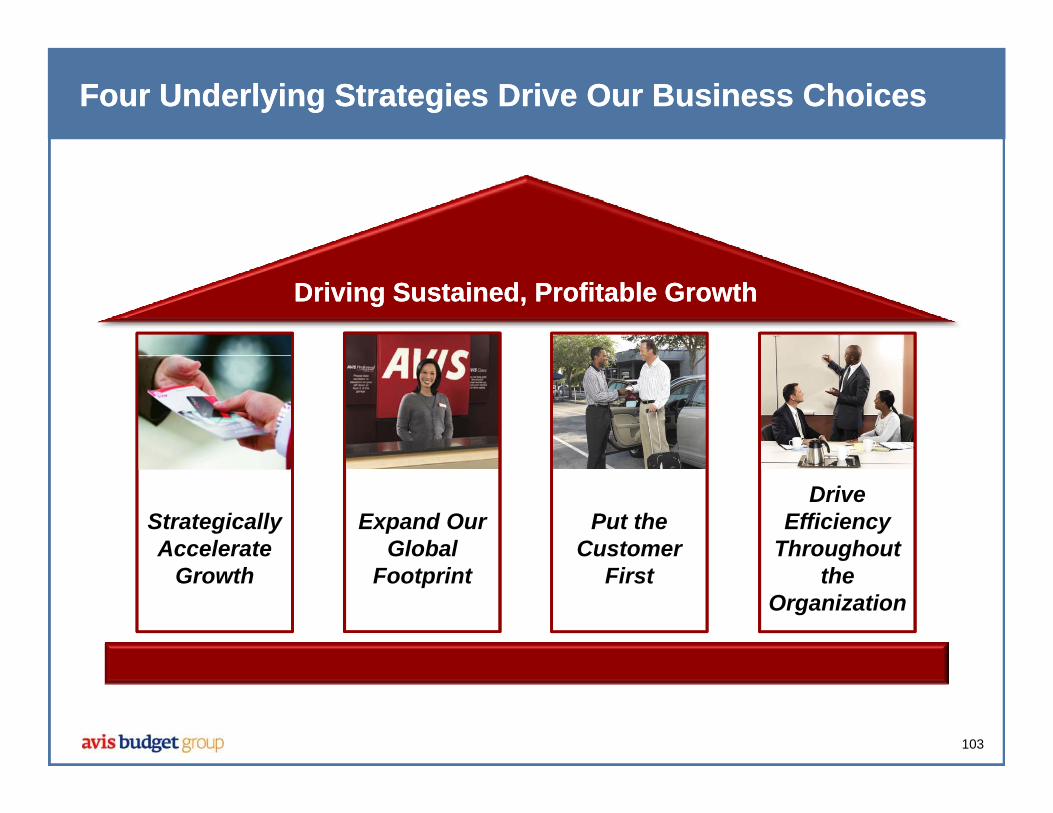
Four Underlying Strategies Drive Our Business ChoicesFour Underlying Strategies Drive Our Business Choices
Driving Driving SustainedSustained, , Profitable GrowthProfitable Growth
Expand OurGlobal
Drive Efficiency
Throughout Put the
Customer Strategically Accelerate
Footprintg
the Organization
FirstGrowth
103
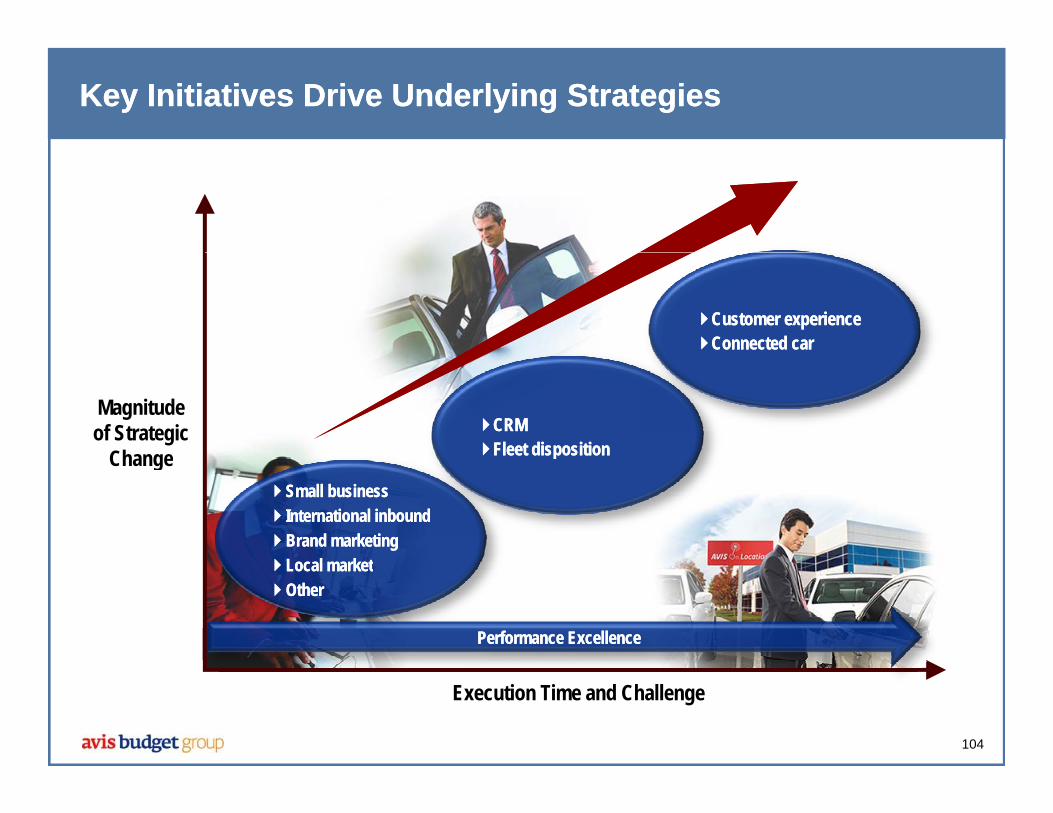
Key Initiatives Drive Underlying StrategiesKey Initiatives Drive Underlying Strategies
Customer experienceCustomer experienceConnected carConnected car
Magnitudeof Strategic
ChangeCRMCRMFleet dispositionFleet dispositionChange
Small businessSmall businessInternational inboundInternational inboundBrand marketingBrand marketingL l k tL l k t
pp
Local marketLocal marketOtherOther
Performance ExcellencePerformance Excellence
104
Execution Time and Challenge
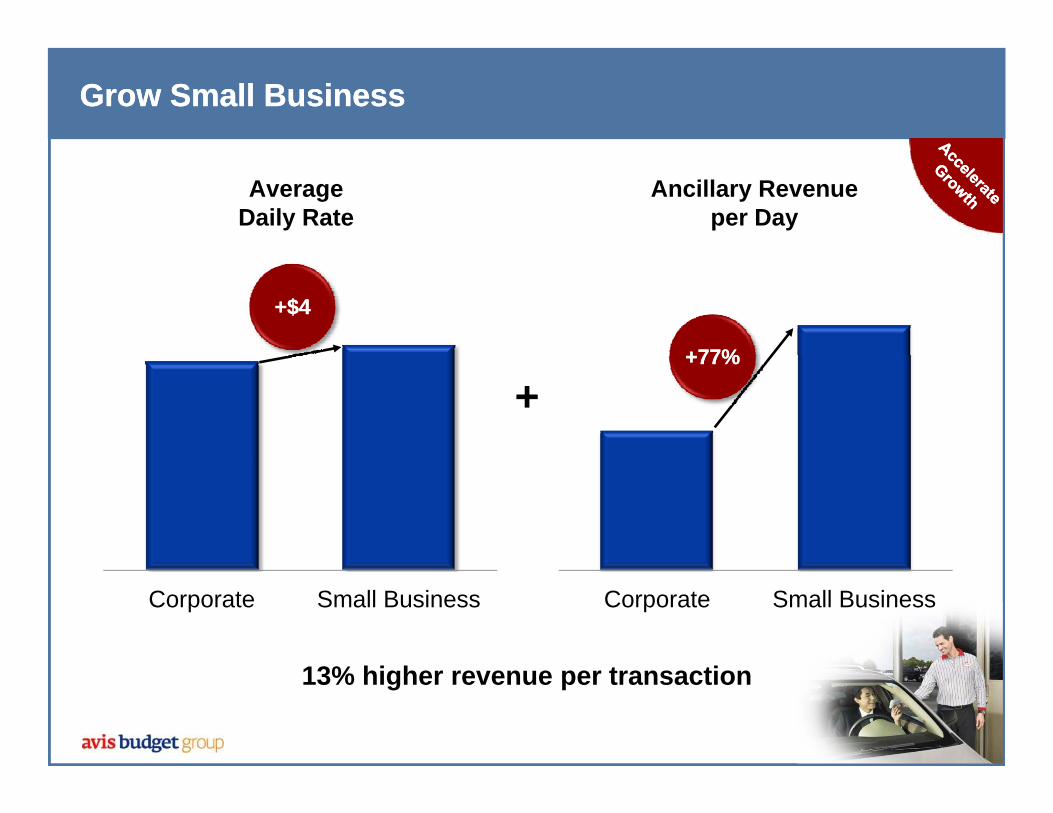
Grow Small BusinessGrow Small Business
Average Daily Rate
Ancillary Revenue per Day
+$4+$4
++77%77%++77%77%
+
Corporate Small BusinessCorporate Small Business
105
13% higher revenue per transaction
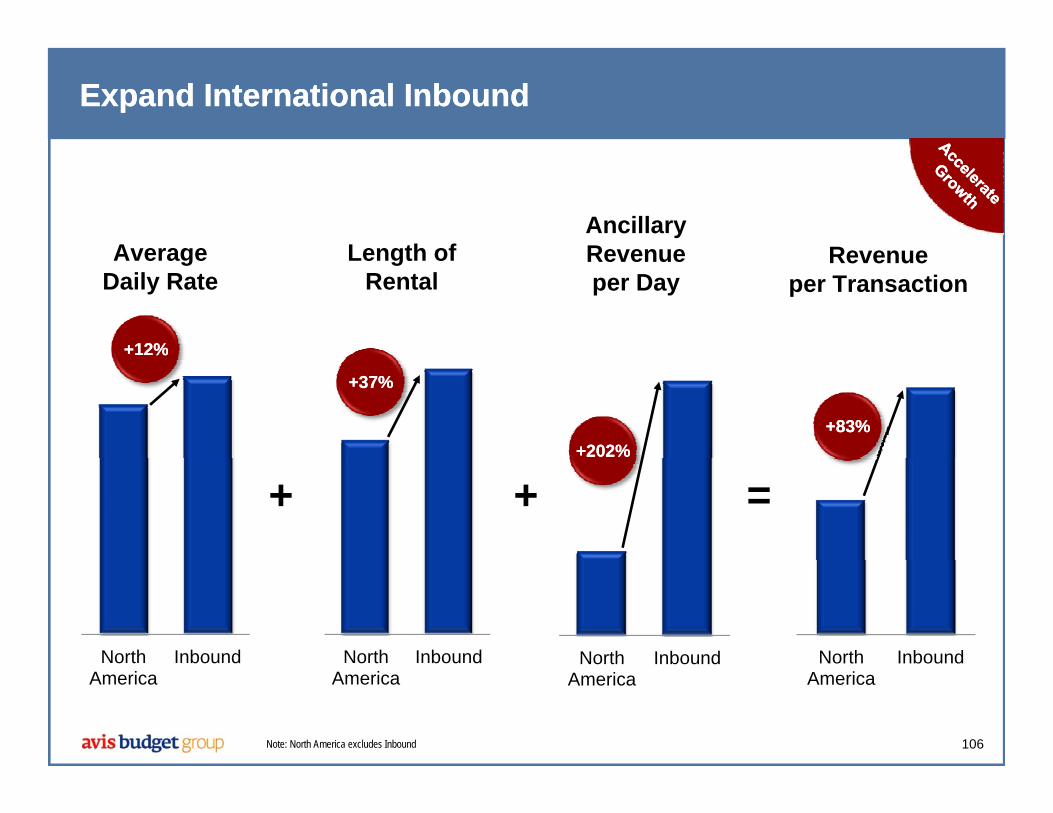
Expand International InboundExpand International Inbound
Average Length ofAncillary Revenue Revenue
+12%+12%
Average Daily Rate
Length of Rental
Revenueper Day
Revenueper Transaction
%%
+37%+37%
+202%+202%+83%+83%
+ + =
North Inbound North Inbound North Inbound North Inbound
106
o tAmerica
bou d o tAmerica
bou d NorthAmerica
Inbound NorthAmerica
Inbound
Note: North America excludes Inbound
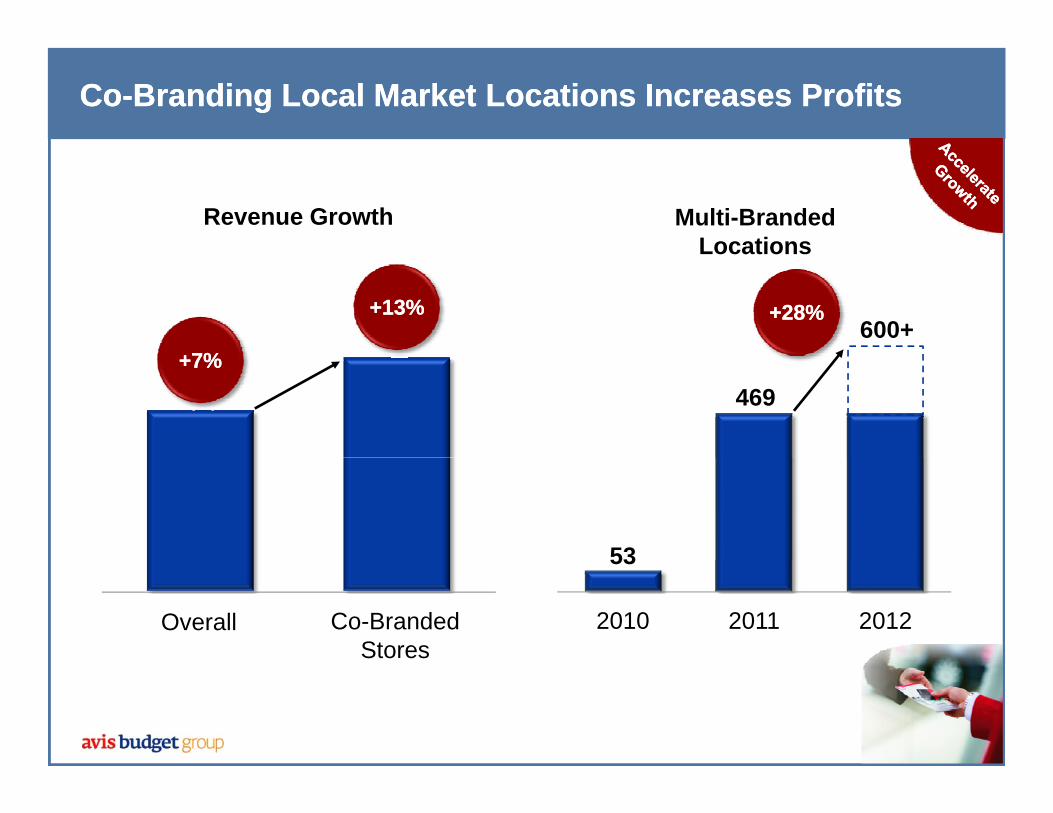
CoCo--Branding Local Market Locations Increases ProfitsBranding Local Market Locations Increases Profits
Revenue Growth Multi-Branded Locations
600++7%+7%
Locations
+28%+28%+13%+13%
469+7%+7%
5353
2010 2011 20122011 2011Overall Co-Branded Stores
107
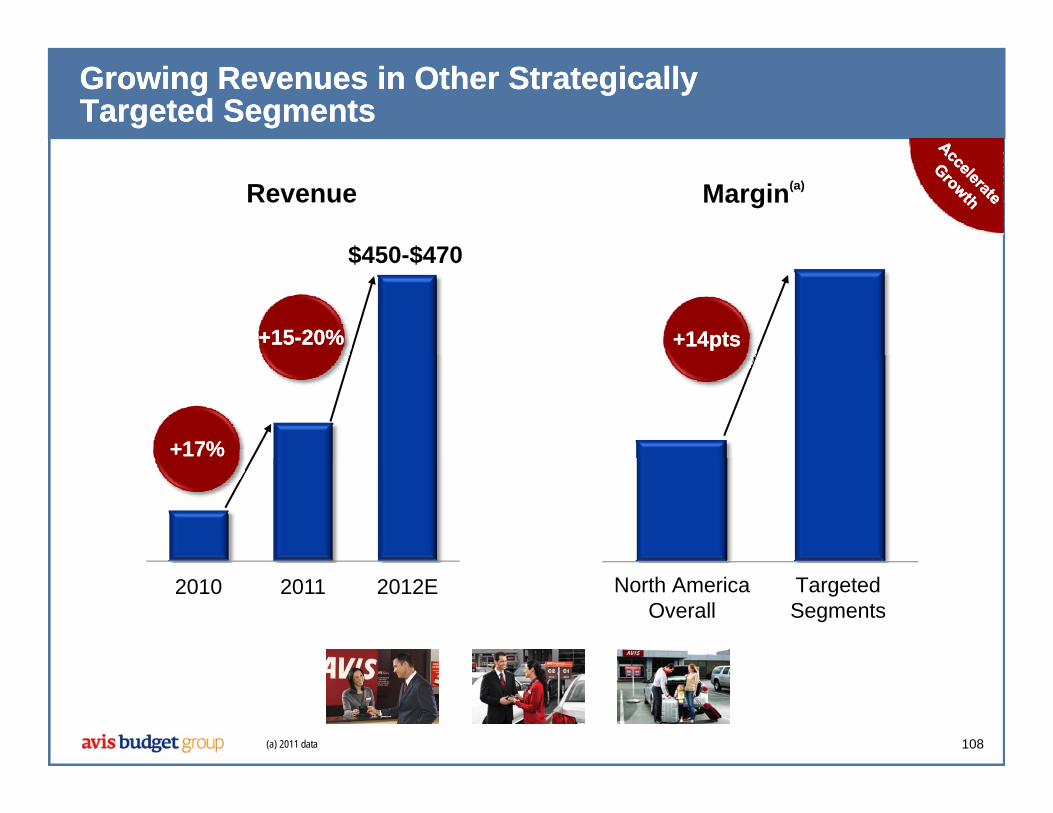
Growing Revenues in Other Strategically Growing Revenues in Other Strategically Targeted SegmentsTargeted Segments
Revenue Margin(a)
$450 $470
+15+15--20%20% +14pts+14pts
$450-$470
+17%+17%
2010 2011 2012E North America Overall
Targeted Segments
108(a) 2011 data
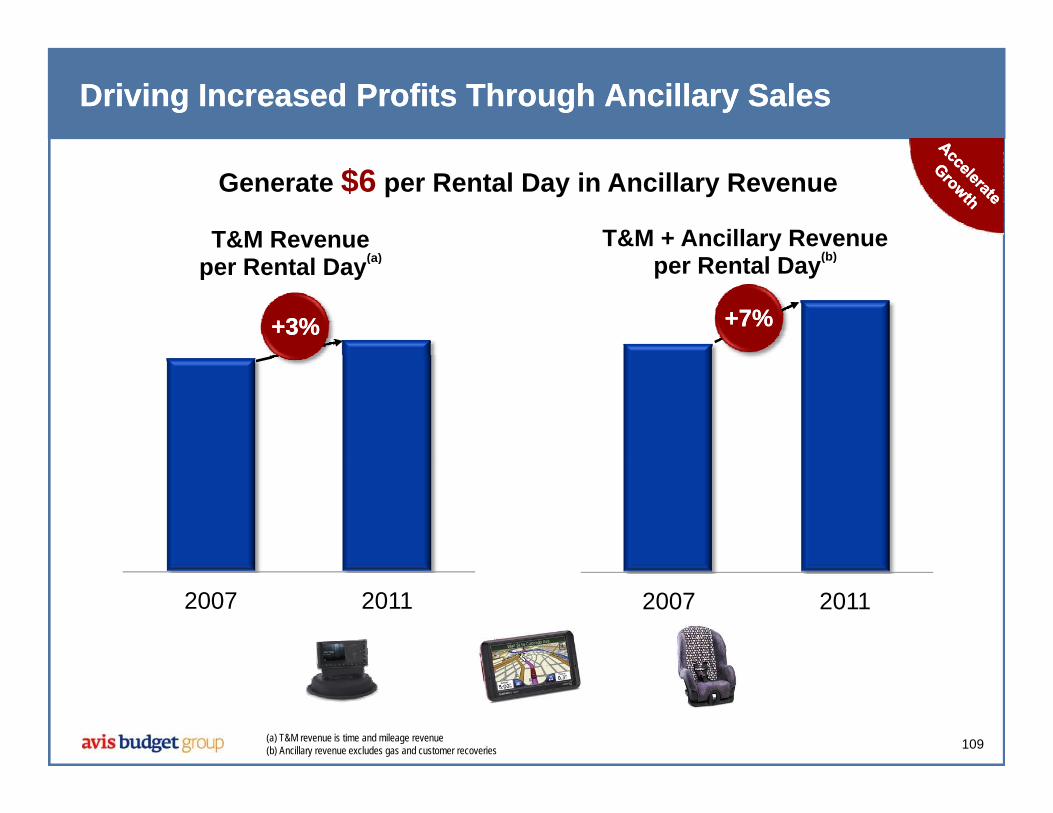
Driving Increased Profits Through Ancillary SalesDriving Increased Profits Through Ancillary Sales
T&M Revenue( )
T&M + Ancillary Revenue (b)
Generate $6 per Rental Day in Ancillary Revenue
per Rental Day(a) per Rental Day(b)
+3%+3% +7%+7%
2007 2011 2007 2011
109(a) T&M revenue is time and mileage revenue(b) Ancillary revenue excludes gas and customer recoveries
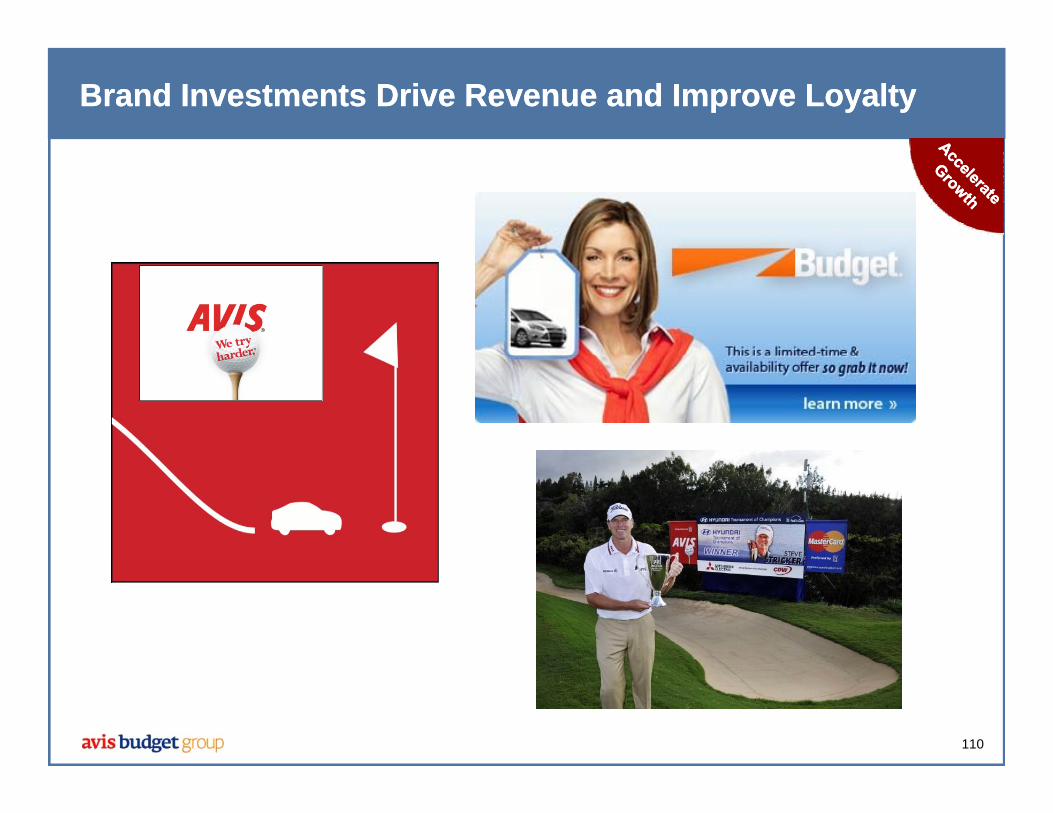
Brand Investments Drive Revenue and Improve LoyaltyBrand Investments Drive Revenue and Improve Loyalty
110
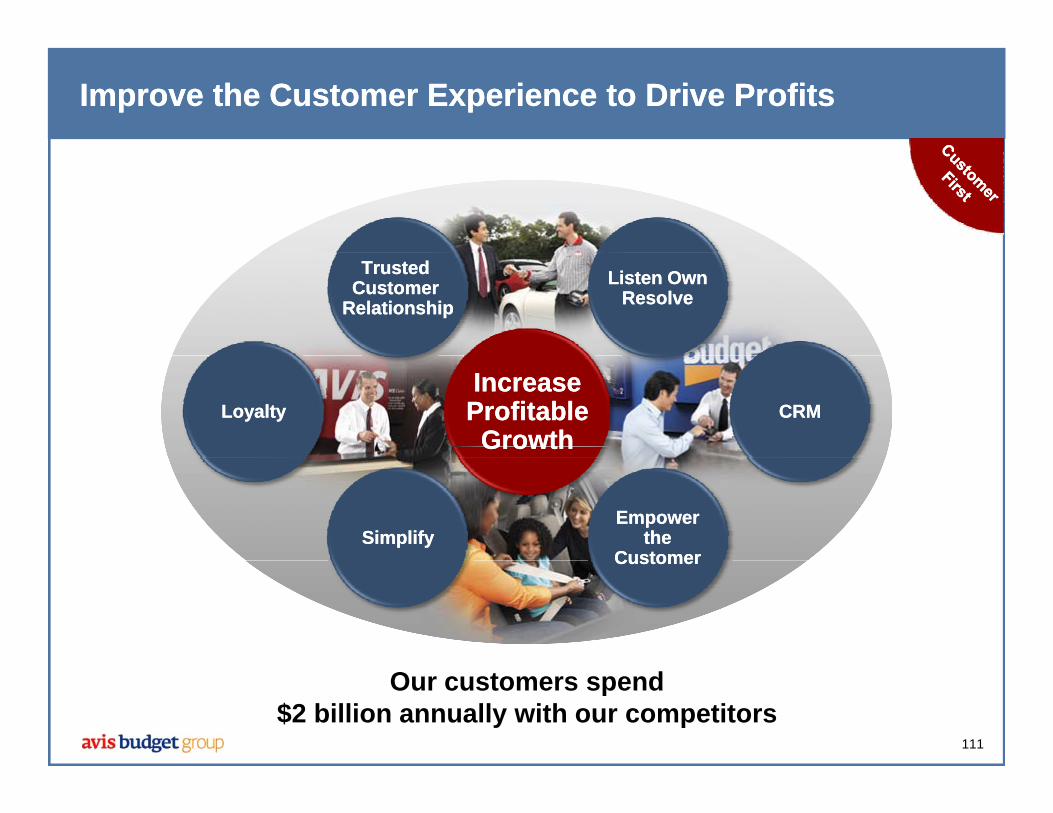
Improve the Customer Experience to Drive ProfitsImprove the Customer Experience to Drive Profits
Trusted Trusted Customer Customer
RelationshipRelationshipListen OwnListen Own
ResolveResolve
LoyaltyLoyalty CRMCRMIncreaseIncrease
ProfitableProfitableGrowthGrowth
SimplifySimplifyEmpowerEmpower
thetheCustomerCustomerCustomerCustomer
111
Our customers spend$2 billion annually with our competitors
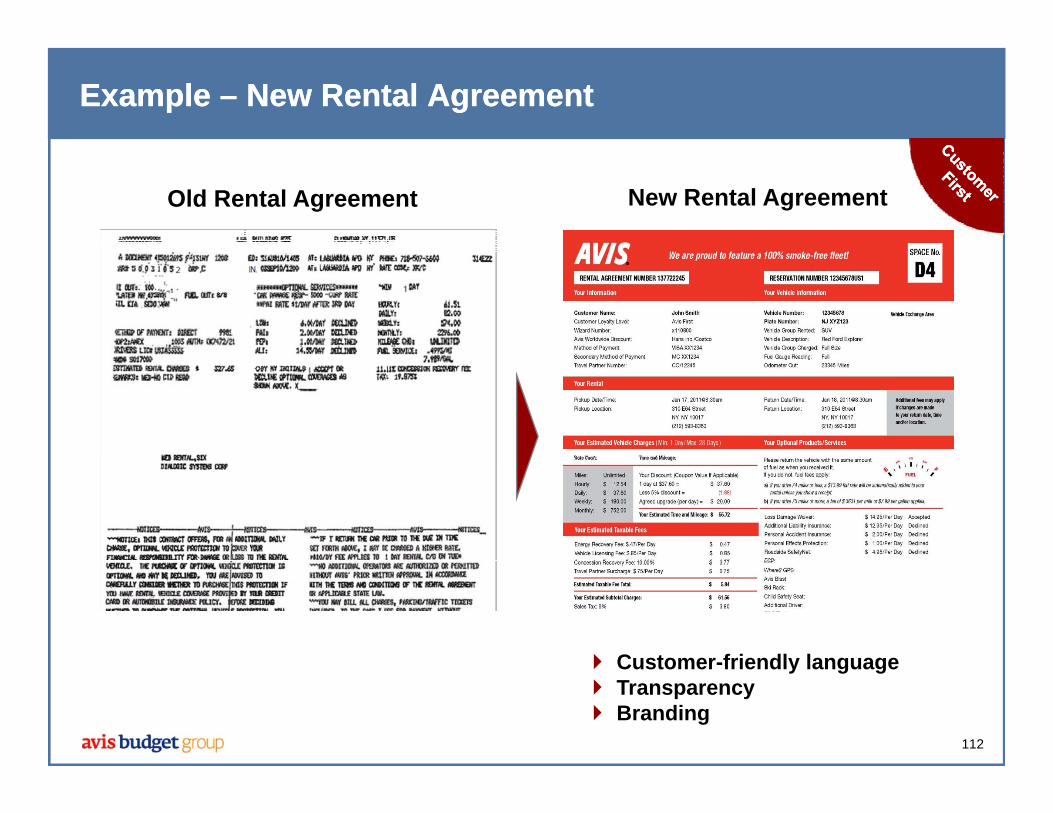
Example Example –– New Rental AgreementNew Rental Agreement
Old Rental Agreement New Rental Agreement
Customer-friendly language
112
Customer-friendly languageTransparencyBranding
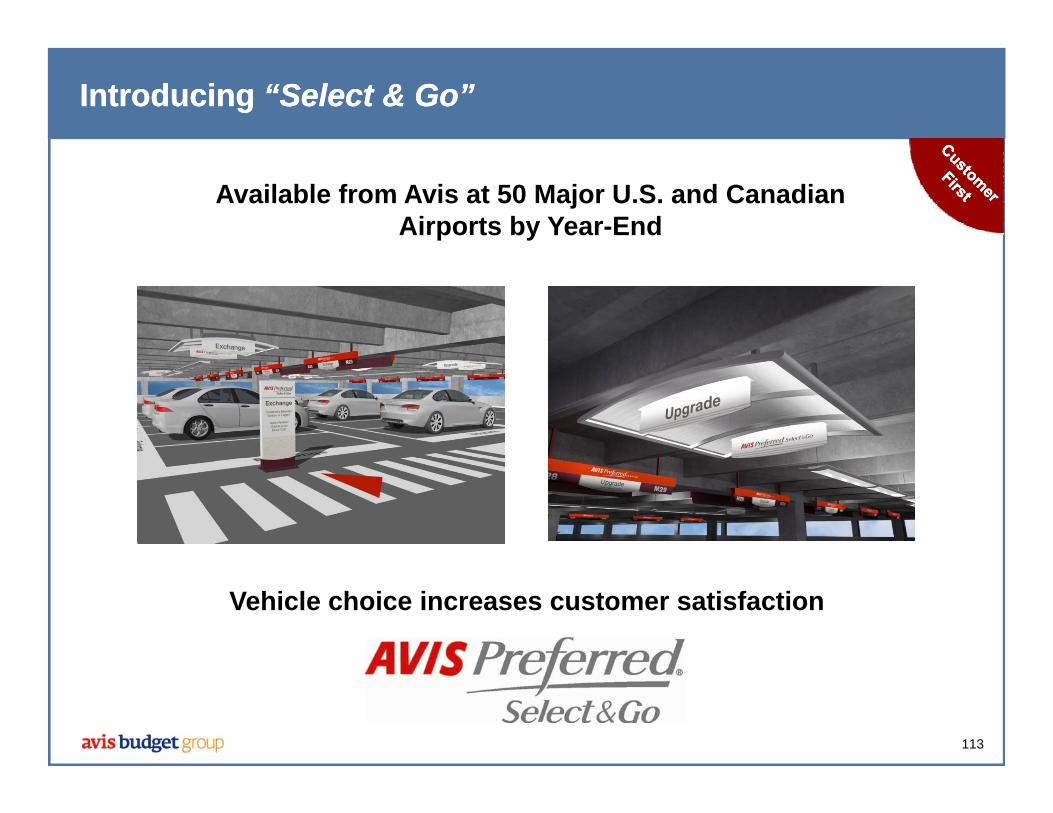
Introducing Introducing “Select & Go”“Select & Go”
Available from Avis at 50 Major U.S. and Canadian Airports by Year-End
Vehicle choice increases customer satisfaction
113
2012 Outlook 2012 Outlook
Volume expected to increase mid-single-digits
Increased penetration of high-margin ancillary products
Continued used car market strength
L f d ti it ti dLaser focus on productivity, revenue generation and sustained profitability
114

Key MessagesKey Messages
Well-positioned in the North American hi l t l k tvehicle rental market
Strategic initiatives driving accelerated profit growth
Investing to drive sustainable long-termInvesting to drive sustainable long term growth
Focused on improving the customerFocused on improving the customer experience
115