Embed Size (px)
Citation preview

INVESTMENTSTRATEGY
J a n u a r y 2 0 2 1
Agenda
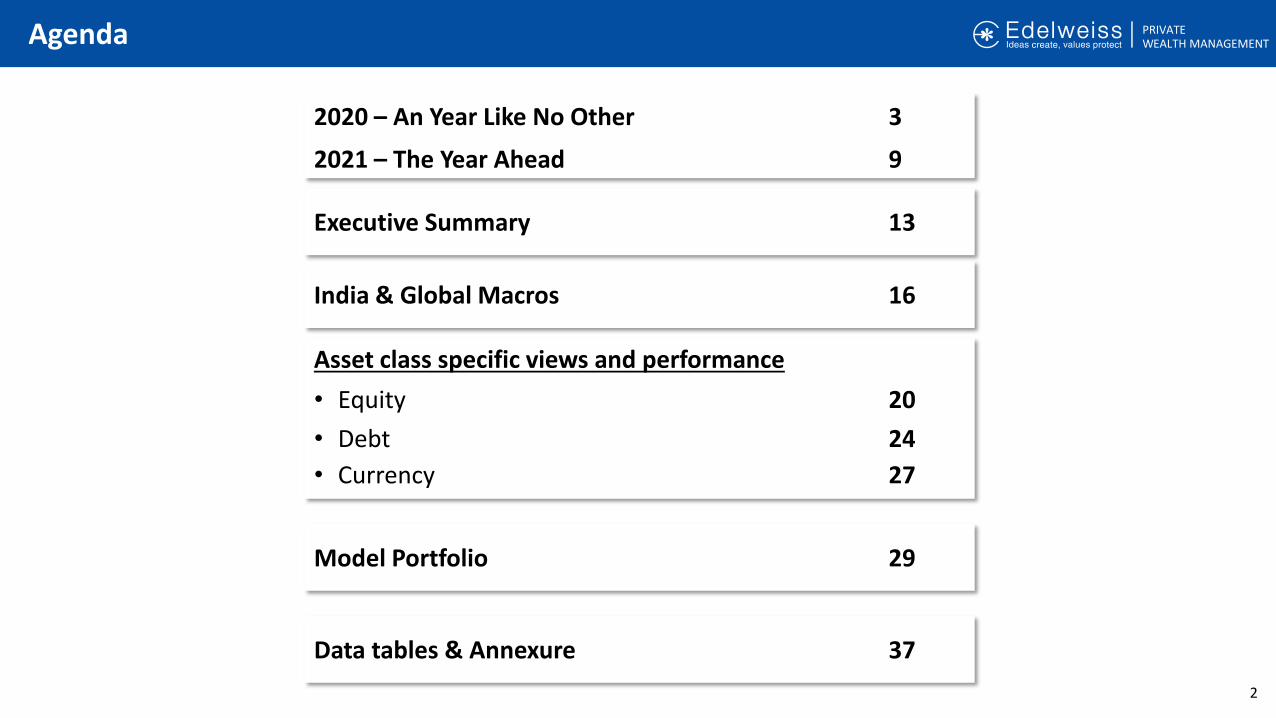
2020 – An Year Like No Other 3
2021 – The Year Ahead 9
India & Global Macros 16
Asset class specific views and performance
Model Portfolio 29
Data tables & Annexure 37
• Equity 20
• Currency 27
2
Executive Summary 13
• Debt 24

2020 – An Year Like No Other
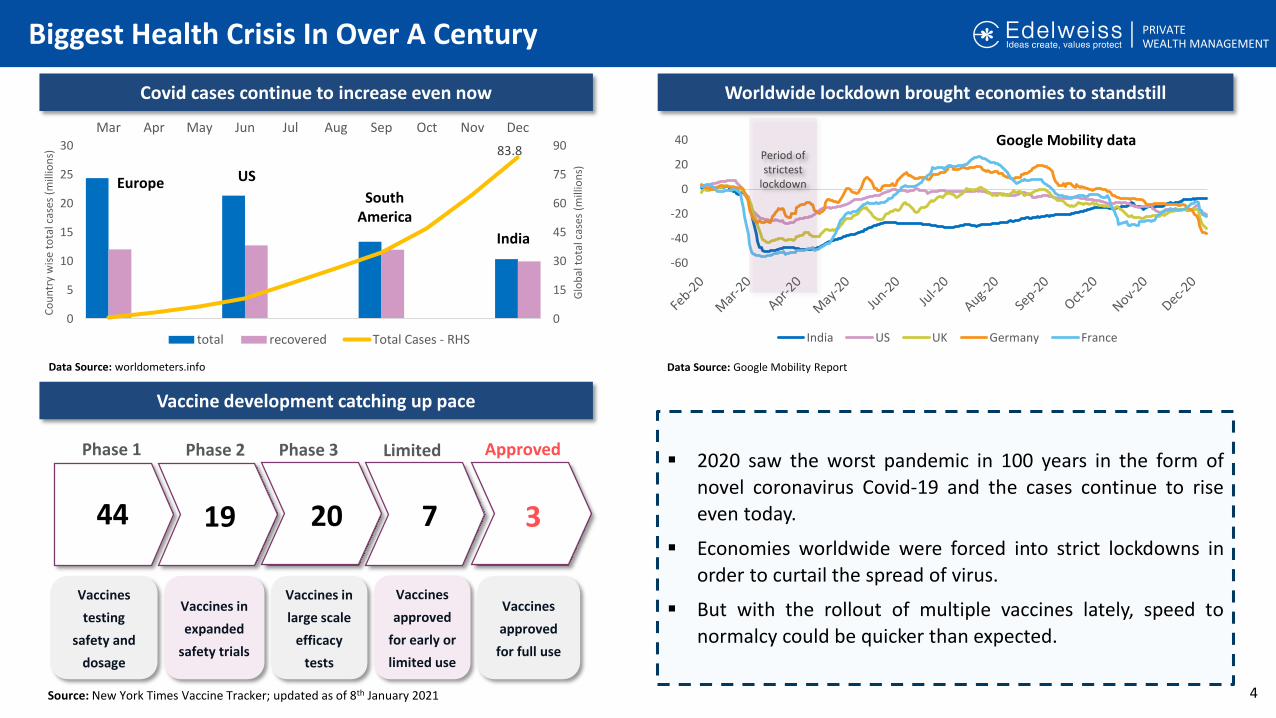
Biggest Health Crisis In Over A Century
4
-60
-40
-20
0
20
40
India US UK Germany France
Worldwide lockdown brought economies to standstill
44 19 20 7 3
Vaccines
testing
safety and
dosage
Vaccines in
expanded
safety trials
Vaccines in
large scale
efficacy
tests
Vaccines
approved
for early or
limited use
Vaccines
approved
for full use
Phase 1 Phase 2 Phase 3 Limited Approved
Covid cases continue to increase even now
Vaccine development catching up pace
83.8
0
15
30
45
60
75
90
0
5
10
15
20
25
30
Mar Apr May Jun Jul Aug Sep Oct Nov Dec
Glo
bal
to
tal c
ases
(m
illio
ns)
Co
un
try
wis
e to
tal c
ases
(m
illio
ns)
total recovered Total Cases - RHS
Europe US
South America
India
2020 saw the worst pandemic in 100 years in the form of
novel coronavirus Covid-19 and the cases continue to riseeven today.
Economies worldwide were forced into strict lockdowns in
order to curtail the spread of virus.
But with the rollout of multiple vaccines lately, speed to
normalcy could be quicker than expected.
Period of strictest
lockdown
Google Mobility data
Source: New York Times Vaccine Tracker; updated as of 8th January 2021
Data Source: worldometers.info Data Source: Google Mobility Report
Economies Faced The Heat Soon after
5
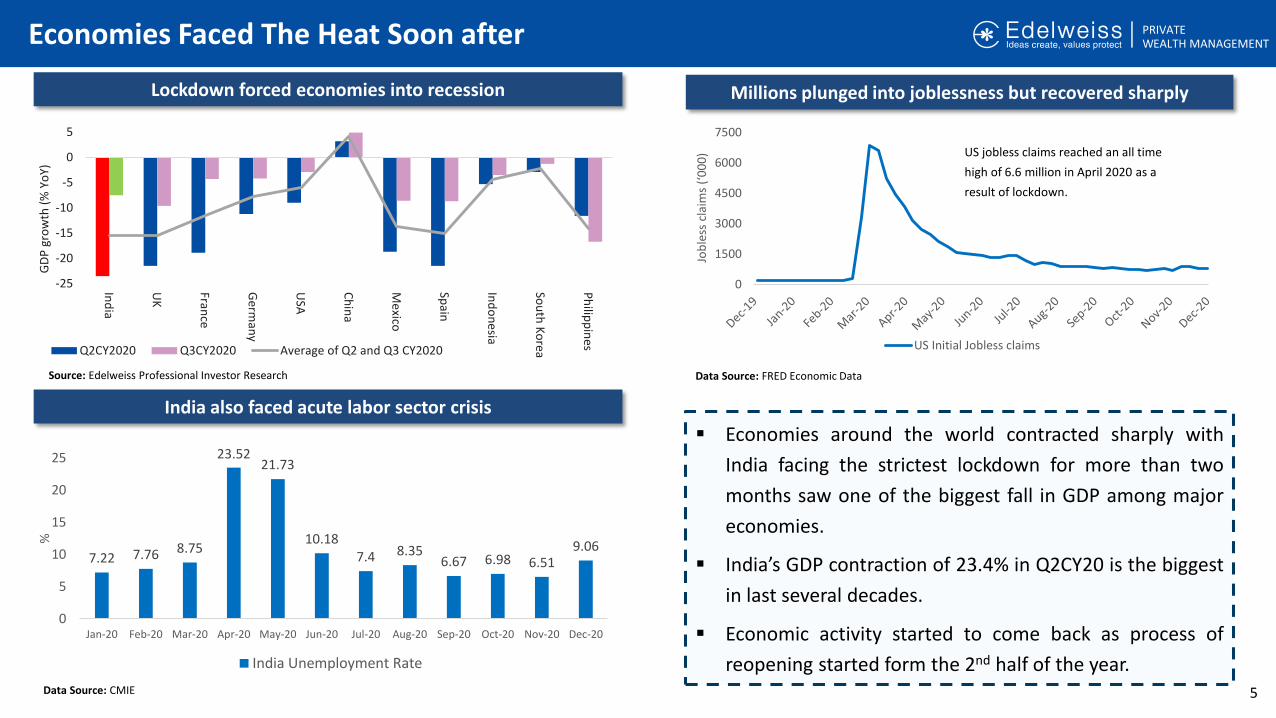
India also faced acute labor sector crisis
Lockdown forced economies into recession
-25
-20
-15
-10
-5
0
5
Ind
ia
UK
France
Germ
any
USA
Ch
ina
Me
xico
Spain
Ind
on
esia
Sou
th K
orea
Ph
ilipp
ines
GD
P g
row
th (
% Y
oY)
Q2CY2020 Q3CY2020 Average of Q2 and Q3 CY2020
7.22 7.76 8.75
23.5221.73
10.187.4 8.35
6.67 6.98 6.519.06
0
5
10
15
20
25
Jan-20 Feb-20 Mar-20 Apr-20 May-20 Jun-20 Jul-20 Aug-20 Sep-20 Oct-20 Nov-20 Dec-20
%
India Unemployment Rate
Millions plunged into joblessness but recovered sharply
0
1500
3000
4500
6000
7500
Job
less
cla
ims
(‘0
00
)
US Initial Jobless claims
US jobless claims reached an all time
high of 6.6 million in April 2020 as a
result of lockdown.
Economies around the world contracted sharply with
India facing the strictest lockdown for more than two
months saw one of the biggest fall in GDP among major
economies.
India’s GDP contraction of 23.4% in Q2CY20 is the biggest
in last several decades.
Economic activity started to come back as process of
reopening started form the 2nd half of the year.
Source: Edelweiss Professional Investor Research Data Source: FRED Economic Data
Data Source: CMIE

Strong Fiscal And Monetary Stimulus
6
Governments reacted with strong fiscal support to the economy
Source: Edelweiss Professional Investor Research
Source: Edelweiss Professional Investor Research
Monetary easing is likely to continue beyond December 2020
0
4
8
12
16
20
24
End
-20
15
End
-20
16
End
-2
01
7
End
-2
01
8
End
-20
19
End
-2
02
0E
End
-20
21
E
Bal
ance
Sh
eet
(USD
Tri
llio
n)
US ECB BoJ BoE
40-50% growth
<10% growth
1.30.2
1.2 0.9
3.1
0.30.9 0.7
0.0
1.0
2.0
3.0
4.0
5.0
2020 2008 2009 2010
COVID-19 Global financial crisis
% o
f G
DP
G7 Other G20
Fiscal support more than what was seen during GFC Governments and central banks globally provided strong
stimulus to keep the economy going. The scale of fiscalstimulus by developed economies was unparalleled to any
response in history.
Central banks loosened the monetary policy throughinfusion of unprecedented liquidity and big rate cuts.
Indian government fell short of providing strong fiscal
stimulus due to lower revenue collection and large fiscaldeficit.
0.2 0.7 1.2 1.9 2.3 2.4 2.7 2.8 3.1 3.4 3.5 4.15.3 5.6 6.2 6.5
8.8 9.411.3 12.3
9.1
0.5
4.9
1.1 0.9 1.1
16.2
2.0
9.7 10.6
34.0
0.5
4.2 3.3
16.9
5.4
1.8
31.5
24.0
2.6
0
5
10
15
20
25
30
35
40
Turk
ey
Mex
ico
Ind
ia
Ru
ssia
Sau
di A
rab
ia
Ind
on
esia
Fran
ce
Arg
enti
na
Ko
rea
Spai
n
Ital
y
Ch
ina
S.A
fric
a
Can
ada
UK
Bra
zil
Au
stra
lia
Ge
rman
y
Jap
an US
% o
f G
DP
Direct fiscal support Loans, equity, and guarantees
India’s fiscal response looks pale compared to peers
Source: Edelweiss Professional Investor Research
Unprecedented Recovery Seen In 2nd Half Of The Year
7
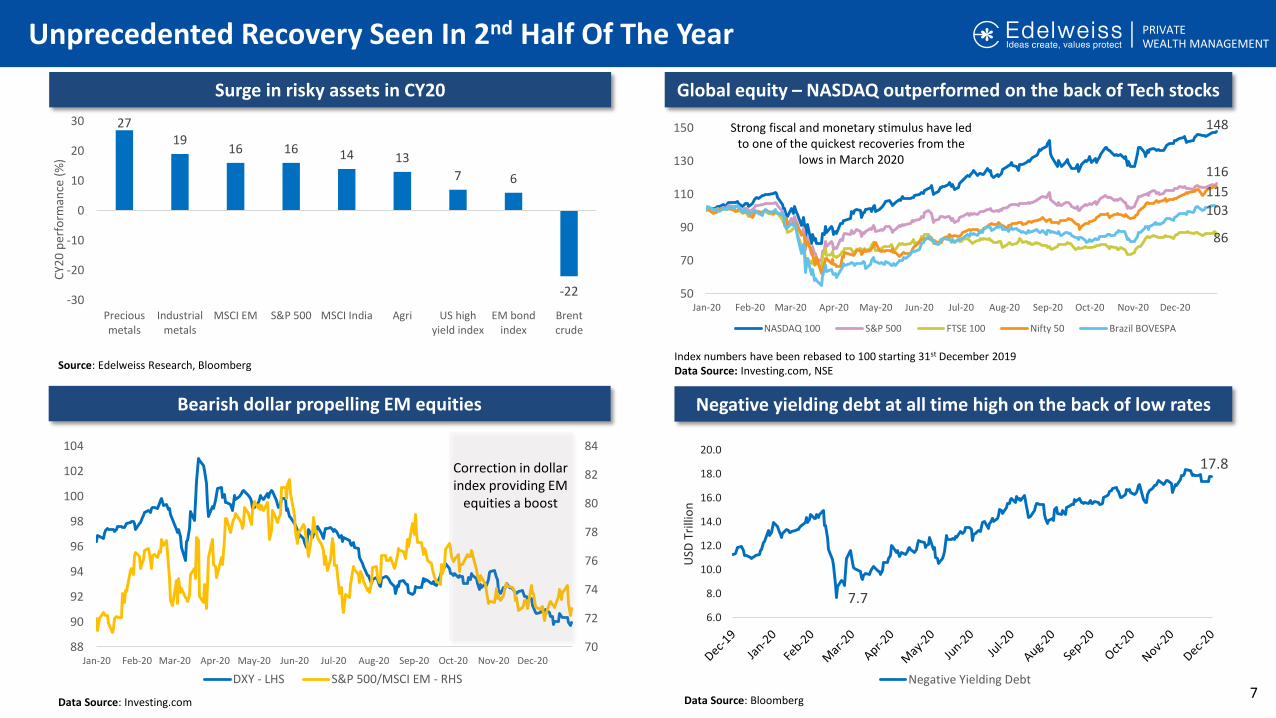
Global equity – NASDAQ outperformed on the back of Tech stocks
148
116
86
115
103
50
70
90
110
130
150
Jan-20 Feb-20 Mar-20 Apr-20 May-20 Jun-20 Jul-20 Aug-20 Sep-20 Oct-20 Nov-20 Dec-20
NASDAQ 100 S&P 500 FTSE 100 Nifty 50 Brazil BOVESPA
Strong fiscal and monetary stimulus have led to one of the quickest recoveries from the
lows in March 2020
Index numbers have been rebased to 100 starting 31st December 2019Data Source: Investing.com, NSE
70
72
74
76
78
80
82
84
88
90
92
94
96
98
100
102
104
Jan-20 Feb-20 Mar-20 Apr-20 May-20 Jun-20 Jul-20 Aug-20 Sep-20 Oct-20 Nov-20 Dec-20
DXY - LHS S&P 500/MSCI EM - RHS
Correction in dollar index providing EM
equities a boost
Surge in risky assets in CY20
Bearish dollar propelling EM equities
2719
16 16 14 13
7 6
-22-30
-20
-10
0
10
20
30
Preciousmetals
Industrialmetals
MSCI EM S&P 500 MSCI India Agri US highyield index
EM bondindex
Brentcrude
CY2
0 p
erfo
rman
ce (
%)
7.7
17.8
6.0
8.0
10.0
12.0
14.0
16.0
18.0
20.0
USD
Tri
llio
nNegative Yielding Debt
Negative yielding debt at all time high on the back of low rates
Source: Edelweiss Research, Bloomberg
Data Source: Investing.com Data Source: Bloomberg
Similar Trends In Indian Market
8
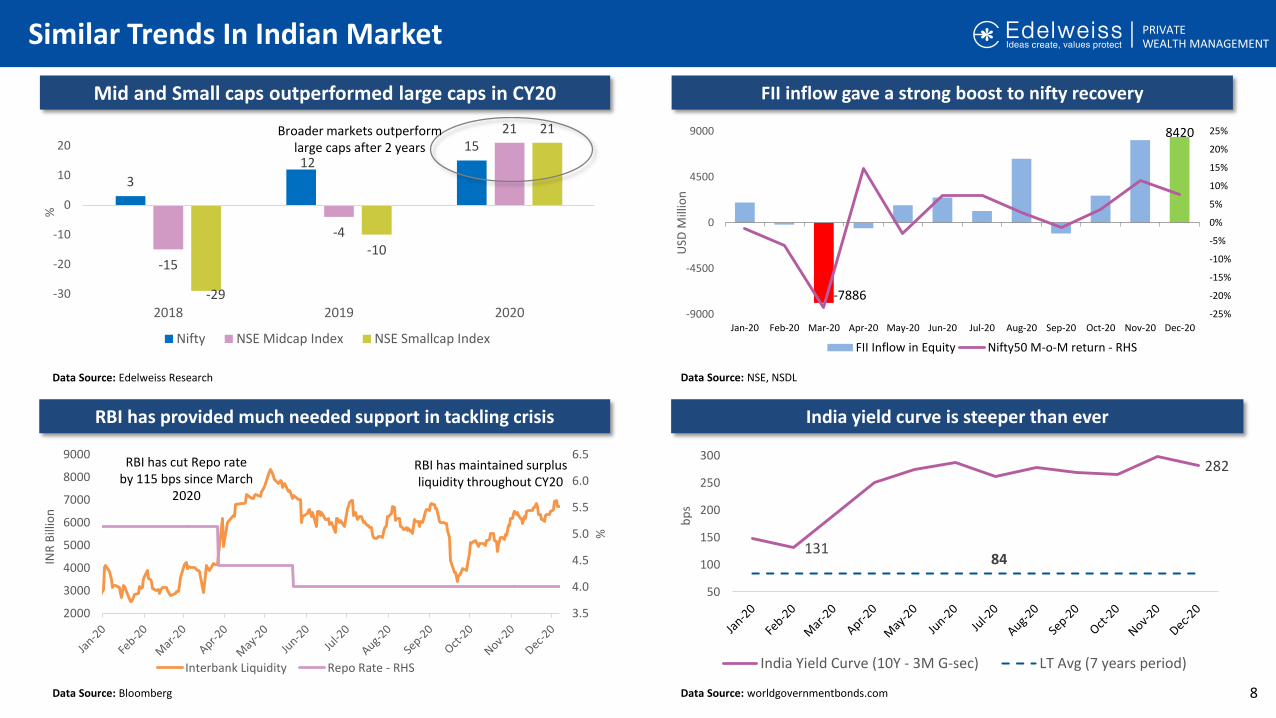
Mid and Small caps outperformed large caps in CY20
Data Source: Edelweiss Research
Data Source: Bloomberg
FII inflow gave a strong boost to nifty recovery
Data Source: NSE, NSDL
-7886
8420
-25%
-20%
-15%
-10%
-5%
0%
5%
10%
15%
20%
25%
-9000
-4500
0
4500
9000
Jan-20 Feb-20 Mar-20 Apr-20 May-20 Jun-20 Jul-20 Aug-20 Sep-20 Oct-20 Nov-20 Dec-20
USD
Mill
ion
FII Inflow in Equity Nifty50 M-o-M return - RHS
RBI has provided much needed support in tackling crisis India yield curve is steeper than ever
3.5
4.0
4.5
5.0
5.5
6.0
6.5
2000
3000
4000
5000
6000
7000
8000
9000
%
INR
Bill
ion
Interbank Liquidity Repo Rate - RHS
RBI has maintained surplus liquidity throughout CY20
RBI has cut Repo rate by 115 bps since March
2020
131
282
84
50
100
150
200
250
300
bp
s
India Yield Curve (10Y - 3M G-sec) LT Avg (7 years period)
3
1215
-15
-4
21
-29
-10
21
-30
-20
-10
0
10
20
2018 2019 2020
%
Nifty NSE Midcap Index NSE Smallcap Index
Broader markets outperform large caps after 2 years
Data Source: worldgovernmentbonds.com

2021 – The Year Ahead
2021 Outlook – Strong Recovery Will Continue
10
Equity
• Indian equity has remained one of the most favoured destination for FII money in 2020 which is likely to continue in this year as well, on the back of
accommodative stance by central banks globally and a weaker dollar.
• Economy will continue to strengthen further supported by RBI’s monetary support both in terms of liquidity infusion and lower rates. Equity markets will
get further boost if big fiscal spending announcements take place in upcoming budget.
• Export led recovery could lead growth of which IT has been the biggest beneficiary and this trend is likely to continue as cloud and digital unravels.
Healthcare sector has had a big tailwind and this is likely to continue as well. BFSI could continue to see some interest as the worst of the NPA cycle is
behind us. Volatility will persist but equity is expected to emerge as better performing asset class this decade.
Fixed Income
• RBI is expected to keep the stance accommodative and Repo rate near current levels in medium term as focus remains on growth. If inflation cools off to
the levels of RBI’s target, fresh rounds of interest rate cuts can be expected.
• RBI has been on forefront in tackling covid crisis with surplus liquidity and low rates and they will gradually move to withdrawal of unprecedented
accommodation as growth gets restored over medium term
• Yield curve is likely to bear flatten gradually, although it will remain at higher levels than usual average. Yield will continue to moderate over this decade
which will require a look at innovative solutions like REITs, InvIts and select credit.
Outlook and Opportunities
As we move to 2021, there are reasons to be more optimistic. First, Covid19 active cases have stopped to rise & vaccines are getting rolled out globally.
Second, countries globally are going all out to boost demand thereby helping the economy to recover back to the pre-Covid levels.

2021 Outlook – Strong Recovery Will Continue
11
Risks
Unexpected extension of current health crisis poses one of the biggest risk as it can again force the economies into uncertainties of lockdown.
A less than expected fiscal stimulus both at global and domestic level could provide roadblocks to recovering economies.
Uncertainty over Central Government budget announcements on fiscal spending and big ticket reforms.
Persistent high inflation could provide constrains to RBI’s loose monetary policy which is otherwise needed for growth.
Earnings disappointment over the next year could test the high valuations of the market.
Geopolitical risks: 1. Reaction of new US regime on US-China trade relations 2. UK Brexit deal with EU 3. Increase in crude prices due to ongoingproduction cuts.
Gold
• Traditionally, gold has been a risk-off asset class but since 2008 with the onset of QE and subsequent surplus liquidity into the system, it has started to
move in tandem with risky assets. Factors like high dollar liquidity, weaker dollar and favourable demand supply dynamics are indicating a comeback in
gold prices and could reach USD 2600-2800 over the next few years.
INR
• INR has largely underperformed EMFX as RBI has concentrated on increasing reserves thereby limiting appreciation of INR.
• Based on high REER and widening of trade deficit to $15.71bn in December from $12.48bn a year earlier, INR could head for a mild depreciation.
USDINR is expected to inch towards 74.00 zone in near term.
Real Estate
• After going through a phase of crisis in 2020, real estate sector is poised for a strong recovery led by residential and office segments. Lower interest
rates and a likely subsiding of WFH concerns may lead to faster than expected recovery in this asset class.
• Maharshtra govt.’s decision to cut construction premium by 50% and stamp duty cut will likely provide much needed boost to sales this year.
2021 Budget Expectations
12
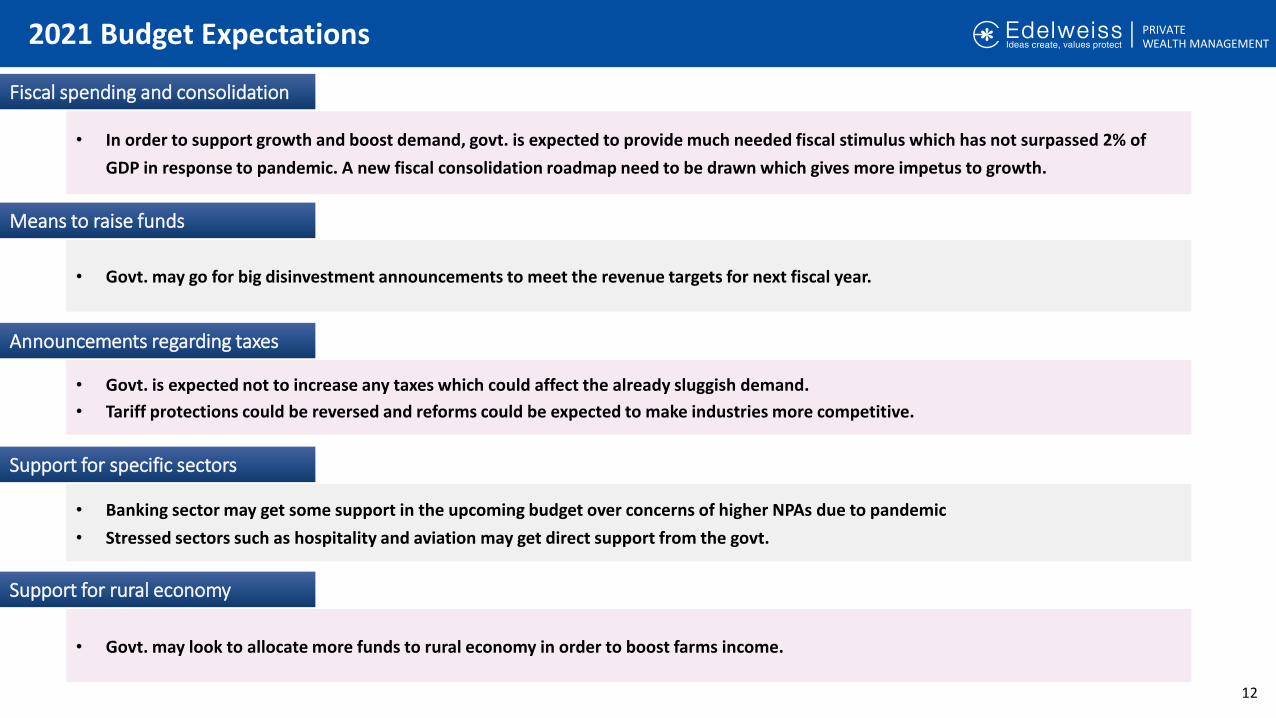
• In order to support growth and boost demand, govt. is expected to provide much needed fiscal stimulus which has not surpassed 2% of
GDP in response to pandemic. A new fiscal consolidation roadmap need to be drawn which gives more impetus to growth.
Fiscal spending and consolidation
• Govt. may go for big disinvestment announcements to meet the revenue targets for next fiscal year.
Means to raise funds
• Govt. is expected not to increase any taxes which could affect the already sluggish demand.
• Tariff protections could be reversed and reforms could be expected to make industries more competitive.
Announcements regarding taxes
• Banking sector may get some support in the upcoming budget over concerns of higher NPAs due to pandemic
• Stressed sectors such as hospitality and aviation may get direct support from the govt.
Support for specific sectors
• Govt. may look to allocate more funds to rural economy in order to boost farms income.
Support for rural economy

Executive Summary

Asset Class View
14
Equity
• While bull run continued in equity markets due to relentless FII inflow,
recovery in domestic demand & corporate earnings are yet to catch up.
• Unabated global liquidity and positive news around development of
COVID vaccine indicate limited downside from medium term view.
• We continue with marginal underweight call on equity allocation,
based on respective risk profiles.
Fixed Income and Alternates
• CPI inflation is not showing any signs to cool off. RBI have also taken a pause in
interest rate cuts while maintaining accommodative stance.
• It is prudent to reduce interest rate sensitivity of the portfolio by trimming the
exposure to investments with high duration.
• Core allocation to high quality credit with judicious mix of carefully curated
high yield credit and niche alternates is advisable.
Investment Strategy
• Strategic- Good quality credit with comparatively higher yields
• Tactical – High yielding credit of issuers with sound business practices
• Alternates - Exposure to Gold – buy on dips
• Investments with predictable and regular cashflow
Shortlisted Products*
• Large Cap Funds
• Index Funds/ ETFs
• Multi Cap Funds
• Mid and small cap Funds
• International
Shortlisted Products*
• SP rated AAA, AA and A
• CAT II AIF
• InvIT/ REIT
• Credit Risk Funds
• Debt ETF
• Corporate Bond Funds
Investment Strategy
• Strategic – Businesses with visibility of early recovery of profitability
• Deployment – Staggered Deployment over 60 days .
• Tactical – Accelerate deployment in case of correction
• International equity allocation through FOF

Conservative Portfolio Moderate Portfolio Aggressive Portfolio
Model Portfolio vis-a
vis Tactical Asset
Allocation for
Existing Clients
Model Portfolio & Asset Allocation Summary
15
Your Portfolio Position & Our Recommended Allocation Across All Risk Profiles
Equity Fixed Income
Substantially undeployed
/ Fresh Capital to invest
• Deploy in 4 equal tranches over next 60 days to take
equity deployment to recommended level as per your
risk profile
• Immediate Deployment in good quality credit
where yields are comparatively higher as well as
in high yielding credit with select issuers
Deployed as per strategic
allocation
• Keep the balance amount as cash for better opportunities.
Review mid and small cap allocation in portfolio and in
case of overweight allocation, consider moving to large
cap/ Large & Mid Cap
• Review the underlying credit exposures
(direct/indirect) and reallocate, if needed.
• Trim the exposure to high duration and suitably
reallocate.
Please contact your financial advisor for more details & strategy
25%
70%
5%
22.5%
72.5%
5.0%
Equity Fixed Income Alternatives
Model Portfolio Current Allocation
45% 45%
10%
40%
50%
10%
Equity Fixed Income Alternatives
Model Portfolio Current Allocation
60%
25%
15%
55%
30%
15%
Equity Fixed Income Alternatives
Model Portfolio Current Allocation

India & Global Macros

India Macro
17
Manufacturing PMI remained above 55 for four consecutive months
27.430.8
47.2 4652
56.8 58.9 56.3 56.4
5.412.6
33.7 34.2
49.854.1
53.752.3
0
10
20
30
40
50
60
Manufacturing PMI Services PMI
Services PMI remained in expansionary zone for 3rd consecutive month
GST collections in Dec at all time high since its implementation
1,13,685
1,00,289 99,939 1,02,083 98,20291,916 95,379 1,03,491
1,03,184
32,172
62,151
90,917 87,422 86,449
95,4801,05,155 1,04,963
1,15,174
Apr May Jun Jul Aug Sep Oct Nov Dec
GST collection in FY20 GST collecton in FY21
December collections up 11.6% Y-o-Y
India Trade balance
-100%
-50%
0%
50%
100%
0
1500
3000
4500
De
c-1
5
Mar
-16
Jun
-16
Sep
-16
De
c-1
6
Mar
-17
Jun
-17
Sep
-17
De
c-1
7
Mar
-18
Jun
-18
Sep
-18
De
c-1
8
Mar
-19
Jun
-19
Sep
-19
De
c-1
9
Mar
-20
Jun
-20
Sep
-20
De
c-2
0
No. of new projects announced New investemnt projects % YoY- RHS
Investments continue to struggle
-20
-10
0
10
20
30
40
50
Jan-20 Feb-20 Mar-20 Apr-20 May-20 Jun-20 Jul-20 Aug-20 Sep-20 Oct-20 Nov-20 Dec-20
Imports Exports Trade Balance
Trade deficit widened to USD 15.7 billion in Dec as imports recovered and exports moderated. However in the medium term, exports should bounce back and lead the economic recovery.
Source: Edelweiss Professional Investor Research
Figures are in INR croreSource: Edelweiss Professional Investor Research, News Articles
Source: Edelweiss Research Source: Edelweiss Professional Investor Research
Global Macro
18
Strong revival in US housing market US retail sales (ex-food, auto, building material and gas stations)
(35)
(25)
(15)
(5)
5
15
25
Oct 11 Oct 12 Oct 13 Oct 14 Oct 15 Oct 16 Oct 17 Oct 18 Oct 19 Oct 20
(%, Y
oY)
US pending home sales
Strongest in a
90
95
100
105
110
115
T=0 T+1 T+2 T+3 T+4 T+5 T+6 T+7 T+8 T+9 T+10 T+11
(In
dex
reb
ased
to
10
0)
GFC COVID
US real rates in negative territory
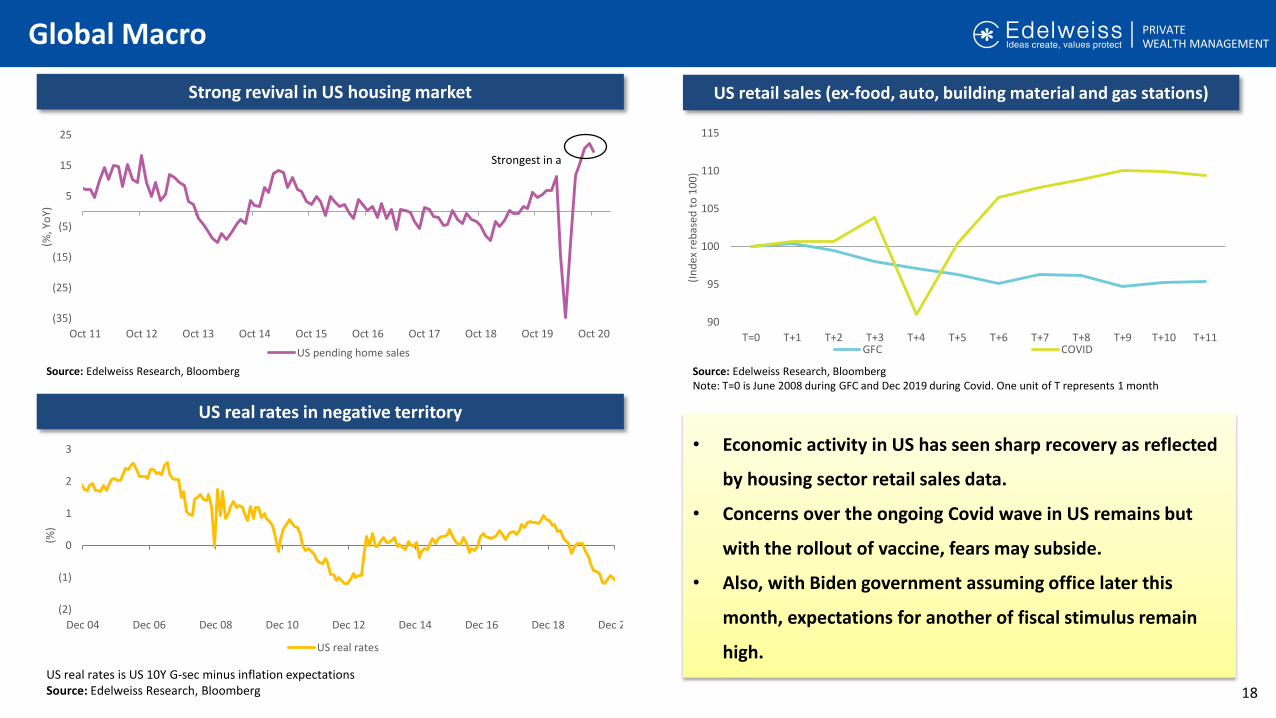
• Economic activity in US has seen sharp recovery as reflected
by housing sector retail sales data.
• Concerns over the ongoing Covid wave in US remains but
with the rollout of vaccine, fears may subside.
• Also, with Biden government assuming office later this
month, expectations for another of fiscal stimulus remain
high.
(2)
(1)
0
1
2
3
Dec 04 Dec 06 Dec 08 Dec 10 Dec 12 Dec 14 Dec 16 Dec 18 Dec 20
(%)
US real rates
US real rates is US 10Y G-sec minus inflation expectations Source: Edelweiss Research, Bloomberg
Source: Edelweiss Research, Bloomberg Source: Edelweiss Research, BloombergNote: T=0 is June 2008 during GFC and Dec 2019 during Covid. One unit of T represents 1 month

Asset Class Specific Views & Performance

Equity
Prices Are Up Significantly Since Crash In March
21
Unexpectedly strong recovery of broader market
Data Source: NSE
Still, India MCap to GDP trading at discount to that of US
-29% -32%-38%
20%26%
28%
9.2%
15.5%
26.2%24.3% 22.7% 21.7%
-40%
-30%
-20%
-10%
0%
10%
20%
30%
40%
Nifty 50 NSE Midcap 100 NSE Smallcap 100
Q1CY20 Q2CY20 Q3CY20 Q4CY20
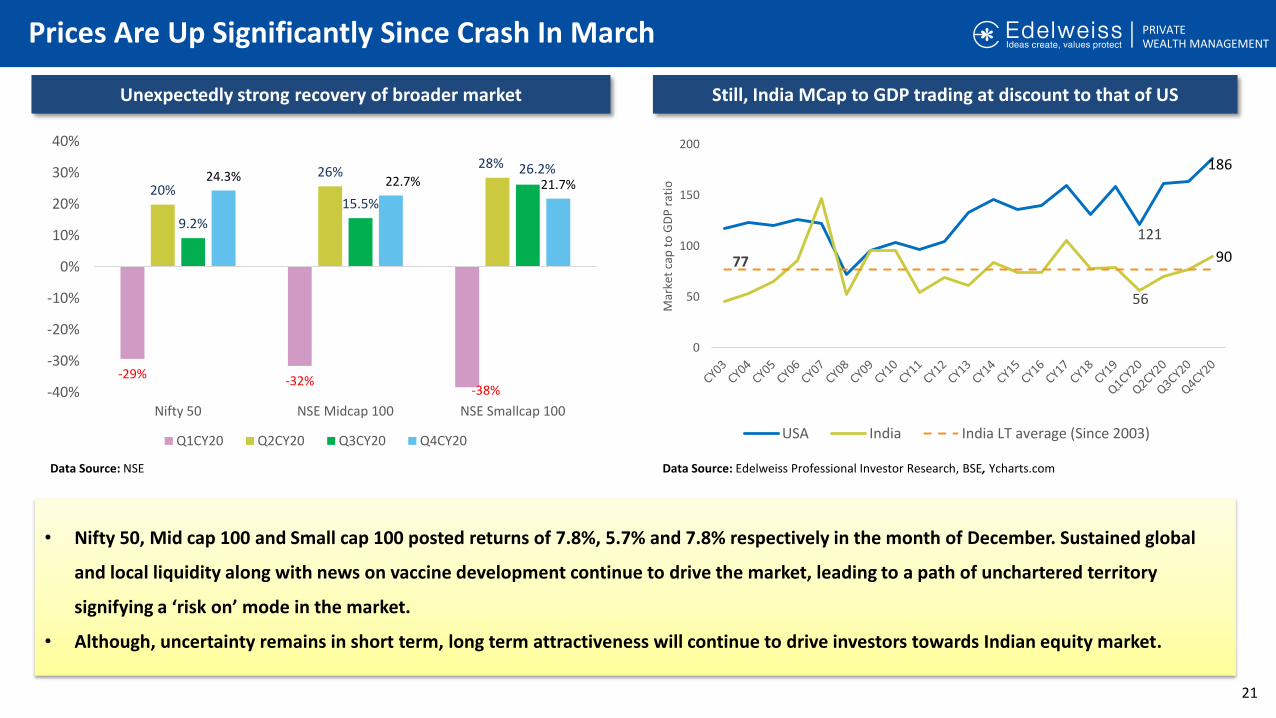
• Nifty 50, Mid cap 100 and Small cap 100 posted returns of 7.8%, 5.7% and 7.8% respectively in the month of December. Sustained global
and local liquidity along with news on vaccine development continue to drive the market, leading to a path of unchartered territory
signifying a ‘risk on’ mode in the market.
• Although, uncertainty remains in short term, long term attractiveness will continue to drive investors towards Indian equity market.
Data Source: Edelweiss Professional Investor Research, BSE, Ycharts.com
121
186
56
9077
0
50
100
150
200
Mar
ket
cap
to
GD
P r
atio
USA India India LT average (Since 2003)
Foreign Inflows Remain High
22
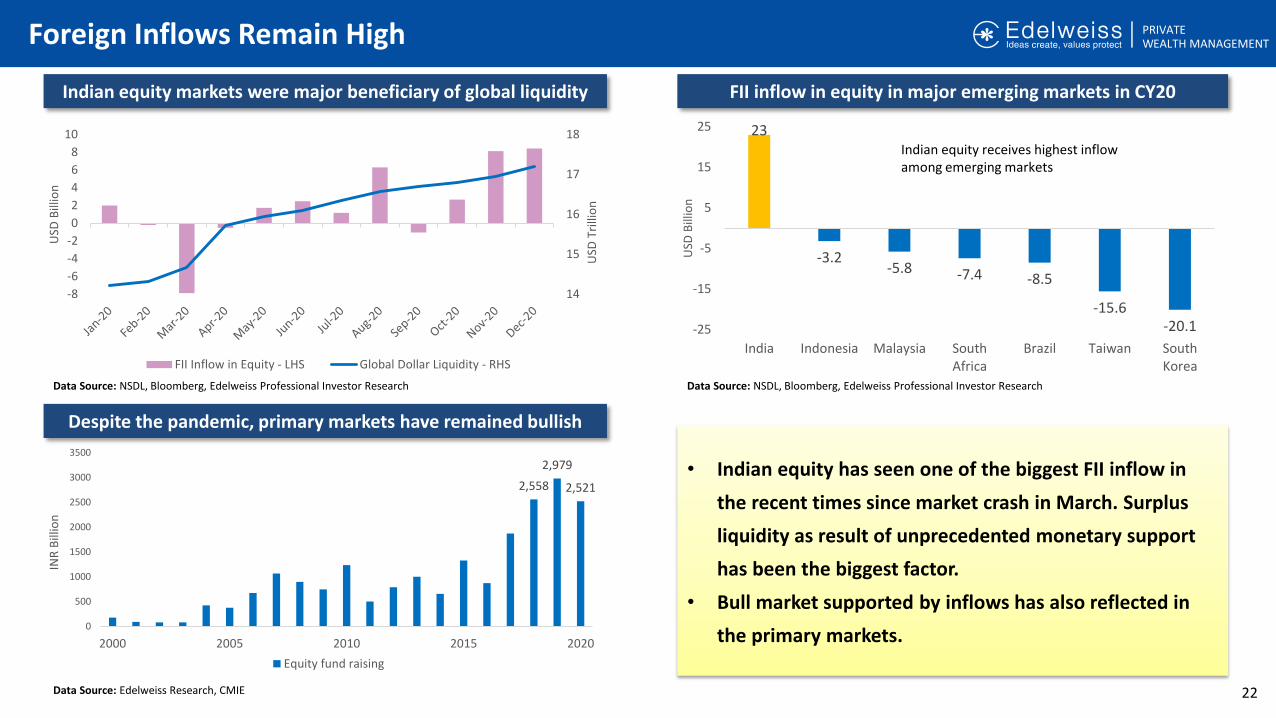
• Indian equity has seen one of the biggest FII inflow in
the recent times since market crash in March. Surplus
liquidity as result of unprecedented monetary support
has been the biggest factor.
• Bull market supported by inflows has also reflected in
the primary markets.
23
-3.2-5.8 -7.4 -8.5
-15.6-20.1-25
-15
-5
5
15
25
India Indonesia Malaysia SouthAfrica
Brazil Taiwan SouthKorea
USD
Bill
ion
14
15
16
17
18
-8
-6
-4
-2
0
2
4
6
8
10
USD
Tri
llio
n
USD
Bill
ion
FII Inflow in Equity - LHS Global Dollar Liquidity - RHS
Indian equity markets were major beneficiary of global liquidity FII inflow in equity in major emerging markets in CY20
Despite the pandemic, primary markets have remained bullish
2,558
2,979
2,521
0
500
1000
1500
2000
2500
3000
3500
2000 2005 2010 2015 2020
INR
Bill
ion
Equity fund raising
Indian equity receives highest inflow among emerging markets
Data Source: NSDL, Bloomberg, Edelweiss Professional Investor Research Data Source: NSDL, Bloomberg, Edelweiss Professional Investor Research
Data Source: Edelweiss Research, CMIE
Mixed Signals By Valuation Indicators
23
0.0
0.1
0.2
0.3
0.4
0.5
0.6
0.7
0.8
0.9
1.0
P/E Vs P/B Vs BEER Ratio Decile
PE Decile PB Decile BEER Decile
Since Jan 2001
Max MinValue As of 31st Dec20
Decile as of Dec20
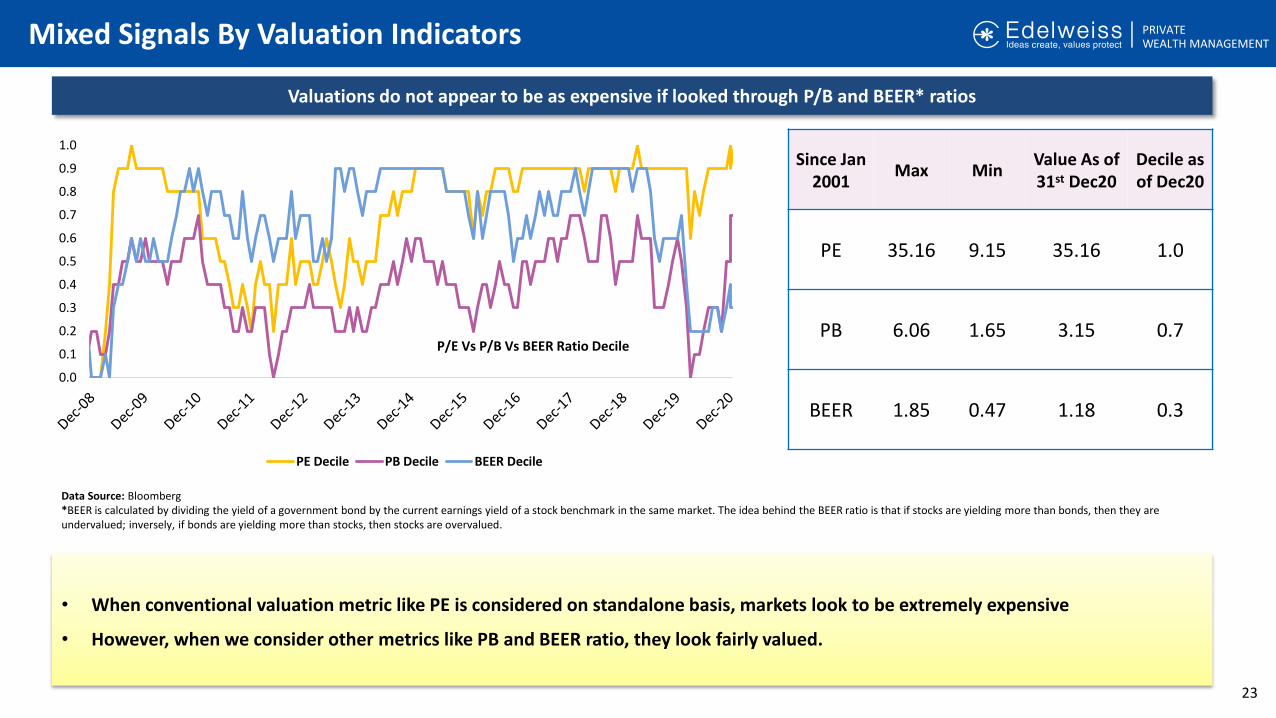
PE 35.16 9.15 35.16 1.0
PB 6.06 1.65 3.15 0.7
BEER 1.85 0.47 1.18 0.3
Valuations do not appear to be as expensive if looked through P/B and BEER* ratios
• When conventional valuation metric like PE is considered on standalone basis, markets look to be extremely expensive
• However, when we consider other metrics like PB and BEER ratio, they look fairly valued.
Data Source: Bloomberg*BEER is calculated by dividing the yield of a government bond by the current earnings yield of a stock benchmark in the same market. The idea behind the BEER ratio is that if stocks are yielding more than bonds, then they are undervalued; inversely, if bonds are yielding more than stocks, then stocks are overvalued.

Debt
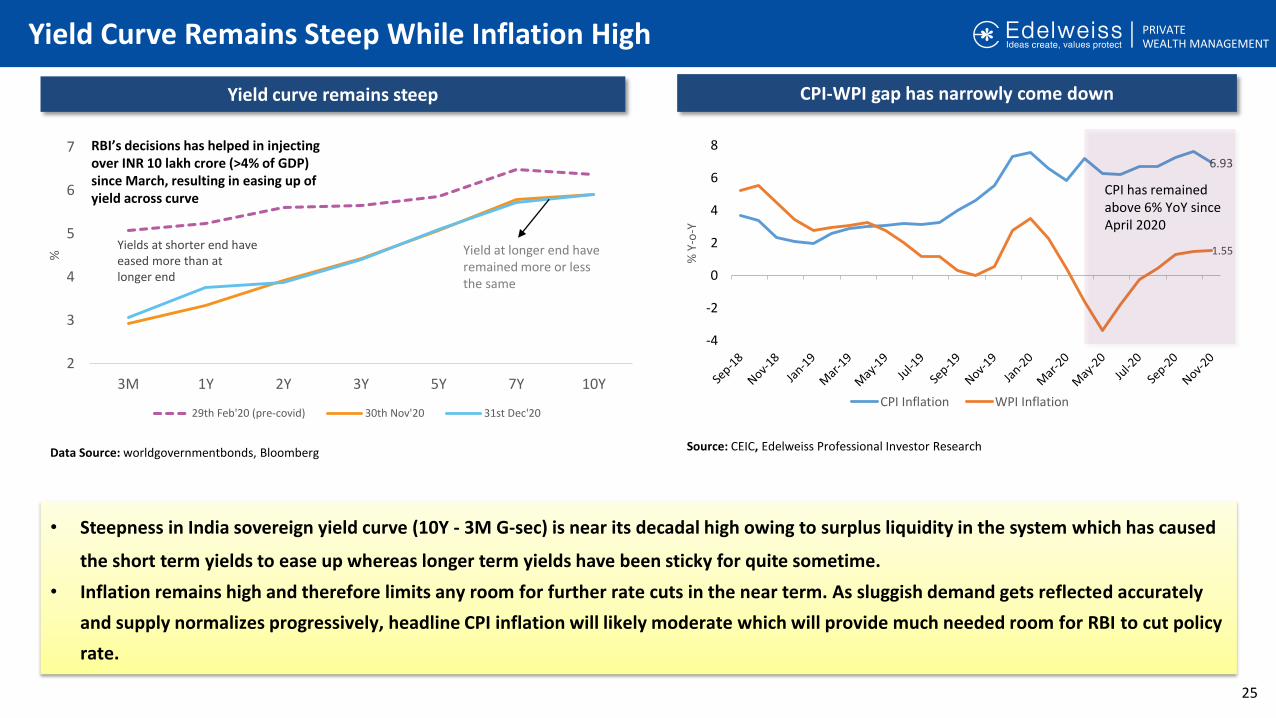
Yield Curve Remains Steep While Inflation High
25
CPI-WPI gap has narrowly come down
Source: CEIC, Edelweiss Professional Investor Research
• Steepness in India sovereign yield curve (10Y - 3M G-sec) is near its decadal high owing to surplus liquidity in the system which has caused
the short term yields to ease up whereas longer term yields have been sticky for quite sometime.
• Inflation remains high and therefore limits any room for further rate cuts in the near term. As sluggish demand gets reflected accurately
and supply normalizes progressively, headline CPI inflation will likely moderate which will provide much needed room for RBI to cut policy
rate.
6.93
1.55
-4
-2
0
2
4
6
8
% Y
-o-Y
CPI Inflation WPI Inflation
CPI has remained above 6% YoY since April 2020
2
3
4
5
6
7
3M 1Y 2Y 3Y 5Y 7Y 10Y
%
29th Feb'20 (pre-covid) 30th Nov'20 31st Dec'20
RBI’s decisions has helped in injecting over INR 10 lakh crore (>4% of GDP) since March, resulting in easing up of yield across curve
Yields at shorter end have eased more than at longer end
Yield at longer end have remained more or less the same
Yield curve remains steep
Data Source: worldgovernmentbonds, Bloomberg
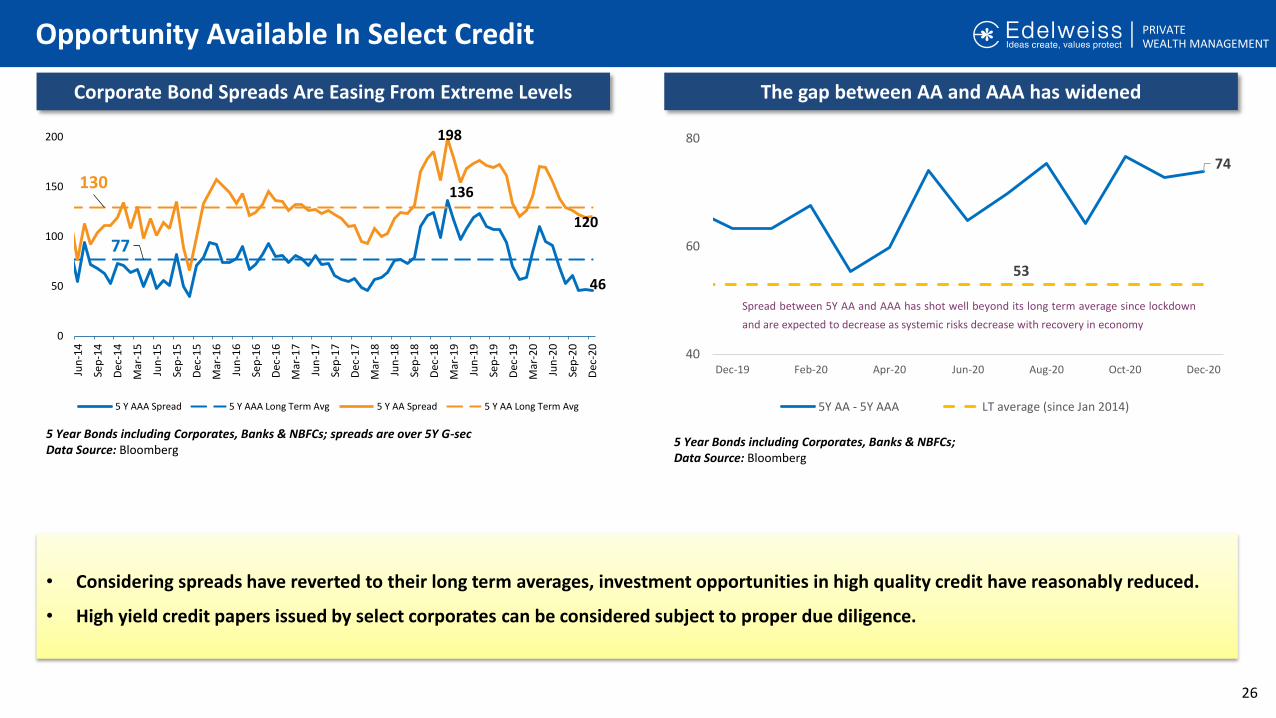
Opportunity Available In Select Credit
26
Corporate Bond Spreads Are Easing From Extreme Levels
• Considering spreads have reverted to their long term averages, investment opportunities in high quality credit have reasonably reduced.
• High yield credit papers issued by select corporates can be considered subject to proper due diligence.
5 Year Bonds including Corporates, Banks & NBFCs; spreads are over 5Y G-secData Source: Bloomberg
136
46
77
198
120
130
0
50
100
150
200
Jun
-14
Sep
-14
Dec
-14
Mar
-15
Jun
-15
Sep
-15
Dec
-15
Mar
-16
Jun
-16
Sep
-16
Dec
-16
Mar
-17
Jun
-17
Sep
-17
Dec
-17
Mar
-18
Jun
-18
Sep
-18
Dec
-18
Mar
-19
Jun
-19
Sep
-19
Dec
-19
Mar
-20
Jun
-20
Sep
-20
Dec
-20
5 Y AAA Spread 5 Y AAA Long Term Avg 5 Y AA Spread 5 Y AA Long Term Avg
The gap between AA and AAA has widened
5 Year Bonds including Corporates, Banks & NBFCs;Data Source: Bloomberg
74
53
40
60
80
Dec-19 Feb-20 Apr-20 Jun-20 Aug-20 Oct-20 Dec-20
5Y AA - 5Y AAA LT average (since Jan 2014)
Spread between 5Y AA and AAA has shot well beyond its long term average since lockdown
and are expected to decrease as systemic risks decrease with recovery in economy

Currency

INR Appreciation Remains Capped in CY20
28
INR has lagged EMFX appreciation
Data Source: Bloomberg , Edelweiss Professional Investor Research Data Source: Bloomberg , Edelweiss Professional Investor Research
Data Source: Bloomberg , Edelweiss Professional Investor Research
-25
-20
-15
-10
-5
0
5
10
CNY KRW TWD PHP SGD MYR THB IDR INR ZAR MXN RUB TRY BRL
%
CY20 Dec-20
117
105
110
115
120
125
Jan
-17
Mar
-17
May
-17
Jul-
17
Sep
-17
No
v-1
7
Jan
-18
Mar
-18
May
-18
Jul-
18
Sep
-18
No
v-1
8
Jan
-19
Mar
-19
May
-19
Jul-
19
Sep
-19
No
v-1
9
Jan
-20
Mar
-20
May
-20
Jul-
20
Sep
-20
No
v-2
0
Ind
ex
Trade Weighted REER Long Term Average
REER is still 7% above the Long term average
FPI net flows for the last one year RBI has absorbed flows to keep INR appreciation capped
581
450
475
500
525
550
575
600
USD
Bill
ion
RBI Forex Reserves
(20)
(15)
(10)
(5)
0
5
10
15
USD
Bill
ion
FPI Net Equity Flows FPI Net Debt Flows FPI Net Flows
Data Source: Bloomberg , Edelweiss Professional Investor Research

Model Portfolio
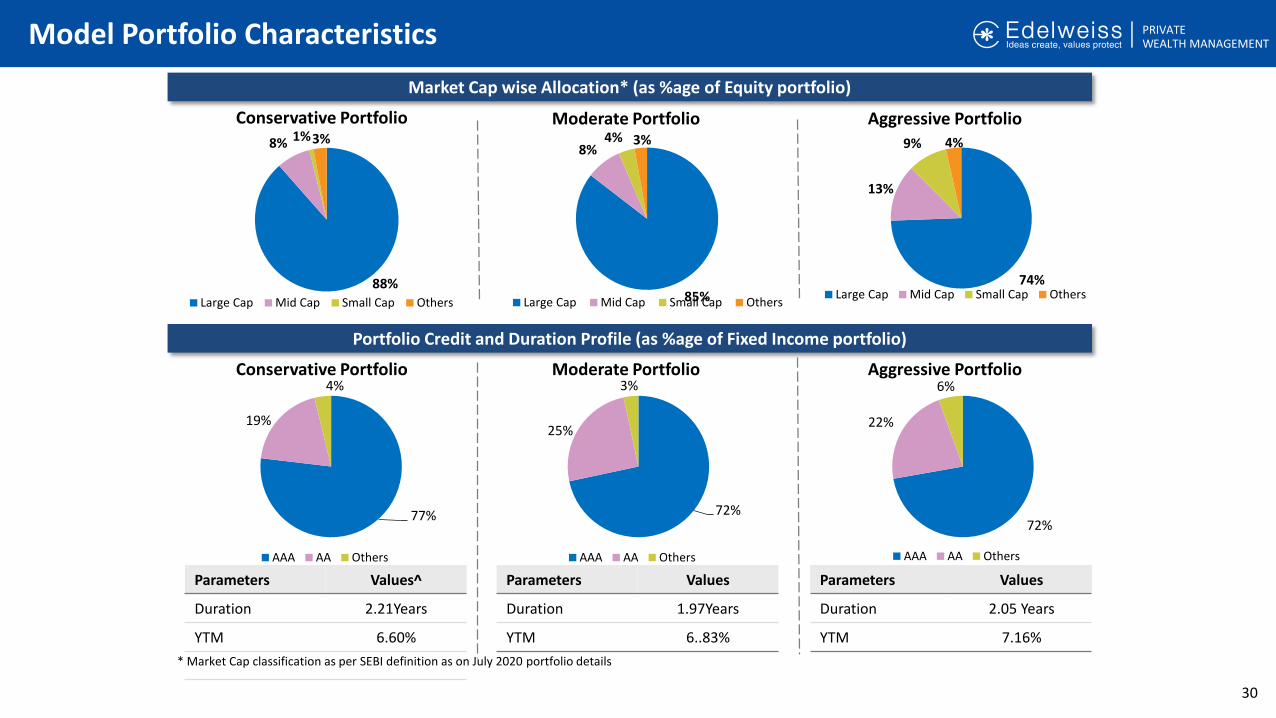
74%
13%
9% 4%
Large Cap Mid Cap Small Cap Others85%
8%4% 3%
Large Cap Mid Cap Small Cap Others
88%
8% 1%3%
Large Cap Mid Cap Small Cap Others
* Market Cap classification as per SEBI definition as on July 2020 portfolio details
Model Portfolio Characteristics
30
Parameters Values^
Duration 2.21Years
YTM 6.60%
Parameters Values
Duration 1.97Years
YTM 6..83%
Parameters Values
Duration 2.05 Years
YTM 7.16%
Market Cap wise Allocation* (as %age of Equity portfolio)
Portfolio Credit and Duration Profile (as %age of Fixed Income portfolio)
Conservative Portfolio Moderate Portfolio Aggressive Portfolio
Conservative Portfolio Moderate Portfolio Aggressive Portfolio
77%
19%
4%
AAA AA Others
72%
25%
3%
AAA AA Others
72%
22%
6%
AAA AA Others
31
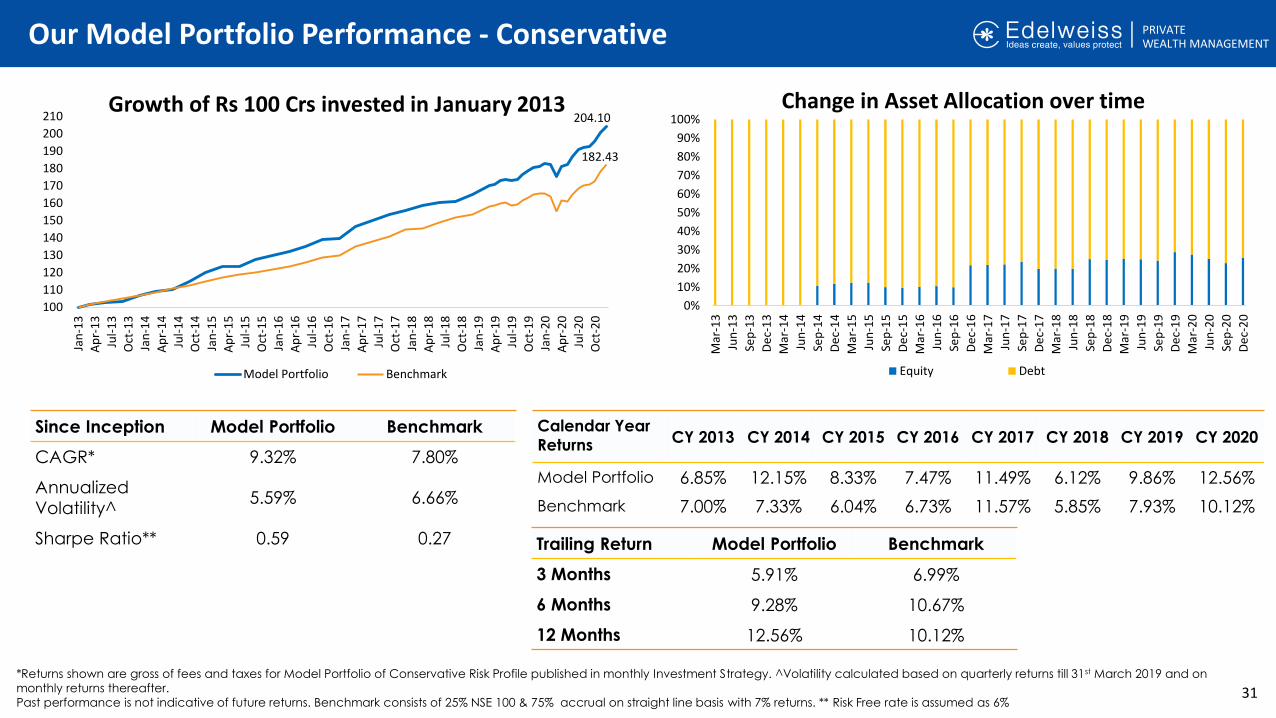
204.10
182.43
100
110
120
130
140
150
160
170
180
190
200
210
Jan
-13
Ap
r-1
3
Jul-
13
Oct
-13
Jan
-14
Ap
r-1
4
Jul-
14
Oct
-14
Jan
-15
Ap
r-1
5
Jul-
15
Oct
-15
Jan
-16
Ap
r-1
6
Jul-
16
Oct
-16
Jan
-17
Ap
r-1
7
Jul-
17
Oct
-17
Jan
-18
Ap
r-1
8
Jul-
18
Oct
-18
Jan
-19
Ap
r-1
9
Jul-
19
Oct
-19
Jan
-20
Ap
r-2
0
Jul-
20
Oct
-20
Growth of Rs 100 Crs invested in January 2013
Model Portfolio Benchmark
0%
10%
20%
30%
40%
50%
60%
70%
80%
90%
100%
Mar
-13
Jun
-13
Sep
-13
De
c-1
3
Mar
-14
Jun
-14
Sep
-14
De
c-1
4
Mar
-15
Jun
-15
Sep
-15
De
c-1
5
Mar
-16
Jun
-16
Sep
-16
De
c-1
6
Mar
-17
Jun
-17
Sep
-17
De
c-1
7
Mar
-18
Jun
-18
Sep
-18
De
c-1
8
Mar
-19
Jun
-19
Sep
-19
De
c-1
9
Mar
-20
Jun
-20
Sep
-20
De
c-2
0
Change in Asset Allocation over time
Equity Debt
Calendar Year
ReturnsCY 2013 CY 2014 CY 2015 CY 2016 CY 2017 CY 2018 CY 2019 CY 2020
Model Portfolio 6.85% 12.15% 8.33% 7.47% 11.49% 6.12% 9.86% 12.56%
Benchmark 7.00% 7.33% 6.04% 6.73% 11.57% 5.85% 7.93% 10.12%
Trailing Return Model Portfolio Benchmark
3 Months 5.91% 6.99%
6 Months 9.28% 10.67%
12 Months 12.56% 10.12%
*Returns shown are gross of fees and taxes for Model Portfolio of Conservative Risk Profile published in monthly Investment Strategy. ^Volatility calculated based on quarterly returns till 31st March 2019 and on
monthly returns thereafter.
Past performance is not indicative of future returns. Benchmark consists of 25% NSE 100 & 75% accrual on straight line basis with 7% returns. ** Risk Free rate is assumed as 6%
Our Model Portfolio Performance - Conservative
Since Inception Model Portfolio Benchmark
CAGR* 9.32% 7.80%
Annualized
Volatility^5.59% 6.66%
Sharpe Ratio** 0.59 0.27
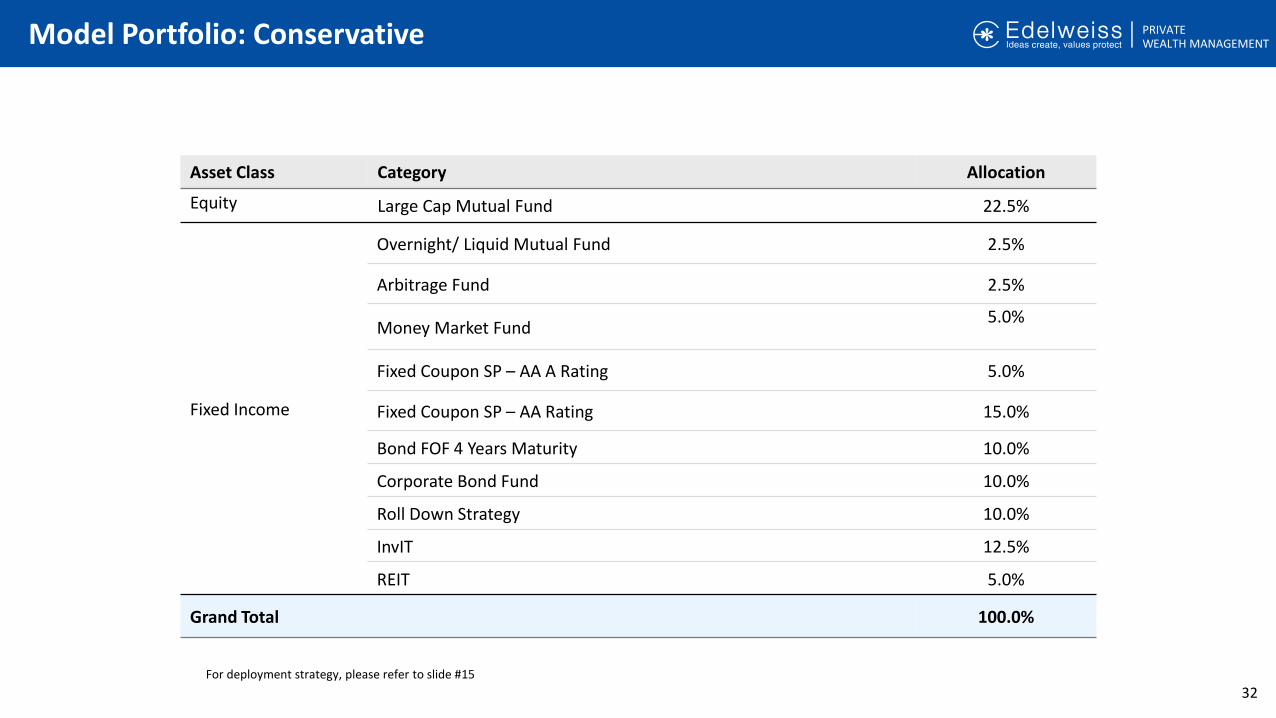
Model Portfolio: Conservative
32
Asset Class Category Allocation
Equity Large Cap Mutual Fund 22.5%
Fixed Income
Overnight/ Liquid Mutual Fund 2.5%
Arbitrage Fund 2.5%
Money Market Fund5.0%
Fixed Coupon SP – AA A Rating 5.0%
Fixed Coupon SP – AA Rating 15.0%
Bond FOF 4 Years Maturity 10.0%
Corporate Bond Fund 10.0%
Roll Down Strategy 10.0%
InvIT 12.5%
REIT 5.0%
Grand Total 100.0%
For deployment strategy, please refer to slide #15
33
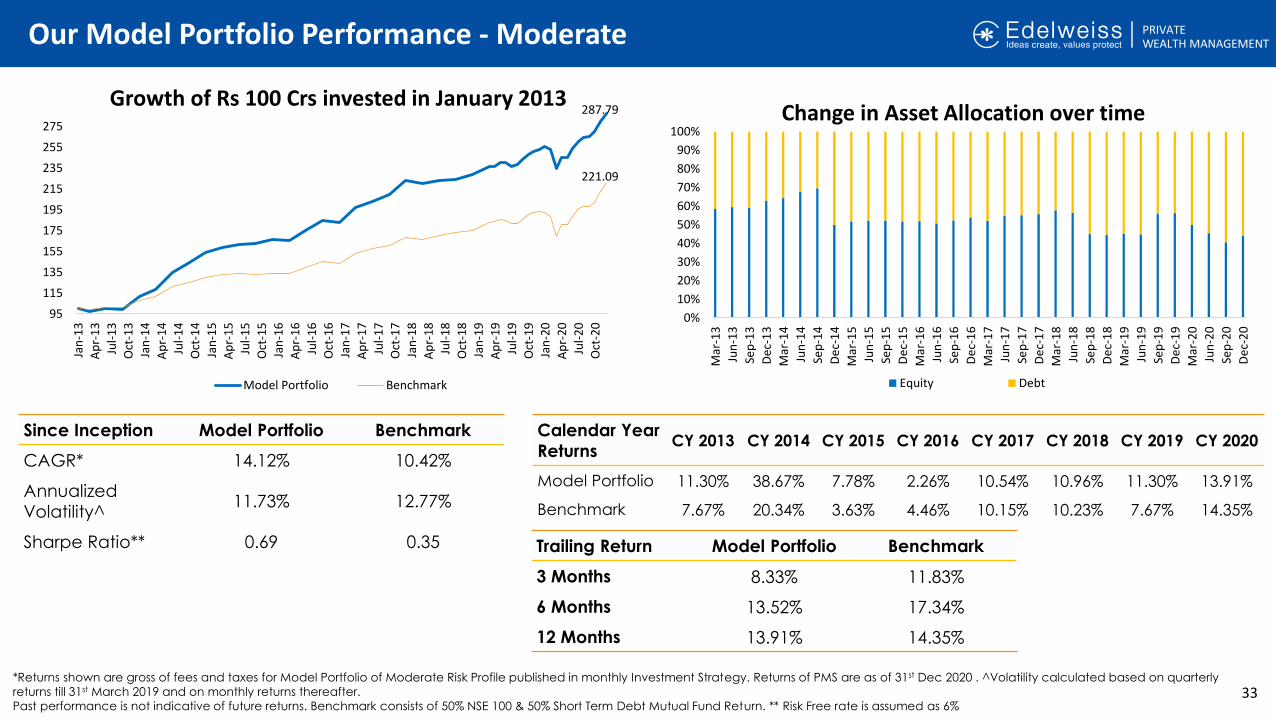
287.79
221.09
95
115
135
155
175
195
215
235
255
275
Jan
-13
Ap
r-1
3
Jul-
13
Oct
-13
Jan
-14
Ap
r-1
4
Jul-
14
Oct
-14
Jan
-15
Ap
r-1
5
Jul-
15
Oct
-15
Jan
-16
Ap
r-1
6
Jul-
16
Oct
-16
Jan
-17
Ap
r-1
7
Jul-
17
Oct
-17
Jan
-18
Ap
r-1
8
Jul-
18
Oct
-18
Jan
-19
Ap
r-1
9
Jul-
19
Oct
-19
Jan
-20
Ap
r-2
0
Jul-
20
Oct
-20
Growth of Rs 100 Crs invested in January 2013
Model Portfolio Benchmark
0%
10%
20%
30%
40%
50%
60%
70%
80%
90%
100%
Mar
-13
Jun
-13
Sep
-13
De
c-1
3
Mar
-14
Jun
-14
Sep
-14
De
c-1
4
Mar
-15
Jun
-15
Sep
-15
De
c-1
5
Mar
-16
Jun
-16
Sep
-16
De
c-1
6
Mar
-17
Jun
-17
Sep
-17
De
c-1
7
Mar
-18
Jun
-18
Sep
-18
De
c-1
8
Mar
-19
Jun
-19
Sep
-19
De
c-1
9
Mar
-20
Jun
-20
Sep
-20
De
c-2
0
Change in Asset Allocation over time
Equity Debt
Since Inception Model Portfolio Benchmark
CAGR* 14.12% 10.42%
Annualized
Volatility^11.73% 12.77%
Sharpe Ratio** 0.69 0.35
Calendar Year
ReturnsCY 2013 CY 2014 CY 2015 CY 2016 CY 2017 CY 2018 CY 2019 CY 2020
Model Portfolio 11.30% 38.67% 7.78% 2.26% 10.54% 10.96% 11.30% 13.91%
Benchmark 7.67% 20.34% 3.63% 4.46% 10.15% 10.23% 7.67% 14.35%
Trailing Return Model Portfolio Benchmark
3 Months 8.33% 11.83%
6 Months 13.52% 17.34%
12 Months 13.91% 14.35%
*Returns shown are gross of fees and taxes for Model Portfolio of Moderate Risk Profile published in monthly Investment Strategy. Returns of PMS are as of 31st Dec 2020 . ^Volatility calculated based on quarterly
returns till 31st March 2019 and on monthly returns thereafter.
Past performance is not indicative of future returns. Benchmark consists of 50% NSE 100 & 50% Short Term Debt Mutual Fund Return. ** Risk Free rate is assumed as 6%
Our Model Portfolio Performance - Moderate
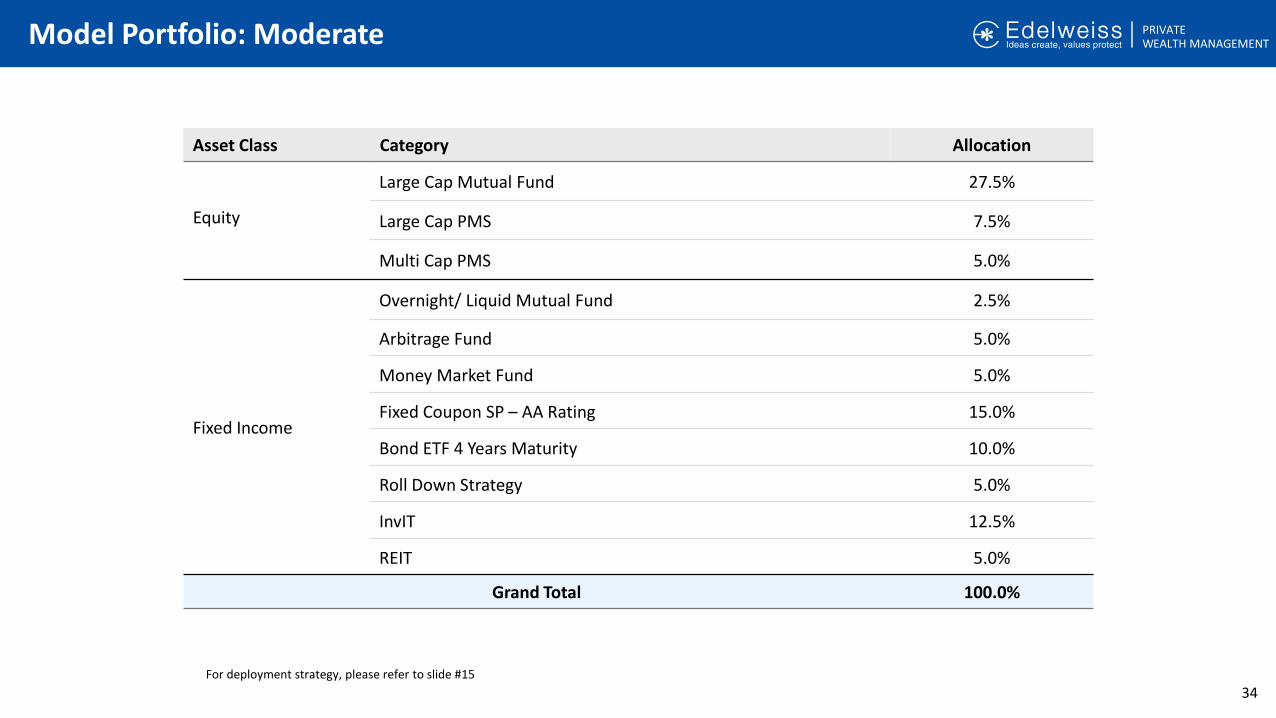
Model Portfolio: Moderate
34
Asset Class Category Allocation
Equity
Large Cap Mutual Fund 27.5%
Large Cap PMS 7.5%
Multi Cap PMS 5.0%
Fixed Income
Overnight/ Liquid Mutual Fund 2.5%
Arbitrage Fund 5.0%
Money Market Fund 5.0%
Fixed Coupon SP – AA Rating 15.0%
Bond ETF 4 Years Maturity 10.0%
Roll Down Strategy 5.0%
InvIT 12.5%
REIT 5.0%
Grand Total 100.0%
For deployment strategy, please refer to slide #15

35
346.58
227.69
90
120
150
180
210
240
270
300
330
360
Jan
-13
Ap
r-1
3
Jul-
13
Oct
-13
Jan
-14
Ap
r-1
4
Jul-
14
Oct
-14
Jan
-15
Ap
r-1
5
Jul-
15
Oct
-15
Jan
-16
Ap
r-1
6
Jul-
16
Oct
-16
Jan
-17
Ap
r-1
7
Jul-
17
Oct
-17
Jan
-18
Ap
r-1
8
Jul-
18
Oct
-18
Jan
-19
Ap
r-1
9
Jul-
19
Oct
-19
Jan
-20
Ap
r-2
0
Jul-
20
Oct
-20
Growth of Rs 100 Crs invested in January 2013
Model Portfolio Benchmark
0%
10%
20%
30%
40%
50%
60%
70%
80%
90%
100%
Mar
-13
Jun
-13
Sep
-13
De
c-1
3
Mar
-14
Jun
-14
Sep
-14
De
c-1
4
Mar
-15
Jun
-15
Sep
-15
De
c-1
5
Mar
-16
Jun
-16
Sep
-16
De
c-1
6
Mar
-17
Jun
-17
Sep
-17
De
c-1
7
Mar
-18
Jun
-18
Sep
-18
De
c-1
8
Mar
-19
Jun
-19
Sep
-19
De
c-1
9
Mar
-20
Jun
-20
Sep
-20
De
c-2
0
Change in Asset Allocation over time
Equity Debt
Since Inception Model Portfolio Benchmark
CAGR* 16.80% 10.83%
Annualized
Volatility^19.37% 16.98%
Sharpe Ratio** 0.56 0.28
Calendar Year
ReturnsCY 2013 CY 2014 CY 2015 CY 2016 CY 2017 CY 2018 CY 2019 CY 2020
Model Portfolio 13.46% 50.16% 13.05% 10.38% 31.39% -3.43% 11.04% 15.71%
Benchmark 7.37% 23.77% 1.96% 5.94% 20.88% 3.57% 10.25% 14.92%
Trailing Return Model Portfolio Benchmark
3 Months 12.03% 15.02%
6 Months 20.68% 21.82%
12 Months 15.71% 14.92%
*Returns shown are gross of fees and taxes for Model Portfolio of Aggressive Risk Profile published in monthly Investment Strategy. Returns of PMS are as of 31st Dec 2020. ^Volatility calculated based on quarterly returns till 31st
March 2019 and on monthly returns thereafter.Past performance is not indicative of future returns. Benchmark consists of 70% NSE 100 & 30% Short Term Debt Mutual Fund Return ** Risk Free rate is assumed as 6%
Our Model Portfolio Performance - Aggressive
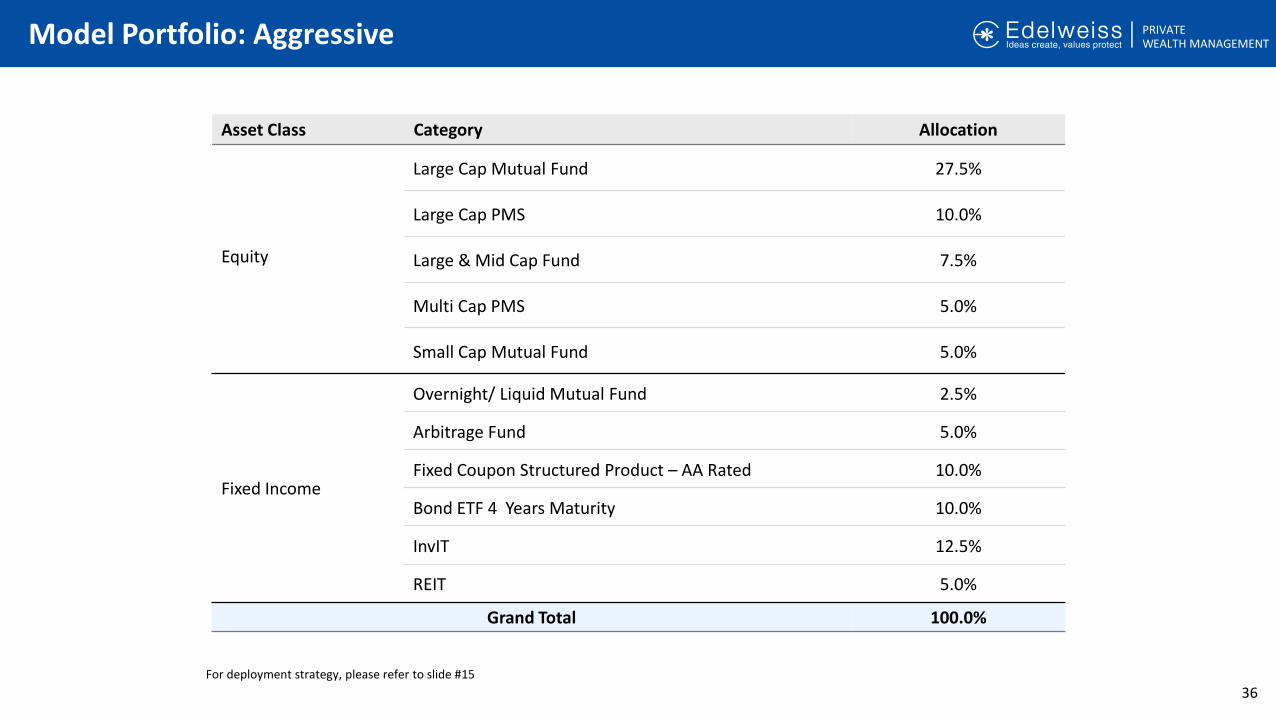
Model Portfolio: Aggressive
36
Asset Class Category Allocation
Equity
Large Cap Mutual Fund 27.5%
Large Cap PMS 10.0%
Large & Mid Cap Fund 7.5%
Multi Cap PMS 5.0%
Small Cap Mutual Fund 5.0%
Fixed Income
Overnight/ Liquid Mutual Fund 2.5%
Arbitrage Fund 5.0%
Fixed Coupon Structured Product – AA Rated 10.0%
Bond ETF 4 Years Maturity 10.0%
InvIT 12.5%
REIT 5.0%
Grand Total 100.0%
For deployment strategy, please refer to slide #15

Data Tables & Annexure
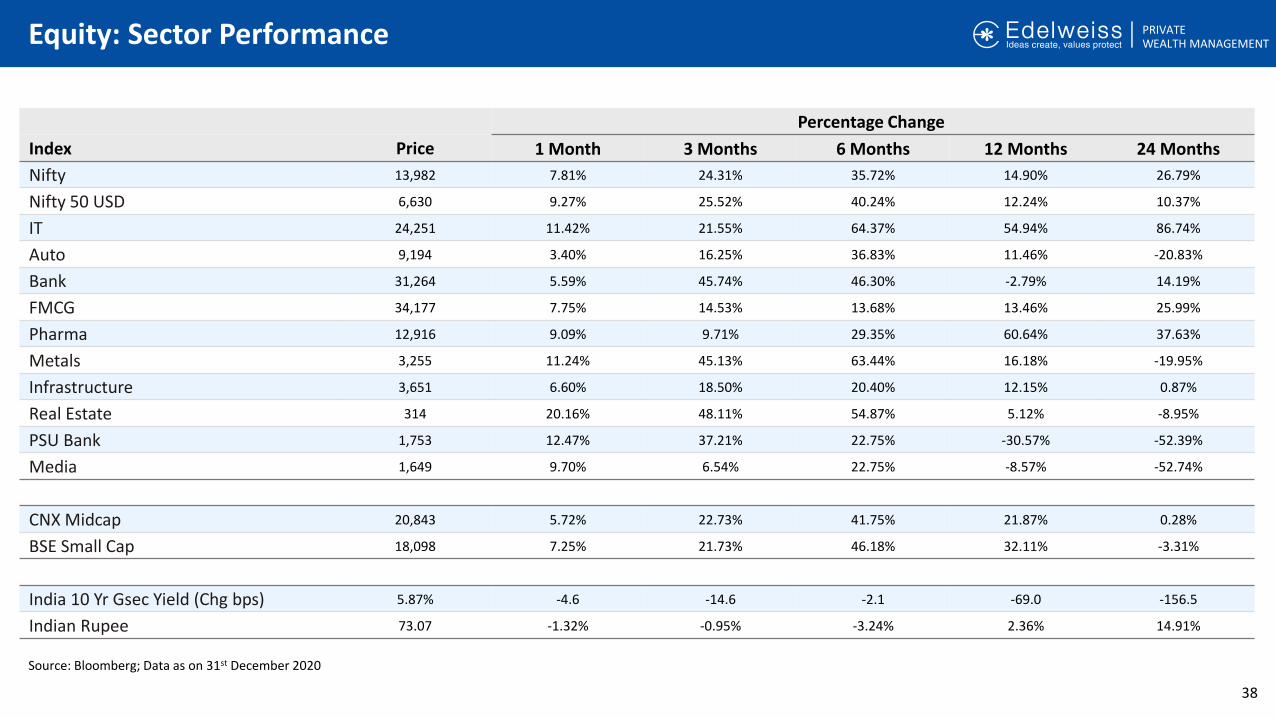
Equity: Sector Performance
38
Source: Bloomberg; Data as on 31st December 2020
Percentage Change
Index Price 1 Month 3 Months 6 Months 12 Months 24 Months
Nifty 13,982 7.81% 24.31% 35.72% 14.90% 26.79%
Nifty 50 USD 6,630 9.27% 25.52% 40.24% 12.24% 10.37%
IT 24,251 11.42% 21.55% 64.37% 54.94% 86.74%
Auto 9,194 3.40% 16.25% 36.83% 11.46% -20.83%
Bank 31,264 5.59% 45.74% 46.30% -2.79% 14.19%
FMCG 34,177 7.75% 14.53% 13.68% 13.46% 25.99%
Pharma 12,916 9.09% 9.71% 29.35% 60.64% 37.63%
Metals 3,255 11.24% 45.13% 63.44% 16.18% -19.95%
Infrastructure 3,651 6.60% 18.50% 20.40% 12.15% 0.87%
Real Estate 314 20.16% 48.11% 54.87% 5.12% -8.95%
PSU Bank 1,753 12.47% 37.21% 22.75% -30.57% -52.39%
Media 1,649 9.70% 6.54% 22.75% -8.57% -52.74%
CNX Midcap 20,843 5.72% 22.73% 41.75% 21.87% 0.28%
BSE Small Cap 18,098 7.25% 21.73% 46.18% 32.11% -3.31%
India 10 Yr Gsec Yield (Chg bps) 5.87% -4.6 -14.6 -2.1 -69.0 -156.5
Indian Rupee 73.07 -1.32% -0.95% -3.24% 2.36% 14.91%

Debt: Data Table
39
Parameters Instruments As of 31/12/2020 As of 30/11/2020 As of 30/09/2020 As of 30/06/2020 As of 31/12/2019
Money Market Rates
Repo Rate 4.00% 4.00% 4.00% 4.00% 5.15%
Reverse Repo Rate 3.35% 3.35% 3.35% 3.35% 4.90%
Call Rates 3.45% 3.40% 3.50% 3.90% 5.25%
FBIL Bank Offer Rate O/N 3.51% 3.40% 3.79% 3.89% 5.26%
364 Days T Bills 3.46% 3.39% 3.73% 3.54% 5.30%
12 M CDs 4.03% 4.03% 4.03% 4.28% 5.98%
12M Commercial Paper 4.10% 4.05% 4.15% 4.20% 7.00%
3 M Certificate of Deposit 3.33% 3.33% 3.20% 4.20% 5.08%
3 M Commercial Paper 3.40% 3.25% 3.55% 3.30% 5.78%
Government Securities
3 Y Gilt 4.46% 4.35% 4.93% 4.40% 6.24%
5 Y Gilt 5.04% 5.08% 5.39% 5.28% 6.47%
10 Y Gilt 5.87% 5.91% 6.01% 5.89% 6.56%
30 Y Gilt 6.53% 6.59% 6.75% 6.55% 7.13%
Corporate Debt
3 Year AAA 4.69% 4.71% 5.31% 5.62% 6.95%
3 Year AA 5.59% 5.56% 6.09% 6.39% 7.62%
5 Year AAA 5.51% 5.55% 6.00% 6.16% 7.17%
5 Year AA 6.25% 6.28% 6.65% 6.81% 7.80%
10 Year AAA 6.59% 6.51% 6.79% 7.05% 7.63%
10 Year AA 7.35% 7.31% 7.57% 7.78% 8.28%
Spreads (bps)(5Year AAA - 5 Year G-Sec) 46 47 61 88 70
(5Year AA - 5 Year G-Sec) 120 120 125 153 133
Source: Bloomberg; Data as on 31st December 2020

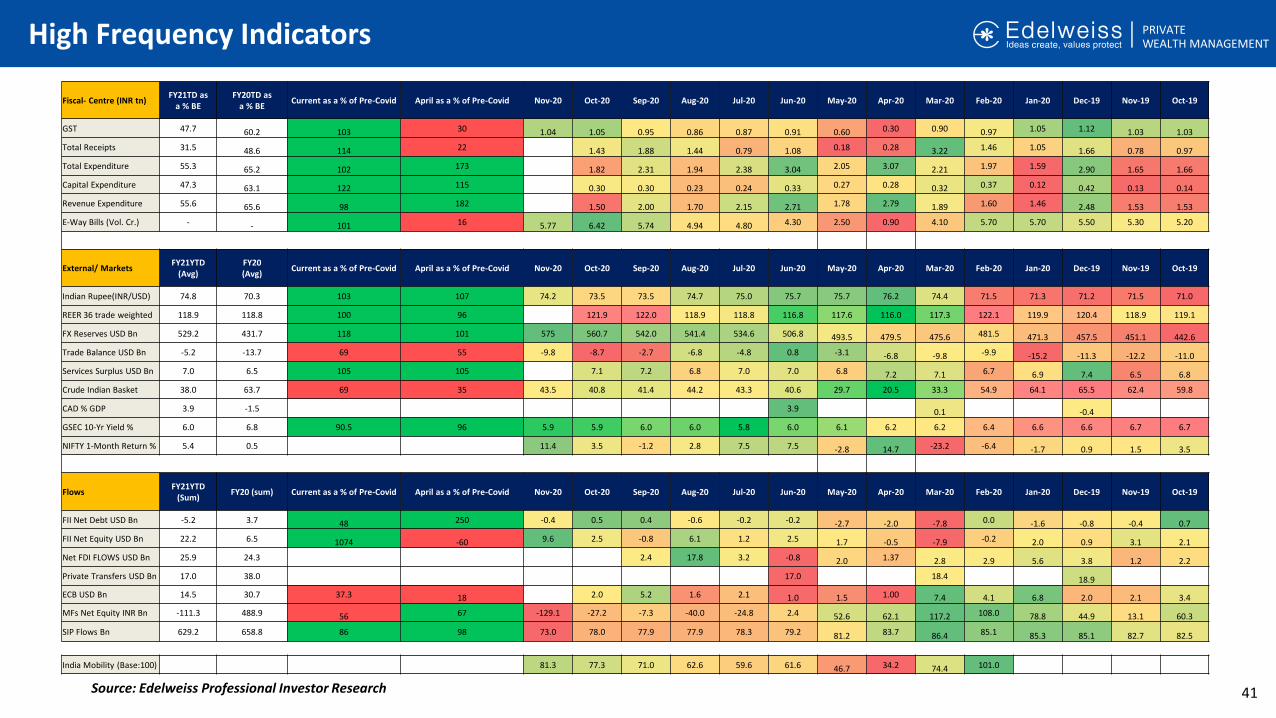
High Frequency Indicators
40Source: Edelweiss Professional Investor Research
Industry(YoY, %)FY21YTD
(Avg)FY20 (Avg) Current as a % of Pre-Covid April as a % of Pre-Covid Nov-20 Oct-20 Sep-20 Aug-20 Jul-20 Jun-20 May-20 Apr-20 Mar-20 Feb-20 Jan-20 Dec-19 Nov-19 Oct-19
Credit To Industry 0.8 4.8 98 103 -1.7 0.0 0.5 0.8 2.3 1.7 1.7 0.7 0.7 2.5 1.6 2.4 3.4
Cement Production -20.4 0.1 87 14 2.8 -3.5 -14.5 -13.5 -6.8 -21.4 -86.0 -25.1 8.6 5.0 5.5 4.1 -7.7
CV (Quarterly) -52.5 -22.3 91 19 -20.1 -84.8 -48.3 -17.2
MHCV (Quarterly) -71.5 -34.6 51 9 -48.9 -94.1 -56.8 -38.5
LCV (Quarterly) -44.1 -14.2 111 28 -8.5 -79.7 -42.7 -4.6
Coal Production -2.1 -5.3 73 62 11.5 21.2 3.7 -5.7 -15.5 -14.0 -15.6 4.0 10.3 8.1 6.2 -2.5 -17.5
Steel Production -22.4 5.4 94 17 -2.7 2.8 -1.7 -8.3 -25.4 -43.1 -78.7 -21.9 -0.4 2.2 1.9 -3.7 -1.6
Eight Core Industry -12.8 -0.1 94 40 -2.5 -0.2 -7.3 -8.0 -13.0 -22.0 -37.0 -8.5 5.6 2.2 1.3 -1.6 -5.8
IIP Mining -12.7 -0.1 79 64 -1.5 1.4 -9.0 -12.8 -19.6 -20.5 -27.0 -1.3 10.0 5.4 5.4 1.7 -8.0
IIP Electricity -5.1 0.8 105 81 11.3 4.9 -1.8 -2.5 -10.0 -14.9 -23.0 -8.2 8.1 -0.1 -0.1 -5.0 -12.2
IIP Manufacturing -19.7 0.9 96 31 3.5 -0.2 -7.9 -11.6 -16.0 -38.4 -67.1 -22.8 3.3 -1.2 -1.2 2.7 -2.1
India Money Supply(M3) 12.1 10.1 109 104 12.5 11.6 12.2 12.6 13.2 12.4 11.7 10.8 8.9 10.2 11.3 10.4 9.8 10.6
Manufacturing PMI (abs) 46.9 51.7 103 50 56.3 58.9 56.8 52.0 46.0 47.2 30.8 27.4 51.8 54.5 55.3 52.7 51.2 50.6
Services (YoY, %)FY21YTD
(Avg)FY20 (Avg) Current as a % of Pre-Covid April as a % of Pre-Covid Nov-20 Oct-20 Sep-20 Aug-20 Jul-20 Jun-20 May-20 Apr-20 Mar-20 Feb-20 Jan-20 Dec-19 Nov-19 Oct-19
Services PMI(abs) 35.7 51.0 96 10 53.7 54.1 49.8 41.8 34.2 33.7 12.6 5.4 49.3 57.5 55.5 53.3 52.7 49.2
Credit To Services 10.0 11.5 106 106 9.5 9.1 8.6 10.1 10.7 11.2 11.2 7.4 6.9 8.9 6.2 4.8 6.5
Foreign Tourist Arrival - 3.8 -66.4 -6.6 1.3 2.8 7.8 6.1
Airport Passenger Traffic -82.4 1.8 -62.2 -69.6 -78.6 -84.2 -85.3 -97.5 -99.8 -37.8 7.1 1.3 1.9 9.2 2.9
Airport cargo -40.7 -4.9 -13.9 -16.2 -29.4 -34.6 -40.6 -67.7 -82.9 -32.0 -1.2 -1.4 -4.2 -3.7 -6.5
Railway Freight Traffic -3.1 -1.3 100 60 9.0 15.4 15.5 3.9 -4.6 -7.7 -21.3 -35.3 -13.9 6.5 2.8 4.3 0.9 -8.1
Demand(YoY, %)FY21YTD
(Avg)FY20 (Avg) Current as a % of Pre-Covid April as a % of Pre-Covid Nov-20 Oct-20 Sep-20 Aug-20 Jul-20 Jun-20 May-20 Apr-20 Mar-20 Feb-20 Jan-20 Dec-19 Nov-19 Oct-19
Personal Loans 10.5 16.5 104 99 9.3 9.2 10.6 11.2 10.5 10.6 12.1 15.0 17.1 16.9 15.9 16.4 17.2
Rural Wage Growth - 3.6 5.0 6.4 7.6 7.9 6.8 4.0 4.0 3.8 3.8 3.2 3.0 3.0
Non-Oil Imports -26.8 -6.3 98 45 -1.2 -2.2 -14.3 -20.1 -28.5 -45.2 -43.4 -59.7 -32.9 -1.6 -6.7 -11.6 -10.3 -9.2
Passenger cars -18.8 -24.9 106 0 10.5 9.7 28.9 14.1 -12.0 -58.0 -89.9 -53.3 -53.3 -8.8 -8.1 -8.4 -10.8 -6.3
Vans -23.2 -35.1 8.2 29.2 10.6 3.8 -18.8 -62.1 -86.4 -69.9 -69.9 -32.8 -27.7 -53.4 -34.3 -35.1
Utility Vehicles -7.5 4.1 17.2 20.5 24.5 15.5 13.9 -31.2 -75.5 -44.7 -44.7 0.1 2.6 30.0 32.7 22.2
POL Consumption -13.9 2.3 97 51 -3.7 2.4 -4.4 -16.0 -12.1 -9.0 -19.4 -48.7 -17.8 4.5 -0.6 0.1 10.7 -1.5
Two wheelers -16.6 -15.6 121 0 13.4 16.9 11.6 3.0 -15.2 -38.6 -83.8 -39.8 -39.8 -19.8 -16.1 -16.6 -14.3 -14.4
Three wheelers -77.3 -5.0 97 51 -57.6 -60.9 -71.9 -75.3 -77.2 -80.2 -95.3 -100.0 -58.3 -31.0 12.7 22.1 4.5 -3.6
Consumer Price Inflation 6.9 3.7 98 102 6.9 7.6 7.3 6.7 6.7 6.2 6.3 7.2 5.8 6.6 7.6 7.4 5.5 4.6
Core CPI( ex food and fuel)
5.3 4.1 147 121 5.8 5.7 5.5 5.6 5.5 5.1 4.94.8
3.84.1
4.2 3.73.5 3.5
Wholesale Price Inflation -0.3 1.4 54 -54 1.6 1.5 1.3 0.2 -0.3 -1.8 -3.4-1.6
0.42.3
3.1 2.60.6 0.2
High Frequency Indicators
41Source: Edelweiss Professional Investor Research
Fiscal- Centre (INR tn)FY21TD as
a % BEFY20TD as
a % BECurrent as a % of Pre-Covid April as a % of Pre-Covid Nov-20 Oct-20 Sep-20 Aug-20 Jul-20 Jun-20 May-20 Apr-20 Mar-20 Feb-20 Jan-20 Dec-19 Nov-19 Oct-19
GST 47.7 60.2 103 30 1.04 1.05 0.95 0.86 0.87 0.91 0.60 0.30 0.90 0.97 1.05 1.12 1.03 1.03
Total Receipts 31.5 48.6 114 22 1.43 1.88 1.44 0.79 1.08 0.18 0.28 3.22 1.46 1.05 1.66 0.78 0.97
Total Expenditure 55.3 65.2 102 173 1.82 2.31 1.94 2.38 3.04 2.05 3.07 2.21 1.97 1.59 2.90 1.65 1.66
Capital Expenditure 47.3 63.1 122 115 0.30 0.30 0.23 0.24 0.33 0.27 0.28 0.32 0.37 0.12 0.42 0.13 0.14
Revenue Expenditure 55.6 65.6 98 182 1.50 2.00 1.70 2.15 2.71 1.78 2.79 1.89 1.60 1.46 2.48 1.53 1.53
E-Way Bills (Vol. Cr.) - - 101 16 5.77 6.42 5.74 4.94 4.80 4.30 2.50 0.90 4.10 5.70 5.70 5.50 5.30 5.20
External/ Markets FY21YTD
(Avg)FY20(Avg)
Current as a % of Pre-Covid April as a % of Pre-Covid Nov-20 Oct-20 Sep-20 Aug-20 Jul-20 Jun-20 May-20 Apr-20 Mar-20 Feb-20 Jan-20 Dec-19 Nov-19 Oct-19
Indian Rupee(INR/USD) 74.8 70.3 103 107 74.2 73.5 73.5 74.7 75.0 75.7 75.7 76.2 74.4 71.5 71.3 71.2 71.5 71.0
REER 36 trade weighted 118.9 118.8 100 96 121.9 122.0 118.9 118.8 116.8 117.6 116.0 117.3 122.1 119.9 120.4 118.9 119.1
FX Reserves USD Bn 529.2 431.7 118 101 575 560.7 542.0 541.4 534.6 506.8 493.5 479.5 475.6 481.5 471.3 457.5 451.1 442.6
Trade Balance USD Bn -5.2 -13.7 69 55 -9.8 -8.7 -2.7 -6.8 -4.8 0.8 -3.1 -6.8 -9.8 -9.9 -15.2 -11.3 -12.2 -11.0
Services Surplus USD Bn 7.0 6.5 105 105 7.1 7.2 6.8 7.0 7.0 6.8 7.2 7.1 6.7 6.9 7.4 6.5 6.8
Crude Indian Basket 38.0 63.7 69 35 43.5 40.8 41.4 44.2 43.3 40.6 29.7 20.5 33.3 54.9 64.1 65.5 62.4 59.8
CAD % GDP 3.9 -1.5 3.9 0.1 -0.4
GSEC 10-Yr Yield % 6.0 6.8 90.5 96 5.9 5.9 6.0 6.0 5.8 6.0 6.1 6.2 6.2 6.4 6.6 6.6 6.7 6.7
NIFTY 1-Month Return % 5.4 0.5 11.4 3.5 -1.2 2.8 7.5 7.5 -2.8 14.7 -23.2 -6.4 -1.7 0.9 1.5 3.5
FlowsFY21YTD
(Sum)FY20 (sum) Current as a % of Pre-Covid April as a % of Pre-Covid Nov-20 Oct-20 Sep-20 Aug-20 Jul-20 Jun-20 May-20 Apr-20 Mar-20 Feb-20 Jan-20 Dec-19 Nov-19 Oct-19
FII Net Debt USD Bn -5.2 3.7 48 250 -0.4 0.5 0.4 -0.6 -0.2 -0.2 -2.7 -2.0 -7.8 0.0 -1.6 -0.8 -0.4 0.7
FII Net Equity USD Bn 22.2 6.5 1074 -60 9.6 2.5 -0.8 6.1 1.2 2.5 1.7 -0.5 -7.9 -0.2 2.0 0.9 3.1 2.1
Net FDI FLOWS USD Bn 25.9 24.3 2.4 17.8 3.2 -0.8 2.0 1.37 2.8 2.9 5.6 3.8 1.2 2.2
Private Transfers USD Bn 17.0 38.0 17.0 18.4 18.9
ECB USD Bn 14.5 30.7 37.3 18 2.0 5.2 1.6 2.1 1.0 1.5 1.00 7.4 4.1 6.8 2.0 2.1 3.4
MFs Net Equity INR Bn -111.3 488.9 56 67 -129.1 -27.2 -7.3 -40.0 -24.8 2.4 52.6 62.1 117.2 108.0 78.8 44.9 13.1 60.3
SIP Flows Bn 629.2 658.8 86 98 73.0 78.0 77.9 77.9 78.3 79.2 81.2 83.7 86.4 85.1 85.3 85.1 82.7 82.5
India Mobility (Base:100) 81.3 77.3 71.0 62.6 59.6 61.6 46.7 34.2 74.4 101.0
Disclaimer
42
Edelweiss Securities Limited (ESL) is currently in the business of Investment Advisory since December 2019. It is registered with SEBI as an Investment adviser (SEBI registration number INA200014140) and with AMFI (ARN- 3857). ESL is a subsidiary of Edelweiss Financial Services Limited. ESL has not received any order/notice for from Securities Exchange Board of India for any disciplinary action initiated against ESL with regard to the activities carried out by ESL in the capacity of Investment Advisor. In its capacity as Investment Advisor, ESL is providing advice to clients on the portfolio of client and does not provide advice for any particular securities/stocks or derivatives. ESL may or may not hold any position with regard to the any stock/security or derivative which is held by the client. ESL hereby mentions that there is no obligation on the client of ESL’s Investment Advisory division to execute any transaction through ESL or any other company of Edelweiss group in any manner.This document is prepared by ESL for its client in India and does not constitute an offer or solicitation for the purchase or sale of any financial instrument or as an official confirmation of any transaction. The information contained herein is from publicly available data or other sources believed to be reliable. This document is provided for assistance only and is not intended to be and must not alone be taken as the basis for an investment decision. The user assumes the entire risk of any use made of this information. Each recipient of this document should make such investigation as it deems necessary to arrive at an independent evaluation of an investment in the securities of companies referred to in this document (including the merits and risks involved), and should consult his own advisors to determine the merits and risks of such investments. The investment discussed or views expressed may not be suitable for all investors. Mutual Fund Investments are subject to market risk. Kindly read the offer document / schemes document carefully before making an investment.This information is strictly confidential and is being furnished to you solely for your information. This information should not be reproduced or redistributed or passed on directly or indirectly in any form to any other person or published, copied, in
whole or in part, for any purpose. This document is not directed or intended for distribution to, or use by, any person or entity who is a citizen or resident of or located in any locality, state, country or other jurisdiction, where such distribution, publication, availability or use would be contrary to law, regulation or which would subject ESL and associates / group companies to any registration or licensing requirements within such jurisdiction. The distribution of this document / report in certain jurisdictions may be restricted by law, and persons in whose possession this report comes, should observe, any such restrictions. The information given in this document / report is as of the date of this report and there can be no assurance that future results or events will be consistent with this information. This information is subject to change without any prior notice. ESL reserves the right to make modifications and alterations to this statement as may be required from time to time. ESL or any of its associates / group companies shall not be in any way responsible for any loss or damage that may arise to any person from any inadvertent error in the information contained in this report. ESL is committed to providing independent and transparent recommendation to its clients. Neither ESL nor any of its associates, group companies, directors, employees, agents or representatives shall be liable for any damages whether direct, indirect, special or consequential including loss of revenue or lost profits that may arise from or in connection with the use of the information. Our proprietary trading and investment businesses may make investment decisions that are inconsistent with the recommendations expressed herein. Past performance is not necessarily a guide to future performance. The information provided in these document / remains, unless otherwise stated, the copyright of ESL. All layout, design, original artwork, concepts and other Intellectual Properties, remains the property and copyright of ESL and may not be used in any form or for any purpose whatsoever by any party without the express written permission of the copyright holders.ESL shall not be liable for any delay or any other interruption which may occur in presenting the data due to any reason including network (Internet) reasons or snags in the system, break down of the system or any other equipment, server
breakdown, maintenance shutdown, breakdown of communication services or inability of ESL to present the data. In no event shall ESL be liable for any damages, including without limitation direct or indirect, special, incidental, or consequential damages, losses or expenses arising in connection with the data presented by the ESL through this document / report. We will not treat recipients as customers by virtue of their receiving this report.ESL and its associates, officer, directors, and employees may: (a) from time to time, have long or short positions in, and buy or sell the securities thereof, of company(ies), mentioned herein or (b) be engaged in any other transaction involving such securities and earn brokerage or other compensation or act as a market maker in the financial instruments of the subject company/company(ies) discussed herein or act as advisor or lender/borrower to such company(ies) or have other potential/material conflict of interest with respect to any information and opinions at the time of publication of document. ESL may have proprietary long/short position in the above mentioned scrip(s) and therefore should be considered as interested. The views provided herein are general in nature and do not consider risk appetite or investment objective of any particular investor; readers are requested to take independent professional advice before investing. This should not be construed as invitation or solicitation to do business with ESL. Participants in foreign exchange transactions may incur risks arising from several factors, including the following: (i) exchange rates can be volatile and are subject to large fluctuations; (ii) the value of currencies may be affected by numerous market factors, including world and national economic, political and regulatory events, events in equity and debt markets and changes in interest rates; and (iii) currencies may be subject to devaluation or government imposed exchange controls which could affect the value of the currency. Investors in securities such as ADRs and Currency Derivatives, whose values are affected by the currency of an underlying security, effectively assume currency risk.
Disclaimer
43
Investment in securities market are subject to market risks, read all the related documents carefully before investing.Edelweiss Global Wealth Management Limited or EGWML is currently in the business of Investment Advisory since June 2015 and Distribution of third party products since 2010. It is registered with SEBI as an Investment adviser (SEBI registration number INA000003098) and with AMFI (ARN- 104095). Edelweiss Global Wealth Management offer its’ investment advisory services and distribution services from two divisions namely Investment Advisory division and Distribution division and receives/may receive distribution commission for the products sold to its clients. EGWML is Group Company of Edelweiss Financial Services Ltd. and EGWML may distribute the products of the group companies of the EFSL as per the regulatory guidelines. Currently EGWML is providing Investment advice to its clients. EGWML has not received any order/notice for from Securities Exchange Board of India for any disciplinary action initiated against EGWML with regard to the activities carried out by EGWML. In its capacity as Investment Advisor, EGWML is providing advice to clients on the portfolio of client and does not provide advice for any particular securities/stocks or derivatives. EGWML may or may not hold any position with regard to the any stock/security or derivative which is held by the client. EGWML hereby mentions that there is no obligation on the client of EGWML’s Investment Advisory division to execute any transaction through EGWML or any other company of Edelweiss group in any manner.This document is prepared by Edelweiss Securities Ltd.. Edelweiss Securities Ltd. provided this document to Edelweiss Global Wealth Management Ltd. (EGWML) for communication to EGWML’s client in India and does not constitute an offer or solicitation for the purchase or sale of any financial instrument or as an official confirmation of any transaction. This document should not be considered as an Investment advice. The information contained herein is from publicly available data or other sources believed to be reliable. This document is provided for assistance only and is not intended to be and must not alone be taken as the basis for an investment decision. The user assumes the entire risk of any use made of this information. Each recipient of this document should make such investigation as it deems necessary to arrive at an independent evaluation of an investment in the securities of companies referred to in this document (including the merits and risks involved), and should consult his own Investment advisors to determine the merits and risks of such investments. The investment discussed or views expressed may not be suitable for all investors. Mutual Fund Investments are subject to market risk. Kindly read the offer document / schemes document carefully before making an investment.This information is strictly confidential and is being furnished to you solely for your information. This information should not be reproduced or redistributed or passed on directly or indirectly in any form to any other person or published, copied, in whole or in part, for any purpose. This document is not directed or intended for distribution to, or use by, any person or entity who is a citizen or resident of or located in any locality, state, country or other jurisdiction, where such distribution, publication, availability or use would be contrary to law, regulation or which would subject EGWML and associates / group companies to any registration or licensing requirements within such jurisdiction. The distribution of this document / report in certain jurisdictions may be restricted by law, and persons in whose possession this report comes, should observe, any such restrictions. The information given in this document / report is as of the date of this report and there can be no assurance that future results or events will be consistent with this information. This information is subject to change without any prior notice. EGWML reserves the right to make modifications and alterations to this statement as may be required from time to time. EGWML or any of its associates / group companies shall not be in any way responsible for any loss or damage that may arise to any person from any inadvertent error in the information contained in this report. EGWML is committed to providing independent and transparent recommendation to its clients. Neither EGWML nor any of its associates, group companies, directors, employees, agents or representatives shall be liable for any damages whether direct, indirect, special or consequential including loss of revenue or lost profits that may arise from or in connection with the use of the information. Our proprietary trading and investment businesses may make investment decisions that are inconsistent with the recommendations expressed herein. Past performance is not necessarily a guide to future performance. The information provided in these document / remains, unless otherwise stated, the copyright of EGWML. All layout, design, original artwork, concepts and other Intellectual Properties, remains the property and copyright of EGWML may not be used in any form or for any purpose whatsoever by any party without the express written permission of the copyright holders.EGWML shall not be liable for any delay or any other interruption which may occur in presenting the data due to any reason including network (Internet) reasons or snags in the system, break down of the system or any other equipment, server breakdown, maintenance shutdown, breakdown of communication services or inability of the EGWML and EBL to present the data. In no event shall EGWML be liable for any damages, including without limitation direct or indirect, special, incidental, or consequential damages, losses or expenses arising in connection with the data presented by the EGWML through this document / report. We will not treat recipients as customers by virtue of their receiving this report.EGWML and its associates, officer, directors, and employees may: (a) from time to time, have long or short positions in, and buy or sell the securities thereof, of company(ies), mentioned herein or (b) be engaged in any other transaction involving such securities and earn brokerage or other compensation or act as a market maker in the financial instruments of the subject company/company(ies) discussed herein or act as advisor or lender/borrower to such company(ies) or have other potential/material conflict of interest with respect to any information and opinions at the time of publication of document. EGWML may have proprietary long/short position in the above mentioned scrip(s) and therefore should be considered as interested. The views provided herein are general in nature and do not consider risk appetite or investment objective of any particular investor; readers are requested to take independent professional advice before investing. This should not be construed as invitation or solicitation to do business with EGWML. Participants in foreign exchange transactions may incur risks arising from several factors, including the following: ( i) exchange rates can be volatile and are subject to large fluctuations; ( ii) the value of currencies may be affected by numerous market factors, including world and national economic, political and regulatory events, events in equity and debt markets and changes in interest rates; and (iii) currencies may be subject to devaluation or government imposed exchange controls which could affect the value of the currency. Investors in securities such as ADRs and Currency Derivatives, whose values are affected by the currency of an underlying security, effectively assume currency risk.The data contained in this document is only indicative / illustrative. Before opening any attachments please check them for viruses and defects.The data would be provided to the clients on an "as is" and "where-is" basis, without any warranty. Edelweiss or its subsidiaries and associated companies shall not be liable for any delay or any other interruption which may occur in providing the data due to any reason including network (Internet) reasons or snags in the system, break down of the system or any other equipment, server breakdown, maintenance shutdown, breakdown of communication services or inability of the Edelweiss or its subsidiaries and associated companies to provide the data. In no event shall the EGWML be liable for any damages, including without limitation direct or indirect, special, incidental, or consequential damages, losses or expenses arising in connection with the data provided by the EGWML or its subsidiaries and associated companies.
Entity Name Edelweiss Global Wealth Management Limited
Type of Registration Non-Individual
Registration Number INA000003098
Validity of registration Valid till it is suspended or cancelled by the Board
Address & Contact No. Edelweiss House, Off CST Road, Kalina, Mumbai 400098
Principal Officer Vimal Khajuria , +91 (22) 45046526 , [email protected]
SEBI regional/local office address.Securities and Exchange Board of India
SEBI Bhavan Plot No. C 4-A, G Block,Bandra Kurla Complex,Bandra East, Mumbai- 400051.
Disclaimer
44
Investment in securities market are subject to market risks, read all the related documents carefully before investing.Broking and DP services offered by Edelweiss Broking Limited under SEBI Registration No.: INZ000005231 (Member of NSE, BSE and MSE) and IN-DP-NSDL-314-2009 (DP with NSDL and CDSL). Investor grievance resolution team: 040-40316936. Name of the Compliance Officer for Trading & DP - Mr. Brijmohan Bohra, Email IDs: [email protected] / [email protected]. Corporate Office: Edelweiss House, Off CST Road, Kalina, Mumbai - 400098; Tel. 18001023335 / (022) 42722200 / 40094279. Registered Office: . Registered Office: 2nd Floor, Office No. 201 to 203, Zodiac Plaza, Xavier College Road, Off C G Road, Ahmedabad - 380009. Contact: (079) 40019900 / 66629900Edelweiss Broking Ltd. acts in the capacity of distributor for Products such as OFS, Mutual Funds and NCD etc. Mutual Fund Investments are subject to market risks. Please read all scheme related documents carefully before investing. Investment in the securities involves risks, investor should consult his own advisors to determine the merits and risks of investment.This document is prepared by Edelweiss Securities Ltd.. Edelweiss Securities Ltd. provided this document to Edelweiss Broking Ltd (EBL) for distributing to EBL’s client in India and does not constitute an offer or solicitation for the purchase or sale of any financial instrument or as an official confirmation of any transaction. This document should not be considered as an Investment advice. The information contained herein is from publicly available data or other sources believed to be reliable. This document is provided for assistance only and is not intended to be and must not alone be taken as the basis for an investment decision. The user assumes the entire risk of any use made of this information. Each recipient of this document should make such investigation as it deems necessary to arrive at an independent evaluation of an investment in the securities of companies referred to in this document (including the merits and risks involved), and should consult his own Investment advisors to determine the merits and risks of such investments. The investment discussed or views expressed may not be suitable for all investors. Mutual Fund Investments are subject to market risk. Kindly read the offer document / schemes document carefully before making an investment.This information is strictly confidential and is being furnished to you solely for your information. This information should not be reproduced or redistributed or passed on directly or indirectly in any form to any other person or published, copied, in whole or in part, for any purpose. This document is not directed or intended for distribution to, or use by, any person or entity who is a citizen or resident of or located in any locality, state, country or other jurisdiction, where such distribution, publication, availability or use would be contrary to law, regulation or which would subject EBL and associates / group companies to any registration or licensing requirements within such jurisdiction. The distribution of this document / report in certain jurisdictions may be restricted by law, and persons in whose possession this report comes, should observe, any such restrictions. The information given in this document / report is as of the date of this report and there can be no assurance that future results or events will be consistent with this information. This information is subject to change without any prior notice. EBL reserves the right to make modifications and alterations to this statement as may be required from time to time. EBL or any of its associates / group companies shall not be in any way responsible for any loss or damage that may arise to any person from any inadvertent error in the information contained in this report. EBL is committed to providing independent and transparent recommendation to its clients. Neither EBL nor any of its associates, group companies, directors, employees, agents or representatives shall be liable for any damages whether direct, indirect, special or consequential including loss of revenue or lost profits that may arise from or in connection with the use of the information. Our proprietary trading and investment businesses may make investment decisions that are inconsistent with the recommendations expressed herein. Past performance is not necessarily a guide to future performance. The information provided in these document / remains, unless otherwise stated, the copyright of EBL. All layout, design, original artwork, concepts and other Intellectual Properties, remains the property and copyright of EBL and may not be used in any form or for any purpose whatsoever by any party without the express written permission of the copyright holders.EBL shall not be liable for any delay or any other interruption which may occur in presenting the data due to any reason including network (Internet) reasons or snags in the system, break down of the system or any other equipment, server breakdown, maintenance shutdown, breakdown of communication services or inability of the EBL to present the data. In no event shall EBL be liable for any damages, including without limitation direct or indirect, special, incidental, or consequential damages, losses or expenses arising in connection with the data presented by the EBL through this document / report. We will not treat recipients as customers by virtue of their receiving this report.EBL and its associates, officer, directors, and employees may: (a) from time to time, have long or short positions in, and buy or sell the securities thereof, of company(ies), mentioned herein or (b) be engaged in any other transaction involving such securities and earn brokerage or other compensation or act as a market maker in the financial instruments of the subject company/company(ies) discussed herein or act as advisor or lender/borrower to such company(ies) or have other potential/material conflict of interest with respect to any information and opinions at the time of publication of document. EBL may have proprietary long/short position in the above mentioned scrip(s) and therefore should be considered as interested. The views provided herein are general in nature and do not consider risk appetite or investment objective of any particular investor; readers are requested to take independent professional advice before investing. This should not be construed as invitation or solicitation to do business with EBL. Participants in foreign exchange transactions may incur risks arising from several factors, including the following: ( i) exchange rates can be volatile and are subject to large fluctuations; ( ii) the value of currencies may be affected by numerous market factors, including world and national economic, political and regulatory events, events in equity and debt markets and changes in interest rates; and (iii) currencies may be subject to devaluation or government imposed exchange controls which could affect the value of the currency. Investors in securities such as ADRs and Currency Derivatives, whose values are affected by the currency of an underlying security, effectively assume currency risk.The data contained in this document is only indicative / illustrative. Before opening any attachments please check them for viruses and defects.The data would be provided to the clients on an "as is" and "where-is" basis, without any warranty. Edelweiss or its subsidiaries and associated companies shall not be liable for any delay or any other interruption which may occur in providing the data due to any reason including network (Internet) reasons or snags in the system, break down of the system or any other equipment, server breakdown, maintenance shutdown, breakdown of communication services or inability of the Edelweiss or its subsidiaries and associated companies to provide the data. In no event shall the Edelweiss be liable for any damages, including without limitation direct or indirect, special, incidental, or consequential damages, losses or expenses arising in connection with the data provided by the Edelweiss or its subsidiaries and associated companies.