Embed Size (px)
Citation preview


Workshop Brochure Page 2
www.DanielAmerman.com
Investment Strategies Workshop2020 Edition
Presented by Daniel R. Amerman, CFA
Minneapolis Airport MarriottBloomington, MN, April 18-19, 2020
Table Of Contents
Workshop Agenda: A Focus On Eighteen Solutions 3
A Model That Better Fits The Data 10
Red/Black Matrix Introduction 17
How The Model Performed: Seven 2019 Scenario Results 23
Supporting Analysis Links 33
Testimonials From Prior Participants 34
About Daniel Amerman 42
Pricing, Discounts & Payment Information 45
Workshop Package Savings 46
Meeting Schedule & Hotel Information 47
Disclaimer 48
Workshop Brochure Page 3
www.DanielAmerman.com
Workshop Agenda: A Focus On Eighteen Solutions
A) Recent major developments:
z 1) The fast moving impact of the coronavirus
z 2) Recent Developments, Winter & Spring 2020
z 3) The Reversal to a Black to Black cycle, Potential For Black To Red
z 4) The merger of the National Debt Supercycle with the Cycles Of Crisis & The Containment Of Crisis
B) Emerging Problems With Financial Repression &
Monetary Creation
z 1) The five pillars of how very large national debts are controlled, and the interest rate, inflation and investment price implications
z 2) Reserves based monetary creation – the new method since 2008 for how trillions in new money is created and spent, at below market interest rates and without triggering inflation (Benjamin Bernanke’s Magic Money Trick)
z 3) The nine, sometimes conflicting, uses of the Magic Money trick, and how the economy, government, and stock, bond and real estate markets all now depend on this new form of monetary creation
z 4) The fundamental limitations on how much money can be created this way
Workshop Brochure Page 4
www.DanielAmerman.com
C) Why the 2020s are likely to be very different than the
2010s
z 1) A fundamental increase in the risks from recession
z 2) A major decrease in the ability to contain a crisis
z 3) The developing risk in the 2020s to what is now being taken for granted – the ability to use monetary creation as a funding source without triggering high rates of inflation
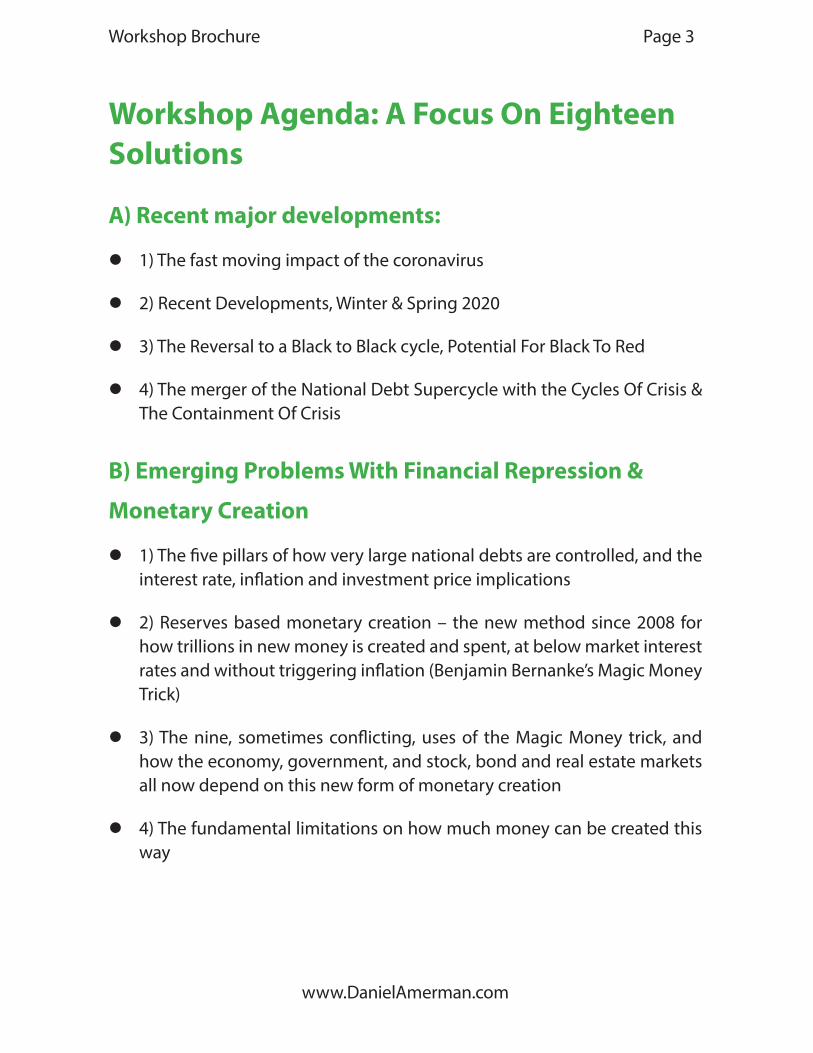
Eighteen Distinct Practical Applications / Solutions, In
Three Categories
D) Investment Cycles Strategies (Red/Black Matrix)
z 1) Understanding what is actually changing investment & home prices
z 2) How stock prices change in each stage of the cycles of crisis and the containment of crisis

Workshop Brochure Page 5
www.DanielAmerman.com
z 3) How Bond prices change in each stage of the cycles
z 4) How to get inside the Fed’s game and use long bonds as a crisis investment strategy
z 5) How home and investment property prices change at each stage in the cycles
z 6) The sequence of stock, bond, real estate and gold price changes within each stage of the cycles
z (The six applications above are based on the foundation of the “Investment Strategies For Crisis & The Containment Of Crisis” DVD set, which is the first of the three categories of solution strategies found in the Triple Strategies set. While it builds on the foundation, the workshop presentation is a separate asset with quite a bit that is not in the DVD set.)
E) Hard Asset Strategies
z 7) How precious metals prices change at each stage in the cycles

Workshop Brochure Page 6
www.DanielAmerman.com
z 8) Price inflation based precious metals strategies
z 9) Asset deflation based precious metals strategies – what precious metals do best
z 10) Understanding the unprecedented role of the Fed as an (effective) active opponent of gold investors
z 11) The unique advantages of the “barbaric relic of a yellow metal” as limits are reached during cycles of increasing central banking interventions
z 12) How to get inside the Fed’s game and use precious metals as a central banking hedge for outsized gains in crisis
z (The six applications above are based on the foundation of the “Gold Out Of The Box, 2020s Edition” DVD set, which is the second of the three categories of solution strategies found in the Triple Strategies set. The relationship between the DVDs and the workshop is the greatest with this group out of the three, with the value added of questions and discussion in a group session.)
F) Real Estate Based Asset/Liability Management (ALM)
Strategies

Workshop Brochure Page 7
www.DanielAmerman.com
z 13) How to use ALM to take advantage of the both the national debt and the Federal Reserve when it comes to their shared need for very low interest rates
z 14) How to use ALM to turn inflation into wealth and take advantage of the both the national debt and the Federal Reserve when it comes to their shared need for inflation
z 15) A third way to use ALM to get inside the Fed’s game and take advantage of its plans for the containment of crisis (the most potentially profitable of the three)
z 16) Combining the three ALM liability driven arbitrage strategies for outsized gains
z 17) Two forms of risk management for ALM strategies
z 18) The powerful advantages of using ALM strategies as a hedge within a broader and diversified portfolio
Workshop Brochure Page 8
www.DanielAmerman.com
z (The six applications above are based on the foundation of the “Creating Win-Win-Win Solutions Using Real Estate-Based Asset Liability Management Strategies” DVD set, which is the third of the three categories of solution strategies found in the Triple Strategies set. While it builds on the foundation, the workshop presentation is a separate asset with quite a bit that is not in the DVD set, particularly with regard to taking financial advantage of the national debt and the Fed cycles.)
G) Scenario Analysis With Investment Implications For Stocks, Bonds, Real Estate & Precious Metals At Each Stage (Red/Black Matrix)
z 1) The two forks in the path
z 2) The five scenarios
z 3) Stock return implications for each fork and scenario
z 4) Bond return implications for each fork and scenario
z 5) Real Estate return implications for each fork and scenario
z 6) Precious metal return implications for each fork and scenarioMore Information
The workshop is a highly valuable resource for current and future retirees who are financially preparing for a future that - realistically - will include some challenges. The scope of the workshop goes far beyond retirement investing, however, and financial professionals as well as younger individual investors may receive the greatest benefits of all.
Workshop participants will receive a manual for the presentation. This will include a detailed outline, supporting graphs and financial exhibits, and supporting articles & analyses with much more detail on some of the subjects covered in the workshop.

Workshop Brochure Page 9
www.DanielAmerman.com
The two day presentation will take place in a relatively small seminar room with a classroom atmosphere. The focus is on communication, and attendance will be limited so that participants can easily ask questions and engage in back and forth discussions about what is being covered.
Workshop Brochure Page 10
www.DanielAmerman.com
A Model That Better Fits The DataLet’s say that our goal is to maximize our investment returns, and minimize our risks. And in order to do that, we have to make a choice:
A) Invest for reality and the situation as it is, wherever that may lead us; or
B) Take the easy and popular route, even if it ignores the situation we are in.
Which is the better choice, “A” or “B”?
Many people would not see the distinction - for the easy and popular route, what we are encouraged to believe, is that the process of reliably and safely creating wealth over the long term is no mystery, but rather is effectively a solved science.
What this belief system boils down to is that the financial patterns of the United States and other developed nations in the 20th Century are assumed to be a fixed and governing reality. And while the specifics may vary in the short term, we can supposedly be confident over the longer term that the past will endlessly repeat itself when it comes to how stocks, bonds and other assets will perform in the future.
However, there is a problem with that belief system when it comes to the last twenty or so years - it hasn’t been working. We have seen the collapse of two asset bubbles, with results that include the Financial Crisis of 2008, and the most severe recession since the Great Depression of the 1930s. We have also had unprecedented Federal Reserve interventions to contain those crises, including creating trillions of dollars out of the nothingness, and forcing the lowest interest rates in history.
Most importantly, we have also seen record or near record valuations for stocks, bonds, real estate and precious metals.
From the perspective of the patterns of the past - those are all abnormalities, although what is abnormal is a matter of perspective.
Workshop Brochure Page 11
www.DanielAmerman.com
From a mainstream perspective, the ruinous financial damage from the collapses of the bubbles, the Great Recession, and the Federal Reserve effectively wiping out the ability of retirees and retirement investors to earn interest income were each complete shocks and surprises, abnormalities that should never have happened.
The traditional alternative to the mainstream is a “doom and gloom” perspective, and from that perspective, the last twenty or so years have also been deeply abnormal. It is now the crises that are expected - but the Federal Reserve actions are a bizarre form of “cheating” that should not have worked, and the record high prices for stocks, bonds and real estate are all completely unexpected abnormalities.
In most fields, if we have to disregard most of the data for the last 20 years because it doesn’t fit the model, then a question should arise - are we using the right model? And if the subject is important - such as the value of our life savings and potential standard of living for what could be decades of retirement - then shouldn’t we be insisting on a model that actually fits the data, instead of ignoring much of the data as being “abnormalities”?
The Crisis & Containment Of Crisis Analysis Series
The series of analyses linked below is based upon the foundation principles of finance and economics, as well as many years of work. The premise behind the analytical series is that investment results in the 21st century have in practice been dominated by cycles of crisis and the containment of crisis.
http://danielamerman.com/va/ccc/RedBlackSeries.html
As developed in those analyses, when we take that perspective - the abnormalities disappear and the data far better fits the model.
The sharp losses caused by the popping of asset bubbles become rational and expected.
Federal Reserve interventions and the destruction of interest income for retirement investors becomes rational and expected.

Workshop Brochure Page 12
www.DanielAmerman.com
Most importantly, record or near record prices for stocks, bonds, real estate and precious metals all become rational and expected at various points in the cycle.
The last twenty years have included some of the worst financial conditions that most of us have experienced in our lifetimes. The last twenty years have also included some of the most profitable market conditions that we have ever seen.
Both are true simultaneously - and there is good reason to think that both could potentially be true in the future. To protect ourselves from the risks and to position ourselves to profit from the opportunities, we have to be able to truly see and understand the logical relationships between crisis, the containment of crisis, and investment price movements in each of the major categories.
What If There Is A Third Iteration?
Finding an investment model that better fits the data may sound quite abstract for the average person.
What needs to be kept in mind, however, is that these data points are our lives, our financial security, what our actual standard of living will be in retirement, and whether we can retire at all.
If we invest all that we have on the basis of a model that has been a poor fit with the data for almost 20 years, and the model continues to be a poor fit - then we have no security and no assurances.
Perhaps the easiest way to illustrate this is to ask a quite simple question: what if we get a third iteration? Starting in the year 2000, we’ve had two Red Zone crises (more on what that means in the pages that follow), and we’ve also had two Black Zone containments of crisis. What if there’s another round to the cycle?

Workshop Brochure Page 13
www.DanielAmerman.com
From a mainstream individual financial planning perspective, the data points of the last two bubbles popping, the tech stock bubble and the Financial Crisis of 2008, have already been (effectively) thrown out as being rare abnormalities that never should have happened in the first place. That means that the potential data point of a third crisis - and perhaps the largest crisis if amplification continues - is ignored, and the possibility of it is more or less precluded by definition.
So, if there is a third iteration, and our only protection was to theoretically exclude the possibility of a third crisis - then we have no protection whatsoever. There would be devastating financial damage to tens of millions of retirees and retirement investors (and pension funds).
Because we have in practice had two previous rounds of “abnormalities”, a previously obscure term has become part of the professional vocabulary, and that is “sequence of returns risk”. As was demonstrated in the real world in 2000 and 2008, long term averages do not protect individual investors if there is a sharp enough loss that occurs near to the year they retire or in retirement. There may not be enough time to recover from the damage, and the loss of financial security and/or lifestyle can be permanent over their remaining years.
Not Seeing The Third Containment
Now, let’s consider a different financial model, which is that of “doom & gloom” investors. Their financial model completely incorporates the previous two episodes of crisis, for they are the very core of the model. So if there is a third round of Red Zone crisis - these investors are likely to come through with flying colors, with financial security intact and possibly in better shape than ever.
However, what if there is not just a third round of crisis, but a third round of the Black Zone containment of crisis? A third crisis could be an existential event for the United States government and the Federal Reserve, and they would have extraordinary motivations to do whatever they could to contain the crisis, prevent a financial meltdown, and try to get the economy going again.
Workshop Brochure Page 14
www.DanielAmerman.com
That could be a daunting task - but never forget that the law and the very nature of money itself are not fixed, but are variable, and can be changed by the government and Federal Reserve if the need is urgent enough. We saw this the last time around, and it could certainly happen again, perhaps even in amplified form if there is an amplification of the crisis.
Now, a crisis can deeply impact asset prices and returns across all the asset categories, and that is reasonably well understood. What is far less understood is that extraordinary interventions to contain crisis can also have a dominating impact on asset returns and prices.
How the containment of crisis can produce record or near record prices for multiple asset categories including stocks, bonds and real estate - even while destroying the interest income that is one of foundations of retirement financial planning - is not taught in Finance 101, and it is not part of the conventional wisdom. It not only not part of Modern Portfolio Theory, but it contradicts the very foundation assumptions of MPT, which are based upon investors determining prices rather than governmental interventions.
But nonetheless, what we have seen since 2001 has been ever more aggressive Federal Reserve interventions, including the lowest interest rates in 50 years, followed by ZIRP (Zero Interest Rate Policies) and the lowest rates in history. We’ve seen the Federal Reserve using quantitative easing to create dollars by the hundreds of billions to stop a collapse of the global financial system in 2008, and then even more to effectively fund the purchase of most of U.S. homes that sold in 2009 and early 2010, and then even more trillions to effectively fund a big chunk of the U.S. national debt.
And the results of this seemingly bizarre process have been not been some dark scenario, but record real estate prices, record bond prices and record stock prices. The price of not understanding the process is to miss out on record profits in different asset categories at different times.
Because the “doom and gloom” model does not incorporate the containment of crisis - it cannot see this process. The amount of data that must be thrown out here is actually worse than with mainstream investors, because most of years since 2001 have been dominated by the containment of crisis.
Workshop Brochure Page 15
www.DanielAmerman.com
In a classic “doom and gloom” model, crisis is supposed to lead to an annihilation of the value of paper currency as well as much of the financial system. From that perspective, record asset prices and profits in the aftermath of crisis are completely illogical events that should not have happened in the first place, and they can therefore be safely ignored as abnormalities that won’t happen again.
So while a “doom and gloomer” can come through a third round of crisis just fine, the risk is that they will not be able to see a third round of the containment of crisis. They therefore risk staying hunkered down in their financial bunkers for many years after the crisis has passed, discarding the data points of what is actually happening and missing out on what could be extraordinary profit opportunities in multiple markets, even while the value of their crisis oriented investments continues to decline.
The Advantages Of Seeing & Using All The Data
This is a short introduction to a much larger body of work, and there is not room herein to fully develop what follows. But as a start, let’s consider the advantages of using a financial model that includes all of the data points.
There is no certainty that there will be another Red Zone crisis. But if it does happen for a third time then a model that sees with clarity the data points that have already happened, and allows for the significant possibility of crisis has major advantages over a model that ignores what has happened and precludes the possibility of its happening again.
There are greater chances of defense, and of being able to preserve the value of assets. There are greater chances of offense, and of being able to aggressively take advantage of the major price swings that accompany crisis.
There is no certainty that there will be another Black Zone containment of crisis. But if it does happen for a third time, and if we see the data points, and if we understand why they are happening and what the implications are - then we have the ability to potentially benefit from major price swings in multiple different asset categories at different points in time.
Workshop Brochure Page 16
www.DanielAmerman.com
The greatest benefit of all that comes from moving to a model of crisis and the containment of crisis is the ability to see the cycles.
A key difference between normality and cycles of crisis and the containment of crisis is that with the cycles there are higher highs, and lower lows, and they can occur closer together. So a cycle is a major price movement across multiple categories in the first half of the cycle, followed by quite different major price movements across multiple categories in the second part of the cycle. This is true whether we are looking at a Red to Black cycle, or a Black to Red cycle.
If the price swings are from higher highs to lower lows for us on both sides of the cycle - the results could be life changing in a quite negative way.
If we mix it up and our strategy gets one side of the cycle right and the other side wrong - then it all depends on the specifics.
But if we were to get both sides of the cycle right, and go from lower lows to higher highs, two times in succession on both sides of the cycle - then the results could be life changing in a very positive way.
The future is never certain - but the knowledge we have and the choices we make can shift the odds in our favor, compared to what would otherwise be the case.
If the model we are using to make our choices requires throwing out large chunks of the last twenty years as being abnormalities because they don’t fit our model - then our odds of success may not be what we think they are.
On the other hand, if our decision making changes to a model that fully includes all of the data points, where none are abnormalities but rather all are rational and expected - then the odds may indeed move materially in our favor.
Workshop Brochure Page 17
www.DanielAmerman.com
Red/Black Matrix IntroductionThe “Red/Black Matrix” is a powerful tool for understanding the practical applications of investing for cycles of crisis and the containment of crisis. It is based upon a substantial body of work, and the analysis linked below has more information than what is contained in this introduction:
http://danielamerman.com/va/RedBlackMatrix.html
Understanding The Columns
The core of the matrix (on the next page) is the four columns, which use both letters and color codes to facilitate understanding .
What the “Red” & “Black” represent are a combination of economic and financial factors that can determine investment performance at different stages of cycles of crisis and the containment of crisis. Describing each stage in detail takes some time and requires the use of some technical financial and economy vocabulary. The repeated lengthy use of the descriptions and vocabulary create unnecessary complexity and a barrier to understanding, particularly for someone whose profession is not finance or economics.
A simplifying teaching method that greatly increases understanding is to initially describe the stages in a way that is clear, and to then go back to the underlying details when necessary - but to for the most part, simply replace the lengthy descriptions of the two key components of the cycle with the terms “Red” and “Black.”
When tested in a workshop/classroom environment, this teaching simplification has proved quite successful in practice. What initially seemed complicated became clear after exploring the first matrix cells. It then became intuitive, and participants were able to quickly move from cell to cell of the matrix, gaining new understandings and perspectives.
All the cells in the “A” column begin with the letter “A”, are colored red, and their contents included asset category and investment strategy performance in a Red Zone crisis.

Page 18

Workshop Brochure Page 19
www.DanielAmerman.com
All the cells in the “B” column begin with the letter “B”, are colored black, and their contents includes asset category and investment strategy performance in a Black Zone containment of crisis.
All the cells in the “C” column begin with the letter “C”, they change color from red to black, and their contents included asset category and investment strategy performance in a Red Zone to Black Zone cycle.
All the cells in the “D” column begin with the letter “D”, they change color from black to red, and their contents included asset category and investment strategy performance in a Black Zone to Red Zone cycle.
Understanding The Rows
The top six numbered rows are the asset categories of 1) Cash & Equivalents; 2) Stocks; 3) Bonds; 4) REITs & Real Estate; 5) Precious Metals; and 6) Cryptocurrencies.
The bottom two numbered rows are the investment strategies of 7) Aggressive Wealth Creation Strategies; and 8) Retirement Account Preservation Strategies.
Understanding The Matrix Cell Labels
Each matrix cell is the color coded and labeled intersection of a lettered scenario column, and a numbered asset category or investment strategy row.
So “A1” is colored red, and examines risks and returns for the 1st row of Cash & Equivalents, in the A column of Red Zone crisis.
“B3” is colored black, and examines risks and returns for the 3rd row of Bonds, in the B column of Black Zone Containment of crisis.
The “C4” cell changes colors from red to black, and is in the C column of the Red to Black cycle. It examines two quite different places - risks and returns
Workshop Brochure Page 20
www.DanielAmerman.com
for the 4th row of REITs and Real Estate in the Red Zone, risks and returns for REITs and Real Estate in the Black Zone, and then most importantly, the very sharp changes in investment prices and returns that can occur in the transition between the two stages of the cycle.
The First Twelve Cells: Red & Black For All Asset Categories
A number of factors can go into the determining the contents of each of the twelve core matrix cells, which are A1-A6, and B1-B6. These are the six investment categories, and expected performance under the alternative states of Red Zone crisis or Black Zone containment of crisis.
The specifics vary by the cell, but factors can include:
1) Fundamental investment characteristics and whether the asset has a history of being cyclical or contra-cyclical.2) The Federal Reserve “playbook” for that stage in the cycle, what its mandates and policies call for, how those are likely to impact performance for that investment category, and when in the cycle that is likely to happen.3) What we’ve seen in previous iterations of the cycle, when it comes to the intersection of historical investment performance and how that has been changed by increasingly aggressive and unprecedented Federal Reserve interventions.4) What we may see with a further amplification of the cycle in terms of crisis or new and more powerful containment of crisis, and how that could change future performance.5) The above are combined to provide an understanding of whether to expect asset inflation or asset deflation for the investment category with that scenario.
The Second Twelve Cells: The Cycles For All Categories
The premise of the matrix is that we have been in a cycle between the Red and Black zones, and while there are no guarantees, there is a good chance that we will see further cyclical changes.
Workshop Brochure Page 21
www.DanielAmerman.com
The problem with both the mainstream and doom & gloom schools of thought is that they are blind to the cycles.
The Modern Portfolio Theory-based mainstream where prices are determined solely by rational investors whose behavior is governed by the assumptions of the Efficient Market Hypothesis (upon which much of conventional financial planning is based), precludes the possibilities of regular asset bubbles creating a potential string of devastating market downturns, or how the response of aggressive central banking interventions can change prices and yields across all of the investment categories.
Despite the aftermath of the Financial Crisis of 2008 creating record or near record prices for stocks, bonds and real estate, the traditional doom & gloom perspective is effectively meltdown based, and does not allow for “successful” aggressive central banking interventions, or new record profits, or a stronger dollar in the aftermath of crisis.
What we have experienced in practice over the last almost 20 years is a series of changes in cycles that have produced some of the greatest price swings of our lifetimes. We have seen some of the greatest losses, we have seen some of the largest gains, and in some cases - they have been quite close to each other in time.
If there are further iterations of the cycle, particularly with amplification, then some people are likely to be completely blindsided with devastating losses - with results that could change the rest of their lives. Conversely, those who see the low to high price cycles in advance and positions themselves accordingly, could experience the opposite results, with the opposite impact on their future standard of living.
Using all of the information value in the Red/Black matrix and as part of a very logical and analytical process, the cycle cells of C1 to C6 and D1 to D6 are focused on finding the asset categories that may experience the greatest price swings in a Red to Black cycle - or in a Black to Red cycle. The price swing could be high to low, or it could be low to high, and of course the price swings change with the asset category and the cycle.
Workshop Brochure Page 22
www.DanielAmerman.com
The Last Eight Cells: The Investment Strategies
The eight investment strategy cells of A7 to D7, and A8 to D8, examine strategies for avoiding losses and increasing returns under each of the four scenarios.
The A7 investment strategy cell combines the results of cells A1 to A6, all the investment categories in the Red Zone “A” column, and looks at which asset categories to avoid, and what to focus on, for someone who does not mind taking risk in order to try to maximize investment returns in a future Red Zone crisis.
The A8 investment strategy cell also utilizes the information that was developed step by step in the A1 to A6 red column cells, but instead takes the perspective of a retirement account investor who would like to pick up some gains, but who is primarily focused on account preservation and avoiding losses during a potential Red Zone crisis.
The B7 investment strategy cell uses the information assembled in the B1 to B6 cells of the Black Zone containment of crisis column, and looks at what categories to avoid, as well as identifying where the maximum sources of return could be. The B8 investment strategy cell is based on the same information, but is more focused on someone who has a limited appetite for how much risk they are willing to take in the pursuit of gains.
The C7 investment strategy cell looks at all the “C” column Red to Black cycle information developed step by step in the C1 to C6 cells, and explores the maximum negative price swings to be avoided, as well as the potentially most lucrative price swings for profit maximization. Again, the C8 investment strategy cell looks at the same information from the perspective of dialing back the risk.
The D7 investment strategy cell explores the “D” column Black to Red cycle information from cells D1 to D6, and identifies the maximum negative price swings to be avoided, as well as the sources of potential maximum wealth creation in a Black to Red cycle. The D8 investment strategy cell then uses the same D1 to D6 cycle information but with more of a focus on reduced risk inside of a retirement account.

Workshop Brochure Page 23
www.DanielAmerman.com
How The Model Performed: Seven 2019 Scenario ResultsThe seven major investment market and economic changes listed below, including new highs for stocks, bonds and home prices, all occurred in 2019 - and all were discussed in advance in the DVD set “2019 Overview: Cycles Of Crisis & The Containment Of Crisis”, which was released in December of 2018.
The methodology used to discuss in advance what would be some of the largest determinants of investor results in 2019 was not random, but rather all seven developments were the internally consistent results of the application of the “Red/Black Matrix”, a framework and system for understanding how the heavy-handed interventions of a trapped Federal Reserve are changing stock, bond and housing prices and returns in ways that are very different from the historical patterns that most investors rely upon.
Information about a free book which explains the matrix and the methodology which were used is linked below.
http://danielamerman.com/atwo.htm
As reviewed in more detail in the “Red/Black Matrix Framework” section that follows, these were not firm forecasts per se, and there was no “crystal ball”. Instead the premise of the framework (and the 2019 Overview) was that if one starts by understanding the constraints faced by the Fed, and its plans for dealing with economic problems within those constraints, then a set of scenarios can be identified, which could lead to potentially unprecedented results in multiple investment categories in ways that may make little sense from a conventional investment perspective - but that are logical, self-consistent and can even be discussed in advance within the perspective of the framework. As explored below, this discussion within the framework did indeed include - as one of two of the major scenarios - the new highs in stock prices, bond prices and housing prices that did later occur in 2019.
Workshop Brochure Page 24
www.DanielAmerman.com
Seven Major Developments In 2019
1) One key component of last year’s “2019 Overview: Cycles Of Crisis & the Containment of Crisis” DVD set (released at the end of 2018) was a detailed exploration of the multiple and converging reasons why the Federal Reserve would likely need to abruptly cease its plans for 3 interest rate increases in 2019. (DVD #1: Chapter 1, Chapter 2, Chapter 4; DVD #2: Chapter 6.)
That is what indeed happened in 2019 - the Fed did have to stop raising rates, in a dramatic reversal of its plans and expectations.
2) There was discussion of the strong possibility that in the attempt to avert the increasing chances of a recession, the Federal Reserve would not just stop the cycle of increasing rates, but would reverse course, and enter into a preemptive lowering of interest rates. (DVD #1: Chapter 1: DVD #2: Chapter 6.)
That is also what happened in 2019, the Fed decreased rates three times instead of the planned three increases, these were the first rate decreases since 2008.
3) How rapidly rising government deficits could pressure interest rates, and how the growth in the national debt could begin to change Federal Reserve actions was discussed as well. (DVD #1: Chapters 2 & 3.)
That is what happened, nine months later, beginning in September of 2019, when the need to fund new deficit spending and tax collections in the same month created a liquidity crisis and spiking overnight repo rates.
4) How the preemptive containment of a developing crisis could cause the Fed to reverse direction, cease shrinking its balance sheet, and to create the money for an early and aggressive expansion of its balance sheet, including unprecedented funding of the U.S. government debt was discussed. (DVD #1: Chapter 3; DVD #2 Chapters 6 ,7 & 9)
Workshop Brochure Page 25
www.DanielAmerman.com
That is what happened, seven months later in July when the Fed ceased shrinking its balance sheet, and then two months later after that, beginning in September of 2019, when the Fed began rapidly growing its balance sheet again and resumed its major monthly purchases of U.S. Treasury obligations using newly created money.
5) How in the face of developing economic issues, the Fed could be forced to reverse course and how this could in turn lead to the highest stock prices in history, was quite explicitly discussed in detail. (DVD #2: Chapters 6, 7 & 9.)
At the time the “2019 Overview” DVDs were prepared the stock markets were reeling, with punishing declines in all of the major indexes in October, and with the Dow losing 1,500 points in two trading days in early December of 2018. Yet, ten months later, after a double reversal and the resumption of both lowering interest rates and the expansion of the Fed balance sheet - the Dow, S&P 500 and NASDAQ were all simultaneously setting record highs. (And as further discussed in the DVDs, there is a scenario with strong historical precedent that shows the possibility that the rally could still just be getting started.)
6) Housing prices were sputtering with fast rising mortgage rates reaching a seven year high of almost 5% in late 2018, and home prices were in danger of reversing course and falling, much like they did in 2007. Why the Fed might reverse directions on interest rates and quantitative easing, and how this could lead to plunging mortgage rates that would allow housing prices to climb, even as stock prices climbed were all discussed. (DVD #1: Chapter 3; DVD #2: Chapters 6 & 8.)
The Fed did reverse direction, mortgage rates did plunge to extraordinary lows in 2019, the housing market was supported, and home prices did rise over the course of 2019 to record levels on a national basis.
7) How sophisticated institutional investors anticipating the possibility of a recession, and then anticipating the Fed’s response, could change the yield curve and create a potential “major arbitrage opportunity” in long bonds was
Workshop Brochure Page 26
www.DanielAmerman.com
discussed, as was how we could see “larger bond profits than what we have seen in the past”. (DVD #1, Chapters 3 & 4; DVD #2: Chapters 6 & 7.)
In practice, there was a huge bull market in long bonds in 2019, with returns of 25%+ over the first eight months of the year, in what would become one of the most popular investment strategies of the year for sophisticated institutional investors.
The Red/Black Matrix Framework
As it turns out, a series of really bad things happened in 2019. The U.S. nearly went into recession. Things were so bad that the Federal Reserve had to abruptly reverse direction, and reduce interest rates three times in the effort to rescue the economy and the markets.
Things were so bad, that the Fed had to reverse course, and stop reducing its balance sheet. Things were so bad that the repo market nearly blew up, and the Federal Reserve is committed to spending $60 billion per month to buy U.S. Treasury obligations, using monetary creation as the source of the funds to do so, in order to keep interest rates from exploding upwards .
But for most investors - the idea that 2019 was a bad year (now that it has mostly happened) would be ludicrous. The stock markets set a series of new highs - and housing market also set new highs. Bond prices soared, creating extraordinary profits for investors along the way. If that is a bad year - there are probably quite a few investors and homeowners who would like to see a lot more bad years just like it!
From the usual financial perspective - none of this should have happened. With the extraordinary trade tensions with China slowing down the global economy and the widely recognized and discussed imminent danger of a recession - the stock market should have been in deep trouble, and in worse shape than it had been in December of 2018. The markets should not have been so completely dominated by the extraordinary market interventions of the Federal Reserve, for such interventions are completely outside of the usual investment theory that conventional financial planning is based upon.
Workshop Brochure Page 27
www.DanielAmerman.com
But - that is what happened, and the results were record stock highs, that did not come from the usual sources.
From the usual “doom and gloom” perspective - none of this should have happened either. With these extraordinary problems in multiple areas, with the elevated asset markets, with the huge and growing personal, corporate and government debt levels - there should have been a financial Armageddon event. There should have been (from that perspective) a simultaneous collapse of the stock and real estate bubbles, a collapse in the value of the U.S. dollar, and a new great depression. But yet, none of those happened, just as they did not happen in previous years in spite of those many very real and genuine underlying issues, and we instead saw yet another round of record highs.
However, when we apply the framework below, then not only did 2019 make perfect sense when looking backwards, but many of the critical elements and the relationships between them could even be anticipated and discussed in detail when looking forward from December of 2018, before any of it actually happened - as they were, as one of the two main scenarios (more below).

Workshop Brochure Page 28
www.DanielAmerman.com
The Red/Black Matrix is the product of many years of development and there have been quite a few successful anticipations along the way. However it was not introduced as a complete framework until a workshop in April of 2018, which was followed by the release of the “Investment Strategies For Crisis & The Containment Of Crisis” DVDs in June of 2018.
Since 2001, we have seen the collapse of two asset bubbles, with results that include the Financial Crisis of 2008, and the most severe recession since the Great Depression of the 1930s. We have also had unprecedented Federal Reserve interventions to contain those crises, including creating trillions of dollars out of the nothingness, and forcing the lowest interest rates in history.
Workshop Brochure Page 29
www.DanielAmerman.com
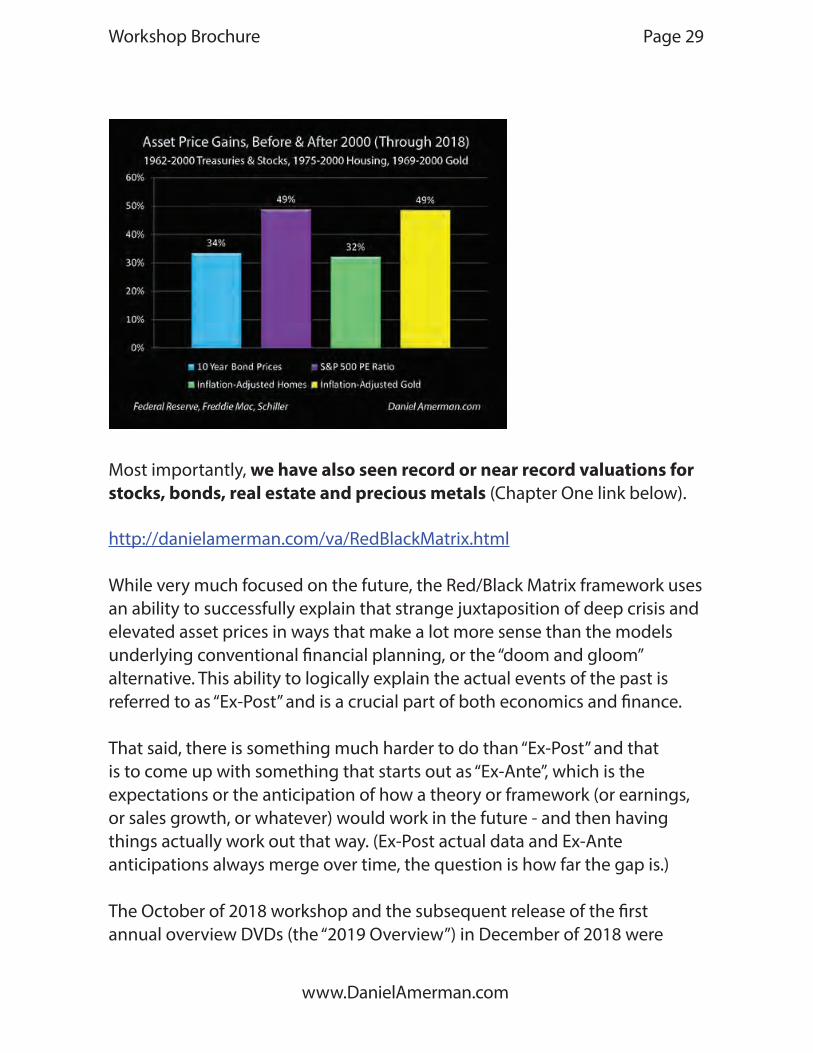
Most importantly, we have also seen record or near record valuations for stocks, bonds, real estate and precious metals (Chapter One link below).
http://danielamerman.com/va/RedBlackMatrix.html
While very much focused on the future, the Red/Black Matrix framework uses an ability to successfully explain that strange juxtaposition of deep crisis and elevated asset prices in ways that make a lot more sense than the models underlying conventional financial planning, or the “doom and gloom” alternative. This ability to logically explain the actual events of the past is referred to as “Ex-Post” and is a crucial part of both economics and finance.
That said, there is something much harder to do than “Ex-Post” and that is to come up with something that starts out as “Ex-Ante”, which is the expectations or the anticipation of how a theory or framework (or earnings, or sales growth, or whatever) would work in the future - and then having things actually work out that way. (Ex-Post actual data and Ex-Ante anticipations always merge over time, the question is how far the gap is.)
The October of 2018 workshop and the subsequent release of the first annual overview DVDs (the “2019 Overview”) in December of 2018 were
Workshop Brochure Page 30
www.DanielAmerman.com
each “Ex-Ante” - focused on “wargaming” a few major scenarios for 2019 using the following framework and methodology (which is explored in more detail in the free book and in the foundational “Investment Strategies For Cycles Of Crisis & The Containment Of Crisis” DVD set):
a) start with potential changes in the cycles and the reasons for them (matrix columns);
b) incorporate the motivations of the Fed and its constraints (matrix columns);
c) identify the major interventions or changes in direction and policies that would likely occur in response to the cyclical changes (or in anticipation of the cyclical changes), given the Fed’s motivations, available tools, constraints and publicly stated intentions (matrix columns);
d) feed the combined impact of the outside Fed interventions through the economic changes, the market psychology changes and the underlying financial mathematics of the Red/Black Matrix (the rows, given the columns);
e) explore the potential financial impact on stocks (matrix row);
f ) explore the potential financial impact on bonds (matrix row); and
g) explore the potential financial impact on housing (matrix row).
This framework worked in practice for 2019, and in advance. It was this application of this methodology which produced the seven interrelated major changes that are listed above, and which would end up dominating stock, bond and housing prices during the year that followed.
Now, this is a very separate thing from some purported ability to precisely predict a single path for what will definitively happen in the future. In this highly complex world that is traveling a path that we have never seen before, with a great deal of randomness and uncertainties - to make or believe such a claim of infallibility would seem to strain the limits of believability.

Workshop Brochure Page 31
www.DanielAmerman.com
However, if we are to have a model, or a belief system, or a framework that we use today to make decisions for the state of uncertainty that is the future - then it should not only be able to explain the past, but if we go a year forward in the future - we shouldn’t have to violate the framework, or make major changes in order to explain what actually turned out to have happened. It should continue to make sense in a rational and self-consistent manner at the end of the year, just as it did at the beginning of the year.
To be very clear - the seven discussions listed above were not the entirety of the “2019 Overview” DVDs. There were some fundamental uncertainties as of the end of 2018, and the biggest was whether the United States would indeed enter into a recession in 2019. If that had happened, or if the Fed had chosen not to reverse course - then we would have likely seen entirely different results for stocks, bonds and home prices in 2019.
Instead of taking a stand one way or another on a recession - which was realistically unknowable at the time - both possibilities were explored in depth. There was quite a bit of exploration within the DVD chapters of the possibility of what would happen if there were an actual recession, how the Fed would likely attempt to deal with it, the tools that would likely be used, and the radically different investment implications across multiple categories. (And if we do get a recession at the end of 2019 or in 2020 - those discussions could yet be the most valuable content within the 2019 Overview DVDs, particularly DVD #1: Chapter 3.)
The other most discussed possibility (including parts or most of 8 out of the 10 DVD chapters) was that of the Fed reversing direction, going “Black to Black” and attempting to prevent recession with preemptive deployment of crisis containment tools - which, Ex-Post, is what actually happened in 2019. All seven of the economic and market changes reviewed herein were interrelated parts of that possibility as discussed in the 2019 Overview, including the major reversals of direction, the tools used, the resulting increases in stock and home prices, and the creation of a major opportunity in long bonds. The framework for anticipating what could happen in all three
Workshop Brochure Page 32
www.DanielAmerman.com
major investment markets if a cornered Fed took aggressive actions to try to prevent a recession - stood the test.
Ex-Post, it is very easy to look back at the seven different major changes or developments that actually occurred in 2019, and say, well of course they did. However, if we go back to October and December of 2018, during a time when the Federal Reserve was still publicly quite committed to further increases in interest rates, while being committed to further reducing its balance sheet, and we look at the 1,500 point loss in the Dow in two trading days in early December, with 10 year Treasury yields above 3% in November, and the fears of 5%+ mortgage rates were sending shivers through the housing market - exploring Ex-Ante the potential seven interlinked components of the radically different path that would be traveled in 2019 would have seemed quite unlikely indeed for many people.
Simply put, if the framework we are relying upon to make financial decisions does not work Ex-Post, if it cannot explain the past - then it is also unlikely to deliver the future results that are desired. In my opinion, any investment model at the end of 2018, whether mainstream or contrarian, that did not take into account the compelling reasons why the Fed might reverse direction in 2019, and how such a reversal could create extraordinarily powerful ripple effects that would then dominate the stock, bond and housing markets in 2019 - would have failed, Ex-Post.
Having a framework that could set out the logical reasons for an unprecedented multi-part and interrelated set of economic and investment market changes in advance, and to have those hold up close to a year later, Ex-Post, with the anticipated end results in all three of the major investment categories - is not the same thing as being able to do the undoable, which is to predict the future with certainty. With that said and understood, there is nonetheless immense value for those seeking to achieve and maintain financial security, in having a comprehensive framework that can actually work in putting the pieces together and identifying in advance what is reasonable to happen - as one of a broader set of possibilities - and to then have that confirmed seven times over by what actually happened later, in this highly complex and fast-changing world of ours.

Workshop Brochure Page 33
www.DanielAmerman.com
Supporting Analysis LinksThe content of the workshop is based upon many years of analytical work.
A series of supporting analyses can be found in a free book. An overview of some of the key analyses in the book can be found at the link below:
http://danielamerman.com/va/ccc/RedBlackSeries.html
The sign up link for the free book is below:
http://danielamerman.com/atwo.htm
Workshop Brochure Page 34
www.DanielAmerman.com
Testimonials From Prior Participants
Because the workshop is new, none of the participant testimonials below are about that particular workshop. The new workshop is the culmination of more than ten years of delivering live workshops while refining the strategies and analyses as well as how to teach the materials - and the testimonials are for earlier versions of the workshop that were part of the development process.
“Finding Daniel Amerman was one of the best things to happen to me. I have been concerned for years about preserving the purchasing power of my retirement savings, which is a challenge unto itself. When you add the additional burden of paying taxes on top of any gains, the task seems impossible to overcome. Daniel is the first person I have found that provides an answer to this challenge. He is truly a creative thinker, playing the chess game 5 moves ahead of most people. After reading his Turning Inflation Into Wealth emails, I decided to buy his course. It is one of the best things I have ever done to help me clarify what is going on and have a plan for the future that gives me confidence. It was an easy decision to attend his second course, which is an update of what has happened in the past two years. I found this seminar to equal his first course in terms of original thought and actionable content. Keep ‘em coming Dan.”
Bill C.
“Although I am a financial markets addict, my husband is not and he somewhat reluctantly agreed to attend the workshop with me. Halfway through the first morning, however, his attitude completely changed! Dan’s presentation captivated him. Dan’s precise analysis of current market trends are brought into sharp focus with very practical examples. The unprecedented world of
Workshop Brochure Page 35
www.DanielAmerman.com
negative interest rates is bewildering to say the least. Not only does Dan help make sense of it all, he provides the tools you need to survive and thrive! Far from being dry or boring, Dan presents and analyzes the current trends and provides very practical applications. The workshop was packed with useful information. Dan encourages engagement during the sessions. Your questions and comments are welcomed and he incorporates them into his presentation with the skill of a seasoned expert in the field. If you want analysis of the current trends and practical, useful advice on how to navigate them, Dan is your man!” Sue and Mike B., Ohio
“Following the 2008 financial debacle, I began frantically searching for reliable sources to understand and prepare for what appeared to be instability in the U.S. and world economies. Amazingly Dan Amerman, I discovered, had already been writing about such possible market risks. Dan’s gift to take the complex and simplify into meaningful, practical terms provided me an understanding of the various dynamics at the core of the volatility. More importantly, Dan’s publications (DVD’s, books, and seminars) provided me with actionable insights and strategies to incorporate in my investment and retirement plans. Today I continue to benefit from Dan Amerman’s educational tools and insight and highly recommend them to anyone interested in building financial wealth.”
Ron K, KY
“My husband and I are both pleased to recommend Daniel Amerman as a singular and top rate financial educator. We are impressed by his ability, as well as his willingness, to provide his students with guided tours into the murky waters of economic theory in a way that is practical, factual, data-
Workshop Brochure Page 36
www.DanielAmerman.com
driven, and ideology-free. One comes away from each of his trainings and workshops with a little more insight into how both the American and the global economies actually work, and with a little bit of the wool of politics and “common knowledge” removed from one’s eyes.
One of the most helpful things Mr. Amerman does is expose how the players at various levels in the financial industry think and act. It is incredibly useful simply to understand the mindsets of those who are in control of the game. He also integrates quantitative with qualitative data to generate insights and perspectives that other economists either miss or dismiss, to the average investor’s detriment. The asset/liability management matrix he created to help students “run the numbers” and understand the financial consequences of various investing strategies under different scenarios is, in particular, of great help. That sort of practical education is difficult to come by for those not already in the financial industry.
We will continue to study and find ways to apply Mr. Amerman’s work as we chart our financial future in today’s very confusing and uncertain waters. We also look very forward to attending future workshops to keep up with changes in economic policy and its consequences. I am happy to say that Mr. Amerman has earned our trust, which is not an easy thing to give to anyone in an industry that is dominated and controlled principally by predators, fraudsters, clueless academics and salespeople posing as “advisors”. Thank you, Mr. Amerman, for showing us that all is not lost in your industry, and for giving the rest of us a fighting chance to survive and even thrive in what is becoming an increasingly bizarre and uncertain financial world.”
Jennifer CM

Workshop Brochure Page 37
www.DanielAmerman.com
“As a successful businessman for 35 years, I found myself ready to retire and confident that I had gotten myself out of debt and accumulated a decent retirement nest egg. As one of the baby boomers, I was feeling pretty comfortable until I viewed Dan’s DVD material and realized my traditional retirement strategy was going to result in a significant reduction in what I would really have for retirement because of what was coming. Attending Dan’s workshop helped me to understand the core issues we face and change my paradigm and use a strategy that aligns with that understanding so that not only will my retirement assets be protected but they can significantly increase as I move into my retirement future. My (and my family’s) future looks much brighter and secure thanks to Dan’s insights.”
John B
“I found the workshop to be extraordinary. It was extremely thought-provoking, and it helped me to focus my investment decisions very sharply. I do not think that it is an exaggeration to say that there is not a single other researcher or investment professional who provides this depth of analysis and focus on the real implications of where the U.S. economy -- and its political institutions -- are, and what it means for our future. I have no reservation at all in recommending these workshops to others.”
David F
“Attending Dan Amerman’s seminars, reading his publications and viewing his DVD’s is a financial perspective changer. Dan’s professional training and “boots in the trenches” real life involvement with how our nation finances various segments of the economy provide unique and useful insights which he clearly articulates with both written and graphic materials. By word and by illustration he clearly shows the role inflation plays in our personal finances

Workshop Brochure Page 38
www.DanielAmerman.com
and the real but sometimes “hidden” outcomes that affect each and every one of us.”
KenWashington State
“Dan Amerman is a ‘banker’s banker’ in the world of high finance. Be one of the few to see how the real game is played, especially relevant since the 2008 chaos. Study his materials. Attend his seminar to relearn how to apply these unique strategies to your personal portfolio. The seminar attendees are sophisticated and add considerable insights!”
Ron CWisconsin
“I’ve been investing in cash flow real estate for nearly twenty years, and in one weekend my entire perspective has changed. I will never make another deal without using the tools I learned from Dan.
We live in a time in history when it’s really hard for small investors to see a real return on their investments after taxes and inflation take a big bite. Dan Amerman has given me the skills to help me come out ahead, and for that I’ll always thank him.
Dan has a gift for understanding the big picture, as well as the number crunching skills of a Wall Street quant. Yet he has dedicated himself to educating regular people about how to get a decent return and preserve their
Workshop Brochure Page 39
www.DanielAmerman.com
personal wealth in a tough financial environment. To me that makes him a real hero, a champion of the little guy.”
Eddie T
“It was an absolute pleasure meeting you this past weekend. I want to thank you again for all your time and effort in providing such a wonderful learning experience. Your insights and analysis were well thought out and logically presented. They brought clarity to an economic picture that, for most, has been extremely fuzzy. I left the weekend with a much clearer focus on what tactics need to be employed as we move down this uncertain economic road.”
Bob R
“I enjoyed the workshop and learned a great deal. It was worthattending to come up to date on how your analysis has evolved, to reviewthe core issues that have not changed since 2008, and to incorporate therelevant new issues. The questions and comments of the otherparticipants provided a great deal more than I had expected. The otherattendees were well informed and brought another level of analysis astheir questions helped us explore the topics presented in the workshop.I left impressed with the sophistication and diverse background of theaudience.
Your approach of looking beyond just the basic economic forcesby examining the political, social, and demographic dimensions allowedfor a more objective and balanced assessment of what significantparadigm shifts we might expect. By avoiding the current dominantdebate between inflationists and deflationists, we were able to see thatsimply subscribing to either of these two sides brings significant risk.
Workshop Brochure Page 40
www.DanielAmerman.com
Those unwilling to reconsider the validity and merit of this currentdebate may find themselves unprepared for the structural changes aheadand therefore ill-equipped to adapt. This brought to mind investmentmanagers who performed well in 2008 only to experience subsequentfinancial trauma as they found their experience inadequate preparationfor the new landscape which requires a much longer historicalperspective than most have accumulated in their careers.
Did we all hear the next hot tip? No. But we did hear what theimportant issues are and how we need to look to different tools to solvethe investment problems of tomorrow. Plus, there’s an old saying:anything that can be put in a nutshell belongs there. I look forward tofollowing your analysis and wish you, your family, and the rest of theworkshop participants the best.”
Eric D
“Mr. Amerman’s workshop changed my life. He brought my understanding of the global economy’s impact on my personal financial life to a new level. Due to his workshop, I have made giant changes in the way I save and the structure of my financial plans for the future. I feel much more secure and look forward to a future of prosperity! I can wholeheartedly endorse the time and money spent attending his workshop - it will be returned to you many times over.”
Lee Anne S

Workshop Brochure Page 41
www.DanielAmerman.com
The testimonials were solicited in follow-up e-mails sent after previous workshops. No compensation was offered in exchange. They are each the full testimonial as received, and have not been edited for content. Not all workshop participants provided testimonials. From those who did provide testimonials, the most positive testimonials were those selected for inclusion in this brochure. Because those with particularly positive experiences are the most likely to provide highly positive testimonials, they are not a random sampling, and nor should they be considered as representative of the experiences of all prior workshop participants.
Workshop Brochure Page 42
www.DanielAmerman.com
About Daniel Amerman
Daniel R. Amerman is a Chartered Financial Analyst and the author of a number of books on finance and economics.
Articles by Mr. Amerman or referencing his work have appeared in numerous publications and websites, including Reuters, MarketWatch, U.S. News & World Report, MSN Money, Seeking Alpha, Business Insider, ValueWatch, Nasdaq.com, Morningstar.com, TalkMarkets and Financial Sense. Two of his books on
securities analysis were published by McGraw-Hill (and subsidiary): Mortgage Securities, and Collateralized Mortgage Obligations: Unlock The Secrets Of Mortgage Derivatives.
Mr. Amerman is a finance MBA with over 30 years of professional financial experience. As an investment banker he did groundbreaking work in the such areas as CMO/REMIC originations as part of portfolio restructurings for financial institutions, and the creation of synthetic securities for institutional clients. As an independent quantitative analyst, he has provided structural, analytical and mathematical verification services for investment banks, trust departments, and rating agencies.
In his 1993 Mortgage Securities book, Mr. Amerman characterized the then dominant financial planning projection that stocks would reliably average 8-10% total returns over the long term as being “patently absurd” for the reason that this belief was based on a projection of the compounding of high historical dividend levels that no longer existed.

Workshop Brochure Page 43
www.DanielAmerman.com
That initial radical disagreement with the mainstream would then itself become the mainstream view over the following years, for the simple reason that financial mathematics do eventually win out over group consensus, no matter how apparently overwhelming the consensus is at the time. This same approach of questioning the mainstream financial consensus when it conflicted with the underlying financial mathematics would become the core of Mr. Amerman’s work over the next 25 years.
By the mid 2000s, Mr. Amerman had become an outspoken critic of conventional retirement planning, arguing that the accepted paradigm had multiple deep flaws that could potentially lead to profound long-term underperformance, resulting in millions of retirement investors finding themselves with neither the retirement portfolios nor the retirement lifestyles that the traditional financial education system had led them to believe would almost assuredly be theirs.
This was also well outside the mainstream at the time, but a little more than 10 years later, reviewing “Daniel Amerman’s Six Fatal Financial Planning Flaws” (link below) was part of one of the curriculum options for CPAs earning continuing education credits in most U.S. states in 2017.
http://danielamerman.com/aFive.htm
As a mortgage derivatives expert, Mr. Amerman was among the few warning investors in 2007 and 2008 of the specifics of the dangers in the mortgage derivatives markets, and how interlocked derivatives counterparty risks could bring down Wall Street in a flash. However, Mr. Amerman suggested that readers “invest for the bailout and not the crisis”, and discussed in workshops that a derivatives crisis could potentially lead to both a federal government

Workshop Brochure Page 44
www.DanielAmerman.com
bailout and the Federal Reserve using its powers to create new money as needed to contain the crisis.
What is sometimes forgotten about 2008 is that the financial crisis did not go out of control, but was instead contained via a massive federal government bailout (TARP), and by the Federal Reserve creating extraordinary sums of new money in the first round of quantitative easing.
When it was indeed the containment of crisis that dominated financial markets in the following years rather than crisis itself, Mr. Amerman spent years analyzing the tools of crisis containment, and communicating the investment implications to readers. Some of the key topics were quantitative easing, financial repression, very low and negative real interest rates, the alignment of investor interests with governmental motivations, bail-ins, the formation of rational bubbles as a result of containment efforts to exit secular stagnation, and how each could impact investment outcomes.
Conventional financial planning is based upon projecting “normal” future investment returns for stocks and bonds - but are we really in “normal” times or have we been so in the last 20 or so years? A series of analyses linked below considers an alternative perspective, which is that we have been in a continuous cycle of crisis and the containment of crisis since the collapse of the tech stock bubble, which has major implications when it comes to investment choices and financial planning.
http://danielamerman.com/va/ccc/RedBlackSeries.html
Workshop Brochure Page 45
www.DanielAmerman.com
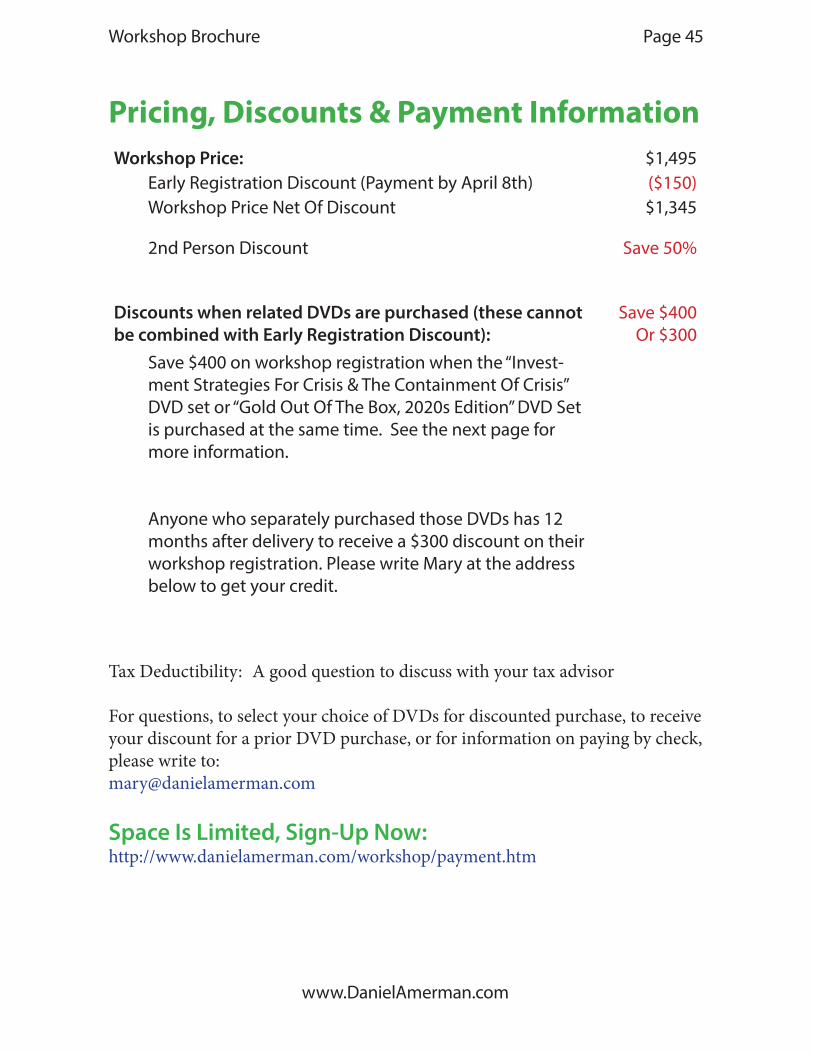
Pricing, Discounts & Payment InformationWorkshop Price: $1,495
Early Registration Discount (Payment by April 8th) ($150)Workshop Price Net Of Discount $1,345
2nd Person Discount Save 50%
Discounts when related DVDs are purchased (these cannot be combined with Early Registration Discount):
Save $400Or $300
Save $400 on workshop registration when the “Invest-ment Strategies For Crisis & The Containment Of Crisis” DVD set or “Gold Out Of The Box, 2020s Edition” DVD Set is purchased at the same time. See the next page for more information.
Anyone who separately purchased those DVDs has 12 months after delivery to receive a $300 discount on their workshop registration. Please write Mary at the address below to get your credit.
Tax Deductibility: A good question to discuss with your tax advisor
For questions, to select your choice of DVDs for discounted purchase, to receive your discount for a prior DVD purchase, or for information on paying by check, please write to: [email protected]
Space Is Limited, Sign-Up Now:http://www.danielamerman.com/workshop/payment.htm
Workshop Brochure Page 46
www.DanielAmerman.com
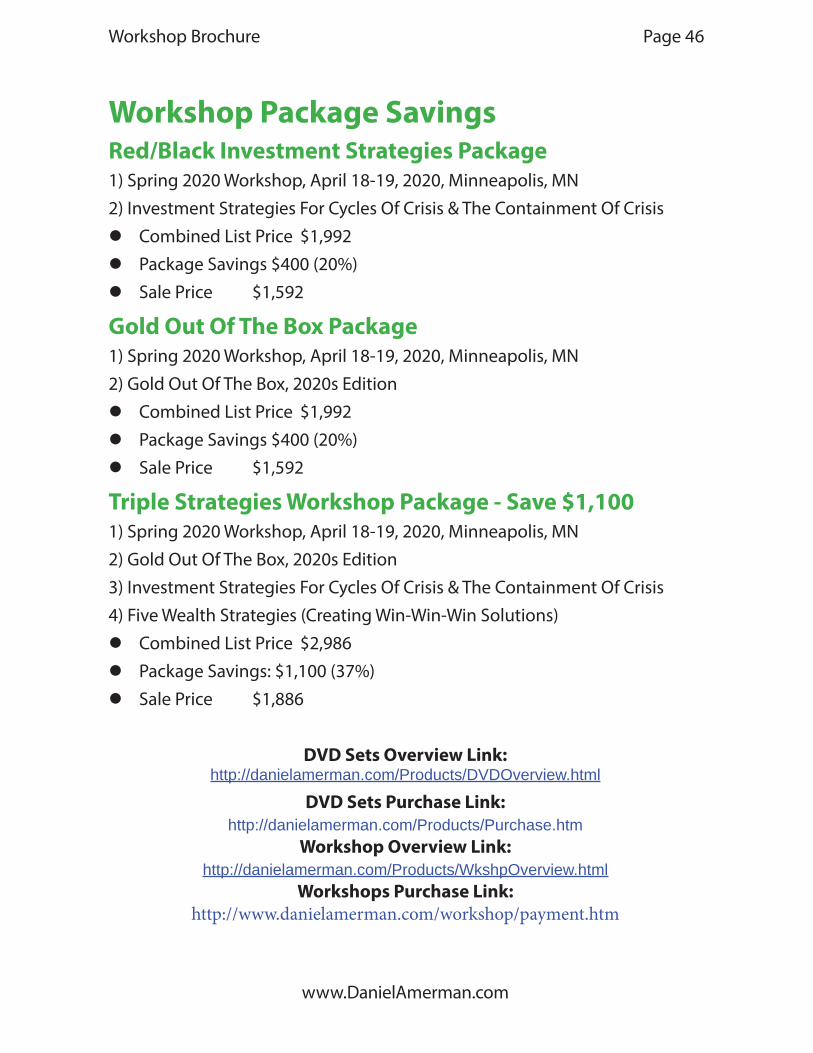
Workshop Package SavingsRed/Black Investment Strategies Package1) Spring 2020 Workshop, April 18-19, 2020, Minneapolis, MN2) Investment Strategies For Cycles Of Crisis & The Containment Of Crisis
z Combined List Price $1,992 z Package Savings $400 (20%) z Sale Price $1,592
Gold Out Of The Box Package1) Spring 2020 Workshop, April 18-19, 2020, Minneapolis, MN2) Gold Out Of The Box, 2020s Edition
z Combined List Price $1,992 z Package Savings $400 (20%) z Sale Price $1,592
Triple Strategies Workshop Package - Save $1,1001) Spring 2020 Workshop, April 18-19, 2020, Minneapolis, MN 2) Gold Out Of The Box, 2020s Edition3) Investment Strategies For Cycles Of Crisis & The Containment Of Crisis4) Five Wealth Strategies (Creating Win-Win-Win Solutions)
z Combined List Price $2,986 z Package Savings: $1,100 (37%) z Sale Price $1,886
DVD Sets Overview Link:http://danielamerman.com/Products/DVDOverview.html
DVD Sets Purchase Link:http://danielamerman.com/Products/Purchase.htm
Workshop Overview Link:http://danielamerman.com/Products/WkshpOverview.html
Workshops Purchase Link:http://www.danielamerman.com/workshop/payment.htm

Workshop Brochure Page 47
www.DanielAmerman.com
Meeting Schedule & Hotel Information
Minneapolis Airport Marriott 2020 American Boulevard East, Bloomington, Minnesota 55425 USA1-952-854-7441http://www.marriott.com/hotels/travel/mspmn-minneapolis-airport-marriott/
Saturday & Sunday, April 18-19, 2020
Saturday check-in will start at 8:15 am, with the workshop presentation beginning at 8:30 am, and lasting until 5:00 pm. There is an hour break for lunch each day, and short morning and afternoon breaks as well.
The Sunday session will begin at 8:30 am, and last until 4:00 pm.
The Minneapolis Airport Marriott offers free shuttle service from the airport. There are numerous nearby lodging and dining alternatives, and the hotel is walking distance from the Mall of America (there is also a shuttle). The downtowns of Minneapolis and St. Paul are each about a 15 minute drive away, and can also be accessed via Twin Cities Light Rail stops at the airport or mall.

Workshop Brochure Page 48
www.DanielAmerman.com
DisclaimerPlease note that the seminar / workshop will be of a strictly educational nature, rather than the rendering of professional advice. The future is uncertain, and there are no guarantees or promises of success or particular outcomes. As with any financial decisions, there is a risk that things will not work out as planned, and with hindsight, another decision would have been better. The workshop will not include specific investment, legal or any other form of pro-fessional advice. If specific advice is needed, it should be sought from an appropri-ate professional. Any liability, responsibility or warranty for the specific results of the application of the general educational principles contained in the workshop and the written materials, either directly or indirectly, are expressly disclaimed by the workshop leader.

![[ Workshop ]...[ Workshop ] Conceptualizing the persistence of human-environmental knowledge through time,objects, and landscapes 14:30-14:45 Opening + Overview-Daniel Niles (RIHN)](https://img.pdfslide.us/doc/110x75/5f4750b1e2255408544be8d2/-workshop-workshop-conceptualizing-the-persistence-of-human-environmental.jpg)