Embed Size (px)
Citation preview

INVESTMENT PORTFOLIO«INDUSTRY 4.0»
INVESTMENTS IN FUTURE TECHNOLOGIES

INVESTMENT PORTFOLIO “ INDUSTRY 4.0” 2
a personalized approach to holding securities,use of the most effective fund investment models.
The range of investment portfolios developed by Rietumu Bank’s team of experts, is characterized by the combination of investment portfolio creation principles and the investment fund formation techniques. These portfolios are distinguished by:
“INDUSTRY 4.0”: MORE PROFITABLE THAN A FUND AND MORE ACCESSIBLE THAN A PORTFOLIO
Introducing the key parameters of the “Industry 4.0” portfolio
Investment technologies currently allow for diverse allocation of capital: starting with individual portfolios and up to interest in investment funds. Financial analysts and portfolio managers at Rietumu Bank are focussed on tailoring optimal scenarios that match the preferences of each investor.
Large professional investors that need to find solutions for allocating substantial amounts of capital usually prefer individual portfolios, which means individual selection of instruments and «singularity» in their management.
Purchasing shares in investment funds is an alternative way of investing, designed to find simpler solutions and allocate capital in smaller amounts.

“INDUSTRY 4.0”: INVESTMENTS IN FUTURE TECHNOLOGIES
The investment portfolio “Industry 4.0”, created by the Rietumu Asset Management team, offers the opportunity to invest in future technologies and get a return from common human progress. We offer investments in shares of companies which lead the way in innovative processes, defining the new outline of the modern world and widening economic boundaries.
Historical performance of the model portfolio “Industry 4.0”, 10 years
The Investment Universe of “Industry 4.0” consists of companies from various innovative segments of the global economy:
2005 2006 2007 2008 2009 2010 2011 2012 2013 2014 2015 2016
Portfolio value
+10.6%* per annum
BiotechnologyMedical EquipmentBioinformatics
Artificial Intelligence
Drones, Robotics and Automatization3D printingNanotechnologyCar and Aviation Industry
Information TechnologyCloud TechnologyBig data analysisInternet of Things
CybersecurityE-commerceMobile Payment Systems
TelecommunicationsSocial NetworksDigital Media
Chemical IndustryClean technologies
* Simulation of the historical performance of the model portfolio “Industry 4.0” from 01.01.2005. Past performance does not guarantee future profitability.
3
Industry 4.0 is a term marking the currently ongoing fourth industrial revolution, which integrates cyber technologies into the real sectors of world economy.
INVESTMENT PORTFOLIO “ INDUSTRY 4.0”

Exponential Growth of Technological Development
Potential for Additional
Sources of Income
“INDUSTRY 4.0”: INVESTMENT IDEA
Investment portfolio “Industry 4.0” is the opportunity to make profit from the development of future technologies. The structure of the portfolio is balanced between companies that are well-established and of significance in the global economy and smaller-scale players in promising segments, which are just starting their rapid development.
4
Biotechnology and Medical EquipmentCurrently the majority of medical pharmaceuticals are developed with biotechnologies, and this industry continues to provide solutions for previously unresolved medical problems. Data from the FDA (Food and Drug Administration – Agency for the Ministry of Health and Medical Services of the USA) shows that in the first decade of the 21st century more drugs were approved than during the 1980s and 1990s combined, demonstrating the rapid growth of this industry through decades of research.
Revolution in RoboticsDuring the last few years companies such as Google, Apple, Facebook, and Amazon have initiated rapid development of robotic technologies. The International Federation of Robotics predicts double-digit growth in the robotics market in the near future. Robotization applies to various segments of the economy, including the production sector, and professional and personal services.
Cloud TechnologyMarket Research Media suggests that annual growth of the cloud technology market will hit 30% by 2020. Cloud technologies define new trends in data storage and processing, making these services cheaper and more accessible. Storing data in clouds, still a fantastical idea for many people, is dependent on the availability of components like software, hardware, computers and parts etc.
CybersecurityThis industry is in the stage of rapid development. It has transformed itself from a narrow segment of the market into a vitally important direction for every modern company. Research company Gartner estimated the size of the cybersecurity market in 2015 at 75.4 billion US dollars and predicts its doubling by 2020.
“Clean” TechnologiesAs humanity develops, environmentally clean technologies become more and more important. Technological progress allows many ideas in the industry to become economically viable. The energy industry moves in the direction of renewable
resources while the car industry becomes ever more complex — especially in regards to electric cars.
Social NetworksSocial networks have become an integral part of our lives. Data from the Pew Research Center shows that in 2015 two thirds of the adult population in the US used social networks. The rising popularity of social networks influences the way we work, do politics, communicate, keep ourselves healthy etc. Companies that operate social networks find new ways to monetize their business, which improves the perspectives of investing in this segment.
1400 1450 15501500 1600 1650 1700 1750 1800 1850 1900 1950 2000 2050
printing press telescopesteam engine
telegraphelectric light bulb
phonecars
mission to the Moon
microprocessors
MS-DOS
Apple Macintosh
Windows
WWW
mobile phones
DVD
hybrid cars
eBay / e-commerce
human genomes
Youtube
self-driving cars
3D printing
anti-matter
synthetic organ transplantation
gene therapy
Eco-city Masdar City
iPad
Higher Labour Efficiency
INVESTMENT PORTFOLIO “ INDUSTRY 4.0”

5
“INDUSTRY 4.0”: STRUCTURE (1-2)
INVESTMENT PROCESS
Investment Universe PortfolioFormation
QuantitativeAnalysis
QualitativeAnalysis
The core of the “Industry 4.0” portfolio is formed by the stocks of public companies operating in innovative sectors of the world economy.
The formation of the investment portfolio over time is a dynamic process. Its current structure is defined by its managers, who occasionally re-balance it. As a result, during different time periods, stocks from up to 25 to 35 issuers can be included in the portfolio. The portfolio is composed of the leading companies’ stocks in respective industries, with strong key indicators and relatively low market prices.
The portfolio is created, using effective modern investment models, developed by the experienced financial analysts and portfolio managers of Rietumu Bank.
Type of investment
Asset class
Currency
Minimum investment
Geographical focus
Scope of investments
Recommended period of investments
Expected yield
Brokerage comission
Management comission
Individual portfolio
Stocks
USD
100 000 USD
Global markets
stocks of public companies from innovative sectors of the global economy
over 3 years
over 10% per year
0.35%
1.50% per year
RISK CONTROL AND MONITORING
Including public companies' stocks into «Industry 4.0» portfolio is preceded by a multi-stage, rigourous selection process, executed by Rietumu Asset Management professionals.
Stocks of public
companiesfrom innovative
sectors of the global economy
RAM investment models filter stocks with strong fundamental indicators and low market price.
Analytical data entry is based on available information about the stock issuer and industry.
Portfolio managers tailor the final portfolio based on their expertise.
Industries: Information Technology, biotechnology, car manufacturing, aircraft industry, telecommunications and others.
INVESTMENT PORTFOLIO “ INDUSTRY 4.0”

6
“INDUSTRY 4.0”: STRUCTURE (2-2)
Number of issuersAverage Equity Multiplier Average ROEAverage PE ratioAverage PB ratioAverage Beta Coefficient
2958.06%26.36%
16.573.851.09
Key indicators
CISCO SYSTEMS INCORACLE CORPSYNAPTICS INCKARDEX AGVALEO SAF5 NETWORKS INCGILEAD SCIENCES INCDOLBY LABORATORIES INCTESSERA TECHNOLOGIES INCSYMANTEC CORP
3.52%3.52%3.52%3.51%3.51%3.50%3.50%3.49%3.48%3.48%
Top 10 positionsNorth
America
87%WesternEurope
10%
Asia andOceania
3%
GeographicExposition
87%6%
4%3%
USAFrance
SwitzerlandSouth Korea
0% 20% 40% 60% 100%80%
Industry GroupExposition
Data source: Bloomberg, Rietumu Asset Management
Assets Distribution
100%BondsStocksOther
Currency Exposition
0% 50% 100%
USD 90%6%
4%EURCHF
0% 10%5% 15% 20% 25%
20%14%14%
10%7%7%7%
4%4%3%3%3%3%
Semiconductors/ MicrochipsComputers
BiotechnologySoftware
InternetCommunications
Aeronautics/ Defense industryMachinery
Parts and accessoriesEntertainment
Appliances and accessoriesMedical suppliesPharmaceuticals
INVESTMENT PORTFOLIO “ INDUSTRY 4.0”
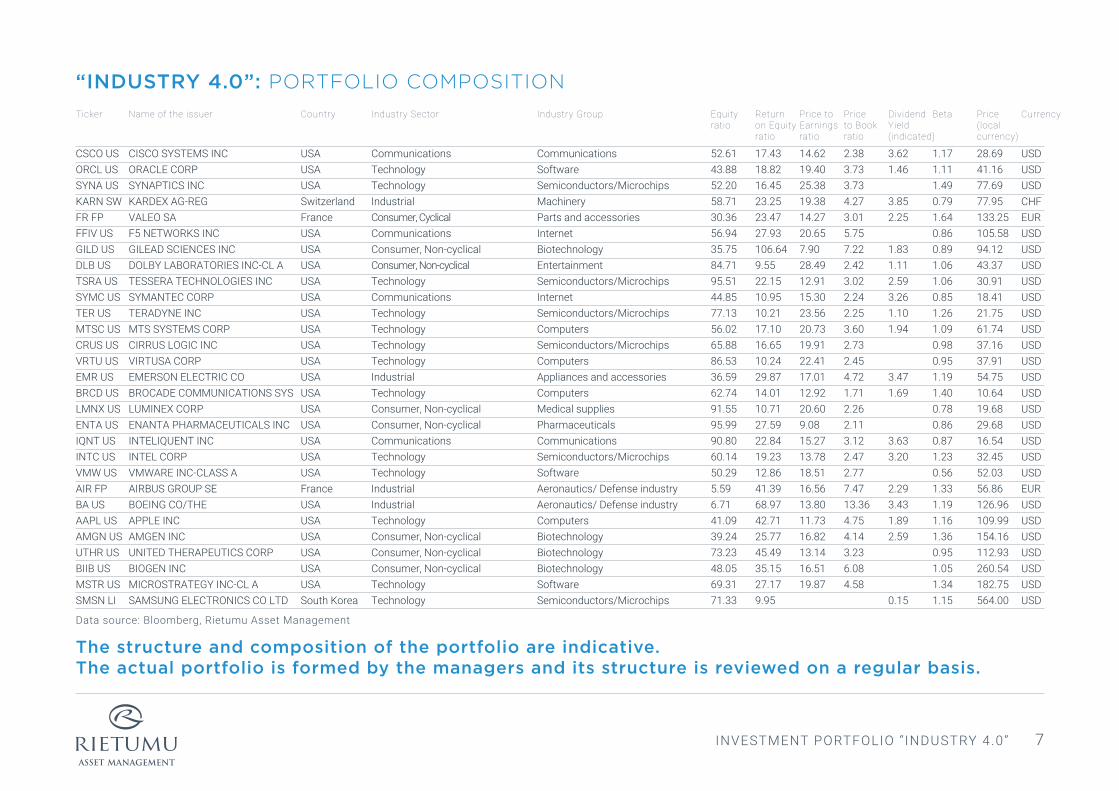
The structure and composition of the portfolio are indicative. The actual portfolio is formed by the managers and its structure is reviewed on a regular basis.
7
“INDUSTRY 4.0”: PORTFOLIO COMPOSITION
Equityratio
Returnon Equityratio
Price toEarningsratio
Priceto Bookratio
DividendYield(indicated)
Beta
Data source: Bloomberg, Rietumu Asset Management
Ticker Name of the issuer Country Industry Sector Industry Group Price(localcurrency)
Currency
CSCO USORCL USSYNA USKARN SWFR FPFFIV USGILD USDLB USTSRA USSYMC USTER USMTSC USCRUS USVRTU USEMR USBRCD USLMNX USENTA USIQNT USINTC USVMW USAIR FPBA USAAPL USAMGN USUTHR USBIIB USMSTR USSMSN LI
CISCO SYSTEMS INCORACLE CORPSYNAPTICS INCKARDEX AG-REGVALEO SAF5 NETWORKS INCGILEAD SCIENCES INCDOLBY LABORATORIES INC-CL ATESSERA TECHNOLOGIES INCSYMANTEC CORPTERADYNE INCMTS SYSTEMS CORPCIRRUS LOGIC INCVIRTUSA CORPEMERSON ELECTRIC COBROCADE COMMUNICATIONS SYSLUMINEX CORPENANTA PHARMACEUTICALS INCINTELIQUENT INCINTEL CORPVMWARE INC-CLASS AAIRBUS GROUP SEBOEING CO/THEAPPLE INCAMGEN INCUNITED THERAPEUTICS CORPBIOGEN INCMICROSTRATEGY INC-CL ASAMSUNG ELECTRONICS CO LTD
USAUSAUSASwitzerlandFranceUSAUSAUSAUSAUSAUSAUSAUSAUSAUSAUSAUSAUSAUSAUSAUSAFranceUSAUSAUSAUSAUSAUSASouth Korea
Communications Technology TechnologyIndustrial Consumer, Cyclical Communications Consumer, Non-cyclical Consumer, Non-cyclical Technology Communications Technology Technology Technology Technology Industrial Technology Consumer, Non-cyclical Consumer, Non-cyclical Communications Technology Technology Industrial Industrial Technology Consumer, Non-cyclical Consumer, Non-cyclical Consumer, Non-cyclical Technology Technology
Communications SoftwareSemiconductors/MicrochipsMachineryParts and accessoriesInternetBiotechnologyEntertainmentSemiconductors/MicrochipsInternetSemiconductors/MicrochipsComputersSemiconductors/MicrochipsComputersAppliances and accessoriesComputersMedical suppliesPharmaceuticalsCommunications Semiconductors/MicrochipsSoftwareAeronautics/ Defense industryAeronautics/ Defense industryComputersBiotechnologyBiotechnologyBiotechnologySoftwareSemiconductors/Microchips
52.6143.8852.2058.7130.3656.9435.7584.7195.5144.8577.1356.0265.8886.5336.5962.7491.5595.9990.8060.1450.295.596.7141.0939.2473.2348.0569.3171.33
17.4318.8216.4523.2523.4727.93106.649.5522.1510.9510.2117.1016.6510.2429.8714.0110.7127.5922.8419.2312.8641.3968.9742.7125.7745.4935.1527.179.95
14.6219.4025.3819.3814.2720.657.9028.4912.9115.3023.5620.7319.9122.4117.0112.9220.609.0815.2713.7818.5116.5613.8011.7316.8213.1416.5119.87
2.383.733.734.273.015.757.222.423.022.242.253.602.732.454.721.712.262.113.122.472.777.4713.364.754.143.236.084.58
3.621.46
3.852.25
1.831.112.593.261.101.94
3.471.69
3.633.20
2.293.431.892.59
0.15
1.171.111.490.791.640.860.891.061.060.851.261.090.980.951.191.400.780.860.871.230.561.331.191.161.360.951.051.341.15
28.6941.1677.6977.95133.25105.5894.1243.3730.9118.4121.7561.7437.1637.9154.7510.6419.6829.6816.5432.4552.0356.86126.96109.99154.16112.93260.54182.75564.00
USDUSDUSDCHFEURUSDUSDUSDUSDUSDUSDUSDUSDUSDUSDUSDUSDUSDUSDUSDUSDEURUSDUSDUSDUSDUSDUSDUSD
INVESTMENT PORTFOLIO “ INDUSTRY 4.0”

8
“INDUSTRY 4.0”: HISTORICAL MODELS
Rietumu Asset Management experts applied a simulation of the historical indicators of the model «Industry 4.0» portfolio for a 10-year period, starting from 2005.
The calculated value growth was +10.6% per year. Therefore, the historical portfolio yield exceeded market standards by 5.7 times.
Characteristics of the Model Portfolio(01.01.2005-15.03.2016)
Model Portfolio
Market Standard(MSCI ACWI)
2005 2006 2007 2008 2009 2010 2011 2012 2013 2014 2015 2016
2016
Yield compared to the market standard from 01.01.2005
Historical dynamics of the model “INDUSTRY 4.0” portfolio
(01.01.2005 = 100)
0
100
200
300
400
Model Portfolio Market Standard (MSCI ACWI)
+210.48%
+36.98%
-20%
0%
20%
40%
Average 3 month yield
Average 3 month yield exceeding market standard
Average annual yield
Average annual yield exceeding market standard
Yield from 01.01.2005
Yield exceeding market standard from 01.01.2005
Average annual volatility
Maximum drawdown
Sharpe ratio (annual)
Information ratio (annual)
Jensen's Alpha (annual)
Beta coefficient
Tracking error
Correlation
Average number of companies in the portfolio
2.65%
1.57%
10.60%
6.29%
210.48%
173.50%
9.23%
-12.37%
0.89
0.62
3.63%
0.47
10.21%
87.44%
35
1.08%
-
4.32%
-
36.98%
-
17.24%
-50.66%
-
-
-
-
-
-
-
2005 2006 2007 2008 2009 2010 2011 2012 2013 2014 2015Data source: Bloomberg, Rietumu Asset Management
Historical indicators of the model «Industry 4.0» portfolio are simulated. Historical data does not guarantee future profitability.
INVESTMENT PORTFOLIO “ INDUSTRY 4.0”

9
“INDUSTRY 4.0”: DEFINITIONS OF TERMS
Volatility – statistical financial indicators, describing the variability of the price. The higher figure indicates higher variability of the price and as a result, a higher level of risk.
Correlation – statistical relation of the portfolio and market standard. The value of the correlation can vary in range from -1 (-100%) to 1 (100%). Correlation of 1 or 100% means that the price changes are fully in line with the price changes of the market standard. Correlation of -1 or -100% means that the portfolio price moves with the same dynamics as the price of the market standard, but in the opposite direction.Correlation of 0 means that there is no interrelation between the portfolio and market standard.
Beta coefficient – an indicator describing market (or systematic) risk. The Beta coefficient shows the level of the price variability and interrelation between the asset and market standard. A Beta coefficient of 1 means that the price variability level coincides with the variability of the market standard. A Beta coefficient less than 1 means that the asset price displays lower variability than market standard (lower market risk). Therefore, a Beta coefficient higher than 1 means higher variability and higher market risk.
Information ratio – an indicator describing profitability of a portfolio with allowance for risk. The information ratio shows portfolio yield higher than the market standard yield adjusted for the volatility level of the given profitability.
Jensen's Alpha – an indicator describing profitability of a portfolio with allowance for the market risk, average yield of the market standard and risk-free interest rate. This coefficient shows the ability of the manager to receive a higher yield than the average yield of the market standard, accounting for the risk, i.e. the efficiency of the manager. The higher the coefficient, the more efficiently the portfolio is managed.
Sharpe ratio – an indicator describing the profitability of a portfolio with allowance for risk-free interest rate. The Sharpe ratio shows how well the portfolio yield compensates for the risk taken.The Sharpe ratio is calculated as the ratio of average risk premium (portfolio profitability less risk-free interest rate) to the standard portfolio yield deviation.
Tracking error – an indicator describing how closely the portfolio repeats dynamics of the market standard. The tracking error coefficient shows the difference between portfolio yield and market standard yield. The lower the Tracking error coefficient, the less the deviation.
Equity ratio – the relation of the company's equity to its total assets.
Maximum Drawdown – the maximum portfolio value drop, in percentage terms, from the previous maximum price to the following minimum for the specified time period.
Price-to-book ratio (PB ratio) – ratio of the market capitalization of the company to its equity.
Price-to-earnings ratio (PE ratio) – ratio of the market capitalization of the company to its net income.
Return on equity ratio (ROE ratio) – ratio of the company' s net income to its equity.
INVESTMENT PORTFOLIO “ INDUSTRY 4.0”

10
CLAUSE LIMITING LIABILITY
DISCLAIMER: This overview (including any attachment (-s)) does not constitute a request, offer, recommendation or invitation of any kind to buy, sell or redeem any financial instruments or to conclude and/or to perform other transactions of any kind. The authors of the information presented in this overview, as well as JSC “Rietumu Asset Management" IMF, registered in the Commercial Register of Republic of Latvia on January 29, 2014, registration number 40103753360, legal address: 7 Vesetas Street, Riga, LV-1013, Latvia, hereinafter referred to as “RAM”, both together and individually, are not liable for possible use of the information presented in this overview, including any direct or indirect damages (including lost profits), as well as any penalties. Evaluations, opinions and forecasts presented in this overview are based solely on the RAM’s specialists' conclusions regarding financial instruments and issuers considered in this overview. While the information contained in this overview is obtained from sources believed to be reliable, the RAM does not guarantee its accuracy and completeness. Any of your investment decision should be fully based on your assessment of your personal financial circumstances and investment objectives. The RAM draws your attention to the fact that transactions in the securities and financial instruments market involve risk and require appropriate knowledge and experience.
INVESTMENT PORTFOLIO “ INDUSTRY 4.0”