Embed Size (px)
Citation preview
M ARC H, 2 005E AST KAL IMA NTA N
INV EST MENT OP PORT UNIT IES STUD YF OR E ACH PRO VINC E OFEAS T, WE ST, C ENT RAL AND SOU TH K ALIM ANT AN
BKPM
INVESTMENT OPPORTUNITIES STUDYFOR EACH PROVINCE
OFEAST, WEST, CENTRAL AND SOUTH KALIMANTAN
INVESTMENT COORDINATING BOARD (BKPM)JAPAN INTERNATIONAL COOPERATION AGENCY
PT. PACIFIC CONSULINDO INTERNATIONAL INDONESIA(formerly PT.Mitrapacific Consulindo International)
FINAL REPORT SOUTH KALIMANTAN
March, 2005
i
TABLE OF CONTENTS
Page
I. OVERVIEW OF PROVINCIAL ECONOMY ...................................... 1 - 1
1.1. Geographical Conditions ......................................................... 1 - 1
1.2. GRDP and Growth Rate by Sector ......................................... 1 - 2
1.3. International Trade of Province ............................................... 1 - 5
1.4. Population Growth and Unemployment Rate .......................... 1 - 7
1.5. Land Price in Major Kabupaten/Kota ...................................... 1 - 9
1.6. Other Basic Economic and Industrial Indicators .................... 1 - 9
1.7. Investment Performance of PMA and PMDN ........................ 1 - 13
1.8. Industrial Map ......................................................................... 1 - 17
II. CURRENT SITUATION AND FUTURE PROSPECT OF INFRASTRUCTURE........................................................................... 2 - 1
2.1 Road ....................................................................................... 2 - 1
2.2 River ........................................................................................ 2 - 2
2.3 Harbor ...................................................................................... 2 - 6
2.4. Airport ..................................................................................... 2 - 13
2.5. Industrial Estate ....................................................................... 2 - 15
2.6. Electricity ................................................................................. 2 - 15
2.7. Post and Telecommunication .................................................. 2 - 16
2.8. Water Supply ........................................................................... 2 - 18
2.9. Health Facility / Hospital .......................................................... 2 - 18
III. CURRENT SITUATION AND FUTURE PROSPECT OF MAJOR SECTORS........................................................................................... 3 - 1
3.1. Major Sector Analysis ............................................................. 3 - 1
3.2. Commodity Analysis ............................................................... 3 - 14
ii
IV. CURRENT SITUATION AND FUTURE PROSPECT OF MAJOR STRATEGIC AREAS.......................................................................... 4 - 1
4.1. Major Strategic Areas by Leading Sectors ............................. 4 - 1
4.2. Recommended Business Development for Strategic Area .... 4 - 11
4.3. Government’s Regional Development Policy .......................... 4 - 12
4.4. Future Prospect of Major Strategic Area ................................ 4 - 15
4.5. Batulicin Industrial Development Bonded Zone / KAPET
Batulicin ................................................................................... 4 - 16
V. CONTRAINTS IN INVESTMENT CLIMATE ...................................... 5 - 1
5.1. Infrastructure Issues ............................................................... 5 - 1
5.2. Land Related Issues ................................................................ 5 - 2
5.3. Lack of Government’s Facility/Support .................................... 5 - 4
5.4. Labor Cost ............................................................................... 5 - 5
5.5. Land Price in Major Kabupaten/Kota ....................................... 5 - 6
5.6. Government ‘s Efforts............................................................... 5 - 6
5.7. Proposal ................................................................................... 5 - 6
VI. PROPOSAL OF PROSPECTIVE PROJECTS .................................. 6 - 1
Crude Palm Oil Based Cooking Oil Factory ....................................... 6 - 2
A. Production Process ............................................................ 6 - 2
B. Competitiveness ................................................................. 6 - 3
C. Market Opportunities .......................................................... 6 - 5
D. Potential Location ............................................................... 6 - 7
E. Infrastructure and Business Support Facilities................... 6 - 7
F. Proposed Business Scale................................................... 6 - 8
H. Cost of Factor ..................................................................... 6 - 8
Rubber Nursery, Replanting and Trading Business ........................... 6 - 10
A. Production Process ............................................................ 6 - 10
B. Competitiveness ................................................................. 6 - 10
C. Market Opportunities .......................................................... 6 - 11
D. Potential Location ............................................................... 6 - 12
E. Infrastructure and Business Support Facilities................... 6 - 12
F. Proposed Business Scale................................................... 6 - 12
iii
G. Cost of Factors ................................................................... 6 - 12
Hatchery and Shrimp Development.................................................... 6 - 13
A. Production Description ....................................................... 6 - 13
B. Competitiveness ................................................................. 6 - 13
C. Market Opportunities .......................................................... 6 - 14
D. Potential Location ............................................................... 6 - 15
E. Infrastructure and Business Support Facilities................... 6 - 15
F. Proposed Business Scale................................................... 6 - 16
G. Cost of Factors ................................................................... 6 - 16
Seaweeds Farming ............................................................................. 6 - 17
A. Production Description ....................................................... 6 - 17
B. Competitiveness ................................................................. 6 - 17
C. Market Opportunities .......................................................... 6 - 18
D. Potential Location ............................................................... 6 - 19
E. Infrastructure and Business Support Facilities................... 6 - 20
F. Proposed Business Scale................................................... 6 - 20
G. Cost of Factors ................................................................... 6 - 20
APPENDIX
List of Local Business and Contact Point
iv
LIST OF TABLES
Page Table 1-1. The Area of Kabupaten/Kota by Altitude Class (Ha), 2002 ... 1 - 1 Table 1-2. The Area of Kabupaten/Kota by Slope Class (Ha), 2002 ....... 1 - 1 Table 1-3. Total GRDP at Constant 1993 Prices by Kalimantan Provinces,
1999 – 2003 (Mill. Rupiah) ...................................................... 1 - 2
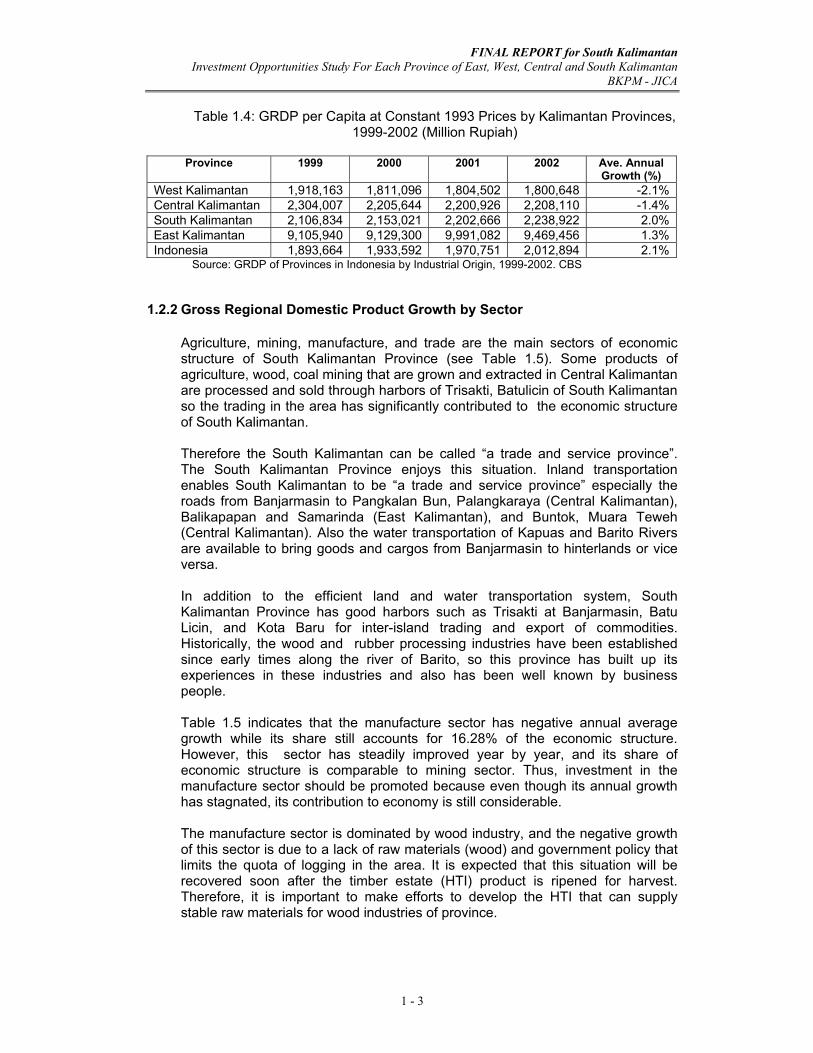
Table 1-4. GRDP per Capita at Constant 1993 Prices by Kalimantan
Provinces, 1999 – 2003 (Mill. Rupiah) .................................... 1 - 3
Table 1-5. The Percentage Growth and Structure of South Kalimantan
Provinces at 1993 Constant Prices by Economic sector, ....... 1 - 4
Table 1-6. Export – Import of South Kalimantan, 1993 – 2003 ................ 1 - 5
Table 1-7. Percentage of Export Value by Commodity of South -
Kalimantan, 1993 - 2003 (%) .................................................. 1 - 6
Table 1-8. Total and Average Growth Population in South Kalimantan ... 1 - 7
Table 1-9. Employment of more than 10 years old by Sector, 2003 ....... 1 - 8
Table 1-10 Rupiah and Foreign Currency Credit by Bank Group ............ 1 - 11
Table 1-11 Rupiah and Foreign Currency Credit by Purpose ................... 1 - 11
Table 1-12 Bank Credit Development by Economic Sector ...................... 1 - 12
Table 2-1. Road Condition, South Kalimantan, 2004 .............................. 2 - 1 Table 2-2. River and Canal in South Kalimantan Province ...................... 2 - 3 Table 2-3. Special Ports in South Kalimantan, 2004 ............................... 2 - 7 Table 2-4. Profile of Selected Main Harbor in South Kalimantan ............ 2 - 8 Table 2-5. Recapitulation of Cargo and Passenger Flow In South Kalimantan Harbors ................................................................ 2 - 10 Table 2-6. The Activities of Airport in South Kalimantan, ........................ 2 - 13 Table 3-1. Area, Production & Productivity for Plantation Commodity, ... 3 - 3 Table 3-2. Capture Shrimp Production of Sea Area ................................ 3 - 5 Table 3-3. Capture Shrimp Production of Fresh Area............................... 3 - 5 Table 3-4. Cultivated Shrimp Production of Brackish Ponds .................... 3 - 6 Table 3-5. Trend of Planted area, Harvested Area and Production of Corn
by Kabupaten/Kota, 2001 - 2003 ............................................. 3 - 8 Table 3-6. Population of Big, Small Ruminant & Poultry, 2003 ............... 3 - 9
v
Table 3-7. Mining & Energy Potential of South Kalimantan Province....... 3 - 11 Table 3-8. The Projection of Area & Production CPO, 2003-2027 ........... 3 - 15 Table 3-9. World Vegetable Oil Consumption, 2003................................. 3 - 17 Table 3-10. The Projection of World Oil Palm Production, 2004–2010 ...... 3 - 18 Table 3-11. Indonesia Export CPO Based on Country Destination ........... 3 - 18 Table 3-12. Area of Rubber Plantation by Type of Business Management
and Kabupaten, 2003 .............................................................. 3 - 23 Table 3-13. Position for Natural and Synthetic Rubber in The World ......... 3 - 26 Table 3-14. The Trend of Natural Rubber Production................................. 3 - 27 Table 3-15. Natural Rubber Consumption by Major Countries .................. 3 - 28 Table 3-16. Rubber Factory in South Kalimantan, 2004............................. 3 - 29 Table 3-17. Potential and Exploitation of Brackish Water Area, 2003........3 - 31 Table 3-18. Cultivated Shrimp & Milkfish Production in BrackishWater .....3 - 31 Table 3-19. Trend of Shrimp Production from Seawater, Freshwater
And Cultivated in South Kalimantan ........................................3 - 32 Table 3-20. Trend of Export Shrimp by Main Countries Destination ..........3 - 34 Table 3-21. Number of Fisheries Group by Category of Pond Area..........3 - 35 Table 3-22. Number of Fisheries Group by Type of Brackish Water ..........3 - 35 Table 3-23. Trend of Seaweed Production by Provinces ...........................3 - 37 Table 3-24. Cultivated Seaweed Area by Main Province, 2003 .................3 - 38 Table 3-25. Trend of Seaweed Export by Main Countries Destination.......3 - 40 Table 3-26. The Growth of Marine Fishery by Type in South Kalimantan..3 - 44 Table 3-27. The Growth of Harvest area, Production and Yield Rate of Corn
by Kabupaten/City, 1999 - 2003 ..............................................3 - 45 Table 3-28. The Growth of Harvest area, Production and Yield Rate of
Soybean by Kabupaten/City, 1999 - 2003...............................3 - 46 Table 3-29. Reserve of Industrial Minerals in South Kalimantan................3 - 49 Table 3-30. Domestic Consumption of Cement in Indonesia .....................3 - 51 Table 3-31. Export of Indonesia Cement Industry ......................................3 - 52 Table 4-1. Standing Stock Volume by Kabupaten Based on NFI
Measurement ...........................................................................4 - 2 Table 4-2. List of HTI Management Right (HPHTI) ..................................4 - 4 Table 4-3. Recommended Business Development for Strategic Area .....4 - 11 Table 6-1. The Projection of World Oil Palm Production ..........................6 - 3 Table 6-2. Number, Production Capacity of Cooking Oil Industry ...........6 - 3
vi
Table 6-3. Development of Plantation area and Its CPO Production ......6 - 4 Table 6-4. The Projection of Area and Production of Crude Oil Palm .....6 - 5 Table 6-5. CPO Based Cooking Oil Production, Export, Import, and
Consumption, 1998 – 2003 .....................................................6 - 5 Table 6-6. Projection of Domestic Consumption of CPO Based
Cooking Oil ..............................................................................6 - 6 Table 6-7. Comparison of World Consumption in Various Vegetable Oil............................................................................6 - 6 Table 6-8. Area of Rubber Plantation by Type of Business Management and Kabupaten, 2003 ........................................6 - 10 Table 6-9. Trend of Shrimp Production from Seawater, Freshwater
and Cultivated in South Kalimantan.........................................6 - 13 Table 6-10. Trend of Export Shrimp by Main Countries Destination ..........6 - 14 Table 6-11. Trend of Seaweed Production by Provinces ...........................6 - 17 Table 6-12. Cultivated Seaweed area by Province ....................................6 - 18 Table 6-13. Trend of Seaweed Export by Main Countries Destination.......6 - 19
vii
LIST OF FIGURES
Page Figure 1.1. Share of GRDP by Economic sector, 2003 ............................. 1 - 4 Figure 1.2. The Composition of Employment in South Kalimantan ........... 1 - 8 Figure 1.3. Number of Domestic & Foreign Investment Project Approved
by BKPM/BKPMD, 1993 - August 2004 ................................. 1- 13
Figure 1.4. The Growth of PMDN Projects in South Kalimantan, ............. 1- 13
Figure 1.5. The Growth of (PMDN Value in South Kalimantan, ............... 1 - 14
Figure 1.6. Percentage of PMDN Planned Projects by Sector .................. 1 - 14
Figure 1.7. Cumulative PMDN Plan & Realization of Investment Value ... 1 - 15
Figure 1.8. The Growth Foreign Direct Investment (PMA) Project in
South Kalimantan, 1993 - August 2004 .................................. 1 - 15
Figure 1.9. The Growth of PMA Value in South Kalimantan, ................... 1 - 16
Figure 1.10. Percentage of PMA Planned Projects by Sector .................... 1 - 16
Figure 1.11. Cumulative PMA Plan & Realization of Investment Value ..... 1 - 17
Figure 1.12. Industrial Map .......................................................................... 1 - 18
Figure 2.1. Map of National & Province Road Network ............................ 2 - 4 Figure 2.2. Map of River Network and Harbors in South Kalimantan ....... 2 - 5 Figure Batulicin Port Situatuin, 2004................................................... 2 - 11 Figure 2.3. Route Airplane From Syamsuddin Noor Airport ..................... 2 - 14 Figure 2.4. Map of Industrial Estate in South Kalimantan.......................... 2 - 17 Figure 3.1. Map of Main Natural Resources & Industrial Loaction ............ 3 - 13 Figure 3.2. World Vegetable Oil Consumption, 2003................................. 3 - 17 Figure 3.3. Trend of Indonesia CPO and Cooking Oil Price at Rotterdam
Market ...................................................................................... 3 - 19 Figure 3-4. Indonesian Rubber Price at Rotterdam Market .........................3 - 22
Figure 3-5. World Rubber Consumption Projection and Actual ...................3 - 27 Figure 3-6. China Natural Rubber Imports by Selected Countries Origin ..3 - 29 Figure 3-7. Trend of Production & Domestic Consumption of Seaweed in Indonesia ......................................................................................3 - 40 Figure 3-8. Domestic Trade Flows For Carragenan – Bearing Seaweeds
in Indonesia......................................................................................3 - 42
viii
Figure 3-9. Domestic Trade Flows For Agar – Bearing Seaweeds in
in Indonesia......................................................................................3 - 43 Figure 3-10. Trend of Indonesia Cement Production & Production Capacity
............................................................................................................3 - 48 Figure 3-11. Market Share of National Industrial Cement, 2003.................. 3 - 51 Figure 4-1. Map of Banjarmasin City and Surrounding .................................4 - 6 Figure 4-2. Map of Kabupaten Tanah Laut ....................................................4 - 7 Figure 4-3. Map of Kabupaten Tanah Bumbu and Kotabaru .......................4 - 10 Figure 4-4. Regional Eonomic Linkages Between Central Kalimantan And South Kalimantan ...................................................................4 - 13 Figure 6-1. Trend of Indonesia Cooking Oil Price at Rotterdam .................6 - 7
OVERVIEW OF PROVINCIAL ECONOMY
FINAL REPORT for South Kalimantan Investment Opportunities Study For Each Province of East, West, Central and South Kalimantan
BKPM - JICA
1 - 1
CHAPTER 1
OVERVIEW OF PROVINCIAL ECONOMY
1.1 Geographical Conditions
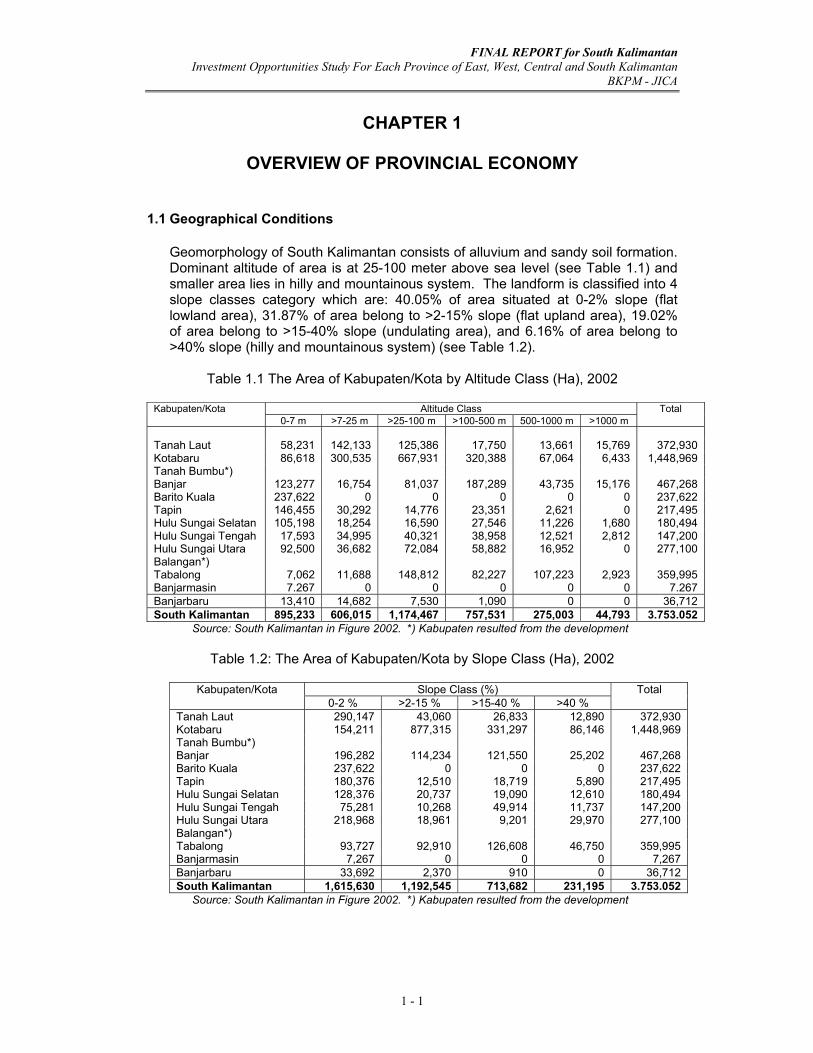
Geomorphology of South Kalimantan consists of alluvium and sandy soil formation. Dominant altitude of area is at 25-100 meter above sea level (see Table 1.1) and smaller area lies in hilly and mountainous system. The landform is classified into 4 slope classes category which are: 40.05% of area situated at 0-2% slope (flat lowland area), 31.87% of area belong to >2-15% slope (flat upland area), 19.02% of area belong to >15-40% slope (undulating area), and 6.16% of area belong to >40% slope (hilly and mountainous system) (see Table 1.2).
Table 1.1 The Area of Kabupaten/Kota by Altitude Class (Ha), 2002
Altitude Class Kabupaten/Kota
0-7 m >7-25 m >25-100 m >100-500 m 500-1000 m >1000 m Total
Tanah Laut 58,231 142,133 125,386 17,750 13,661 15,769 372,930 Kotabaru 86,618 300,535 667,931 320,388 67,064 6,433 1,448,969 Tanah Bumbu*) Banjar 123,277 16,754 81,037 187,289 43,735 15,176 467,268 Barito Kuala 237,622 0 0 0 0 0 237,622 Tapin 146,455 30,292 14,776 23,351 2,621 0 217,495 Hulu Sungai Selatan 105,198 18,254 16,590 27,546 11,226 1,680 180,494 Hulu Sungai Tengah 17,593 34,995 40,321 38,958 12,521 2,812 147,200 Hulu Sungai Utara 92,500 36,682 72,084 58,882 16,952 0 277,100 Balangan*) Tabalong 7,062 11,688 148,812 82,227 107,223 2,923 359,995 Banjarmasin 7.267 0 0 0 0 0 7.267 Banjarbaru 13,410 14,682 7,530 1,090 0 0 36,712 South Kalimantan 895,233 606,015 1,174,467 757,531 275,003 44,793 3.753.052
Source: South Kalimantan in Figure 2002. *) Kabupaten resulted from the development
Table 1.2: The Area of Kabupaten/Kota by Slope Class (Ha), 2002 Slope Class (%) Kabupaten/Kota
0-2 % >2-15 % >15-40 % >40 % Total
Tanah Laut 290,147 43,060 26,833 12,890 372,930 Kotabaru 154,211 877,315 331,297 86,146 1,448,969 Tanah Bumbu*) Banjar 196,282 114,234 121,550 25,202 467,268 Barito Kuala 237,622 0 0 0 237,622 Tapin 180,376 12,510 18,719 5,890 217,495 Hulu Sungai Selatan 128,376 20,737 19,090 12,610 180,494 Hulu Sungai Tengah 75,281 10,268 49,914 11,737 147,200 Hulu Sungai Utara 218,968 18,961 9,201 29,970 277,100 Balangan*) Tabalong 93,727 92,910 126,608 46,750 359,995 Banjarmasin 7,267 0 0 0 7,267 Banjarbaru 33,692 2,370 910 0 36,712 South Kalimantan 1,615,630 1,192,545 713,682 231,195 3.753.052
Source: South Kalimantan in Figure 2002. *) Kabupaten resulted from the development
FINAL REPORT for South Kalimantan Investment Opportunities Study For Each Province of East, West, Central and South Kalimantan
BKPM - JICA
1 - 2
Of the 13 (thirteen) of Kabupaten/Kota, 5 (five) of Kabupaten and one Kota have coastal and sea accessibility. They are Kabupaten Barito Kuala, Kabupaten Tanah Laut, Kabupaten Kotabaru, Kabupaten Tanah Bumbu, Kabupaten Banjar, and Kota Banjarmasin. Development status of South Kalimantan is characterized by economic activities in the coastal areas. As it is well known the economic interaction of coastal area with outside is more intensive comparing to hinterland area; therefore, these five Kabupaten and one Kota are situated in strategic positions in business activities of South Kalimantan. On the other hand, the others have no such situation; most of them mainly depend on agriculture and mining as suppliers of raw materials products. The average annual rainfall of South Kalimantan Province ranges from 81.9 to 307.3 mm per month. The highest rainfall occurs in December with average 400.3 mm and the lowest rainfall occurs in May with 160.9 mm. The number of total rainy day ranges around 13-27 days per month or 236 days in a year. The climate belong to A and B class of Schmit and Ferguson scale. Average temperature of South Kalimantan varies from 26.20 C to 38.30 C with humidity minimum at 35% and maximum at 98%. This tropical climate is suitable for cultivating a variety of crops, such as oil palm, rubber, oranges, banana, and rice as well.
1.2 Gross Regional Domestic Product and Growth Rate by Sector 1.2.1 Gross Regional Domestic Product Growth in Regional Context
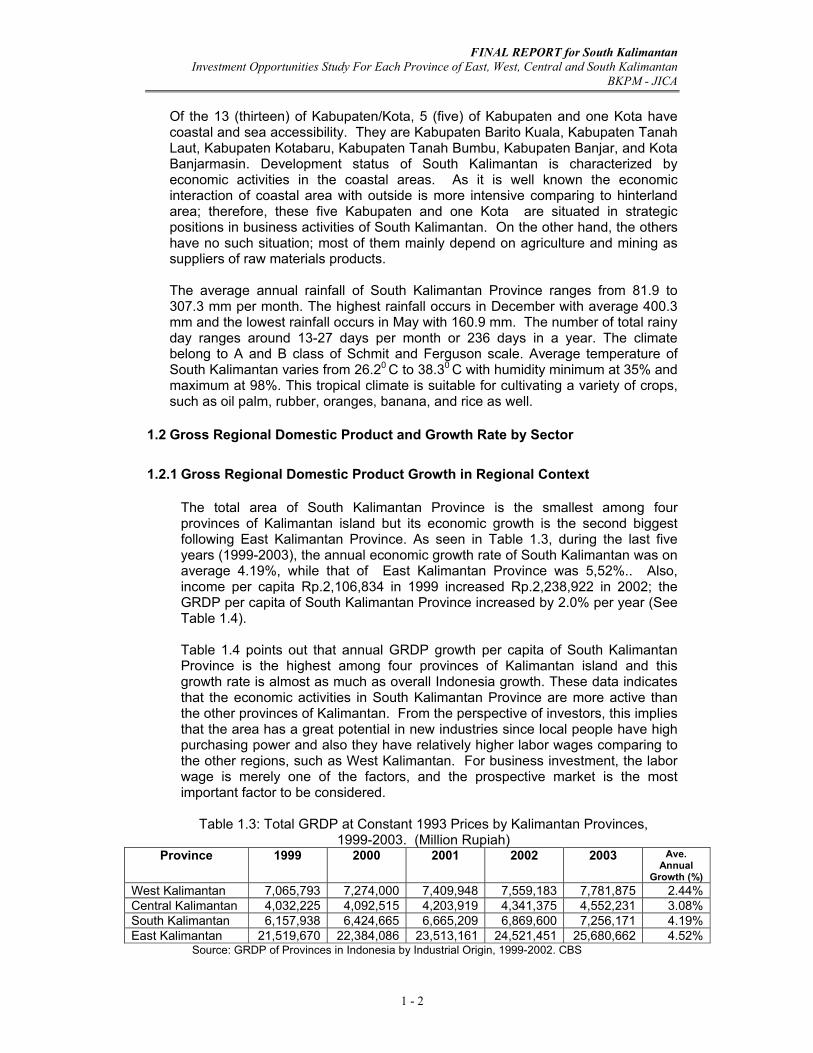
The total area of South Kalimantan Province is the smallest among four provinces of Kalimantan island but its economic growth is the second biggest following East Kalimantan Province. As seen in Table 1.3, during the last five years (1999-2003), the annual economic growth rate of South Kalimantan was on average 4.19%, while that of East Kalimantan Province was 5,52%.. Also, income per capita Rp.2,106,834 in 1999 increased Rp.2,238,922 in 2002; the GRDP per capita of South Kalimantan Province increased by 2.0% per year (See Table 1.4). Table 1.4 points out that annual GRDP growth per capita of South Kalimantan Province is the highest among four provinces of Kalimantan island and this growth rate is almost as much as overall Indonesia growth. These data indicates that the economic activities in South Kalimantan Province are more active than the other provinces of Kalimantan. From the perspective of investors, this implies that the area has a great potential in new industries since local people have high purchasing power and also they have relatively higher labor wages comparing to the other regions, such as West Kalimantan. For business investment, the labor wage is merely one of the factors, and the prospective market is the most important factor to be considered.
Table 1.3: Total GRDP at Constant 1993 Prices by Kalimantan Provinces,
1999-2003. (Million Rupiah) Province 1999 2000 2001 2002 2003 Ave.
Annual Growth (%)
West Kalimantan 7,065,793 7,274,000 7,409,948 7,559,183 7,781,875 2.44%Central Kalimantan 4,032,225 4,092,515 4,203,919 4,341,375 4,552,231 3.08%South Kalimantan 6,157,938 6,424,665 6,665,209 6,869,600 7,256,171 4.19%East Kalimantan 21,519,670 22,384,086 23,513,161 24,521,451 25,680,662 4.52%
Source: GRDP of Provinces in Indonesia by Industrial Origin, 1999-2002. CBS
FINAL REPORT for South Kalimantan Investment Opportunities Study For Each Province of East, West, Central and South Kalimantan
BKPM - JICA
1 - 3
Table 1.4: GRDP per Capita at Constant 1993 Prices by Kalimantan Provinces,
1999-2002 (Million Rupiah)
Province 1999 2000 2001 2002 Ave. Annual Growth (%)
West Kalimantan 1,918,163 1,811,096 1,804,502 1,800,648 -2.1%Central Kalimantan 2,304,007 2,205,644 2,200,926 2,208,110 -1.4%South Kalimantan 2,106,834 2,153,021 2,202,666 2,238,922 2.0%East Kalimantan 9,105,940 9,129,300 9,991,082 9,469,456 1.3%Indonesia 1,893,664 1,933,592 1,970,751 2,012,894 2.1%
Source: GRDP of Provinces in Indonesia by Industrial Origin, 1999-2002. CBS
1.2.2 Gross Regional Domestic Product Growth by Sector
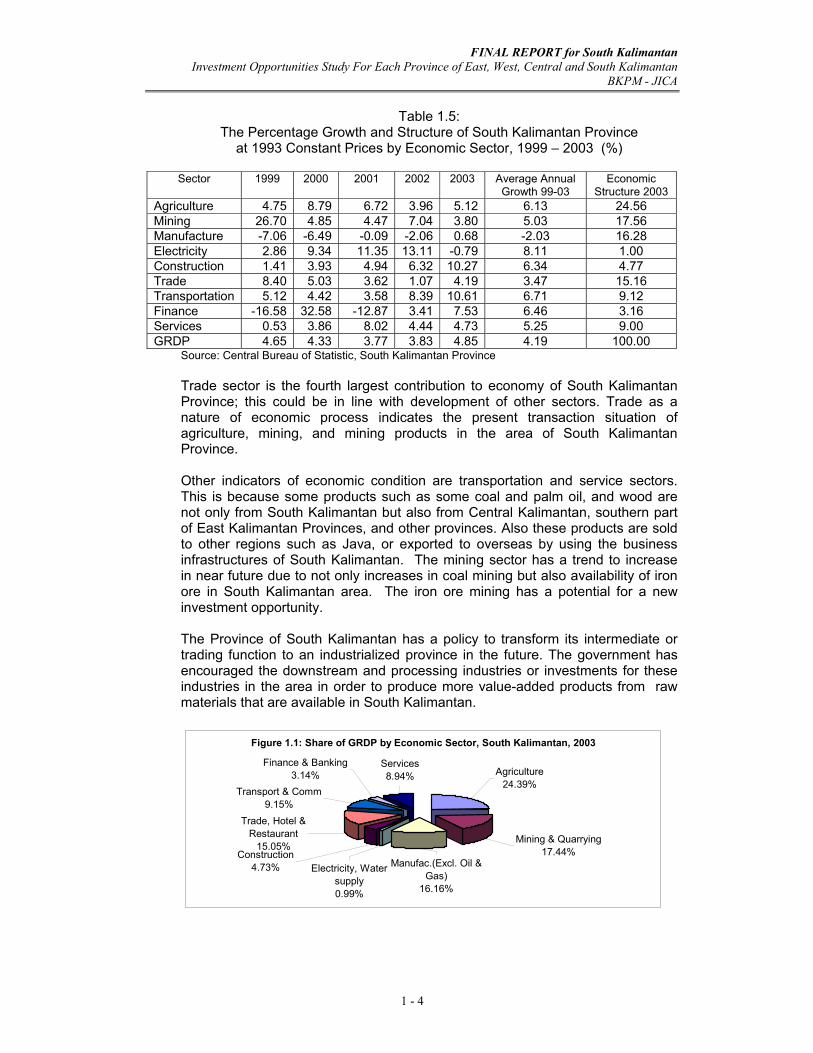
Agriculture, mining, manufacture, and trade are the main sectors of economic structure of South Kalimantan Province (see Table 1.5). Some products of agriculture, wood, coal mining that are grown and extracted in Central Kalimantan are processed and sold through harbors of Trisakti, Batulicin of South Kalimantan so the trading in the area has significantly contributed to the economic structure of South Kalimantan. Therefore the South Kalimantan can be called “a trade and service province”. The South Kalimantan Province enjoys this situation. Inland transportation enables South Kalimantan to be “a trade and service province” especially the roads from Banjarmasin to Pangkalan Bun, Palangkaraya (Central Kalimantan), Balikapapan and Samarinda (East Kalimantan), and Buntok, Muara Teweh (Central Kalimantan). Also the water transportation of Kapuas and Barito Rivers are available to bring goods and cargos from Banjarmasin to hinterlands or vice versa. In addition to the efficient land and water transportation system, South Kalimantan Province has good harbors such as Trisakti at Banjarmasin, Batu Licin, and Kota Baru for inter-island trading and export of commodities. Historically, the wood and rubber processing industries have been established since early times along the river of Barito, so this province has built up its experiences in these industries and also has been well known by business people. Table 1.5 indicates that the manufacture sector has negative annual average growth while its share still accounts for 16.28% of the economic structure. However, this sector has steadily improved year by year, and its share of economic structure is comparable to mining sector. Thus, investment in the manufacture sector should be promoted because even though its annual growth has stagnated, its contribution to economy is still considerable. The manufacture sector is dominated by wood industry, and the negative growth of this sector is due to a lack of raw materials (wood) and government policy that limits the quota of logging in the area. It is expected that this situation will be recovered soon after the timber estate (HTI) product is ripened for harvest. Therefore, it is important to make efforts to develop the HTI that can supply stable raw materials for wood industries of province.
FINAL REPORT for South Kalimantan Investment Opportunities Study For Each Province of East, West, Central and South Kalimantan
BKPM - JICA
1 - 4
Table 1.5:
The Percentage Growth and Structure of South Kalimantan Province at 1993 Constant Prices by Economic Sector, 1999 – 2003 (%)
Sector 1999 2000 2001 2002 2003 Average Annual
Growth 99-03 Economic
Structure 2003 Agriculture 4.75 8.79 6.72 3.96 5.12 6.13 24.56 Mining 26.70 4.85 4.47 7.04 3.80 5.03 17.56 Manufacture -7.06 -6.49 -0.09 -2.06 0.68 -2.03 16.28 Electricity 2.86 9.34 11.35 13.11 -0.79 8.11 1.00 Construction 1.41 3.93 4.94 6.32 10.27 6.34 4.77 Trade 8.40 5.03 3.62 1.07 4.19 3.47 15.16 Transportation 5.12 4.42 3.58 8.39 10.61 6.71 9.12 Finance -16.58 32.58 -12.87 3.41 7.53 6.46 3.16 Services 0.53 3.86 8.02 4.44 4.73 5.25 9.00 GRDP 4.65 4.33 3.77 3.83 4.85 4.19 100.00
Source: Central Bureau of Statistic, South Kalimantan Province Trade sector is the fourth largest contribution to economy of South Kalimantan Province; this could be in line with development of other sectors. Trade as a nature of economic process indicates the present transaction situation of agriculture, mining, and mining products in the area of South Kalimantan Province. Other indicators of economic condition are transportation and service sectors. This is because some products such as some coal and palm oil, and wood are not only from South Kalimantan but also from Central Kalimantan, southern part of East Kalimantan Provinces, and other provinces. Also these products are sold to other regions such as Java, or exported to overseas by using the business infrastructures of South Kalimantan. The mining sector has a trend to increase in near future due to not only increases in coal mining but also availability of iron ore in South Kalimantan area. The iron ore mining has a potential for a new investment opportunity. The Province of South Kalimantan has a policy to transform its intermediate or trading function to an industrialized province in the future. The government has encouraged the downstream and processing industries or investments for these industries in the area in order to produce more value-added products from raw materials that are available in South Kalimantan.
Figure 1.1: Share of GRDP by Economic Sector, South Kalimantan, 2003
Transport & Comm9.15%
Finance & Banking3.14%
Services8.94%
Trade, Hotel & Restaurant
15.05%Construction
4.73% Electricity, Water supply0.99%
Manufac.(Excl. Oil & Gas)
16.16%
Mining & Quarrying17.44%
Agriculture24.39%
FINAL REPORT for South Kalimantan Investment Opportunities Study For Each Province of East, West, Central and South Kalimantan
BKPM - JICA
1 - 5
Agriculture sector has an inclining trend to share of GRDP mostly supported by fisheries, plantation, and food crops. Among those, the palm oil is the most promising source of GRDP growth. Besides palm oil, rubber crop also has significantly contributed to GRDP. Most of rubber plantations are operated by smallholders with or without Nucleus Estate Smallholders (PIR) Scheme; therefore, it is not promising for new private companies without PIR scheme because it is predicted that the social problems will arise. But oil palm, livestock, and fisheries especially brackishwater are still promising for new companies.
1.3 International Trade of Province
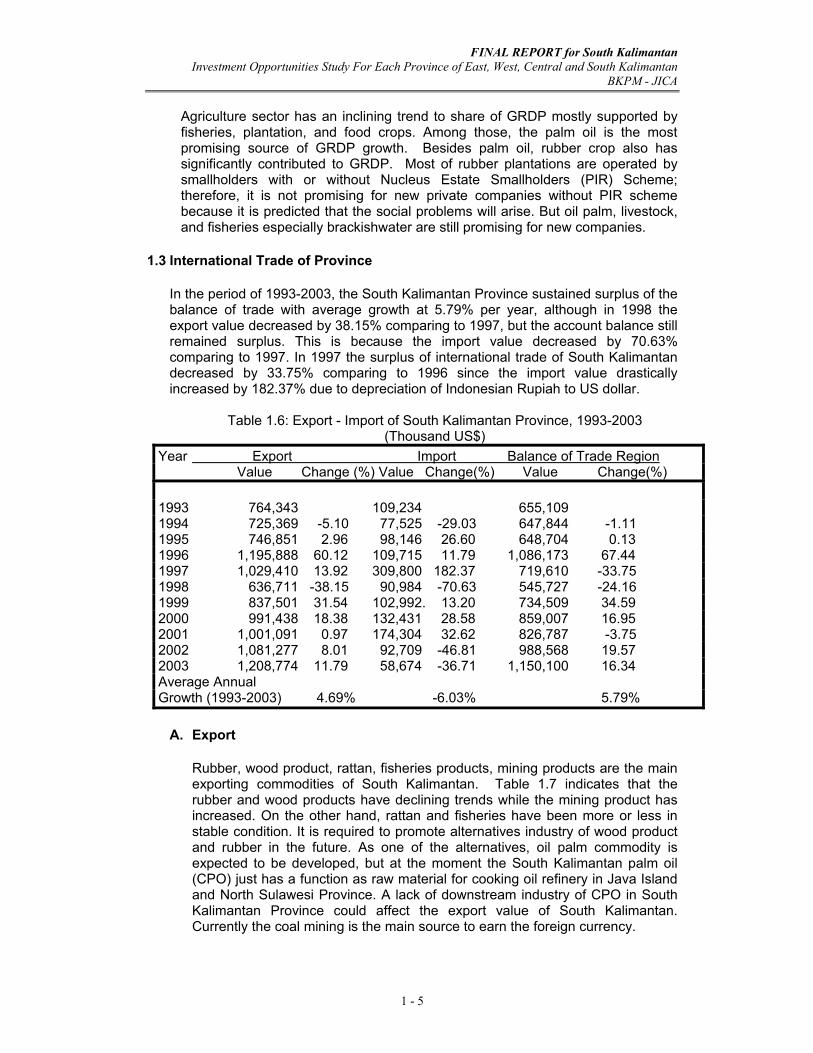
In the period of 1993-2003, the South Kalimantan Province sustained surplus of the balance of trade with average growth at 5.79% per year, although in 1998 the export value decreased by 38.15% comparing to 1997, but the account balance still remained surplus. This is because the import value decreased by 70.63% comparing to 1997. In 1997 the surplus of international trade of South Kalimantan decreased by 33.75% comparing to 1996 since the import value drastically increased by 182.37% due to depreciation of Indonesian Rupiah to US dollar.
Table 1.6: Export - Import of South Kalimantan Province, 1993-2003
(Thousand US$) Year Export Import Balance of Trade Region
Value Change (%) Value Change(%) Value Change(%) 1993 764,343 109,234 655,109 1994 725,369 -5.10 77,525 -29.03 647,844 -1.11 1995 746,851 2.96 98,146 26.60 648,704 0.13 1996 1,195,888 60.12 109,715 11.79 1,086,173 67.44 1997 1,029,410 13.92 309,800 182.37 719,610 -33.75 1998 636,711 -38.15 90,984 -70.63 545,727 -24.16 1999 837,501 31.54 102,992. 13.20 734,509 34.59 2000 991,438 18.38 132,431 28.58 859,007 16.95 2001 1,001,091 0.97 174,304 32.62 826,787 -3.75 2002 1,081,277 8.01 92,709 -46.81 988,568 19.57 2003 1,208,774 11.79 58,674 -36.71 1,150,100 16.34 Average Annual Growth (1993-2003) 4.69% -6.03% 5.79%
A. Export
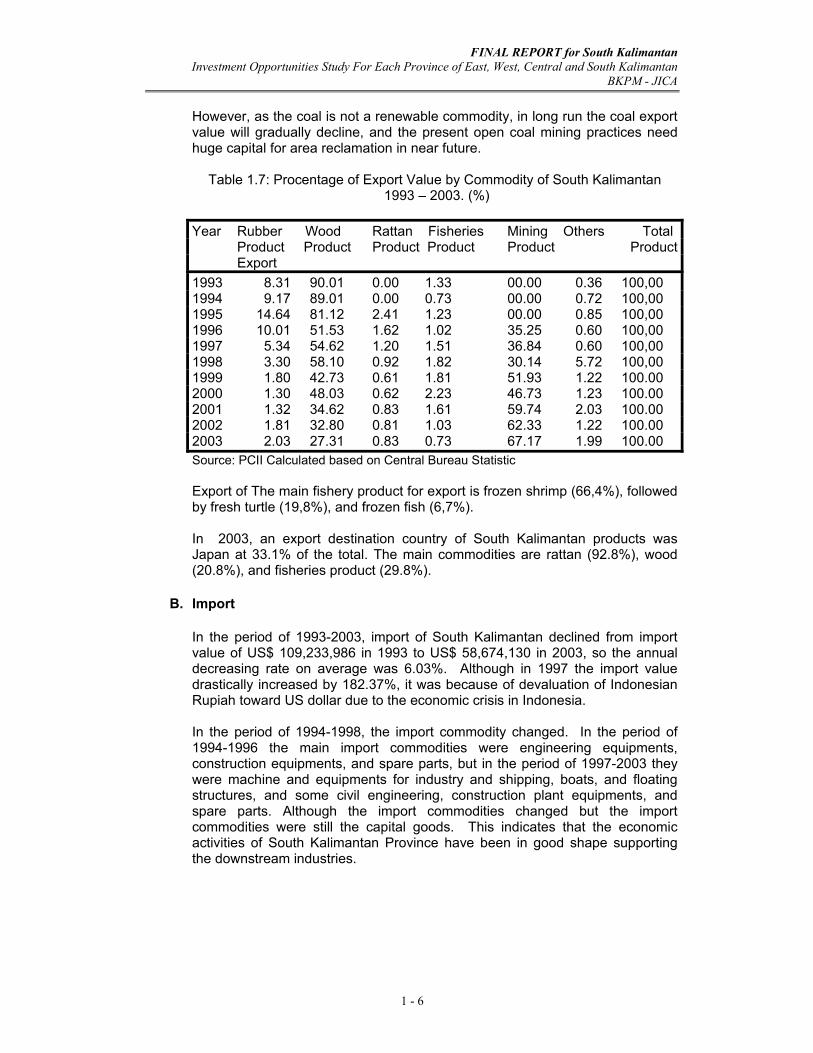
Rubber, wood product, rattan, fisheries products, mining products are the main exporting commodities of South Kalimantan. Table 1.7 indicates that the rubber and wood products have declining trends while the mining product has increased. On the other hand, rattan and fisheries have been more or less in stable condition. It is required to promote alternatives industry of wood product and rubber in the future. As one of the alternatives, oil palm commodity is expected to be developed, but at the moment the South Kalimantan palm oil (CPO) just has a function as raw material for cooking oil refinery in Java Island and North Sulawesi Province. A lack of downstream industry of CPO in South Kalimantan Province could affect the export value of South Kalimantan. Currently the coal mining is the main source to earn the foreign currency.
FINAL REPORT for South Kalimantan Investment Opportunities Study For Each Province of East, West, Central and South Kalimantan
BKPM - JICA
1 - 6
However, as the coal is not a renewable commodity, in long run the coal export value will gradually decline, and the present open coal mining practices need huge capital for area reclamation in near future.
Table 1.7: Procentage of Export Value by Commodity of South Kalimantan
1993 – 2003. (%)
Year Rubber Wood Rattan Fisheries Mining Others Total Product Product Product Product Product Product Export 1993 8.31 90.01 0.00 1.33 00.00 0.36 100,00 1994 9.17 89.01 0.00 0.73 00.00 0.72 100,00 1995 14.64 81.12 2.41 1.23 00.00 0.85 100,00 1996 10.01 51.53 1.62 1.02 35.25 0.60 100,00 1997 5.34 54.62 1.20 1.51 36.84 0.60 100,00 1998 3.30 58.10 0.92 1.82 30.14 5.72 100,00 1999 1.80 42.73 0.61 1.81 51.93 1.22 100.00 2000 1.30 48.03 0.62 2.23 46.73 1.23 100.00 2001 1.32 34.62 0.83 1.61 59.74 2.03 100.00 2002 1.81 32.80 0.81 1.03 62.33 1.22 100.00 2003 2.03 27.31 0.83 0.73 67.17 1.99 100.00 Source: PCII Calculated based on Central Bureau Statistic Export of The main fishery product for export is frozen shrimp (66,4%), followed by fresh turtle (19,8%), and frozen fish (6,7%). In 2003, an export destination country of South Kalimantan products was Japan at 33.1% of the total. The main commodities are rattan (92.8%), wood (20.8%), and fisheries product (29.8%).
B. Import
In the period of 1993-2003, import of South Kalimantan declined from import value of US$ 109,233,986 in 1993 to US$ 58,674,130 in 2003, so the annual decreasing rate on average was 6.03%. Although in 1997 the import value drastically increased by 182.37%, it was because of devaluation of Indonesian Rupiah toward US dollar due to the economic crisis in Indonesia. In the period of 1994-1998, the import commodity changed. In the period of 1994-1996 the main import commodities were engineering equipments, construction equipments, and spare parts, but in the period of 1997-2003 they were machine and equipments for industry and shipping, boats, and floating structures, and some civil engineering, construction plant equipments, and spare parts. Although the import commodities changed but the import commodities were still the capital goods. This indicates that the economic activities of South Kalimantan Province have been in good shape supporting the downstream industries.
FINAL REPORT for South Kalimantan Investment Opportunities Study For Each Province of East, West, Central and South Kalimantan
BKPM - JICA
1 - 7
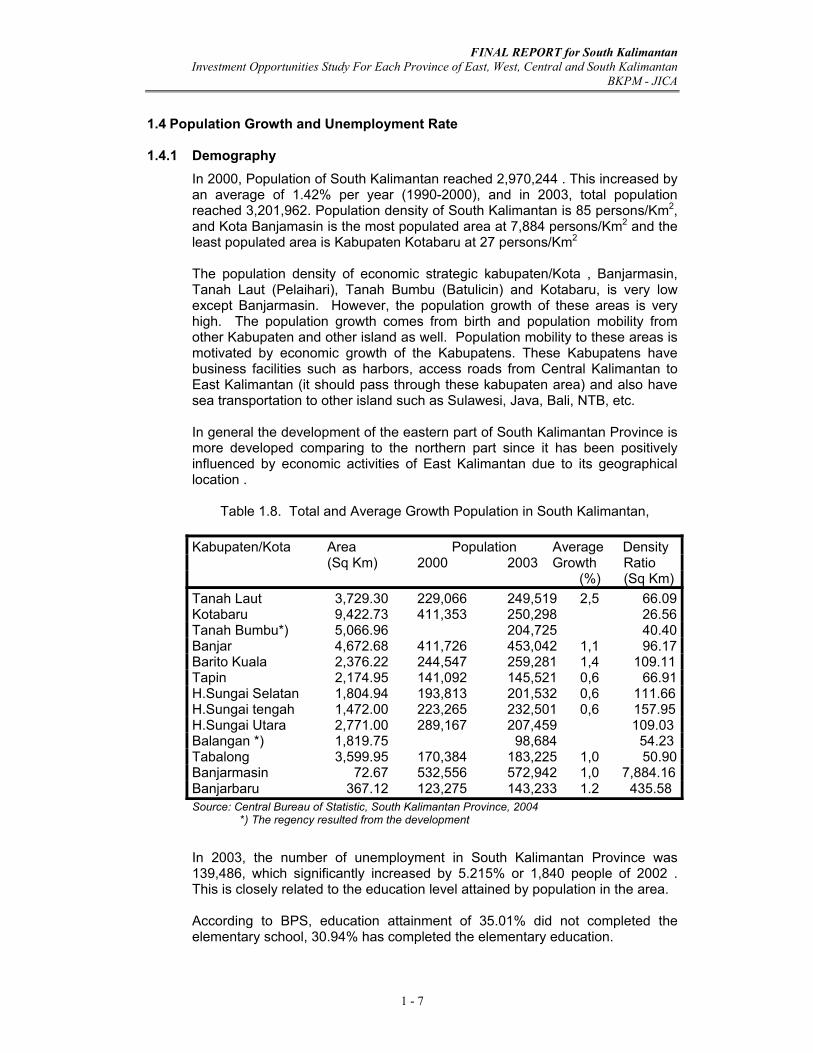
1.4 Population Growth and Unemployment Rate 1.4.1 Demography
In 2000, Population of South Kalimantan reached 2,970,244 . This increased by an average of 1.42% per year (1990-2000), and in 2003, total population reached 3,201,962. Population density of South Kalimantan is 85 persons/Km2, and Kota Banjamasin is the most populated area at 7,884 persons/Km2 and the least populated area is Kabupaten Kotabaru at 27 persons/Km2 The population density of economic strategic kabupaten/Kota , Banjarmasin, Tanah Laut (Pelaihari), Tanah Bumbu (Batulicin) and Kotabaru, is very low except Banjarmasin. However, the population growth of these areas is very high. The population growth comes from birth and population mobility from other Kabupaten and other island as well. Population mobility to these areas is motivated by economic growth of the Kabupatens. These Kabupatens have business facilities such as harbors, access roads from Central Kalimantan to East Kalimantan (it should pass through these kabupaten area) and also have sea transportation to other island such as Sulawesi, Java, Bali, NTB, etc. In general the development of the eastern part of South Kalimantan Province is more developed comparing to the northern part since it has been positively influenced by economic activities of East Kalimantan due to its geographical location .
Table 1.8. Total and Average Growth Population in South Kalimantan,
Kabupaten/Kota Area Population Average Density (Sq Km) 2000 2003 Growth Ratio (%) (Sq Km) Tanah Laut 3,729.30 229,066 249,519 2,5 66.09 Kotabaru 9,422.73 411,353 250,298 26.56 Tanah Bumbu*) 5,066.96 204,725 40.40 Banjar 4,672.68 411,726 453,042 1,1 96.17 Barito Kuala 2,376.22 244,547 259,281 1,4 109.11 Tapin 2,174.95 141,092 145,521 0,6 66.91 H.Sungai Selatan 1,804.94 193,813 201,532 0,6 111.66 H.Sungai tengah 1,472.00 223,265 232,501 0,6 157.95 H.Sungai Utara 2,771.00 289,167 207,459 109.03 Balangan *) 1,819.75 98,684 54.23 Tabalong 3,599.95 170,384 183,225 1,0 50.90 Banjarmasin 72.67 532,556 572,942 1,0 7,884.16 Banjarbaru 367.12 123,275 143,233 1.2 435.58
Source: Central Bureau of Statistic, South Kalimantan Province, 2004 *) The regency resulted from the development
In 2003, the number of unemployment in South Kalimantan Province was 139,486, which significantly increased by 5.215% or 1,840 people of 2002 . This is closely related to the education level attained by population in the area.
According to BPS, education attainment of 35.01% did not completed the elementary school, 30.94% has completed the elementary education.
FINAL REPORT for South Kalimantan Investment Opportunities Study For Each Province of East, West, Central and South Kalimantan
BKPM - JICA
1 - 8
For investment with high technology, the investors should have special effort to have training programs or recruit the labor from other region such as from Java or other islands. However, recruitment of labor from Java could local emotional of indigenous people of area. For Banjarmasin area, 45.4% of labor force have university graduate, so Kabupaten Banjar about 22.7% of labor force have university graduate level.
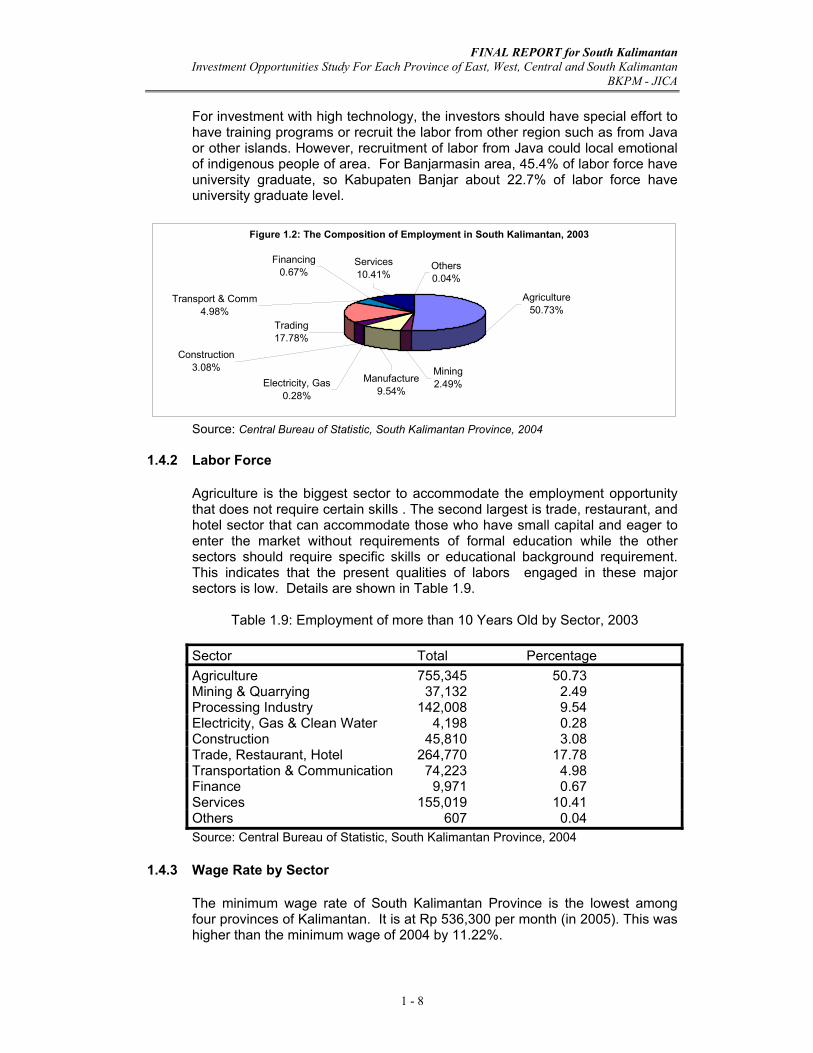
Figure 1.2: The Composition of Employment in South Kalimantan, 2003
Agriculture50.73%
Mining2.49%Electricity, Gas
0.28%
Manufacture9.54%
Construction3.08%
Trading17.78%
Transport & Comm4.98%
Financing0.67%
Services10.41%
Others0.04%
Source: Central Bureau of Statistic, South Kalimantan Province, 2004
1.4.2 Labor Force
Agriculture is the biggest sector to accommodate the employment opportunity that does not require certain skills . The second largest is trade, restaurant, and hotel sector that can accommodate those who have small capital and eager to enter the market without requirements of formal education while the other sectors should require specific skills or educational background requirement. This indicates that the present qualities of labors engaged in these major sectors is low. Details are shown in Table 1.9.
Table 1.9: Employment of more than 10 Years Old by Sector, 2003
Sector Total Percentage Agriculture 755,345 50.73 Mining & Quarrying 37,132 2.49 Processing Industry 142,008 9.54 Electricity, Gas & Clean Water 4,198 0.28 Construction 45,810 3.08 Trade, Restaurant, Hotel 264,770 17.78 Transportation & Communication 74,223 4.98 Finance 9,971 0.67 Services 155,019 10.41 Others 607 0.04 Source: Central Bureau of Statistic, South Kalimantan Province, 2004
1.4.3 Wage Rate by Sector
The minimum wage rate of South Kalimantan Province is the lowest among four provinces of Kalimantan. It is at Rp 536,300 per month (in 2005). This was higher than the minimum wage of 2004 by 11.22%.
FINAL REPORT for South Kalimantan Investment Opportunities Study For Each Province of East, West, Central and South Kalimantan
BKPM - JICA
1 - 9
In addition to the general basis of minimum wage, the Governor of South Kalimantan has issued the minimum wage by sector basis through its decree No.059/2004. Sectoral minimum wages per month are as follows: Bank sector :Rp.550,000 per month Cement and Coal / oil sector :Rp.545,000 per month Livestock, Food industry, “jamu” industry/Home Industry, spare-part, repair and Maintenance :less than Rp.545,000/
month. Daily wages based on working day greatly depend upon the season and place. In this study, they are estimated as follow: 1. Semiskilled for construction works :Rp.50,000 per day 2. Semiskilled for agriculture works :Rp.35,000 per day 3. Semiskilled for operators :Rp.40,000 per day 4 Skilled artisan (Gold / jewelry smith etc) :Rp.80,000 per day
1.5 Land Price in Major Kabupaten/Kota
Land market price of South Kalimantan significantly varies depending upon the locations and utilization plans. For instance in Banjarmasin city the land price at commercial area is Rp.4,500,000 – Rp.5,500,000 per m2. Indeed the land price in rural area is lower than that of Banjarmasin. Cost of HGU needed for plantation development is about Rp.100,000 per hectare consisting of two types of administrative cost (legal charge) and land acquisition cost that greatly depends upon the NJOP value (land property tax value). The land price of Kabupaten Tanah Laut (Pelaihari), Tanah Bumbu (Batulicin), and Kotabaru is much lower than that of Banjarmasin. It is estimated at about 15-25% of Banjarmasin land price.
1.6 Other Basic Economic and Industrial Indicators
South Kalimantan province has various natural resources and business infrastructures such as Bank. Currently in South Kalimantan 30 bank institutions are in operation, composed of 14 general banks and 26 BPRs (community credit bank). 4 of the 14 general banks are owned by Government, 1 is BPD (province development bank), and 9 are owned by national private companies that has 194 offices and 67 Bank Rakyat Indonesia (BRI) Unit. The number of ATM reached 117 units by June of 2004.
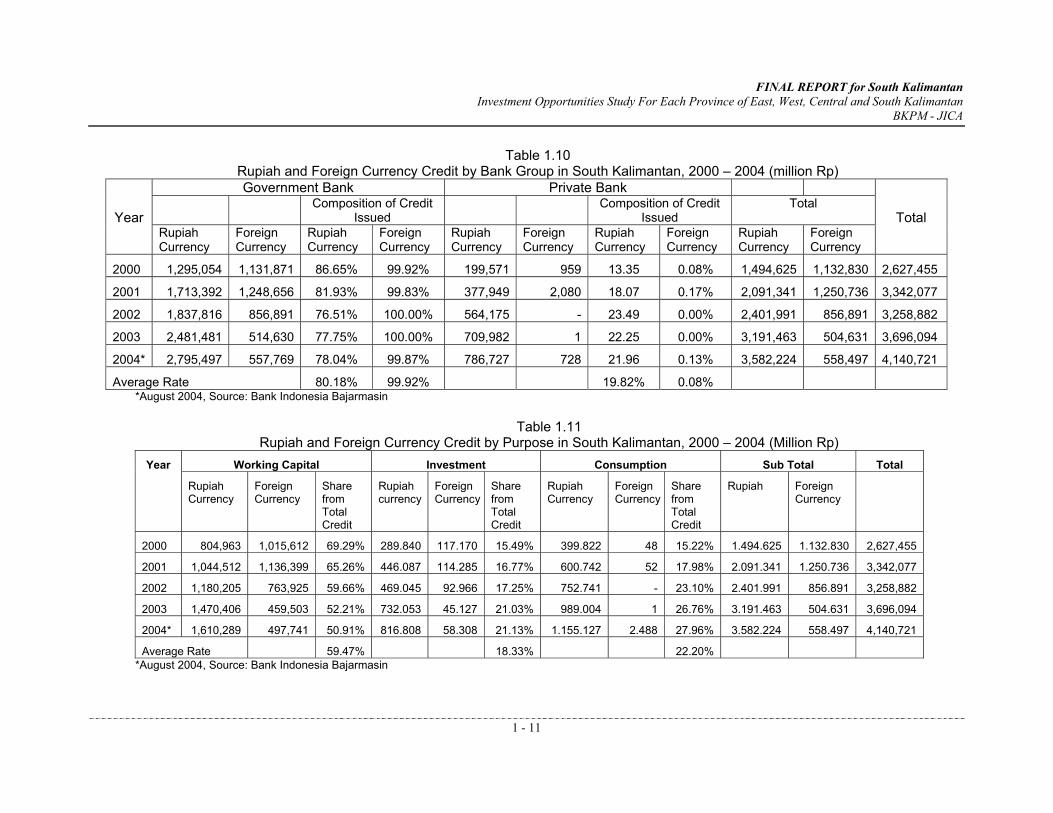
In quarter II – 2004, the total asset of banking system was Rp.7.62 trillion or increasing by 5.83% compared to previous period increasing by 0.6%. The community funds collected by banking system was Rp.6.86 trillion that increased by 6.18% compared to last period. This implies that communities came to recognize an improvement of the banking system and trust it. .The increase were from 10.93% clearing account (Giro) and 7.43% saving, while time deposit decreased by 32.35%. The decreases in the time deposit implies that real sector is under improving, it could be short-term investment such as trading. However, it is too early to have a conclusion of long-term investment improvement. Table 1.10 presents (quarter II-2004) the current credit portfolio (Rp.4.14) trillion increased by 12.03% compared to the last period. The incremental credit portfolio is allocated for sectors of mining, electricity, agriculture, and processing industry. This credit portfolio consists of ones issued by government own general, of this total 78.04% in Rupiah currency credit and 99.87% in foreign currency.
FINAL REPORT for South Kalimantan Investment Opportunities Study For Each Province of East, West, Central and South Kalimantan
BKPM - JICA
1 - 10
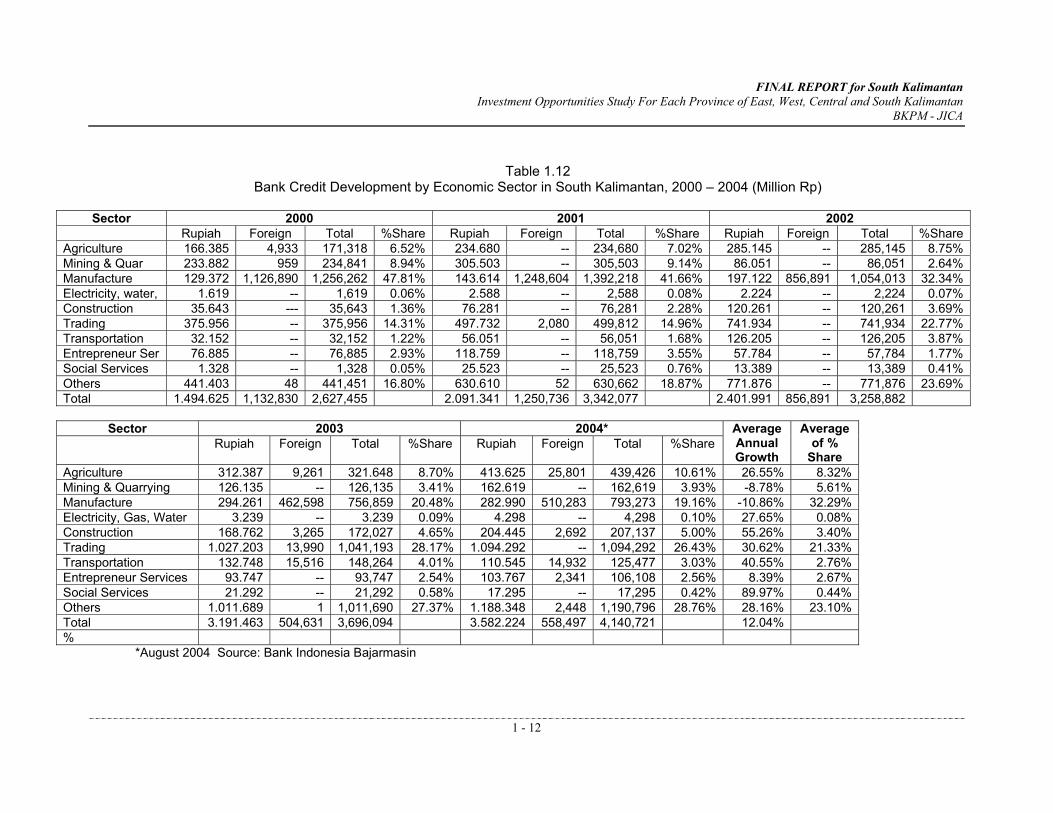
This indicates that the Government owned banks are still dominant in providing capital for South Kalimantan. Based on credit purpose, 21.13% is for investment, 50.91% is for working capital, and 27.96% is for consumption. According to Bank Indonesia Banjarmasin, the Loan to Deposit Ratio (LDR) based on project sites is 93.92% while it is 86.79% based on bank location. This is because business credit from Banks located outside of South Kalimantan have allocated the credit portfolio for projects operating in South Kalimantan. Most cases are found in Kabupaten Kotabaru Table 1.12 indicates that almost all sectors have annual growth in credit with more than two digits except manufacture and mining sector. It is assumed that the mining sector has been under production stage so no credit has been required. On the other hadn, manufacture sector, which is dominated by wood industry, has decreased due to insufficient log supply. However, in the last four years the credit portfolio for manicuring sector tends to increase with average 32.29% of the total credit followed by other sector (23.10%) and trading sector, hotel and restaurant (21.39%). It is said that since ancient times Banjar ethnic has been involved in business trading not only in domestic but also overseas especially to Middle East. A number of artisan products of Martapura have been sent to Saudi Arabia and its surrounding countries. Gold, jewel, and diamond made by Banjares are well known in Middle East. Capitals for artisan businesses are established by their own family business system; however, after the independence period they try to get acquaintance to the formal bank system. The essential is that they have a long experience in managing the family business, probably since the Dutch colonial period. This is an advantage of South Kalimantan that other three provinces do not have. Currently they probably lack technology to catch up the consumer’s demand. As basic economic factors of business, South Kalimantan has huge natural resources (coal, iron ore, diamond etc), skills in family business management, out of date technology especially in designing of products, and market in middle-east countries. Also in the 80’s, South Kalimantan experienced rubber and wood production boomso a number of rubber and wood industries were established along the Barito River
FINAL REPORT for South Kalimantan Investment Opportunities Study For Each Province of East, West, Central and South Kalimantan
BKPM - JICA
1 - 11
Table 1.10 Rupiah and Foreign Currency Credit by Bank Group in South Kalimantan, 2000 – 2004 (million Rp) Government Bank Private Bank
Composition of Credit Issued
Composition of Credit Issued
Total Year
Rupiah Currency
Foreign Currency
Rupiah Currency
Foreign Currency
Rupiah Currency
Foreign Currency
Rupiah Currency
Foreign Currency
Rupiah Currency
Foreign Currency
Total
2000 1,295,054 1,131,871 86.65% 99.92% 199,571 959 13.35 0.08% 1,494,625 1,132,830 2,627,455
2001 1,713,392 1,248,656 81.93% 99.83% 377,949 2,080 18.07 0.17% 2,091,341 1,250,736 3,342,077
2002 1,837,816 856,891 76.51% 100.00% 564,175 - 23.49 0.00% 2,401,991 856,891 3,258,882
2003 2,481,481 514,630 77.75% 100.00% 709,982 1 22.25 0.00% 3,191,463 504,631 3,696,094
2004* 2,795,497 557,769 78.04% 99.87% 786,727 728 21.96 0.13% 3,582,224 558,497 4,140,721
Average Rate 80.18% 99.92% 19.82% 0.08% *August 2004, Source: Bank Indonesia Bajarmasin
Table 1.11
Rupiah and Foreign Currency Credit by Purpose in South Kalimantan, 2000 – 2004 (Million Rp) Working Capital Investment Consumption Sub Total Total Year
Rupiah Currency
Foreign Currency
Share from Total Credit
Rupiah currency
Foreign Currency
Share from Total Credit
Rupiah Currency
Foreign Currency
Share from Total Credit
Rupiah Foreign Currency
2000 804,963 1,015,612 69.29% 289.840 117.170 15.49% 399.822 48 15.22% 1.494.625 1.132.830 2,627,455
2001 1,044,512 1,136,399 65.26% 446.087 114.285 16.77% 600.742 52 17.98% 2.091.341 1.250.736 3,342,077
2002 1,180,205 763,925 59.66% 469.045 92.966 17.25% 752.741 - 23.10% 2.401.991 856.891 3,258,882
2003 1,470,406 459,503 52.21% 732.053 45.127 21.03% 989.004 1 26.76% 3.191.463 504.631 3,696,094
2004* 1,610,289 497,741 50.91% 816.808 58.308 21.13% 1.155.127 2.488 27.96% 3.582.224 558.497 4,140,721
Average Rate 59.47% 18.33% 22.20% *August 2004, Source: Bank Indonesia Bajarmasin
FINAL REPORT for South Kalimantan Investment Opportunities Study For Each Province of East, West, Central and South Kalimantan
BKPM - JICA
1 - 12
Table 1.12
Bank Credit Development by Economic Sector in South Kalimantan, 2000 – 2004 (Million Rp)
Sector 2000 2001 2002 Rupiah Foreign Total %Share Rupiah Foreign Total %Share Rupiah Foreign Total %Share
Agriculture 166.385 4,933 171,318 6.52% 234.680 -- 234,680 7.02% 285.145 -- 285,145 8.75%Mining & Quar 233.882 959 234,841 8.94% 305.503 -- 305,503 9.14% 86.051 -- 86,051 2.64%Manufacture 129.372 1,126,890 1,256,262 47.81% 143.614 1,248,604 1,392,218 41.66% 197.122 856,891 1,054,013 32.34%Electricity, water, 1.619 -- 1,619 0.06% 2.588 -- 2,588 0.08% 2.224 -- 2,224 0.07%Construction 35.643 --- 35,643 1.36% 76.281 -- 76,281 2.28% 120.261 -- 120,261 3.69%Trading 375.956 -- 375,956 14.31% 497.732 2,080 499,812 14.96% 741.934 -- 741,934 22.77%Transportation 32.152 -- 32,152 1.22% 56.051 -- 56,051 1.68% 126.205 -- 126,205 3.87%Entrepreneur Ser 76.885 -- 76,885 2.93% 118.759 -- 118,759 3.55% 57.784 -- 57,784 1.77%Social Services 1.328 -- 1,328 0.05% 25.523 -- 25,523 0.76% 13.389 -- 13,389 0.41%Others 441.403 48 441,451 16.80% 630.610 52 630,662 18.87% 771.876 -- 771,876 23.69%Total 1.494.625 1,132,830 2,627,455 2.091.341 1,250,736 3,342,077 2.401.991 856,891 3,258,882
Sector 2003 2004*
Rupiah Foreign Total %Share Rupiah Foreign Total %Share Average Annual Growth
Average of %
Share Agriculture 312.387 9,261 321.648 8.70% 413.625 25,801 439,426 10.61% 26.55% 8.32%Mining & Quarrying 126.135 -- 126,135 3.41% 162.619 -- 162,619 3.93% -8.78% 5.61%Manufacture 294.261 462,598 756,859 20.48% 282.990 510,283 793,273 19.16% -10.86% 32.29%Electricity, Gas, Water 3.239 -- 3.239 0.09% 4.298 -- 4,298 0.10% 27.65% 0.08%Construction 168.762 3,265 172,027 4.65% 204.445 2,692 207,137 5.00% 55.26% 3.40%Trading 1.027.203 13,990 1,041,193 28.17% 1.094.292 -- 1,094,292 26.43% 30.62% 21.33%Transportation 132.748 15,516 148,264 4.01% 110.545 14,932 125,477 3.03% 40.55% 2.76%Entrepreneur Services 93.747 -- 93,747 2.54% 103.767 2,341 106,108 2.56% 8.39% 2.67%Social Services 21.292 -- 21,292 0.58% 17.295 -- 17,295 0.42% 89.97% 0.44%Others 1.011.689 1 1,011,690 27.37% 1.188.348 2,448 1,190,796 28.76% 28.16% 23.10%Total 3.191.463 504,631 3,696,094 3.582.224 558,497 4,140,721 12.04%%
*August 2004 Source: Bank Indonesia Bajarmasin
FINAL REPORT for South Kalimantan Investment Opportunities Study For Each Province of East, West, Central and South Kalimantan
BKPM - JICA
1 - 13
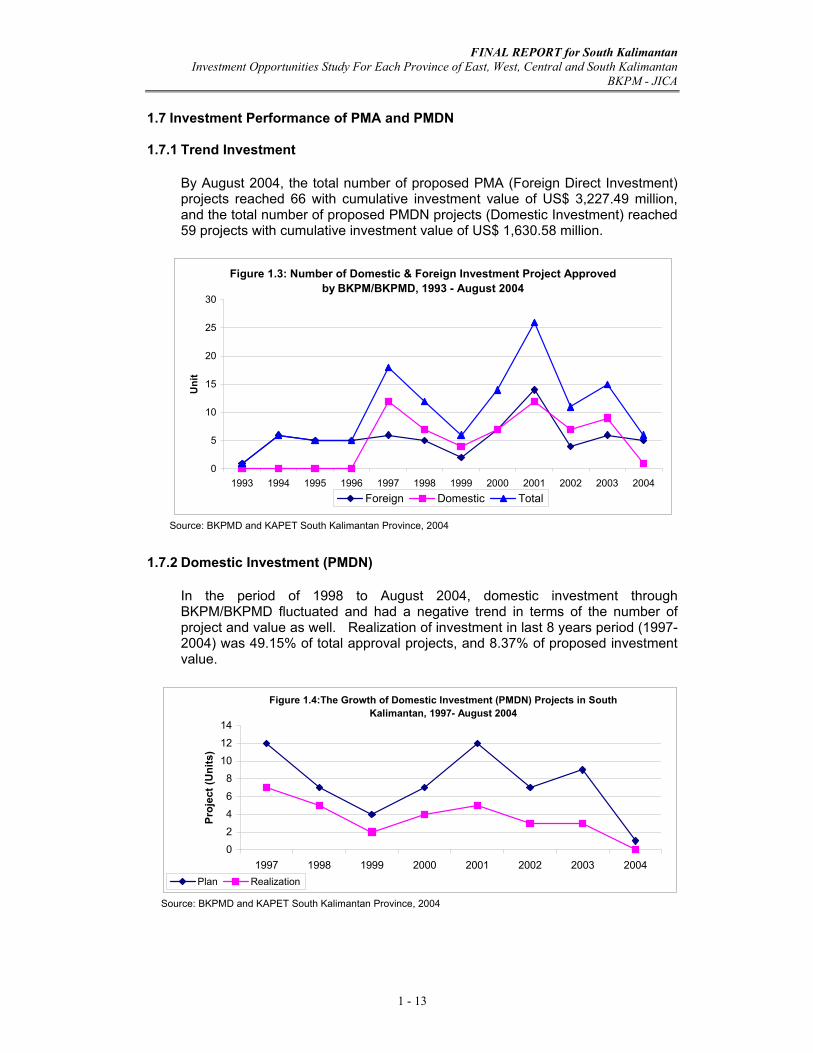
1.7 Investment Performance of PMA and PMDN 1.7.1 Trend Investment
By August 2004, the total number of proposed PMA (Foreign Direct Investment) projects reached 66 with cumulative investment value of US$ 3,227.49 million, and the total number of proposed PMDN projects (Domestic Investment) reached 59 projects with cumulative investment value of US$ 1,630.58 million.
Figure 1.3: Number of Domestic & Foreign Investment Project Approved by BKPM/BKPMD, 1993 - August 2004
0
5
10
15
20
25
30
1993 1994 1995 1996 1997 1998 1999 2000 2001 2002 2003 2004
Uni
t
Foreign Domestic Total
Source: BKPMD and KAPET South Kalimantan Province, 2004 1.7.2 Domestic Investment (PMDN)
In the period of 1998 to August 2004, domestic investment through BKPM/BKPMD fluctuated and had a negative trend in terms of the number of project and value as well. Realization of investment in last 8 years period (1997-2004) was 49.15% of total approval projects, and 8.37% of proposed investment value.
Figure 1.4:The Growth of Domestic Investment (PMDN) Projects in South Kalimantan, 1997- August 2004
0246
8101214
1997 1998 1999 2000 2001 2002 2003 2004
Proj
ect (
Uni
ts)
Plan Realization
Source: BKPMD and KAPET South Kalimantan Province, 2004
FINAL REPORT for South Kalimantan Investment Opportunities Study For Each Province of East, West, Central and South Kalimantan
BKPM - JICA
1 - 14
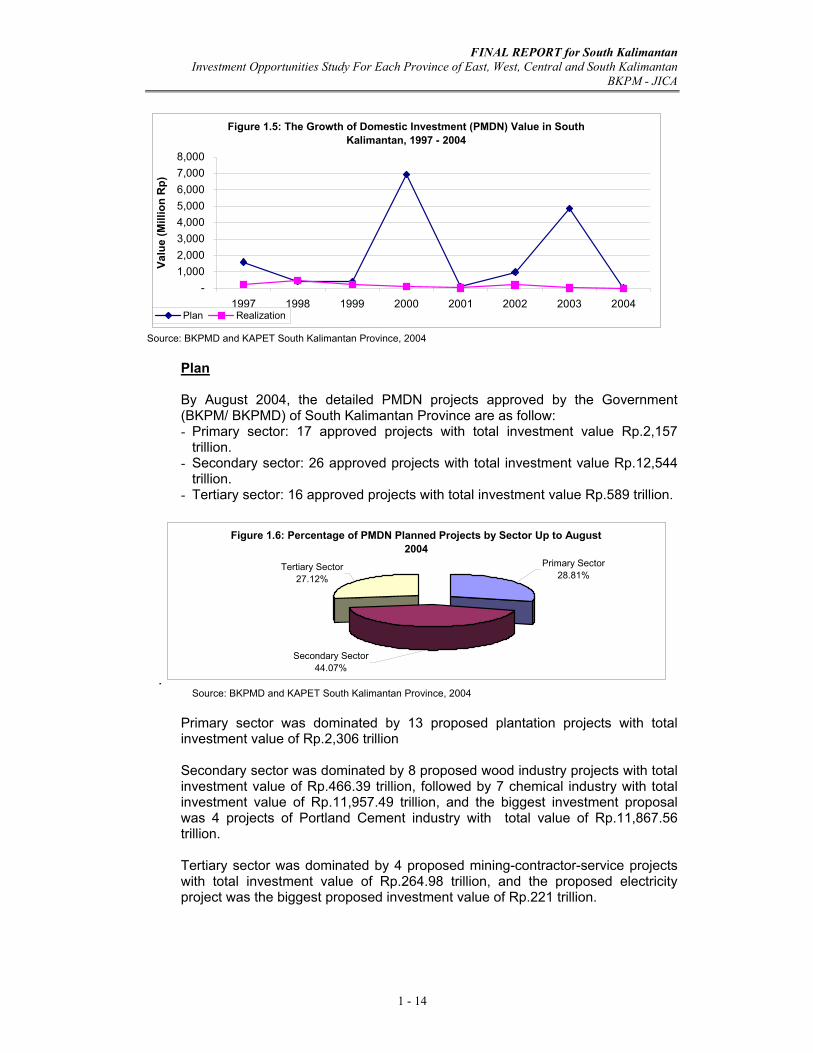
Figure 1.5: The Growth of Domestic Investment (PMDN) Value in South Kalimantan, 1997 - 2004
-1,0002,0003,0004,0005,0006,0007,0008,000
1997 1998 1999 2000 2001 2002 2003 2004
Valu
e (M
illio
n R
p)
Plan Realization
Source: BKPMD and KAPET South Kalimantan Province, 2004
Plan
By August 2004, the detailed PMDN projects approved by the Government (BKPM/ BKPMD) of South Kalimantan Province are as follow: - Primary sector: 17 approved projects with total investment value Rp.2,157
trillion. - Secondary sector: 26 approved projects with total investment value Rp.12,544
trillion. - Tertiary sector: 16 approved projects with total investment value Rp.589 trillion.
.
Figure 1.6: Percentage of PMDN Planned Projects by Sector Up to August 2004
Primary Sector28.81%
Secondary Sector44.07%
Tertiary Sector27.12%
Source: BKPMD and KAPET South Kalimantan Province, 2004
Primary sector was dominated by 13 proposed plantation projects with total investment value of Rp.2,306 trillion Secondary sector was dominated by 8 proposed wood industry projects with total investment value of Rp.466.39 trillion, followed by 7 chemical industry with total investment value of Rp.11,957.49 trillion, and the biggest investment proposal was 4 projects of Portland Cement industry with total value of Rp.11,867.56 trillion. Tertiary sector was dominated by 4 proposed mining-contractor-service projects with total investment value of Rp.264.98 trillion, and the proposed electricity project was the biggest proposed investment value of Rp.221 trillion.
FINAL REPORT for South Kalimantan Investment Opportunities Study For Each Province of East, West, Central and South Kalimantan
BKPM - JICA
1 - 15
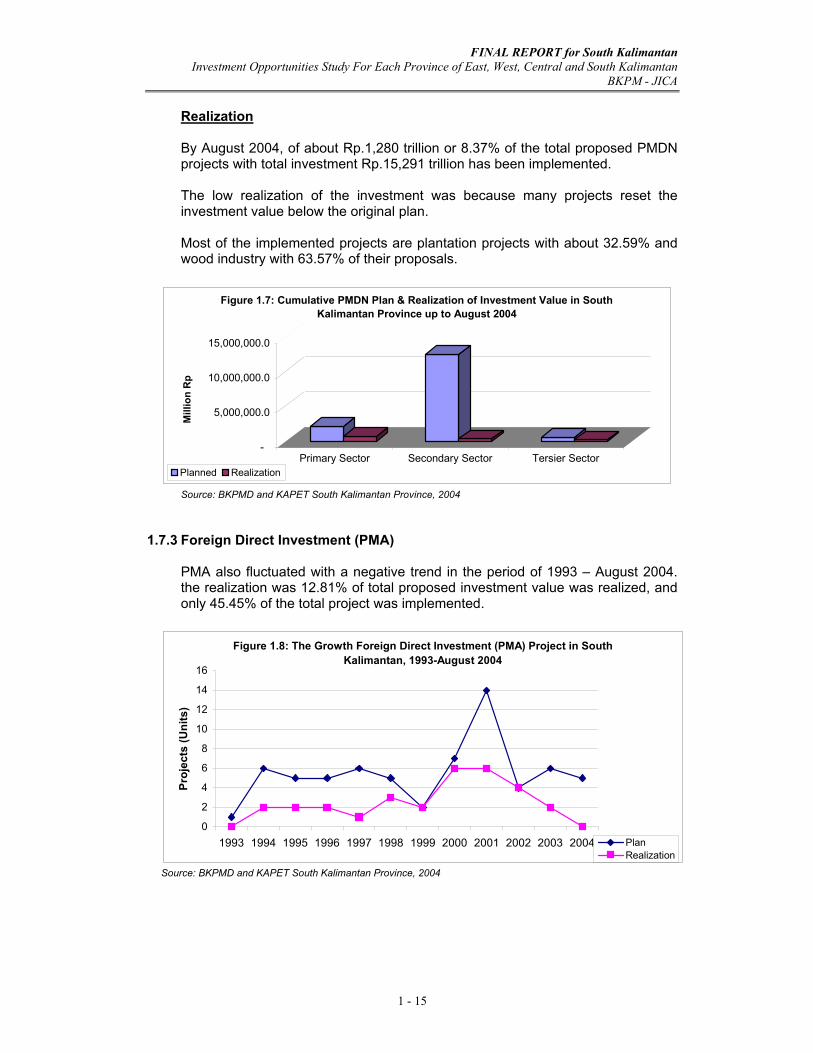
Realization By August 2004, of about Rp.1,280 trillion or 8.37% of the total proposed PMDN projects with total investment Rp.15,291 trillion has been implemented. The low realization of the investment was because many projects reset the investment value below the original plan. Most of the implemented projects are plantation projects with about 32.59% and wood industry with 63.57% of their proposals.
-
5,000,000.0
10,000,000.0
15,000,000.0
Mill
ion
Rp
Primary Sector Secondary Sector Tersier Sector
Figure 1.7: Cumulative PMDN Plan & Realization of Investment Value in South Kalimantan Province up to August 2004
Planned Realization
Source: BKPMD and KAPET South Kalimantan Province, 2004
1.7.3 Foreign Direct Investment (PMA)
PMA also fluctuated with a negative trend in the period of 1993 – August 2004. the realization was 12.81% of total proposed investment value was realized, and only 45.45% of the total project was implemented.
Figure 1.8: The Growth Foreign Direct Investment (PMA) Project in South Kalimantan, 1993-August 2004
0
2
4
6
8
10
12
14
16
1993 1994 1995 1996 1997 1998 1999 2000 2001 2002 2003 2004
Proj
ects
(Uni
ts)
PlanRealization
Source: BKPMD and KAPET South Kalimantan Province, 2004
FINAL REPORT for South Kalimantan Investment Opportunities Study For Each Province of East, West, Central and South Kalimantan
BKPM - JICA
1 - 16
Figure 1.9: The Growth of Foreign Direct Investment (PMA) Value in South Kalimantan, 1993- August 2004
-0.2000.4000.6000.8001.0001.2001.4001.6001.800
1993 1994 1995 1996 1997 1998 1999 2000 2001 2002 2003 2004
Val
ue (M
illio
n U
S$)
Plan Realization
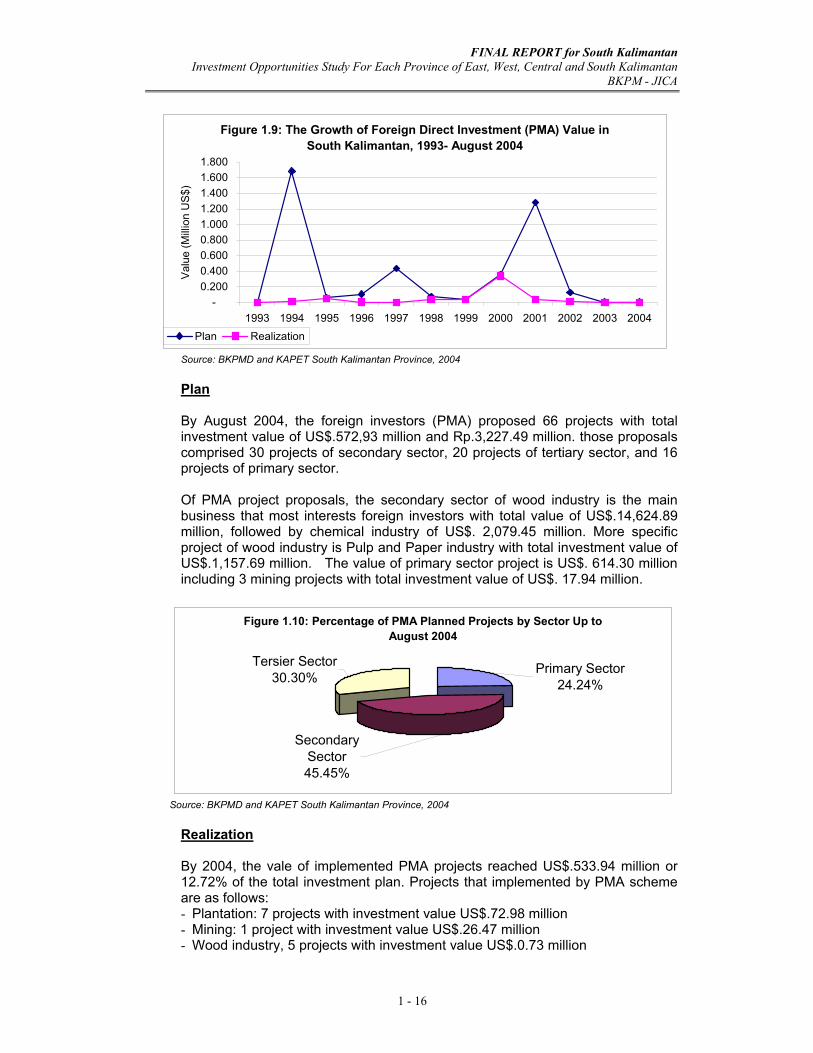
Source: BKPMD and KAPET South Kalimantan Province, 2004 Plan By August 2004, the foreign investors (PMA) proposed 66 projects with total investment value of US$.572,93 million and Rp.3,227.49 million. those proposals comprised 30 projects of secondary sector, 20 projects of tertiary sector, and 16 projects of primary sector. Of PMA project proposals, the secondary sector of wood industry is the main business that most interests foreign investors with total value of US$.14,624.89 million, followed by chemical industry of US$. 2,079.45 million. More specific project of wood industry is Pulp and Paper industry with total investment value of US$.1,157.69 million. The value of primary sector project is US$. 614.30 million including 3 mining projects with total investment value of US$. 17.94 million.
Figure 1.10: Percentage of PMA Planned Projects by Sector Up to August 2004
Tersier Sector30.30%
Secondary Sector45.45%
Primary Sector24.24%
Source: BKPMD and KAPET South Kalimantan Province, 2004
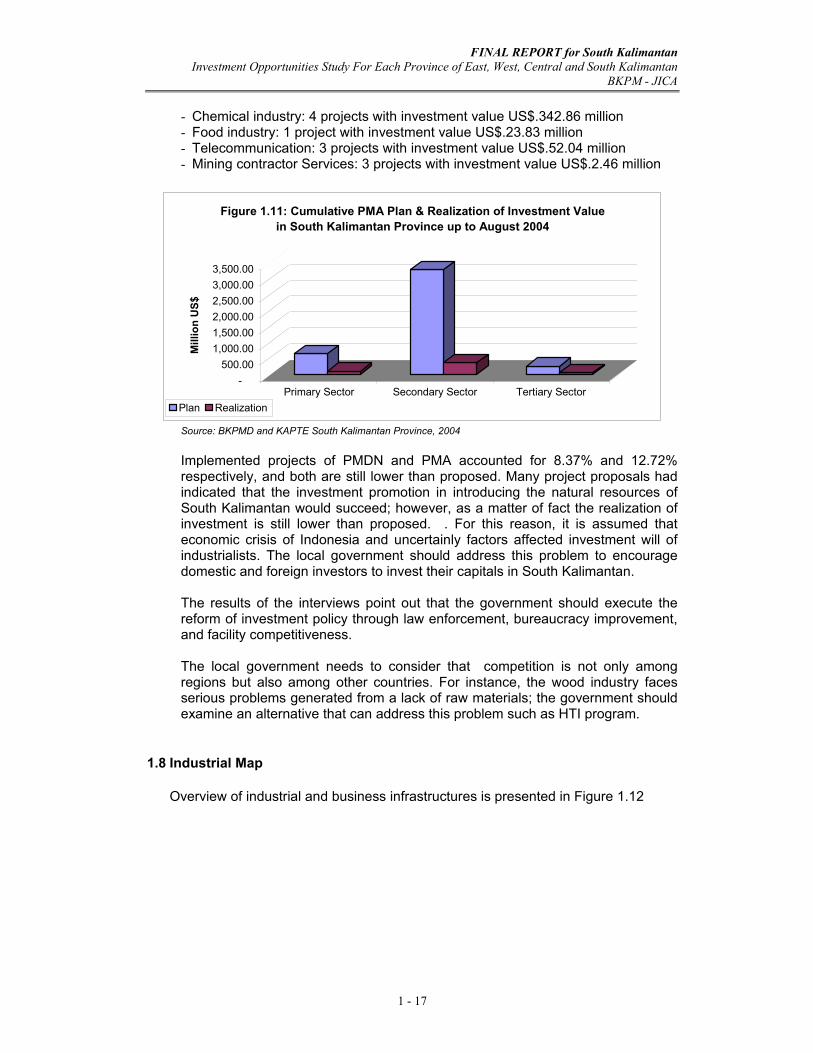
Realization By 2004, the vale of implemented PMA projects reached US$.533.94 million or 12.72% of the total investment plan. Projects that implemented by PMA scheme are as follows: - Plantation: 7 projects with investment value US$.72.98 million - Mining: 1 project with investment value US$.26.47 million - Wood industry, 5 projects with investment value US$.0.73 million
FINAL REPORT for South Kalimantan Investment Opportunities Study For Each Province of East, West, Central and South Kalimantan
BKPM - JICA
1 - 17
- Chemical industry: 4 projects with investment value US$.342.86 million - Food industry: 1 project with investment value US$.23.83 million - Telecommunication: 3 projects with investment value US$.52.04 million - Mining contractor Services: 3 projects with investment value US$.2.46 million
-500.00
1,000.001,500.002,000.002,500.003,000.003,500.00
Mill
ion
US$
Primary Sector Secondary Sector Tertiary Sector
Figure 1.11: Cumulative PMA Plan & Realization of Investment Value in South Kalimantan Province up to August 2004
Plan Realization
Source: BKPMD and KAPTE South Kalimantan Province, 2004 Implemented projects of PMDN and PMA accounted for 8.37% and 12.72% respectively, and both are still lower than proposed. Many project proposals had indicated that the investment promotion in introducing the natural resources of South Kalimantan would succeed; however, as a matter of fact the realization of investment is still lower than proposed. . For this reason, it is assumed that economic crisis of Indonesia and uncertainly factors affected investment will of industrialists. The local government should address this problem to encourage domestic and foreign investors to invest their capitals in South Kalimantan. The results of the interviews point out that the government should execute the reform of investment policy through law enforcement, bureaucracy improvement, and facility competitiveness. The local government needs to consider that competition is not only among regions but also among other countries. For instance, the wood industry faces serious problems generated from a lack of raw materials; the government should examine an alternative that can address this problem such as HTI program.
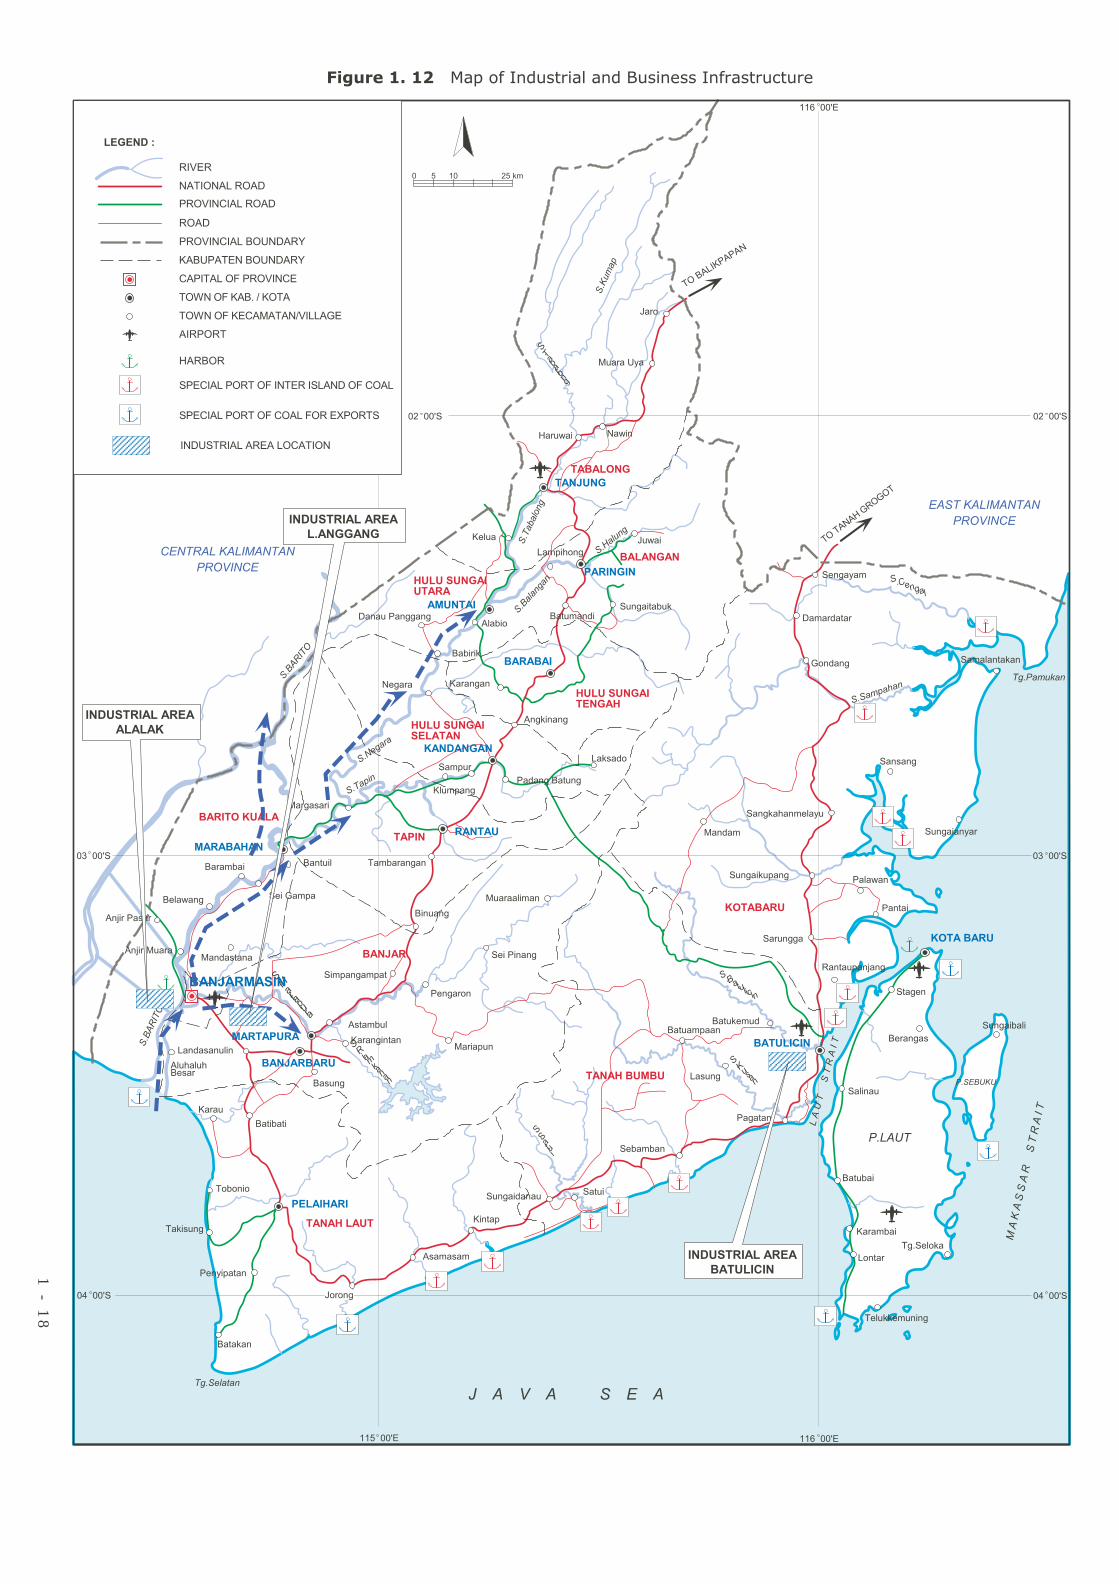
1.8 Industrial Map
Overview of industrial and business infrastructures is presented in Figure 1.12
��������� ���������
�������
���������
������
�������
������
�������
���� ����
�������
��������
�����
�������������
����
�������������������
������������������
�������������������
������������� �����
������������!���� �����"�
�������
����������������
�� ����
�������������
�� ����
� � �� � �� � �� � � � � � � � � � � � ��
��� ����
����������
�����
����
���
�������
� ���
����������
�����
����������
��
��� ��
��������
������
����
�������
������
�����
�����������
������
�����������������������������
���� ��!��
��"�����
���� ��!��
������
������
���
�����
������
���
����
����
������
� ����
�������
�#$%&%'(
�')*+�!,%+%
�')*+��%-%+
!%'.%-/%'%
�%+% 0%*
#*�"% 1%
�%'/,*$ �% 0%+%'(%'
!%+(%-%+*
�$, 1%'(
�#(%+%
�%'%,��%'((%'(
�%0*+*�
�*',%'(
* 1%'(% 1%/
�#'(%+2'
�-/% 0,$
�%+%'(*'/%'
�%/*0%/*
�%-,'(
32+2'(
�-% %-%
�#'4*1%/%'
�%/%�%'
�%'.%-%',$*'
�%+%,
�$,5%$,5�#-%+
6%+,&%*
�#$,%
�$%0*2
�*'/%1
,'(%*.%'%,
#*��*'%'(
!,%+%%$* %'
% 1,+
�'(�*'%'(
�%.%'(��%/,'(
�%+%'(%'
�%�-%.2
�%/, %'.*
�%&*'
!,%+%��4%
3%+2
�2'/%+
�(�#$2�%
�%(%/%'
�#+%'(%-
,'(%*�,1%'(
�%'/%*
�%�*-,'(
�202'*2
3,&%*
�% 1*52'(
,'(%*/%0,�
#0% 0%'
%/,*
�#$,��# ,'*'(
�%+% 0%*
�%/,0%*
�%/,% 1%%'
�%-,'(
%$*'%,
�%/,�# ,.
�%'/%,1%')%'(
�%$%&%'
%+,'((%
!%'.%
%'(�%5%' #$%4,
"2'.%'(
�% %+.%/%+
#'(%4%
/%(#'
,'(%*0%$*
,'(%*%'4%+
%'-%'(
% %$%'/%�%'
����������
�����##
����������
!%+*%1,'
����#�
��������
�����
�������6�"
��"��
�����
���������������
��������
���������
�����
������
6�����
����������������������������������
�������������������������7����
������
�������
��������$��
��������
����������
��#��������
���%��
�����������������������
������������������������ ������������������ ��� �� �
1 - 1
8
����������
��������
����������
���
����������
�������
CURRENT SITUATION AND FUTURE PROSPECT OF INFRASTRUCTURE
FINAL REPORT For South Kalimantan Investment Opportunities Study For Each province of East, West, Central and South Kalimantan
BKPM - JICA
2 - 1
CHAPTER 2
CURRENT SITUATION AND FUTURE PROSPECT OF INFRASTRUCTURE
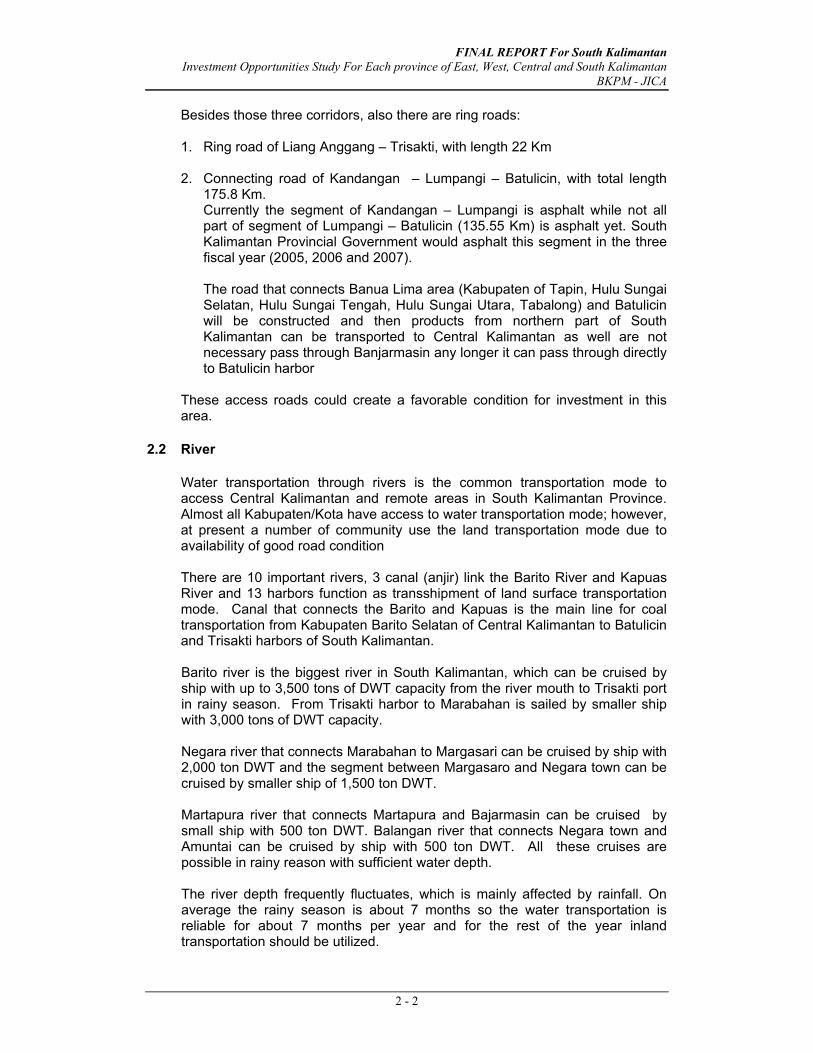
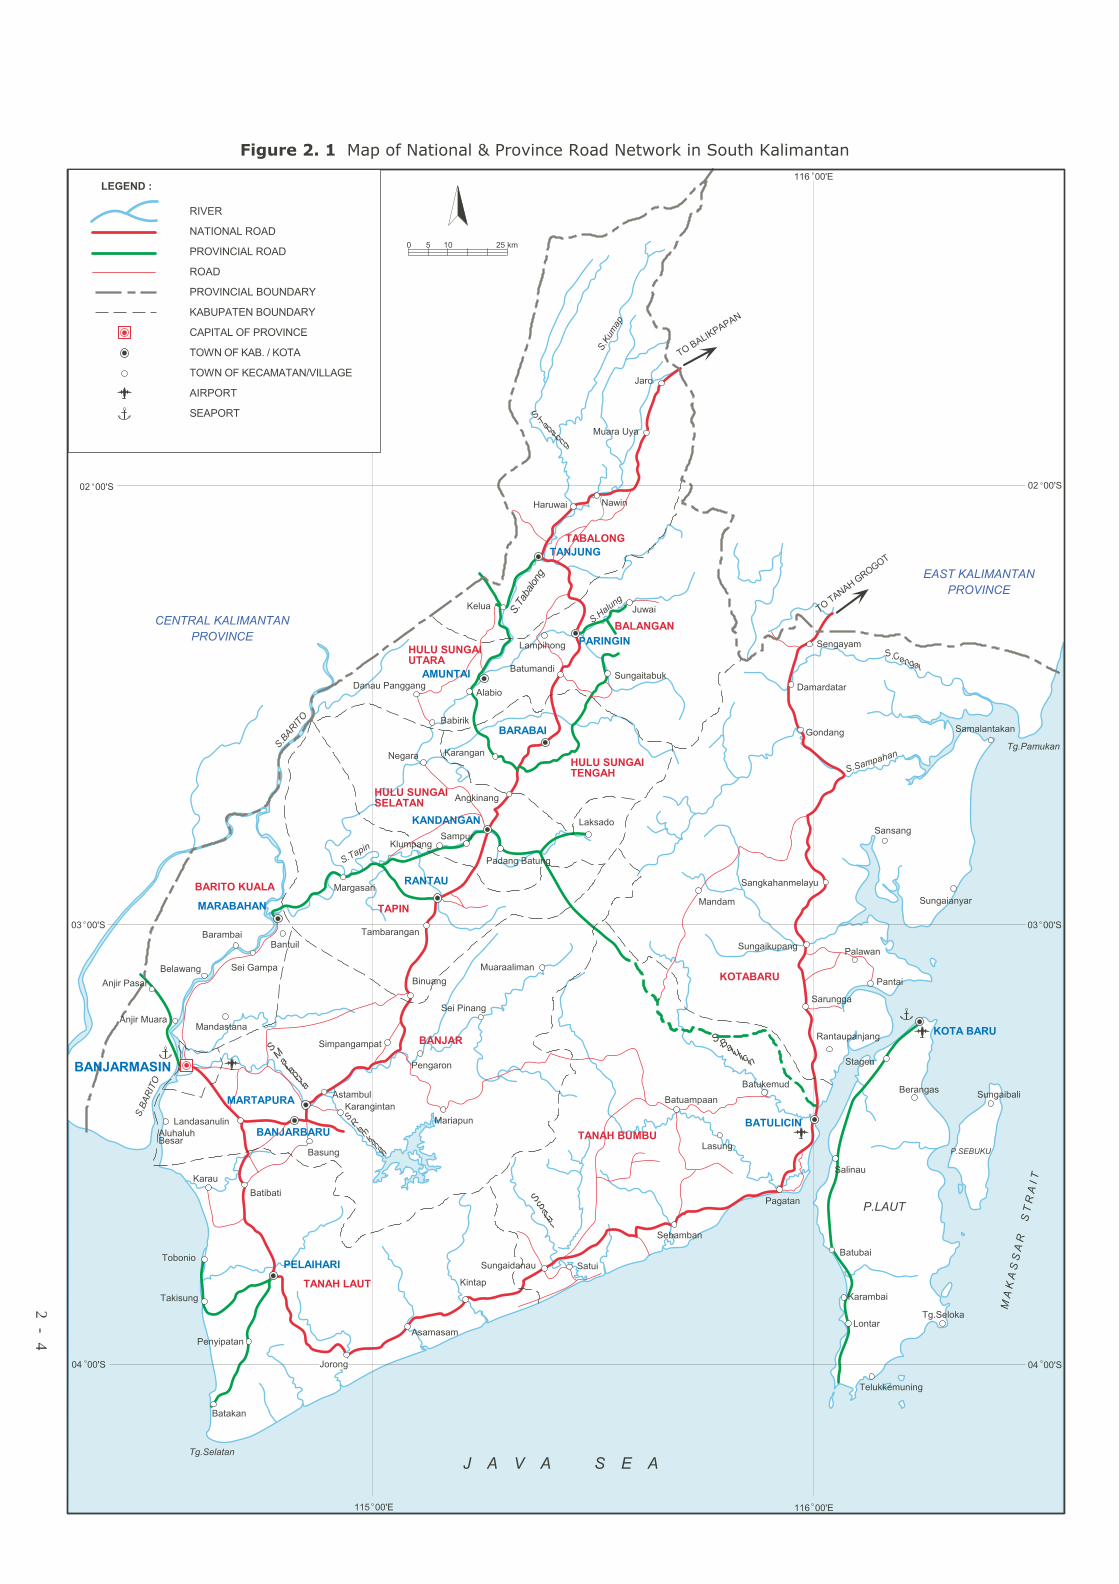
2.1 Road
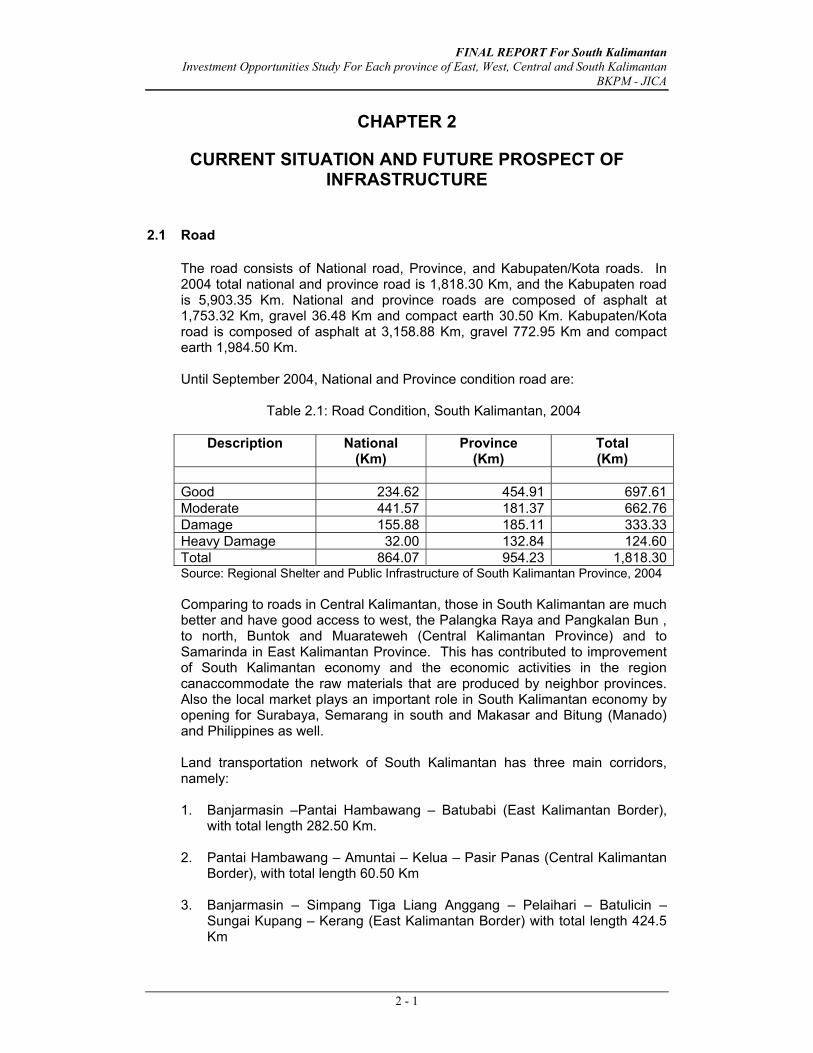
The road consists of National road, Province, and Kabupaten/Kota roads. In 2004 total national and province road is 1,818.30 Km, and the Kabupaten road is 5,903.35 Km. National and province roads are composed of asphalt at 1,753.32 Km, gravel 36.48 Km and compact earth 30.50 Km. Kabupaten/Kota road is composed of asphalt at 3,158.88 Km, gravel 772.95 Km and compact earth 1,984.50 Km. Until September 2004, National and Province condition road are:
Table 2.1: Road Condition, South Kalimantan, 2004
Description National (Km)
Province (Km)
Total (Km)
Good 234.62 454.91 697.61Moderate 441.57 181.37 662.76Damage 155.88 185.11 333.33Heavy Damage 32.00 132.84 124.60Total 864.07 954.23 1,818.30Source: Regional Shelter and Public Infrastructure of South Kalimantan Province, 2004 Comparing to roads in Central Kalimantan, those in South Kalimantan are much better and have good access to west, the Palangka Raya and Pangkalan Bun , to north, Buntok and Muarateweh (Central Kalimantan Province) and to Samarinda in East Kalimantan Province. This has contributed to improvement of South Kalimantan economy and the economic activities in the region canaccommodate the raw materials that are produced by neighbor provinces. Also the local market plays an important role in South Kalimantan economy by opening for Surabaya, Semarang in south and Makasar and Bitung (Manado) and Philippines as well. Land transportation network of South Kalimantan has three main corridors, namely:
1. Banjarmasin –Pantai Hambawang – Batubabi (East Kalimantan Border),
with total length 282.50 Km. 2. Pantai Hambawang – Amuntai – Kelua – Pasir Panas (Central Kalimantan
Border), with total length 60.50 Km
3. Banjarmasin – Simpang Tiga Liang Anggang – Pelaihari – Batulicin – Sungai Kupang – Kerang (East Kalimantan Border) with total length 424.5 Km
FINAL REPORT For South Kalimantan Investment Opportunities Study For Each province of East, West, Central and South Kalimantan
BKPM - JICA
2 - 2
Besides those three corridors, also there are ring roads: 1. Ring road of Liang Anggang – Trisakti, with length 22 Km
2. Connecting road of Kandangan – Lumpangi – Batulicin, with total length
175.8 Km. Currently the segment of Kandangan – Lumpangi is asphalt while not all part of segment of Lumpangi – Batulicin (135.55 Km) is asphalt yet. South Kalimantan Provincial Government would asphalt this segment in the three fiscal year (2005, 2006 and 2007). The road that connects Banua Lima area (Kabupaten of Tapin, Hulu Sungai Selatan, Hulu Sungai Tengah, Hulu Sungai Utara, Tabalong) and Batulicin will be constructed and then products from northern part of South Kalimantan can be transported to Central Kalimantan as well are not necessary pass through Banjarmasin any longer it can pass through directly to Batulicin harbor
These access roads could create a favorable condition for investment in this area.
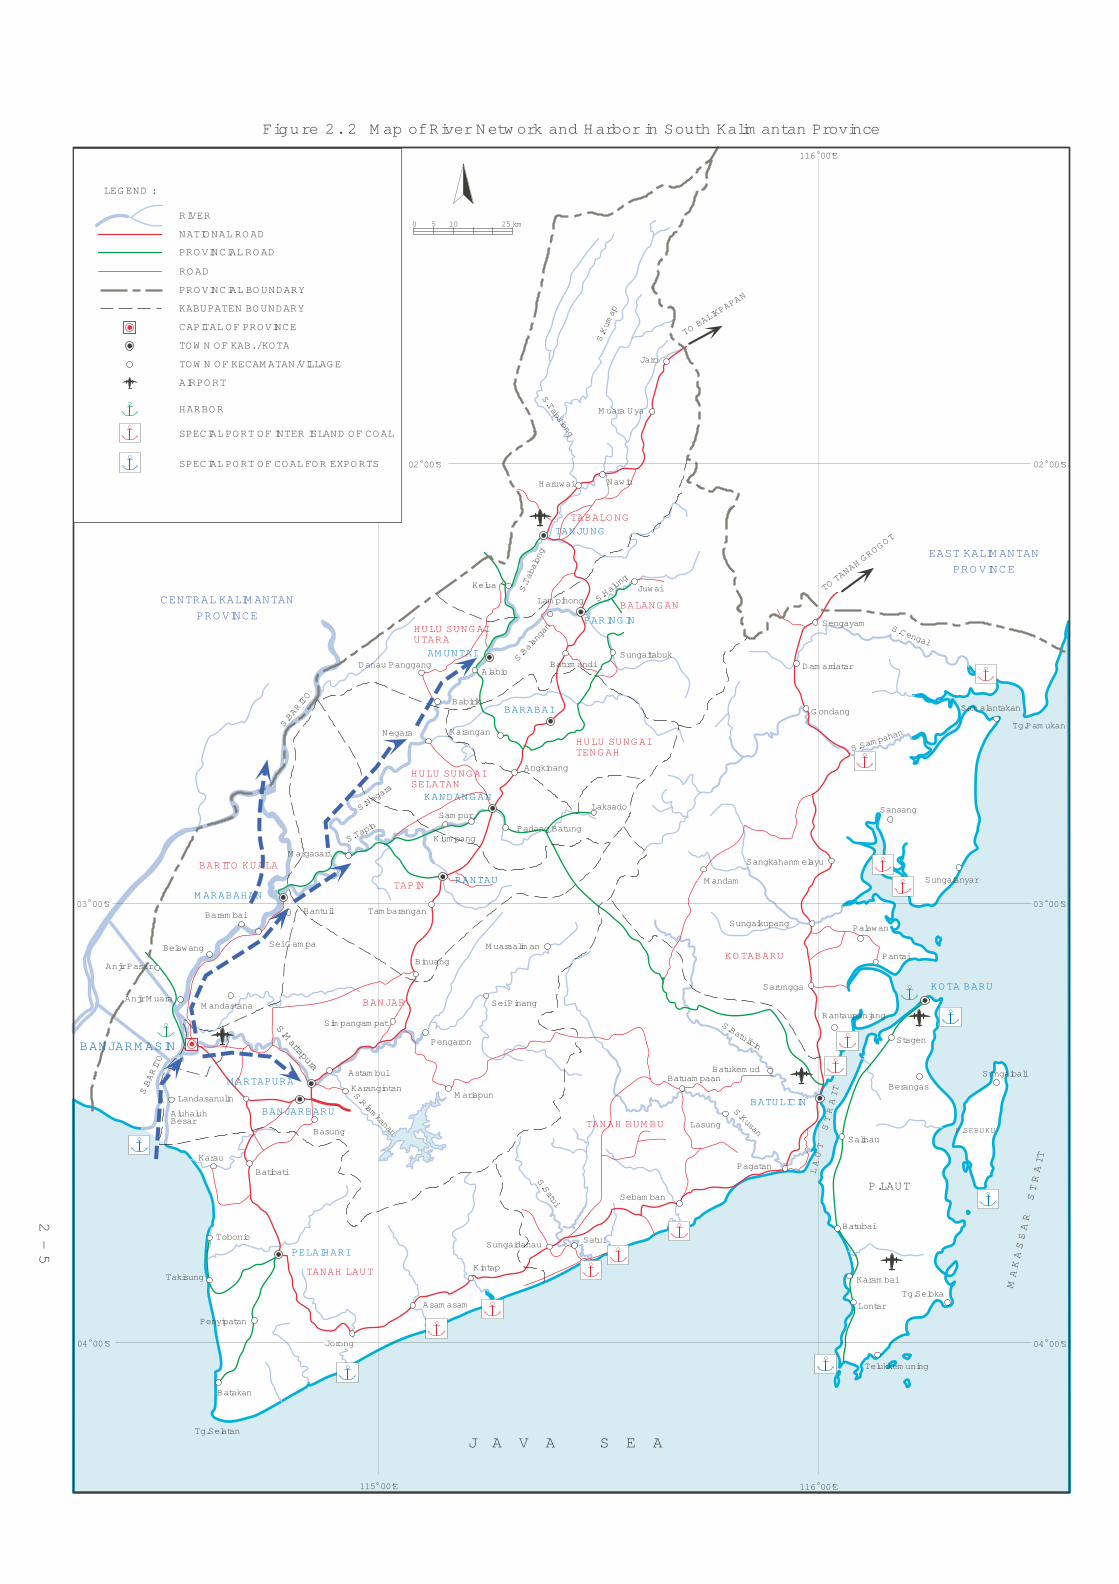
2.2 River
Water transportation through rivers is the common transportation mode to access Central Kalimantan and remote areas in South Kalimantan Province. Almost all Kabupaten/Kota have access to water transportation mode; however, at present a number of community use the land transportation mode due to availability of good road condition There are 10 important rivers, 3 canal (anjir) link the Barito River and Kapuas River and 13 harbors function as transshipment of land surface transportation mode. Canal that connects the Barito and Kapuas is the main line for coal transportation from Kabupaten Barito Selatan of Central Kalimantan to Batulicin and Trisakti harbors of South Kalimantan. Barito river is the biggest river in South Kalimantan, which can be cruised by ship with up to 3,500 tons of DWT capacity from the river mouth to Trisakti port in rainy season. From Trisakti harbor to Marabahan is sailed by smaller ship with 3,000 tons of DWT capacity. Negara river that connects Marabahan to Margasari can be cruised by ship with 2,000 ton DWT and the segment between Margasaro and Negara town can be cruised by smaller ship of 1,500 ton DWT. Martapura river that connects Martapura and Bajarmasin can be cruised by small ship with 500 ton DWT. Balangan river that connects Negara town and Amuntai can be cruised by ship with 500 ton DWT. All these cruises are possible in rainy reason with sufficient water depth. The river depth frequently fluctuates, which is mainly affected by rainfall. On average the rainy season is about 7 months so the water transportation is reliable for about 7 months per year and for the rest of the year inland transportation should be utilized.
FINAL REPORT For South Kalimantan Investment Opportunities Study For Each province of East, West, Central and South Kalimantan
BKPM - JICA
2 - 3
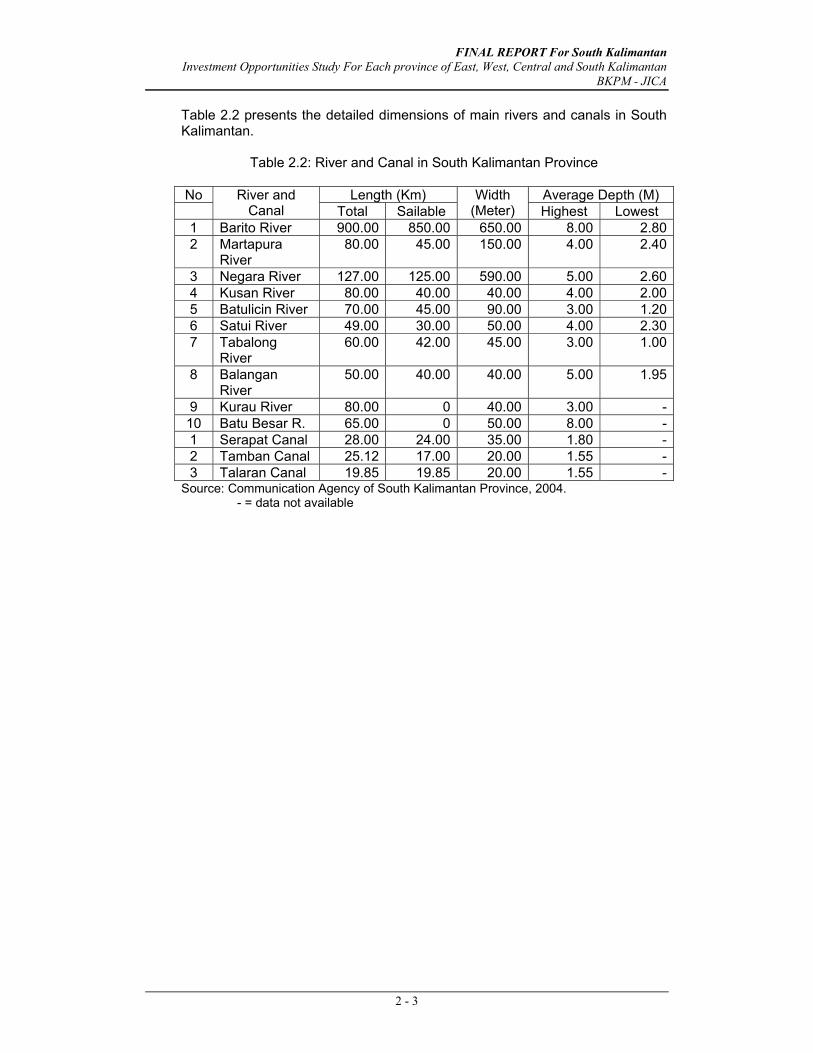
Table 2.2 presents the detailed dimensions of main rivers and canals in South Kalimantan.
Table 2.2: River and Canal in South Kalimantan Province
No Length (Km) Average Depth (M)
River and Canal Total Sailable
Width (Meter) Highest Lowest
1 Barito River 900.00 850.00 650.00 8.00 2.802 Martapura
River 80.00 45.00 150.00 4.00 2.40
3 Negara River 127.00 125.00 590.00 5.00 2.604 Kusan River 80.00 40.00 40.00 4.00 2.005 Batulicin River 70.00 45.00 90.00 3.00 1.206 Satui River 49.00 30.00 50.00 4.00 2.307 Tabalong
River 60.00 42.00 45.00 3.00 1.00
8 Balangan River
50.00 40.00 40.00 5.00 1.95
9 Kurau River 80.00 0 40.00 3.00 -10 Batu Besar R. 65.00 0 50.00 8.00 -1 Serapat Canal 28.00 24.00 35.00 1.80 -2 Tamban Canal 25.12 17.00 20.00 1.55 -3 Talaran Canal 19.85 19.85 20.00 1.55 -
Source: Communication Agency of South Kalimantan Province, 2004. - = data not available
��������� ���������
�������
���������
������
�������
������
�������
���� ����
�������
��������
�����
�������������
����
�������������������
������������������
�������������������
������������� �����
������������!���� �����"�
�������
������
����������������
�� ����
�������������
�� ����
� � �� � �� � �� � � � � � � � � � � � ��
��� ����
����������
�����
����
���
�������
� ���
����������
�����
����������
��
��� ��
��������
������
����
�������
������
�����
�����������
������
�����������������������������
���� ��!��
��"�����
���� ��!��
������
������
���
�����
������
���
����
����
������
� ����
�������
�#$%&%'(
�')*+�!,%+%
�')*+��%-%+
!%'.%-/%'%
�%+% 0%*
#*�"% 1%
�%'/,*$
�% 0%+%'(%'
!%+(%-%+*
�$, 1%'(
�#(%+%
�%'%,��%'((%'(
�%0*+*�
�*',%'(
* 1%'(% 1%/
�#'(%+2'
�-/% 0,$
�%+%'(*'/%'
�%/*0%/*
�%-,'(
32+2'(
�-% %-% �#'4*1%/%'
�%/%�%'
�%'.%-%',$*'
�%+%,
�$,5%$,5�#-%+
6%+,&%*
�#$,%
�$%0*2
�*'/%1
,'(%*.%'%,
#*��*'%'(
!,%+%%$* %'
% 1,+
�'(�*'%'(
�%.%'(��%/,'(
�%+%'(%'
�%�-%.2
�%/, %'.*
�%&*'
!,%+%��4%
3%+2
�2'/%+�(�#$2�%
�%(%/%'
�#+%'(%-
,'(%*�,1%'(
�%'/%*
�%�*-,'(
�202'*2
3,&%*
�% 1*52'(
,'(%*/%0,�
#0% 0%'
%/,*
�#$,��# ,'*'(
�%+% 0%*
�%/,0%*
�%/,% 1%%'
�%-,'(
%$*'%,
�%/,�# ,.
�%'/%,1%')%'(
�%$%&%'
%+,'((%
!%'.%
%'(�%5%' #$%4,
"2'.%'(
�% %+.%/%+
#'(%4%
/%(#'
,'(%*0%$*
,'(%*%'4%+
%'-%'(
% %$%'/%�%'
����������
�����##
����������
!%+*%1,'
����#�
��������
�����
�������6�"
��"��
�����
���������������
��������
���������
�����
������
������
�������
��������$��
��������������������������� ���������������������������������
2 - 4
115 00’E 116 00’E
02 00’S
116 00’E
04 00’S
03 00’S
04 00’S
03 00’S
25 km1050
02 00’S
LEG END :
RIVER
NATIONAL ROAD
ROAD
PROVINCIAL BOUNDARY
KABUPATEN BOUNDARY
CAPITAL OF PROVINCE
TOW N OF KAB. / KOTA
TOW N OF KECAM ATAN/VILLAGE
AIRPORT
CENTRAL KALIM ANTAN
PROVINCE
EAST KALIM ANTAN
PROVINCE
J A V A S E A
BARITO KUALA
HULU SUNG AISELATAN
TAPIN
BANJAR
TANAH LAUT
KOTABARU
HULU SUNG AITENG AH
HULU SUNG AIUTARA
TABALO NG
S.Cengal
S.Sam pa
han
S.Tapin
S.Riamkanan
S.Martapura
S.BARITO
M A K A S S A R S T R A I T
S.Tabalong
S.Halung
S.Tabalong
S.Kum
ap
TANJUNG
BARABAI
AM UNTAI
KANDANG AN
RANTAU
M ARABAHAN
M ARTAPURA
PELAIHARI
KOTA BARU
BANJARM ASIN
Belawang
Anjir M uara
Anjir Pasar
M andastana
Baram bai
Sei G am pa
Bantuil Tam barangan
M argasari
Klum pang
Negara
Danau Panggang
Babirik
Binuang
Sim pangam pat
Pengaron
Astam bul
Karangintan
Batibati
Basung
Jorong
Asam asam
Penyipatan
Batakan
Landasanulin
Karau
AluhaluhBesar
Haruwai
Kelua
Alabio
Kintap
Sungaidanau
Sei Pinang
M uaraalim an
Sam pur
Angkinang
Padang Batung
Karangan
Laksado
Batum andi
Nawin
M uara Uya
Jaro
Lontar
Tg.Seloka
Pagatan
Berangas
Sungaikupang
Pantai
Takisung
Tobonio
JuwaiLam pihong
Sungaitabuk
Sebam ban
Satui
Telukkem uning
Karam bai
Batubai
Batuam paan
Lasung
Salinau
Batukem ud
Rantaupanjang
Palawan
Sarungga
M andam
Sangkahanm elayu
Gondang
Dam ardatar
Sengayam
Stagen
Sungaibali
Sungaianyar
Sansang
Sam alantakan
Tg.Pam ukan
P.SEBUKU
Tg.Selatan
M ariapun
P.LAUT
TO BA
LIKPAPAN
TO TA
NAH GROG
OT
BANJARBARU
PROVINCIAL ROAD
BATULICIN
TANAH BUM BU
BALANG AN
PARING IN
HARBOR
SPECIAL PORT OF INTER ISLAND OF COAL
SPECIAL PORT OF COAL FOR EXPORTS
S.BARITO
S.Satui
S.Batulicin
S.Negara
S.Balangan
LAUT STRAIT
S.Kusan
Figure 2. 2 M ap of River Netw ork and Harbor in South Kalim antan Province
2 - 5
FINAL REPORT For South Kalimantan Investment Opportunities Study For Each province of East, West, Central and South Kalimantan
BKPM - JICA
2 - 6
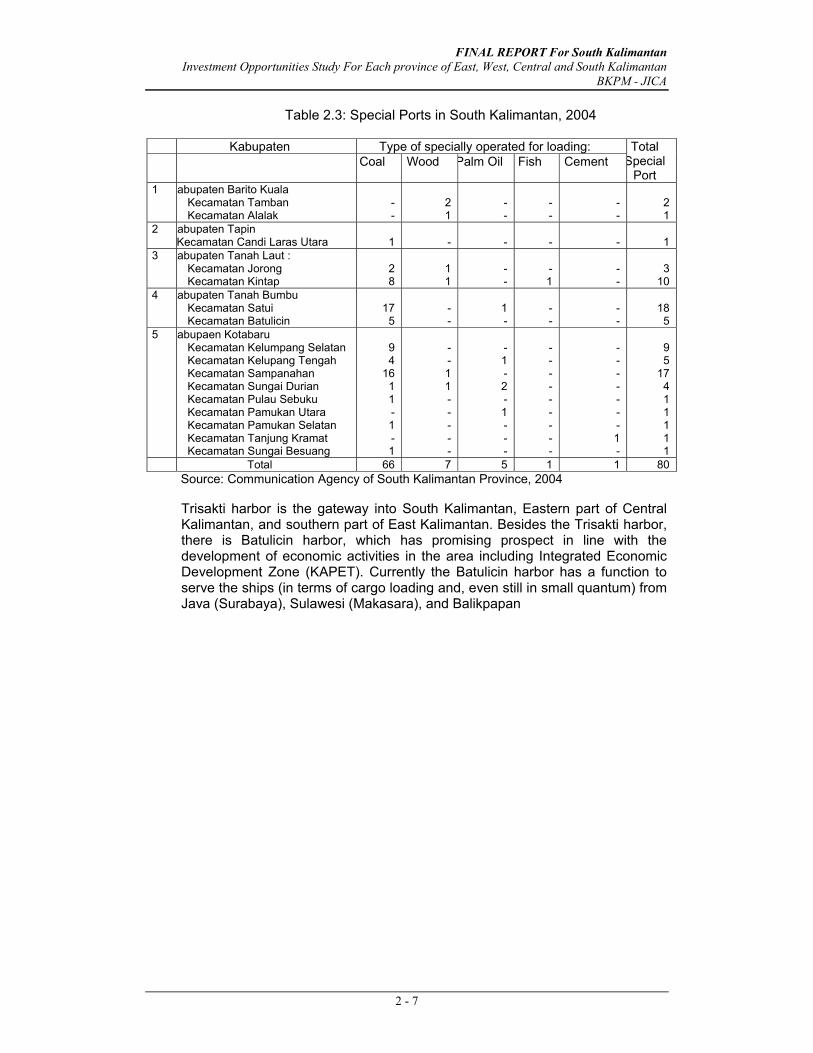
2.3 Harbor
South Kalimantan has some harbors: • The Trisakti Port
This is a main port, which serves the arrival and departure of passenger and cargo. This port benefits not only South Kalimantan Province but also Central Kalimantan Province. It serves both inter island and international shipment.
• The Old Martapura Port This port serves loading and unloading of cargo of the inter island shipping
• The New Martapura Port This port serves cargo of inter island shipping.
• The Kotabaru Port This port serves cargo loading and unloading of the inter island shipping.
• The Batulicin Port This port is intended to be a primary port because it is located in the Batulicin Integrated Economic Development Area (IEDZ or KAPET). The location of this port is very strategic because it is located in an international route of Makasar strait. It also has another advantage of deep sea. This port has a pier of 170-meter length and 10 meter width. It serves both inter island and international shipping of maximum 200,000 DWT, and also has docking facility.
• The Stagen Port This port serves loading and unloading of cargo of the inter island shipping (50,000 DWT)
• The Pagatan and Sungai Danau Local Port, • The Batulicin – Tanjung Serdang Ferry Terminal, and
• The special port:
There are many ports for special purpose such as for loading coal, wood/log, cement,p oil and fish. Details are presented in Table 2.3.
FINAL REPORT For South Kalimantan Investment Opportunities Study For Each province of East, West, Central and South Kalimantan
BKPM - JICA
2 - 7
Table 2.3: Special Ports in South Kalimantan, 2004
Kabupaten Type of specially operated for loading:
Coal Wood Palm Oil Fish Cement Total
Special Port
1 Kabupaten Barito Kuala Kecamatan Tamban Kecamatan Alalak
- -
2 1
- -
- -
- -
2 1
2 Kabupaten Tapin Kecamatan Candi Laras Utara
1
-
-
-
-
1
3 Kabupaten Tanah Laut : Kecamatan Jorong Kecamatan Kintap
2 8
1 1
- -
- 1
- -
3
10 4 Kabupaten Tanah Bumbu
Kecamatan Satui Kecamatan Batulicin
17 5
- -
1 -
- -
- -
18 5
5 Kabupaen Kotabaru Kecamatan Kelumpang Selatan Kecamatan Kelupang Tengah Kecamatan Sampanahan Kecamatan Sungai Durian Kecamatan Pulau Sebuku Kecamatan Pamukan Utara Kecamatan Pamukan Selatan Kecamatan Tanjung Kramat Kecamatan Sungai Besuang
9 4
16 1 1 - 1 - 1
- - 1 1 - - - - -
- 1 - 2 - 1 - - -
- - - - - - - - -
- - - - - - - 1 -
9 5
17 4 1 1 1 1 1
Total 66 7 5 1 1 80 Source: Communication Agency of South Kalimantan Province, 2004 Trisakti harbor is the gateway into South Kalimantan, Eastern part of Central Kalimantan, and southern part of East Kalimantan. Besides the Trisakti harbor, there is Batulicin harbor, which has promising prospect in line with the development of economic activities in the area including Integrated Economic Development Zone (KAPET). Currently the Batulicin harbor has a function to serve the ships (in terms of cargo loading and, even still in small quantum) from Java (Surabaya), Sulawesi (Makasara), and Balikpapan
FINAL REPORT For South Kalimantan Investment Opportunities Study For Each province of East, West, Central and South Kalimantan
BKPM - JICA
2 - 8
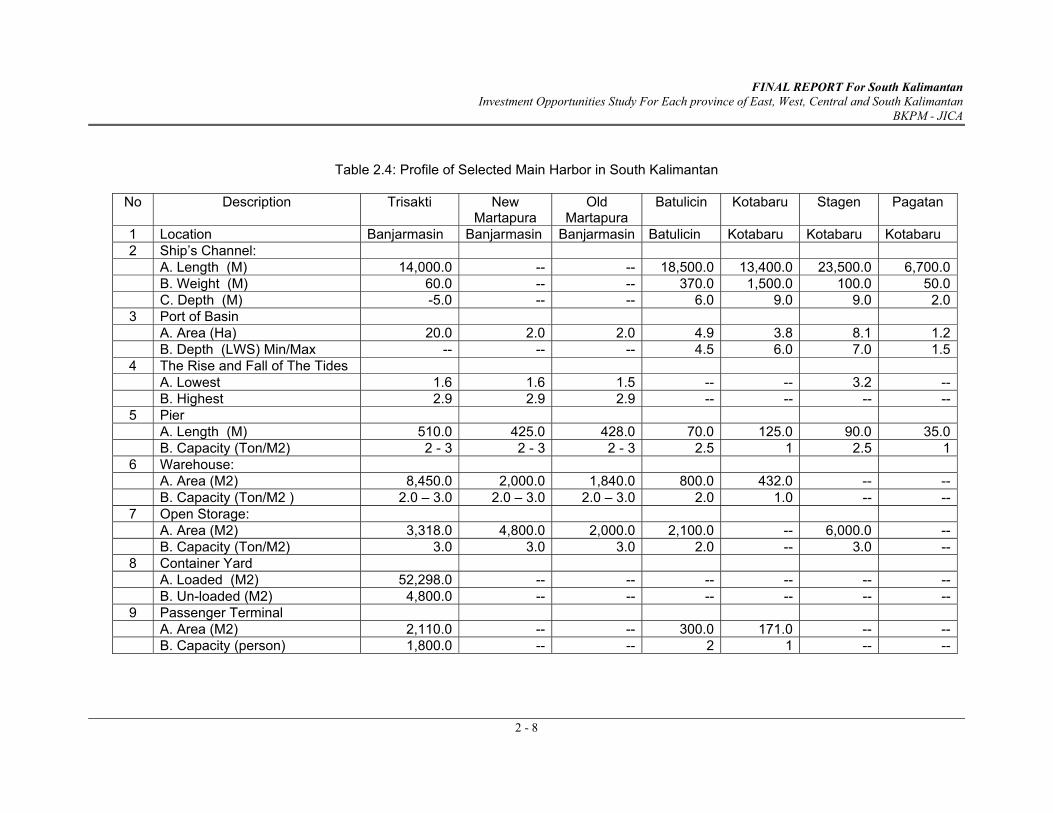
Table 2.4: Profile of Selected Main Harbor in South Kalimantan
No Description Trisakti New
Martapura Old
Martapura Batulicin Kotabaru Stagen Pagatan
1 Location Banjarmasin Banjarmasin Banjarmasin Batulicin Kotabaru Kotabaru Kotabaru 2 Ship’s Channel: A. Length (M) 14,000.0 -- -- 18,500.0 13,400.0 23,500.0 6,700.0 B. Weight (M) 60.0 -- -- 370.0 1,500.0 100.0 50.0 C. Depth (M) -5.0 -- -- 6.0 9.0 9.0 2.0
3 Port of Basin A. Area (Ha) 20.0 2.0 2.0 4.9 3.8 8.1 1.2 B. Depth (LWS) Min/Max -- -- -- 4.5 6.0 7.0 1.5
4 The Rise and Fall of The Tides A. Lowest 1.6 1.6 1.5 -- -- 3.2 -- B. Highest 2.9 2.9 2.9 -- -- -- --
5 Pier A. Length (M) 510.0 425.0 428.0 70.0 125.0 90.0 35.0
B. Capacity (Ton/M2) 2 - 3 2 - 3 2 - 3 2.5 1 2.5 16 Warehouse: A. Area (M2) 8,450.0 2,000.0 1,840.0 800.0 432.0 -- -- B. Capacity (Ton/M2 ) 2.0 – 3.0 2.0 – 3.0 2.0 – 3.0 2.0 1.0 -- --
7 Open Storage: A. Area (M2) 3,318.0 4,800.0 2,000.0 2,100.0 -- 6,000.0 -- B. Capacity (Ton/M2) 3.0 3.0 3.0 2.0 -- 3.0 --
8 Container Yard A. Loaded (M2) 52,298.0 -- -- -- -- -- -- B. Un-loaded (M2) 4,800.0 -- -- -- -- -- --
9 Passenger Terminal A. Area (M2) 2,110.0 -- -- 300.0 171.0 -- -- B. Capacity (person) 1,800.0 -- -- 2 1 -- --
FINAL REPORT For South Kalimantan Investment Opportunities Study For Each province of East, West, Central and South Kalimantan
BKPM - JICA
2 - 9
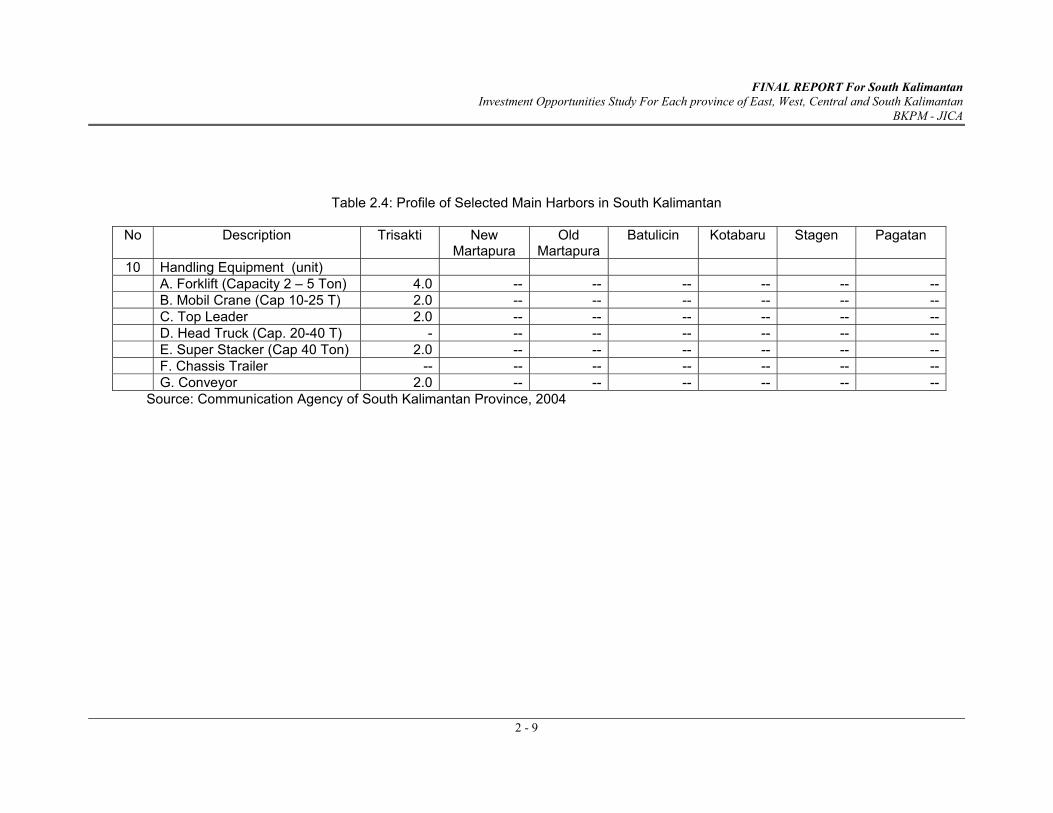
Table 2.4: Profile of Selected Main Harbors in South Kalimantan
No Description Trisakti New Martapura
Old Martapura
Batulicin Kotabaru Stagen Pagatan
10 Handling Equipment (unit) A. Forklift (Capacity 2 – 5 Ton) 4.0 -- -- -- -- -- -- B. Mobil Crane (Cap 10-25 T) 2.0 -- -- -- -- -- -- C. Top Leader 2.0 -- -- -- -- -- -- D. Head Truck (Cap. 20-40 T) - -- -- -- -- -- -- E. Super Stacker (Cap 40 Ton) 2.0 -- -- -- -- -- -- F. Chassis Trailer -- -- -- -- -- -- -- G. Conveyor 2.0 -- -- -- -- -- --
Source: Communication Agency of South Kalimantan Province, 2004
FINAL REPORT For South Kalimantan Investment Opportunities Study For Each province of East, West, Central and South Kalimantan
BKPM - JICA
2 - 10
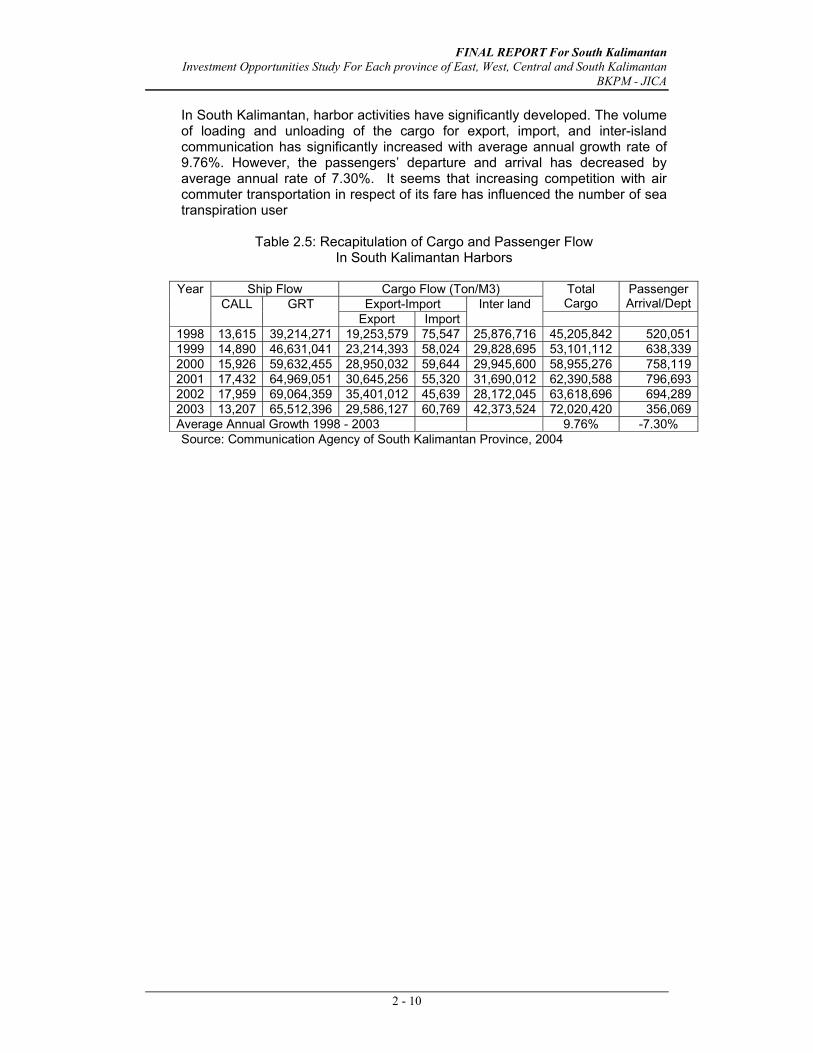
In South Kalimantan, harbor activities have significantly developed. The volume of loading and unloading of the cargo for export, import, and inter-island communication has significantly increased with average annual growth rate of 9.76%. However, the passengers’ departure and arrival has decreased by average annual rate of 7.30%. It seems that increasing competition with air commuter transportation in respect of its fare has influenced the number of sea transpiration user
Table 2.5: Recapitulation of Cargo and Passenger Flow In South Kalimantan Harbors
Ship Flow Cargo Flow (Ton/M3)
Export-Import Total Cargo
Passenger Arrival/Dept
Year CALL GRT
Export ImportInter land
1998 13,615 39,214,271 19,253,579 75,547 25,876,716 45,205,842 520,0511999 14,890 46,631,041 23,214,393 58,024 29,828,695 53,101,112 638,3392000 15,926 59,632,455 28,950,032 59,644 29,945,600 58,955,276 758,1192001 17,432 64,969,051 30,645,256 55,320 31,690,012 62,390,588 796,6932002 17,959 69,064,359 35,401,012 45,639 28,172,045 63,618,696 694,2892003 13,207 65,512,396 29,586,127 60,769 42,373,524 72,020,420 356,069Average Annual Growth 1998 - 2003 9.76% -7.30% Source: Communication Agency of South Kalimantan Province, 2004
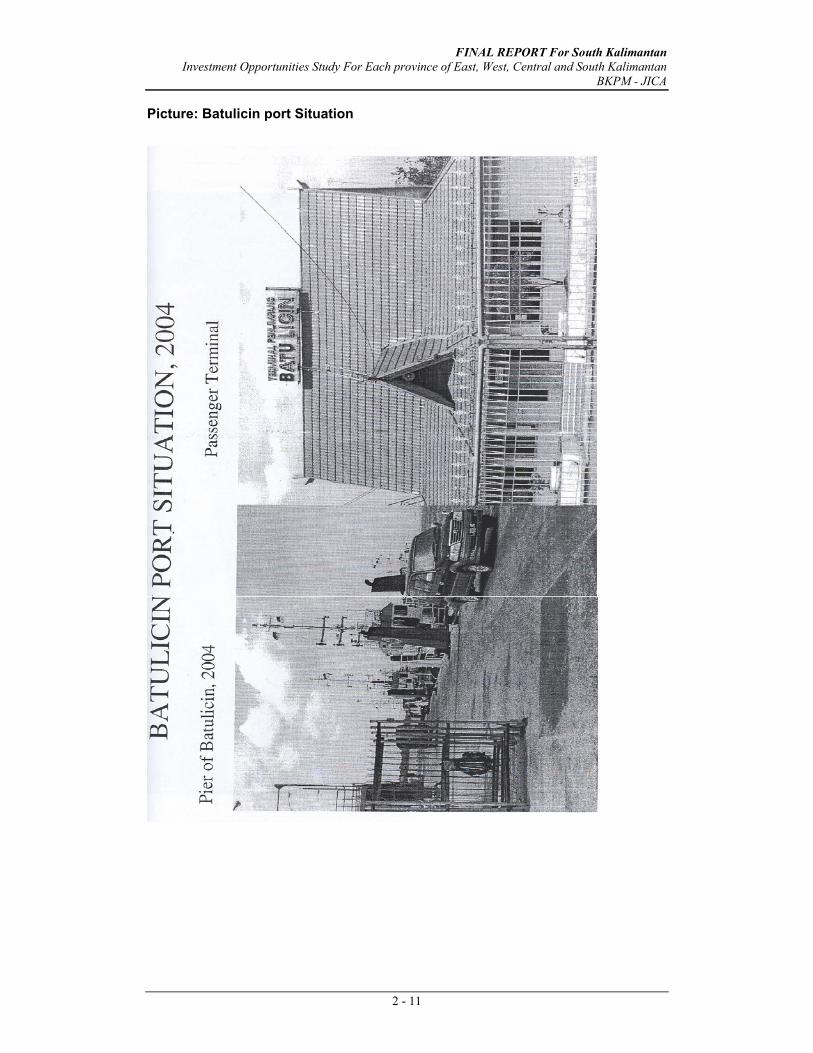
FINAL REPORT For South Kalimantan Investment Opportunities Study For Each province of East, West, Central and South Kalimantan
BKPM - JICA
2 - 11
Picture: Batulicin port Situation
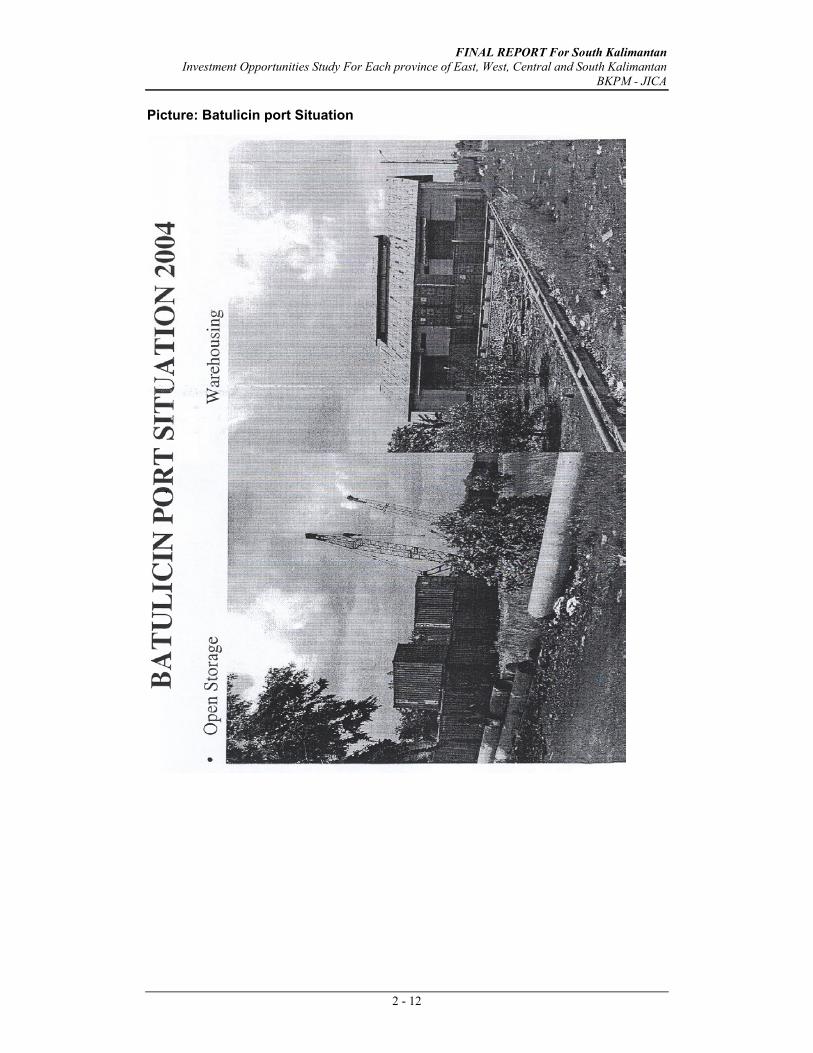
FINAL REPORT For South Kalimantan Investment Opportunities Study For Each province of East, West, Central and South Kalimantan
BKPM - JICA
2 - 12
Picture: Batulicin port Situation
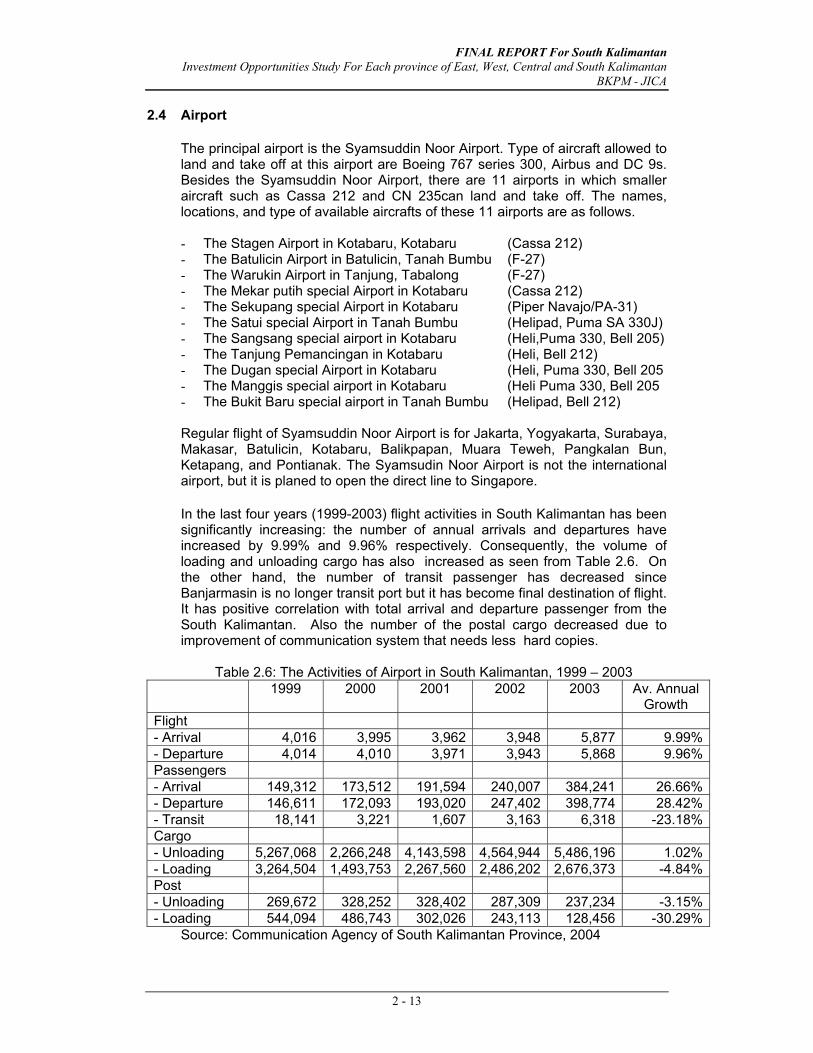
FINAL REPORT For South Kalimantan Investment Opportunities Study For Each province of East, West, Central and South Kalimantan
BKPM - JICA
2 - 13
2.4 Airport
The principal airport is the Syamsuddin Noor Airport. Type of aircraft allowed to land and take off at this airport are Boeing 767 series 300, Airbus and DC 9s. Besides the Syamsuddin Noor Airport, there are 11 airports in which smaller aircraft such as Cassa 212 and CN 235can land and take off. The names, locations, and type of available aircrafts of these 11 airports are as follows. - The Stagen Airport in Kotabaru, Kotabaru (Cassa 212) - The Batulicin Airport in Batulicin, Tanah Bumbu (F-27) - The Warukin Airport in Tanjung, Tabalong (F-27) - The Mekar putih special Airport in Kotabaru (Cassa 212) - The Sekupang special Airport in Kotabaru (Piper Navajo/PA-31) - The Satui special Airport in Tanah Bumbu (Helipad, Puma SA 330J) - The Sangsang special airport in Kotabaru (Heli,Puma 330, Bell 205) - The Tanjung Pemancingan in Kotabaru (Heli, Bell 212) - The Dugan special Airport in Kotabaru (Heli, Puma 330, Bell 205 - The Manggis special airport in Kotabaru (Heli Puma 330, Bell 205 - The Bukit Baru special airport in Tanah Bumbu (Helipad, Bell 212) Regular flight of Syamsuddin Noor Airport is for Jakarta, Yogyakarta, Surabaya, Makasar, Batulicin, Kotabaru, Balikpapan, Muara Teweh, Pangkalan Bun, Ketapang, and Pontianak. The Syamsudin Noor Airport is not the international airport, but it is planed to open the direct line to Singapore.
In the last four years (1999-2003) flight activities in South Kalimantan has been significantly increasing: the number of annual arrivals and departures have increased by 9.99% and 9.96% respectively. Consequently, the volume of loading and unloading cargo has also increased as seen from Table 2.6. On the other hand, the number of transit passenger has decreased since Banjarmasin is no longer transit port but it has become final destination of flight. It has positive correlation with total arrival and departure passenger from the South Kalimantan. Also the number of the postal cargo decreased due to improvement of communication system that needs less hard copies.
Table 2.6: The Activities of Airport in South Kalimantan, 1999 – 2003 1999 2000 2001 2002 2003 Av. Annual
Growth Flight - Arrival 4,016 3,995 3,962 3,948 5,877 9.99%- Departure 4,014 4,010 3,971 3,943 5,868 9.96%Passengers - Arrival 149,312 173,512 191,594 240,007 384,241 26.66%- Departure 146,611 172,093 193,020 247,402 398,774 28.42%- Transit 18,141 3,221 1,607 3,163 6,318 -23.18%Cargo - Unloading 5,267,068 2,266,248 4,143,598 4,564,944 5,486,196 1.02%- Loading 3,264,504 1,493,753 2,267,560 2,486,202 2,676,373 -4.84%Post - Unloading 269,672 328,252 328,402 287,309 237,234 -3.15%- Loading 544,094 486,743 302,026 243,113 128,456 -30.29%
Source: Communication Agency of South Kalimantan Province, 2004
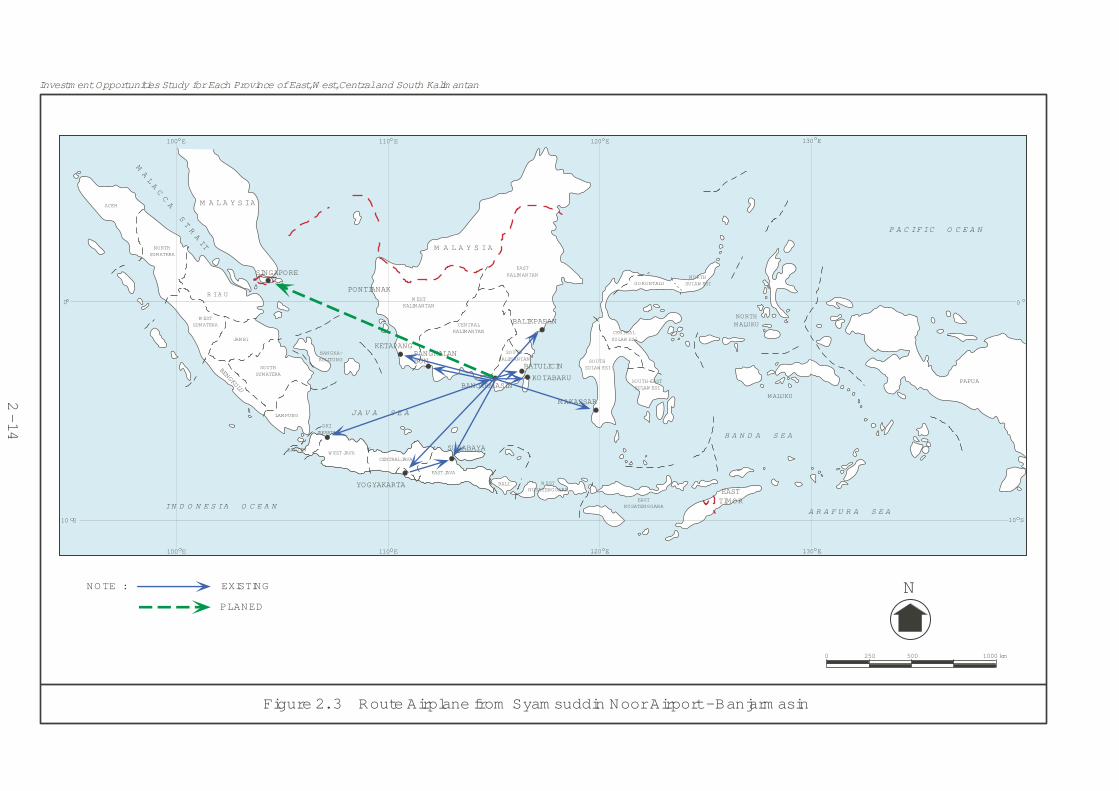
Figure 2. 3 Route Airplane from Syam suddin Noor Airport - Banjarm asin
N
0 250 500 1000 km
EASTTIMOR
A R A F U R A S E A
130 E
10 S
B A N D A S E A
MALUKU
PAPUA
0
P A C IF IC O C E A N
130 E120 E
GORONTALO
CENTRALSULAW ESI
SOUTH-EASTSULAW ESI
EASTNUSATENGGARA
120 E
W ESTNUSATENGGARA
BALI
DKIJAKARTA
JA V A S E A
CENTRALKALIMANTAN
SOUTHKALIMANTAN
EASTKALIMANTAN
M A L A Y S IA
110 E
M A L A Y S IA
JAMBI
SINGAPORE
SOUTHSUMATERA
LAMPUNG
IN D O N E S IA O C E A N
BANTEN
W ESTSUMATERA
R I A U
BENGKULU
0
MALACCA S
TRAITNORTH
SUMATERA
100 E
10 S
100 E 110 E
W EST JAVACENTRAL JAVA
EAST JAVA
NORTHSULAW ESI
NORTHMALUKU
BANGKA-BELITUNG SOUTH
SULAW ESI
NO TE :
W ESTKALIMANTAN
Investm ent Opportunities Study for Each Province of East,W est,Central and South Kalim antan
ACEH
PONTIANAK
KETAPANGPANGKALANBUN
BANJARMASINKOTABARU
YOGYAKARTA
SURABAYA
MAKASSAR
BALIKPAPAN
BATULICIN
EXISTING
PLANED
2 - 14
FINAL REPORT For South Kalimantan Investment Opportunities Study For Each province of East, West, Central and South Kalimantan
BKPM - JICA
2 - 15
2.5 Industrial Estate
The Government has tried to accelerate regional development by providing physical incentives to business players. One of the physical incentives is an availability of the industrial zone/estate. Three industrial zone/estate established by the provincial government are as follows: 1. Industry Area of Alalak / Barito River
Industry area Alalak is situated in Kabupaten Barito Kuala. In this industrial zone there is a canter of wood industries that has operated for long time This area is along the Barito River, by which mostly raw material come from Central Kalimantan Province.
2. Industry Area of Liang Anggang Industry area Liang Anggang is located at Kabupaten Banjar/ This zone is situated in Simpang Tiga – Liang Anggang toward Syamsuddin Noor airport. Exactly site is along the road toward Banjarbaru (Kota Banjarbaru) and Pleihari (Kabupaten Tanah Laut). Industry area of Liang Anggang is planned for small and medium industry. The area along the road between Simpang Tiga and Liang Anggang is planned for warehousing area.
3. Industry Area of Batulicin. Industry area Batulicin is situated in Kabupaten Tanah Bumbu (which is splitted from Kabupaten Kotabaru). ,In this zone the KAPET Batulicin is located. KAPET Batulicin is planned for office and a non-pollution industry area.
2.6 Electricity
Power suppliers of South Kalimantan are: 1. PLTA (hydro turbine generator) Riam Kanan (Ir. Pangeran M. Noor) with
capacity 30 MW supplies electricity with Banjarmasin, Martapura, Banjarbaru and Tanah Laut;
2. PLTD (Diesel generator) Barito sector with capacity 40 MW supplies electricity with Banjarmasin area;
3. PLTU (Steam turbine generator) at Asam-asam with capacity 130 MW supplies power with South Kalimantan and Central Kalimantan as well;
4. PLTA (water turbine generator) at Kusan Hulu with capacity 67 MW supplies power with KAPET Batulicin and its surrounding area.
5. PLTD has supplied power with Kabupaten and city and about 80% of villages all over South Kalimantan.
Availability of Electric Power
Used (MW) Production (MW)
Sold Internal use
Lost Total used
Remaining (MW)
967,127 780,608 6,544 169,976 957,128 9,999 Source: Sumber Energi, Kalsel.go.id, 2002
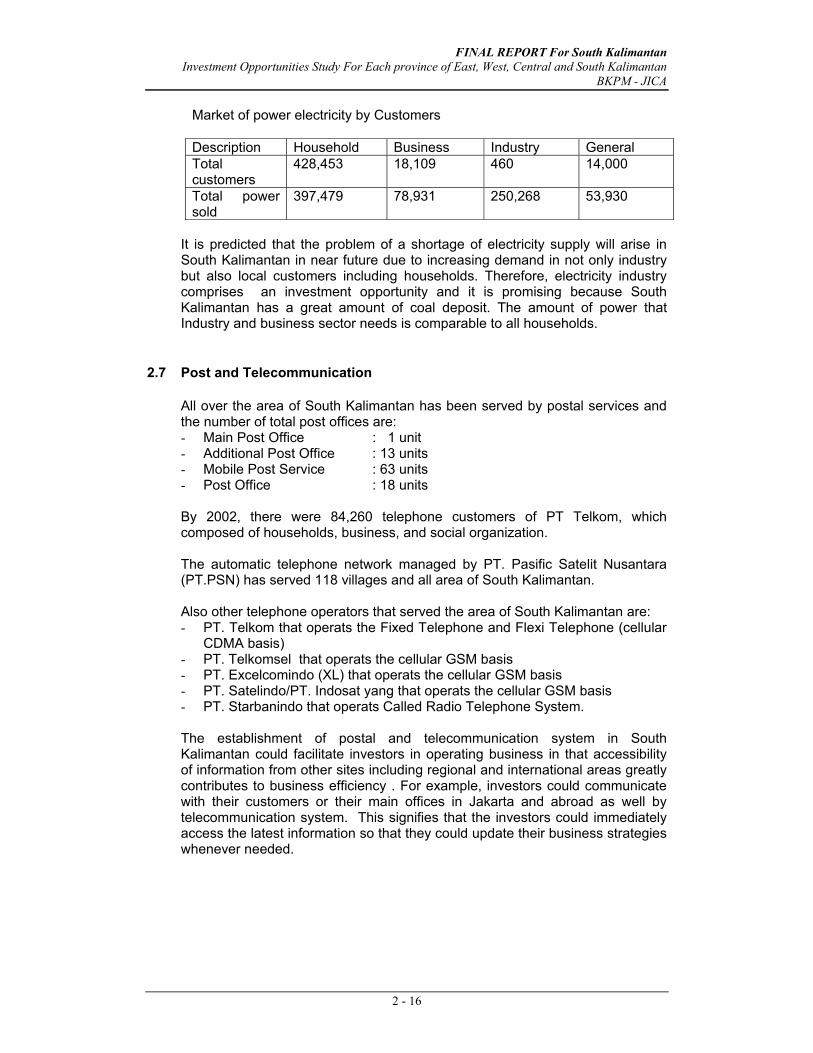
FINAL REPORT For South Kalimantan Investment Opportunities Study For Each province of East, West, Central and South Kalimantan
BKPM - JICA
2 - 16
Market of power electricity by Customers Description Household Business Industry General Total customers
428,453 18,109 460 14,000
Total power sold
397,479 78,931 250,268 53,930
It is predicted that the problem of a shortage of electricity supply will arise in South Kalimantan in near future due to increasing demand in not only industry but also local customers including households. Therefore, electricity industry comprises an investment opportunity and it is promising because South Kalimantan has a great amount of coal deposit. The amount of power that Industry and business sector needs is comparable to all households.
2.7 Post and Telecommunication
All over the area of South Kalimantan has been served by postal services and the number of total post offices are: - Main Post Office : 1 unit - Additional Post Office : 13 units - Mobile Post Service : 63 units - Post Office : 18 units By 2002, there were 84,260 telephone customers of PT Telkom, which composed of households, business, and social organization. The automatic telephone network managed by PT. Pasific Satelit Nusantara (PT.PSN) has served 118 villages and all area of South Kalimantan. Also other telephone operators that served the area of South Kalimantan are: - PT. Telkom that operats the Fixed Telephone and Flexi Telephone (cellular
CDMA basis) - PT. Telkomsel that operats the cellular GSM basis - PT. Excelcomindo (XL) that operats the cellular GSM basis - PT. Satelindo/PT. Indosat yang that operats the cellular GSM basis - PT. Starbanindo that operats Called Radio Telephone System. The establishment of postal and telecommunication system in South Kalimantan could facilitate investors in operating business in that accessibility of information from other sites including regional and international areas greatly contributes to business efficiency . For example, investors could communicate with their customers or their main offices in Jakarta and abroad as well by telecommunication system. This signifies that the investors could immediately access the latest information so that they could update their business strategies whenever needed.
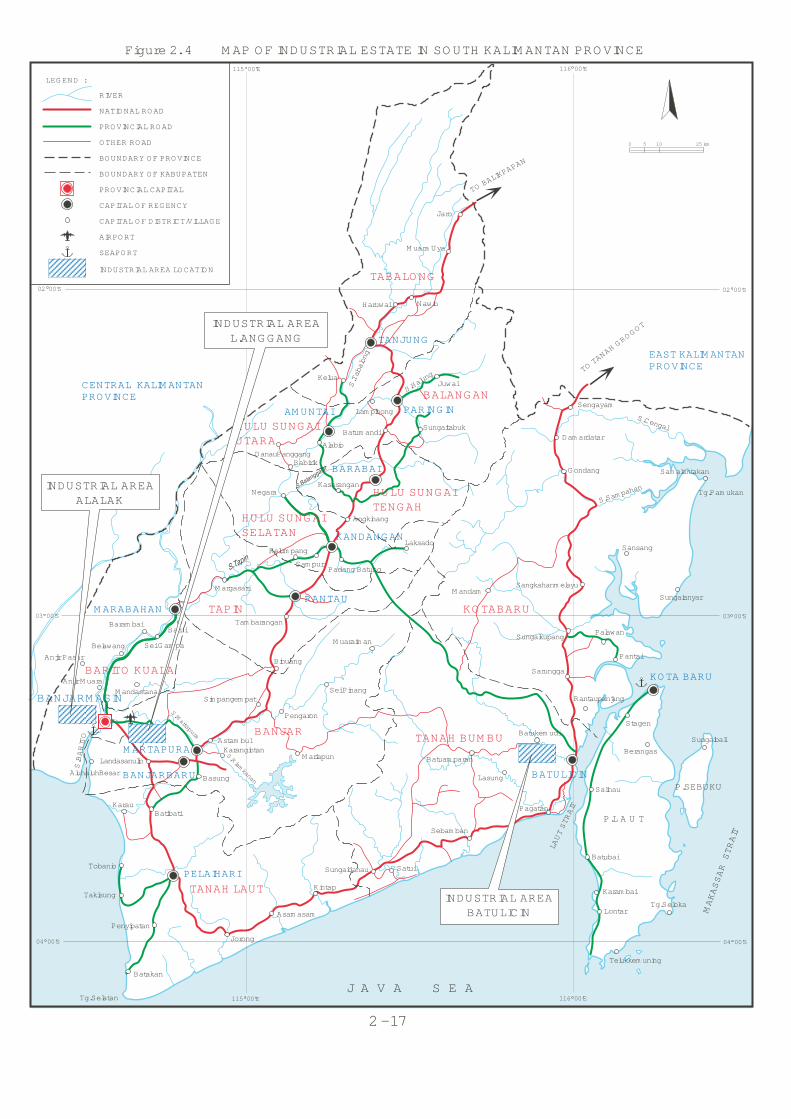
116 00’E115 00’E
04 00’S
03 00’S
115 00’E 116 00’E
02 00’S
03 00’S
04 00’S
0 5 10 25 km
CAPITAL O F REG ENCY
CAPITAL OF DISTRICT/VILLAGE
AIRPORT
SEAPORT
RIVER
PROVINCIAL ROAD
OTHER ROAD
BOUNDARY OF PROVINCE
BOUNDARY OF KABUPATEN
PROVINCIAL CAPITAL
LEG END :S.BARITO
S.Halung
S.Sam pa
han
S.Martapura
BANJARM ASIN
Tg.Selatan
LAUT STRAIT
MAKASSAR STRAIT
S.Cengal
Jaro
M uara Uya
NawinHaruwai
Juwai
Sungaitabuk
Sengayam
Dam ardatar
Gondang Sam alantakan
Lam pihong
Batum andi
Alabio
Kelua
DanauPanggangBabirik
Negara
Angkinang
Kasarangan
Kelum pang
Padang BatungSam pur
Laksado
M argasari
Tam barangan
M uaraim an
Sim pangem pat
Pengaron
Binuang
Sei Pinang
Astam bulKarangintan
M ariapun
Basung
BatibatiKarau
Landasanulin
AluhaluhBesar
Anjir M uara
M andastana
Anjir Pasar
Belawang
Baram bai
Sei Gam pa
Batui
Tobanio
Takisung
Penyipatan
Batakan
Jorong
Asam asam
Kintap
Sungaidanau Satui
M andam
Batuam paran
Sansang
Sangkahanm elayu
Sungaianyar
SungaikupangPalawan
Pantai
Sarungga
Rantaupanjang
Stagen
Berangas
Batukem udi
Lasung
Salinau
Pagatan
Batubai
Karam bai
LontarTg.Seloka
Telukkem uning
Sungaibali
Tg.Pam ukan
02 00’S
TO BA
LIKPAPAN
TO TANAH GROGO
T
TABALONG
TANJUNG
HULU SUNG AIUTARA
BARABAI
AM UNTAI
HULU SUNG AITENG AH
HULU SUNGAISELATAN KANDANGAN
RANTAUTAPINM ARABAHAN
BARITO KUALA
M ARTAPURA
BANJAR
PELAIHARI
TANAH LAUT
KO TABARU
KOTA BARU
P.L A U T
P.SEBUKU
J A V A S E A
S.Riamkanan
S.Tabalong
TANAH BUM BU
BATULICIN
Sebam ban
NATIONAL ROAD
Figure 2. 4 M AP OF INDUSTRIAL ESTATE IN SO UTH KALIM ANTAN PROVINCE
BANJARBARU
BALANGANPARINGIN
EAST KALIM ANTANPROVINCE
CENTRAL KALIM ANTANPROVINCE
INDUSTRIAL AREA LOCATION
2 - 17
INDUSTRIAL AREABATULICIN
INDUSTRIAL AREAALALAK
INDUSTRIAL AREAL.ANG G ANG
FINAL REPORT For South Kalimantan Investment Opportunities Study For Each province of East, West, Central and South Kalimantan
BKPM - JICA
2 - 18
2.8 Water Supply
The clean water for all Kabupaten in South Kalimantan has been provided by the regional water supply authority (PDAM Banjarmasin dan PDAM Batulicin). In Banjarmasin Kota, the capacity of water supply is 1,000 liter per second. The major source of raw water is Riam Kanan dam. It is predicted that water demand in Batulicin Integrated Economic Development Area (KAPET Batulicin) will reach 2,500 liter per second since Batulicin is expected to become business development center in the future. .
2.9 Health Facility / Hospital
In general, the health infrastructures such as hospital, clinic, and medical human resources are available in South Kalimantan Province especially in the main cities such as Banjarmasin and Kabupaten capitals. By 2003, South Kalimantan Province established 25 units of hospital, 5 of which is special hospital (3 units for Maternity Hospital, and 2 units for Mental Disturbance Hospital), and the rest 20 units are General Hospitals. Besides those hospitals, there are 198 Public Health Service Centers, 612 Branches of Public Health Centers, 204 Mobile Public Health (159 using cars and 45 using outside engine canoe). Of 20 units of Hospital, 11 units are managed by Province and Kabupaten Government, 2 units are managed by State Own Firms, 4 unit are managed by Private, and 3 units are Ministry of Defense and Security. 11 Government Hospitals have 121 medical doctors, 48 of which are specialist: obstetric (14), surgeon (8), pediatrician (12), internist (12) and others (2). The rests are 21 dentists and 58 general medical doctors. Public Health Service Centers also has 179 general medical doctors.
CURRENT SITUATION AND FUTURE
PROSPECT OF MAJOR SECTORS
FINAL REPORT For SOUTH KALIMANTAN Investment Opportunities Study For Each Province of East, West, Central and South Kalimantan
BKPM – JICA
PT. PCII 3 - 1
CHAPTER 3
CURRENT SITUATION AND FUTURE PROSPECT OF
MAJOR SECTORS
3.1 MAJOR SECTOR ANALYSIS
Chapter 1 point outs the main sectors of South Kalimantan economic structure are agriculture, mining, manufacture and trade (see Table 1.5). These four sectors contributed to GRDP at 73.56% and absorbed employment at 80.54% of existing labor force.
3.1.1 Plantation
In 2003, main estate crops are oil palm, rubber, tall coconut, arenga palm, hybrid coconut, and coffee. The area of smallholders’ plantation is 232,105 Ha, large-scale private plantation is 151,387 Ha and state own plantation (PTP) is 8,179 Ha. Kabupaten Tabalong has the largest area of smallholder rubber plantation and private company as well, while the Kabupaten Banjar has the largest area of PTP rubber plantation. Kabupaten Barito Kuala has the largest of smallholder coconut plantation. The hybrid coconut plantations are dominant in Kabupaten Kotabaru, where they are planted by smallholder, private company, and PTP. Rubber is mostly planted by smallholders with PIR scheme and community of South Kalimantan who have a considerable knowledge and experience in cultivating this crop. Most of the rubber plantations are located in northern part of South Kalimantan Province such as in Kabupatens of Tabalong, Hulu Sungai Utara, Balangan, Hulu Sungai Tengah, Hulu Sungai Selatan and some plantations are in north eastern part of South Kalimantan. Total rubber plantation area is 162,614 Ha, composed of 145.021 Ha of smallholders, 6,518 Ha of PTP, and 11,075 Ha of private companies. Major rubber processed products are RSS, SIR 3CV, SIR 5, SIR 10, and SIR 20 processed from fresh latex. Most latex is produced by smallholders plantation with average low yield. Total raw material produced by smallholders, PTP, and big private companies are 78,452.63 tons, 4,682.82 tons, and 8,196.45 tons respectively. As mentioned above, while the area of smallholder rubber plantations (145,021 Ha) is the largest its average productivity 900 Kg/Ha is the lowest among the producers. The other problem pointed by Rubber Plantation Association of South Kalimantan is that the annual total production (91,331.90 tons) is much less than the processing unit capacity (154,000 tons/year). To address this problem, the processing productivity of smallholders’ rubber plantation needs to be improved by new investors under Nucleus and Plasma scheme or the contract farming system.
FINAL REPORT For SOUTH KALIMANTAN Investment Opportunities Study For Each Province of East, West, Central and South Kalimantan
BKPM – JICA
PT. PCII 3 - 2
The second largest area is palm oil plantation covering 155,688 Ha. The holder share for this crop plantation is 133,478 Ha (85.75%) by big private companies, 20,529 Ha (13.19%) is by smallholders mainly with plasma scheme of PIR, and 1,661 Ha (1.06%) by state owned plantation (PTP). From this composition, around 30% of the plantation (44,500 Ha) is early planted and not mature for harvest. This indicates that the oil palm plantation of South Kalimantan Province is still in the beginning stage, so the investment opportunities are still widely opened In 2003 the total production of oil palm is 1,338,291.80 Ton fresh fruit bunch of total area of 110,796 Ha, therefore the average productivity is 12,078.88 Kg per hectare fresh fruit bunch. From total 1,338,291.80 ton fresh fruits bunch is estimated equivalent to 274,959.31 ton CPO that produced by existing 7 CPO processing in South Kalimantan. Of 7 CPO processing units 5 units have production capacity 60 ton per hour CPO and the other two units have production capacity 15 ton/hour and 45 ton per hour respectively. Among four provinces of Kalimantan, East Kalimantan has the highest CPO productivity. CPO productivity of South Kalimantan is the medium, and that of West Kalimantan is the lowest. In South Kalimantan most CPO is produced by PT Smart (Sinar Mas Group), and transported to North Sulawesi and Java to be processed into cooking oil. At present there is no cooking oil or oleo-chemical processing plant in South Kalimantan. Establishment the processing of CPO into cooking oil could be an opportunity to develop in South Kalimantan. According to Province Estate Crop Service (2004), the South Kalimantan Province has allocated around 593,301 Ha of suitable land, which can use for development of new palm oil and rubber plantation. These allocation land use are located in Kabupaten Tanah Laut 102,650 Ha, and Kabupaten Tanah Bumbu/ Kotabaru 490,651 Ha.
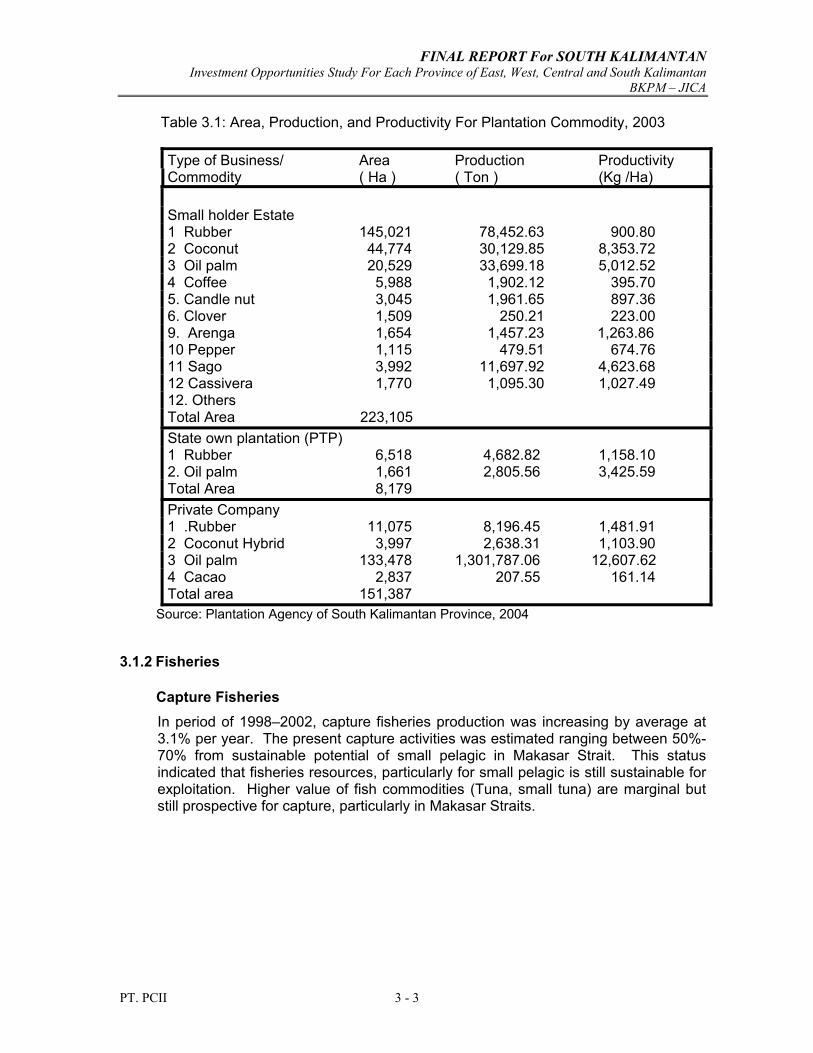
FINAL REPORT For SOUTH KALIMANTAN Investment Opportunities Study For Each Province of East, West, Central and South Kalimantan
BKPM – JICA
PT. PCII 3 - 3
Table 3.1: Area, Production, and Productivity For Plantation Commodity, 2003
Type of Business/ Area Production Productivity Commodity ( Ha ) ( Ton ) (Kg /Ha) Small holder Estate 1 Rubber 145,021 78,452.63 900.80 2 Coconut 44,774 30,129.85 8,353.72 3 Oil palm 20,529 33,699.18 5,012.52 4 Coffee 5,988 1,902.12 395.70 5. Candle nut 3,045 1,961.65 897.36 6. Clover 1,509 250.21 223.00 9. Arenga 1,654 1,457.23 1,263.86 10 Pepper 1,115 479.51 674.76 11 Sago 3,992 11,697.92 4,623.68 12 Cassivera 1,770 1,095.30 1,027.49 12. Others Total Area 223,105 State own plantation (PTP) 1 Rubber 6,518 4,682.82 1,158.10 2. Oil palm 1,661 2,805.56 3,425.59 Total Area 8,179 Private Company 1 .Rubber 11,075 8,196.45 1,481.91 2 Coconut Hybrid 3,997 2,638.31 1,103.90 3 Oil palm 133,478 1,301,787.06 12,607.62 4 Cacao 2,837 207.55 161.14 Total area 151,387
Source: Plantation Agency of South Kalimantan Province, 2004
3.1.2 Fisheries
Capture Fisheries In period of 1998–2002, capture fisheries production was increasing by average at 3.1% per year. The present capture activities was estimated ranging between 50%-70% from sustainable potential of small pelagic in Makasar Strait. This status indicated that fisheries resources, particularly for small pelagic is still sustainable for exploitation. Higher value of fish commodities (Tuna, small tuna) are marginal but still prospective for capture, particularly in Makasar Straits.
FINAL REPORT For SOUTH KALIMANTAN Investment Opportunities Study For Each Province of East, West, Central and South Kalimantan
BKPM – JICA
PT. PCII 3 - 4
Mariculture Provincial and Kabupaten Government have a plan to introduce the marine culture fisheries techniques of Krapu (Groupers), and seaweed to Pulau Laut of Kabupaten Kotabaru. Some preparations are underway to be establishing the marine culture of Groupers (Krapu) through organizing the experiment at project site. The fry of groupers could be got from Bali Hatchery Experiment Station (used to assisted by JICA experts).
Seaweed
The worldwide carrageenan consumption has significantly increased, reaching over 100,000 tons (dry weight) of seaweed per year. Indonesia must compete in the international market with other countries, particularly Philippines, as a world leading producer of Euchemea. The Philippines supplies about 21% and Indonesia supplies about 15% of the total international demand for carrageenan bearing weeds. At the moment, products of seaweed of South Kalimantan are unable to fulfill the market demand. This fact points out that the world market still allows for Indonesia to produce more seaweed to meet its demand; therefore, the investment in this commodity is promising Although seaweed farming is relatively simple for smallholders, the processing technology is still required to be introduced to them. It is recommended that the PIR scheme is introduced for enhancement of seaweed farming to Kabupaten Kotabaru. This is because the major local market is Surabaya, which is relatively close to Kabupaten Kotabaru comparing to Kabupaten Takalar (South Sulawesi). Also the seaweed produced in Kotabaru is Euchemea, which is extensively use for carregeenan, while Takalar produces gracilaria mostly for agar. Therefore, the market target of these regions is quite different, so it would be no heavy competition between Kabup0000aten Takalar.
Shrimp
Tables 3.2, 3.3, 3.4, show production of shrimp in three systems. In the last decade (1994-2003) about 80.31% shrimp produced in South Kalimantan come from seawater shrimp, 4.87% is from cultivated shrimp, and the rest is from fresh waters. The shrimp production growth in the last decade, indicate that cultivated shrimp increased by 17.33% annually and seawater shrimp increased by 7.43% annually, fresh water shrimp decreased by 6.99% annually. This indicates that the cultivated shrimp has steadily increased in Kabupaten Tanah Laut and Kabupaten Kotabaru where the brackish water pond areas are available and infrastructure are appropriate. In these areas, the total area of shrimp cultivation has reached more than 100 Hectares and has potential to extend to 100 hectares.
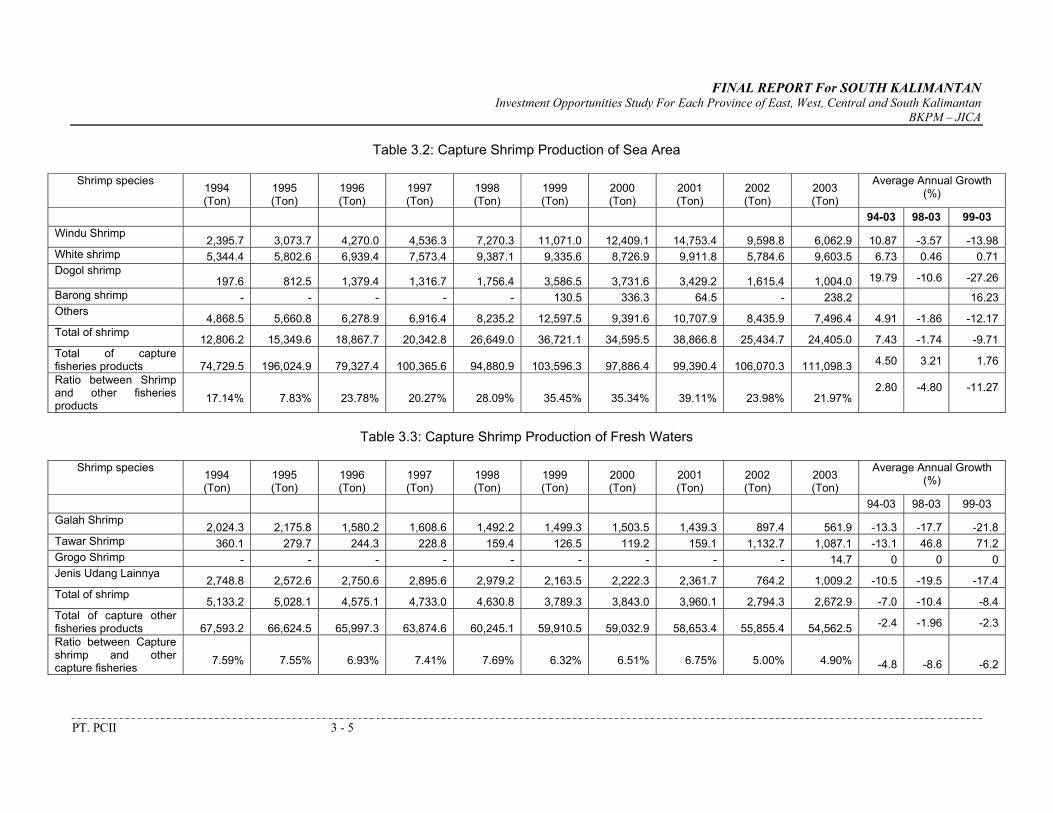
FINAL REPORT For SOUTH KALIMANTAN Investment Opportunities Study For Each Province of East, West, Central and South Kalimantan
BKPM – JICA
PT. PCII 3 - 5
Table 3.2: Capture Shrimp Production of Sea Area Shrimp species
1994 (Ton)
1995 (Ton)
1996 (Ton)
1997 (Ton)
1998 (Ton)
1999 (Ton)
2000 (Ton)
2001 (Ton)
2002 (Ton)
2003 (Ton)
Average Annual Growth (%)
94-03 98-03 99-03 Windu Shrimp
2,395.7 3,073.7 4,270.0 4,536.3 7,270.3 11,071.0 12,409.1 14,753.4 9,598.8 6,062.9 10.87 -3.57 -13.98 White shrimp 5,344.4 5,802.6 6,939.4 7,573.4 9,387.1 9,335.6 8,726.9 9,911.8 5,784.6 9,603.5 6.73 0.46 0.71 Dogol shrimp
197.6 812.5 1,379.4 1,316.7 1,756.4 3,586.5 3,731.6 3,429.2 1,615.4 1,004.0 19.79 -10.6 -27.26 Barong shrimp - - - - - 130.5 336.3 64.5 - 238.2 16.23 Others
4,868.5 5,660.8 6,278.9 6,916.4 8,235.2 12,597.5 9,391.6 10,707.9 8,435.9 7,496.4 4.91 -1.86 -12.17 Total of shrimp
12,806.2 15,349.6 18,867.7 20,342.8 26,649.0 36,721.1 34,595.5 38,866.8 25,434.7 24,405.0 7.43 -1.74 -9.71 Total of capture fisheries products 74,729.5 196,024.9 79,327.4 100,365.6 94,880.9 103,596.3 97,886.4 99,390.4 106,070.3 111,098.3 4.50 3.21 1.76
Ratio between Shrimp and other fisheries products
17.14% 7.83% 23.78% 20.27% 28.09% 35.45% 35.34% 39.11% 23.98% 21.97% 2.80 -4.80 -11.27
Table 3.3: Capture Shrimp Production of Fresh Waters
Shrimp species
1994 (Ton)
1995 (Ton)
1996 (Ton)
1997 (Ton)
1998 (Ton)
1999 (Ton)
2000 (Ton)
2001 (Ton)
2002 (Ton)
2003 (Ton)
Average Annual Growth (%)
94-03 98-03 99-03 Galah Shrimp
2,024.3 2,175.8 1,580.2 1,608.6 1,492.2 1,499.3 1,503.5 1,439.3 897.4 561.9 -13.3 -17.7 -21.8 Tawar Shrimp 360.1 279.7 244.3 228.8 159.4 126.5 119.2 159.1 1,132.7 1,087.1 -13.1 46.8 71.2 Grogo Shrimp - - - - - - - - - 14.7 0 0 0 Jenis Udang Lainnya
2,748.8 2,572.6 2,750.6 2,895.6 2,979.2 2,163.5 2,222.3 2,361.7 764.2 1,009.2 -10.5 -19.5 -17.4 Total of shrimp
5,133.2 5,028.1 4,575.1 4,733.0 4,630.8 3,789.3 3,843.0 3,960.1 2,794.3 2,672.9 -7.0 -10.4 -8.4 Total of capture other fisheries products 67,593.2 66,624.5 65,997.3 63,874.6 60,245.1 59,910.5 59,032.9 58,653.4 55,855.4 54,562.5 -2.4 -1.96 -2.3
Ratio between Capture shrimp and other capture fisheries
7.59% 7.55% 6.93% 7.41% 7.69% 6.32% 6.51% 6.75% 5.00% 4.90% -4.8 -8.6 -6.2
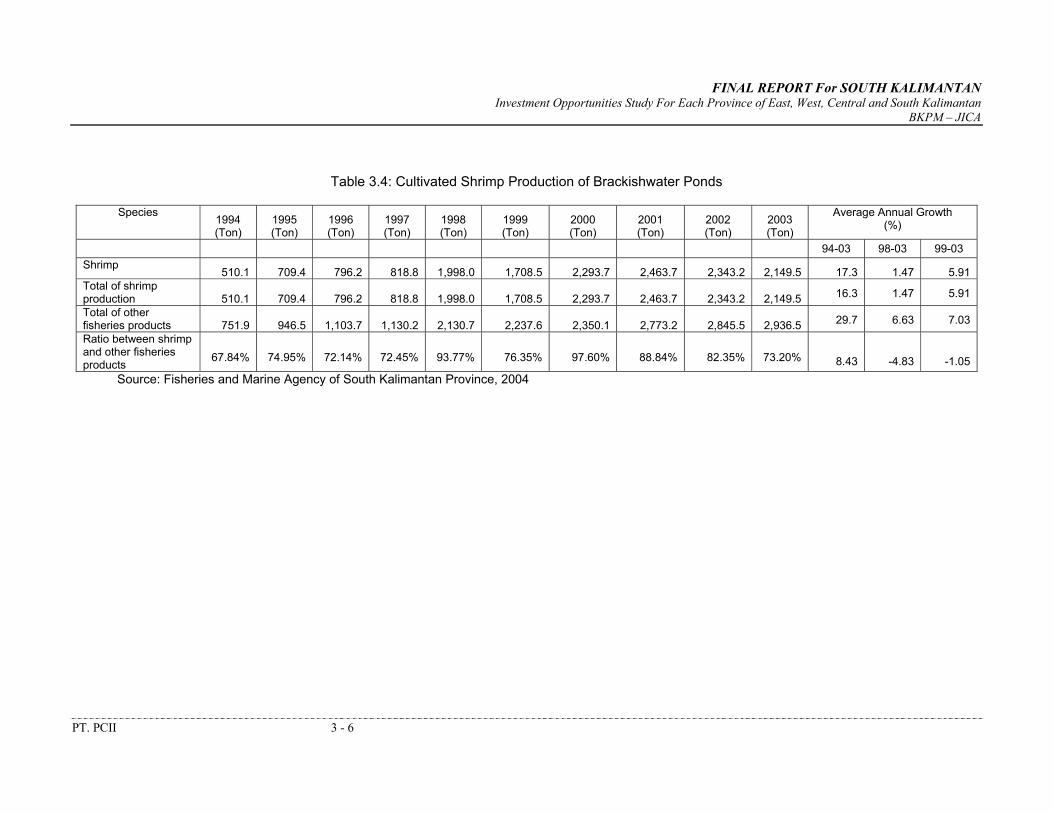
FINAL REPORT For SOUTH KALIMANTAN Investment Opportunities Study For Each Province of East, West, Central and South Kalimantan
BKPM – JICA
PT. PCII 3 - 6
Table 3.4: Cultivated Shrimp Production of Brackishwater Ponds
Species 1994 (Ton)
1995 (Ton)
1996 (Ton)
1997 (Ton)
1998 (Ton)
1999 (Ton)
2000 (Ton)
2001 (Ton)
2002 (Ton)
2003 (Ton)
Average Annual Growth (%)
94-03 98-03 99-03 Shrimp
510.1 709.4 796.2 818.8 1,998.0 1,708.5 2,293.7 2,463.7 2,343.2 2,149.5 17.3 1.47 5.91 Total of shrimp production 510.1 709.4 796.2 818.8 1,998.0 1,708.5 2,293.7 2,463.7 2,343.2 2,149.5 16.3 1.47 5.91
Total of other fisheries products 751.9 946.5 1,103.7 1,130.2 2,130.7 2,237.6 2,350.1 2,773.2 2,845.5 2,936.5 29.7 6.63 7.03
Ratio between shrimp and other fisheries products
67.84% 74.95% 72.14% 72.45% 93.77% 76.35% 97.60% 88.84% 82.35% 73.20% 8.43 -4.83 -1.05 Source: Fisheries and Marine Agency of South Kalimantan Province, 2004
FINAL REPORT For SOUTH KALIMANTAN Investment Opportunities Study For Each Province of East, West, Central and South Kalimantan
BKPM – JICA
PT. PCII 3 - 7
3.1.3 Livestock
In the last four years (1999-2003) the livestock sub-sector has significantly developed especially in poultry (native chicken, broiler, and duck) at annual average growth rate of 31.09%, small ruminant (goat, sheep, and pig) at annual average growth rate of 5.43%, and big ruminant (cattle, buffalo, and horse) at annual average growth rate of 3.83%. Among big ruminant, beef cattle is the main livestock followed by buffalo and horse. Most cattle are developed in Kabupaten Tanah Laut, Tanah Bumbu, and Banjar. On the other hand, buffalos are pastured in Kabupaten Hulu Sungai Utara and Tanah Bumbu. In case of the small ruminant, goats are reared in Kabupaten Hulu Sungai Tengah, Kotabaru, and Barito Kuala. Sheep are reard in Kabupaten Hulu Sungai Tengah, while pigs are reard in Kota Baru and Kabupaten Tanah Bumbu. The main poultry are broilers, native chicken, and layers. Broilers are mostly bred in Kota Banjarmaru, Kabupaten Banjar, and Kabupaten Tanah Laut. Native chickens are bred in Kabupaten Banjar, layers are reared in Kabupaten Tanah Laut, and ducks are reared in Kabupaten Hulu Sungai Utara.
Production of egg of South Kalimantan reaches 9,270,447 kg per year, and these eggs are directly sold in local market and some of them are sold for hatchery in Kabupaten Tanah Laut. Considering development of livestock industry in the area, the animal feed is a promising business especially in Kabupaten Tanah Laut (Pleihari). Production of animal feed should be integrated with peeled production for fish aquaculture and shrimp. The problem of animal feed business is a lack of raw materials such as corn and mineral ingredients in local area, so the investment in animal feed business still not conducive for new investors. However, the Government of Kabupaten Tanah Laut is very interested in improving the corn cultivation scheme in the area. In 1998, PT Suri Tani Pemuka that operates brackish water aquaculture established the peeled for aquaculture and shrimp cultivation in South Kalimantan. This company has sold 90% of its product to shrimp brackish water aquaculture and used the rest 10% for its own shrimp farming.
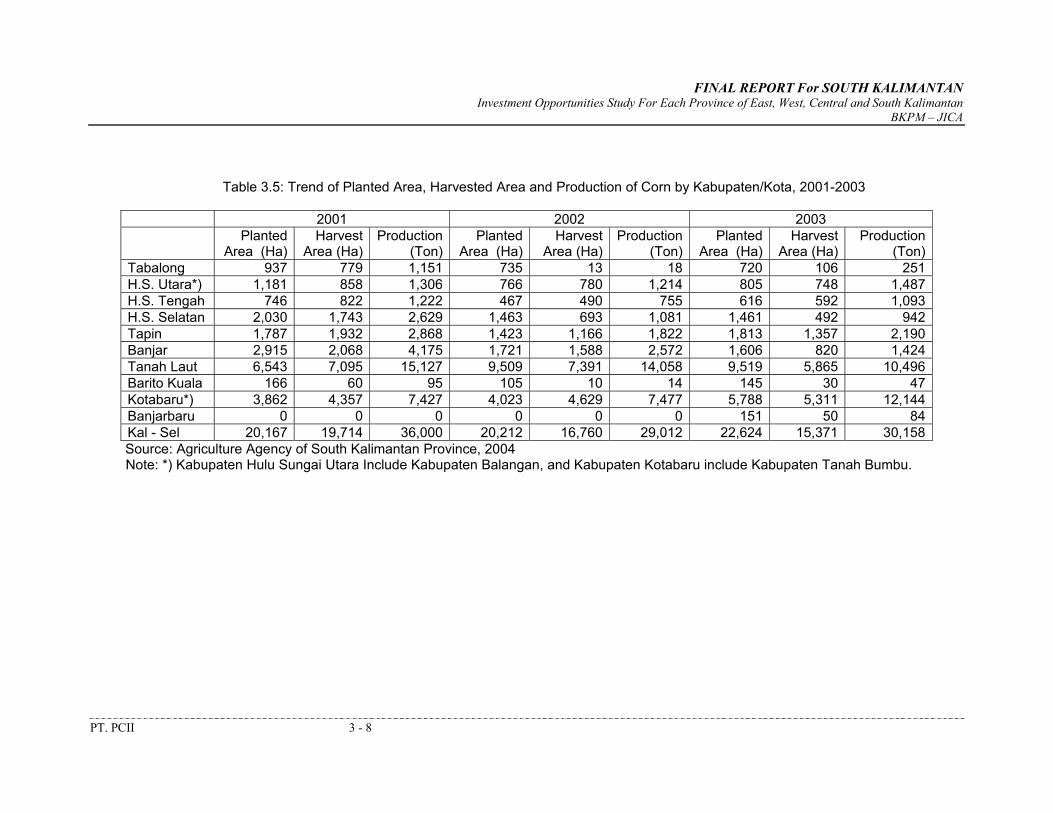
FINAL REPORT For SOUTH KALIMANTAN Investment Opportunities Study For Each Province of East, West, Central and South Kalimantan
BKPM – JICA
PT. PCII 3 - 8
Table 3.5: Trend of Planted Area, Harvested Area and Production of Corn by Kabupaten/Kota, 2001-2003
2001 2002 2003 Planted
Area (Ha) Harvest
Area (Ha)Production
(Ton)Planted
Area (Ha)Harvest
Area (Ha)Production
(Ton)Planted
Area (Ha)Harvest
Area (Ha)Production
(Ton)Tabalong 937 779 1,151 735 13 18 720 106 251H.S. Utara*) 1,181 858 1,306 766 780 1,214 805 748 1,487H.S. Tengah 746 822 1,222 467 490 755 616 592 1,093H.S. Selatan 2,030 1,743 2,629 1,463 693 1,081 1,461 492 942Tapin 1,787 1,932 2,868 1,423 1,166 1,822 1,813 1,357 2,190Banjar 2,915 2,068 4,175 1,721 1,588 2,572 1,606 820 1,424Tanah Laut 6,543 7,095 15,127 9,509 7,391 14,058 9,519 5,865 10,496Barito Kuala 166 60 95 105 10 14 145 30 47Kotabaru*) 3,862 4,357 7,427 4,023 4,629 7,477 5,788 5,311 12,144Banjarbaru 0 0 0 0 0 0 151 50 84Kal - Sel 20,167 19,714 36,000 20,212 16,760 29,012 22,624 15,371 30,158Source: Agriculture Agency of South Kalimantan Province, 2004 Note: *) Kabupaten Hulu Sungai Utara Include Kabupaten Balangan, and Kabupaten Kotabaru include Kabupaten Tanah Bumbu.
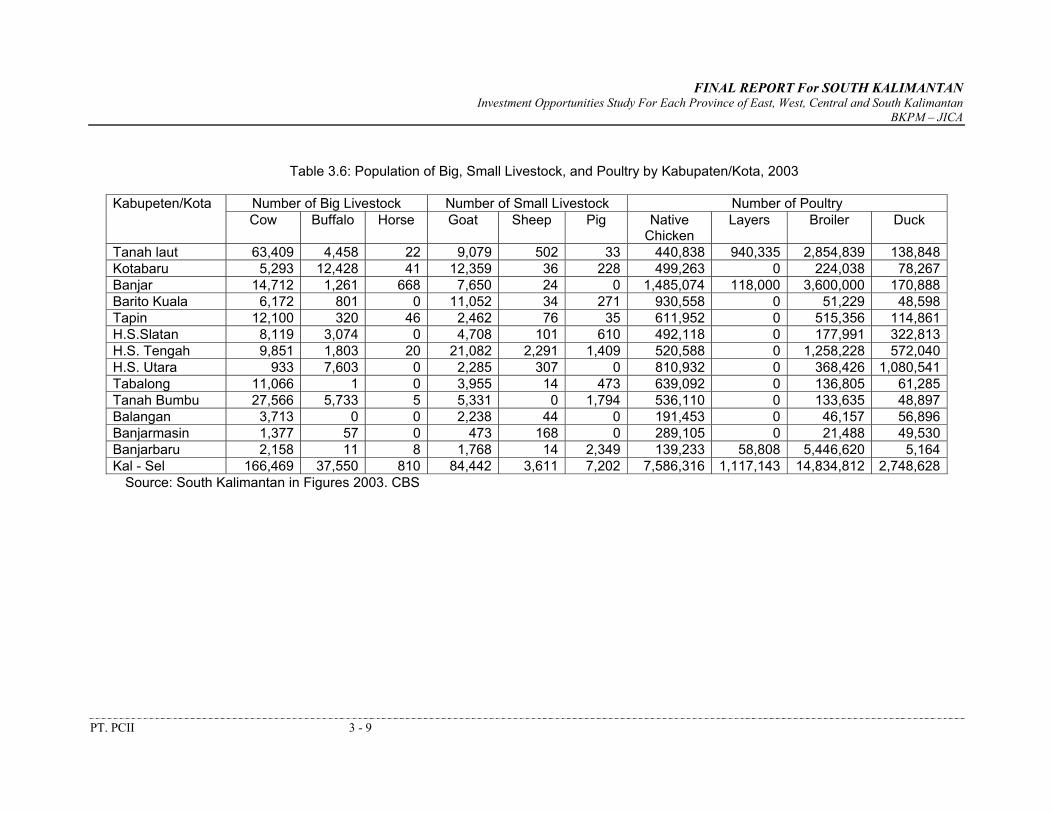
FINAL REPORT For SOUTH KALIMANTAN Investment Opportunities Study For Each Province of East, West, Central and South Kalimantan
BKPM – JICA
PT. PCII 3 - 9
Table 3.6: Population of Big, Small Livestock, and Poultry by Kabupaten/Kota, 2003
Number of Big Livestock Number of Small Livestock Number of Poultry Kabupeten/Kota Cow Buffalo Horse Goat Sheep Pig Native
Chicken Layers Broiler Duck
Tanah laut 63,409 4,458 22 9,079 502 33 440,838 940,335 2,854,839 138,848Kotabaru 5,293 12,428 41 12,359 36 228 499,263 0 224,038 78,267Banjar 14,712 1,261 668 7,650 24 0 1,485,074 118,000 3,600,000 170,888Barito Kuala 6,172 801 0 11,052 34 271 930,558 0 51,229 48,598Tapin 12,100 320 46 2,462 76 35 611,952 0 515,356 114,861H.S.Slatan 8,119 3,074 0 4,708 101 610 492,118 0 177,991 322,813H.S. Tengah 9,851 1,803 20 21,082 2,291 1,409 520,588 0 1,258,228 572,040H.S. Utara 933 7,603 0 2,285 307 0 810,932 0 368,426 1,080,541Tabalong 11,066 1 0 3,955 14 473 639,092 0 136,805 61,285Tanah Bumbu 27,566 5,733 5 5,331 0 1,794 536,110 0 133,635 48,897Balangan 3,713 0 0 2,238 44 0 191,453 0 46,157 56,896Banjarmasin 1,377 57 0 473 168 0 289,105 0 21,488 49,530Banjarbaru 2,158 11 8 1,768 14 2,349 139,233 58,808 5,446,620 5,164Kal - Sel 166,469 37,550 810 84,442 3,611 7,202 7,586,316 1,117,143 14,834,812 2,748,628
Source: South Kalimantan in Figures 2003. CBS
FINAL REPORT For SOUTH KALIMANTAN Investment Opportunities Study For Each Province of East, West, Central and South Kalimantan
BKPM – JICA
PT. PCII 3 - 10
3.1.4 Mining Sector
Coal and iron ore are the main minerals that have been exploited in South Kalimantan and these are promising for investment. In the context of regional economic development, coals of South Kalimantan come not only from the northern area of South Kalimantan Province jurisdiction (Kabupatens of Tabalong, Hulu Sungai Utara, Hulu Sungai Tengah, Tapin, Banjar in western part; and kabupatens of Kotabru, Tanah Bumbu, and Tanah Laut of eastern part of South Kalimantan Province) but also from Kabupatens of Barito Timur, Barito Selatan, and Barito Utara (under jurisdiction of Central Kalimantan). They are exported from Trisakti harbor of Banjarmasin and Batulicin harbors as well. Coal mining can bring about generates mutual advantages for South Kalimantan and Central Kalimantan Provinces. Table 3.7 indicates the mining resource that available in South Kalimantan Province, some of those mining resources have been exploited but some is still in exploration and indicative survey. Coal mining of 1,546,663 million ton is the main product at the moment which is located at Kabupaten Tanah Laut, Kabupaten Kotabaru, Kabupaten Hulu Sungai Utara, iron ore 194 million ton, quart sand 51 million ton. The exploration and exploitation of mining are still sufficient opportunity to new investors in all area of mining. At present, coal mining has being exploited by investors. This sector needs huge capital, technology, and market. Iron ore is under indicative stage and some are is in inferred stage. Iron ore is found in Kabupaten Tanah Laut, Kotabaru, and Hulu Sungai Utara. The South Kalimantan Province Government intends to process the iron ore in its area into end products such as reinforcement steel, U-bar, flat steel etc before exported. Although The South Kalimantan has huge volume of coal deposit, its quality beyond the thermal classification requirement, so its calorie might not be sufficient for forging requirements. For this reason, if South Kalimantan Province intends to process its own iron ore in South Kalimantan, it needs to import the choking coal from overseas. Also, steel factories require intensive supporting industries.
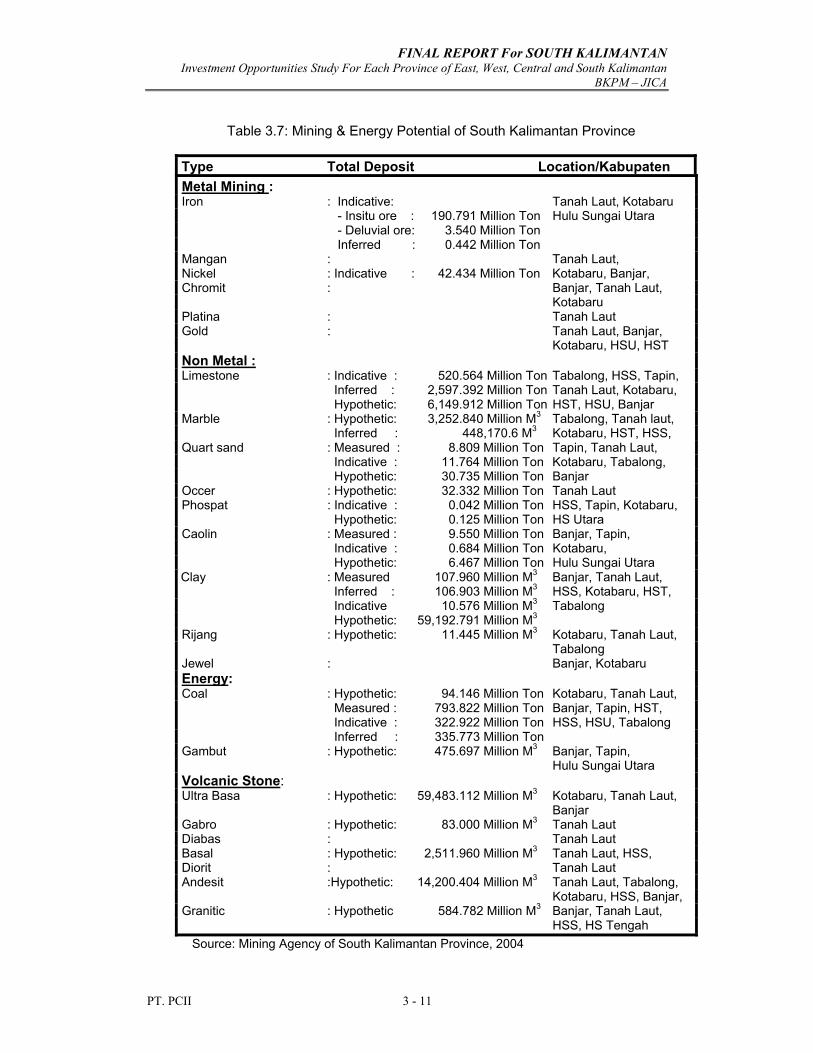
FINAL REPORT For SOUTH KALIMANTAN Investment Opportunities Study For Each Province of East, West, Central and South Kalimantan
BKPM – JICA
PT. PCII 3 - 11
Table 3.7: Mining & Energy Potential of South Kalimantan Province
Type Total Deposit Location/Kabupaten Metal Mining : Iron : Indicative: Tanah Laut, Kotabaru
- Insitu ore : 190.791 Million Ton Hulu Sungai Utara - Deluvial ore: 3.540 Million Ton Inferred : 0.442 Million Ton Mangan : Tanah Laut, Nickel : Indicative : 42.434 Million Ton Kotabaru, Banjar, Chromit : Banjar, Tanah Laut, Kotabaru Platina : Tanah Laut Gold : Tanah Laut, Banjar, Kotabaru, HSU, HST Non Metal : Limestone : Indicative : 520.564 Million Ton Tabalong, HSS, Tapin, Inferred : 2,597.392 Million Ton Tanah Laut, Kotabaru, Hypothetic: 6,149.912 Million Ton HST, HSU, Banjar Marble : Hypothetic: 3,252.840 Million M3 Tabalong, Tanah laut, Inferred : 448,170.6 M3 Kotabaru, HST, HSS, Quart sand : Measured : 8.809 Million Ton Tapin, Tanah Laut, Indicative : 11.764 Million Ton Kotabaru, Tabalong, Hypothetic: 30.735 Million Ton Banjar Occer : Hypothetic: 32.332 Million Ton Tanah Laut Phospat : Indicative : 0.042 Million Ton HSS, Tapin, Kotabaru, Hypothetic: 0.125 Million Ton HS Utara Caolin : Measured : 9.550 Million Ton Banjar, Tapin, Indicative : 0.684 Million Ton Kotabaru, Hypothetic: 6.467 Million Ton Hulu Sungai Utara Clay : Measured 107.960 Million M3 Banjar, Tanah Laut, Inferred : 106.903 Million M3 HSS, Kotabaru, HST, Indicative 10.576 Million M3 Tabalong Hypothetic: 59,192.791 Million M3 Rijang : Hypothetic: 11.445 Million M3 Kotabaru, Tanah Laut, Tabalong Jewel : Banjar, Kotabaru Energy: Coal : Hypothetic: 94.146 Million Ton Kotabaru, Tanah Laut, Measured : 793.822 Million Ton Banjar, Tapin, HST, Indicative : 322.922 Million Ton HSS, HSU, Tabalong Inferred : 335.773 Million Ton Gambut : Hypothetic: 475.697 Million M3 Banjar, Tapin, Hulu Sungai Utara Volcanic Stone: Ultra Basa : Hypothetic: 59,483.112 Million M3 Kotabaru, Tanah Laut, Banjar Gabro : Hypothetic: 83.000 Million M3 Tanah Laut Diabas : Tanah Laut Basal : Hypothetic: 2,511.960 Million M3 Tanah Laut, HSS, Diorit : Tanah Laut Andesit :Hypothetic: 14,200.404 Million M3 Tanah Laut, Tabalong, Kotabaru, HSS, Banjar, Granitic : Hypothetic 584.782 Million M3 Banjar, Tanah Laut, HSS, HS Tengah
Source: Mining Agency of South Kalimantan Province, 2004
FINAL REPORT For SOUTH KALIMANTAN Investment Opportunities Study For Each Province of East, West, Central and South Kalimantan
BKPM – JICA
PT. PCII 3 - 12
3.1.5 Manufacture
The leading sub-sector of manufacture sector is wood industries in Kota Banjarmasin and Kabupaten Barito Kuala. In the last four year this sub-sector gradually declined, but in 2003 this sector showed positive growth. Contribution of this sub-sector to GRDP has been still comparable to mining, and even higher than trade sector.
Main products of the manufacture sector are wooden products, foods, and chemical processing products. Wood processing industry has been declined because logging quota policy of government and illegal logging practices caused a shortage of raw material. To address this problem, business enterprises need to purchase raw materials from Central Kalimantan, Sulawesi, and Papua.
Rubber processing industry and fishery processing industry are promising for new investors. At present the installed rubber processing capacity (154,000 ton/year) exceeds its raw material supply (91,331.90 ton/year). This is because of a number of smallholders in Kabupaten Barito Selatan, Barito Timur of Central Kalimantan have been switched rubber plantation to coal mining. Also the area of rubber plantation in Tabalong, Hulu Sungai Utara, Hulu Sungai Tengah, Tapin, Banjar of South Kalimantan have been transformed into coal mining area.
3.1.6 Trade
Trade including hotel and restaurant also has significantly contributed to GRDP. This sector could be develop because of strategic location of South Kalimantan in economy interaction with three provinces South, Central, and East Kalimantan.
South Kalimantan has comparative advantage in inland, water (river and sea), air transportation network. At Banjarmasin a number of “star” class hotel, office spaces, business, and commercial facilities have been built.
Therefore the South Kalimantan Province can play a role of intermediate trade market for goods of neighboring provinces. The processing and supporting industries would be promising businesses in this area such as shipping docking and maintenance, wood ship manufacture. South Kalimantan can be the gate of good flow from other island especially from Surabaya, Makasar etc. Also it has good inland transportation to Central Kalimantan and East Kalimantan. This facilitates the distribution of necessities and staple foods to hinterland.
GRDP per capita indicates that East Kalimantan is the highest GRDP per capita at Rp.9,469,456 and Central Kalimantan with Rp.2,208,110 could be good buyers of goods and services. This could be possible by good inland transportation network that connects Banjarmasin to Samarinda (East Kalimantan), and Banjarmasin to Palangkaraya (Central Kalimantan) can contribute to efficient distribution of goods and services
For its prosperous economy, South Kalimantan should develop its role not only as intermediate but also as industry services such as processing zone of the raw materials coming from both neighbor provinces and local areas. The possible business are as follows: warehousing, forwarding, shipping maintenance and docking, downstream industries of oil palm, rubber, fisheries, livestock, coal, iron ore.
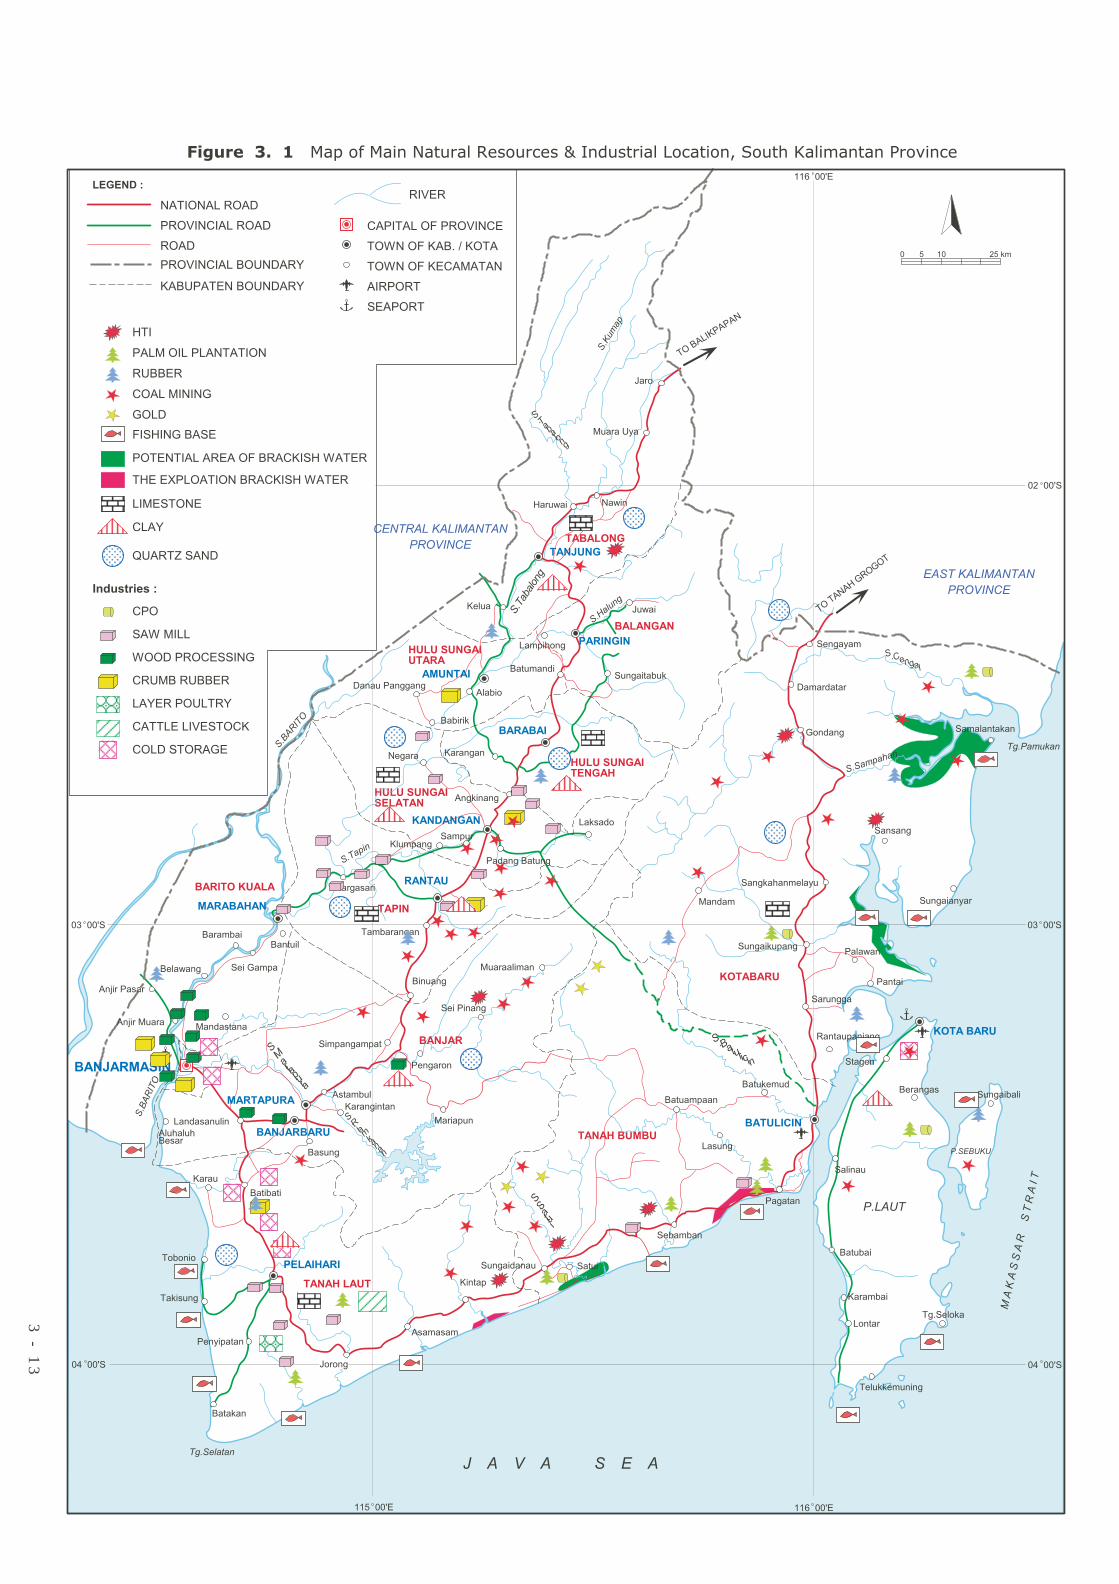
����������
����
���� ��
��������
� �����
����������
��� ������
����������
������
���
��������
����������
�����
��������� ���������
�������
���������
������
�������
������
�������
���� ����
��������
������������������
����
�������������������
������������������
�������������������
������������� �����
������������!����
�������
������
����������������
�� ����
�������������
�� ����
� � �� � �� � �� � � � � � � � � � � � ��
������
��������
������
����
�������
������
�����
�����������
������
�����������������������������
���� ��!��
��"�����
���� ��!��
������
������
������
�����
���������
�����
���������
��������
�������
� ������
����������
�"#$%$&'
�&()*�!+$*$
�&()*��$,$*
!$&-$,.$&$
�$*$ /$)
")�0$ 1$
�$&.+)#
�$ /$*$&'$&
!$*'$,$*)
�#+ 1$&'
�"'$*$
�$&$+��$&''$&'
�$/)*)�
�)&+$&'
) 1$&'$ 1$.
�"&'$*2&
�,.$ /+#
�$*$&')&.$&
�$.)/$.)
�$,+&'
32*2&'
�,$ $,$ �"&4)1$.$&
�$.$�$&
�$&-$,$&+#)&
�$*$+
�#+5$#+5�",$*
6$*+%$)
�"#+$
�#$/)2
�)&.$1
+&'$)-$&$+
")��)&$&'
!+$*$$#) $&
$ 1+*
�&'�)&$&'
�$-$&'��$.+&'
�$*$&'$&
�$�,$-2
�$.+ $&-)
�$%)&
!+$*$��4$
3$*2
�2&.$*�'�"#2�$
�$'$.$&
�"*$&'$,
+&'$)�+1$&'
�$&.$)
�$�),+&'
�2/2&)2
3+%$)
�$ 1)52&'
+&'$).$/+�
"/$ /$&
$.+)
�"#+��" +&)&'
�$*$ /$)
�$.+/$)
�$.+$ 1$$&
�$,+&'
$#)&$+
�$.+�" +-
�$&.$+1$&($&'
�$#$%$&
$*+&''$
!$&-$
$&'�$5$& "#$4+
02&-$&'
�$ $*-$.$*
"&'$4$
.$'"&
+&'$)/$#)
+&'$)$&4$*
$&,$&'
$ $#$&.$�$&
����������
�����##
����������
!$*)$1+&
����#�
��������
�����
�������6�0
��0��
����������
���������������
������
������
������
�������
��������$��
�����������
���!���
������������0
���
�������������
���������������
���!��������
���������0�
������������������������������ ��������������������� ����������������� ���������������
���!���������������
�����!����0
������
0���
6��
��6��0����
������������������������6������
�6���7���������������6������
��!�����
����
8����9����
3 - 1
3
FINAL REPORT For SOUTH KALIMANTAN Investment Opportunities Study For Each Province of East, West, Central and South Kalimantan
BKPM – JICA
PT. PCII 3 - 14
3.2 COMMODITY ANALYSIS
3.2.1 OIL PALM 3.2.1.1 Natural Resources / Raw Material
The flat area of South Kalimantan Province would be preferable location for oil palm cultivation. Where cultivation is undertaken on undulating land, the slopes should generally not be greater than 20 percent. Optimal effective soil depth are around 80 to 100 cm, and friable sandy loams are to be preferred. The optimal soil reaction is in the range pH 5 to 6. Oil palm on flat land must be accompanied by an efficient and comprehensive drainage system. Two major products are obtained from the oil palm. Mesocarp oil from the flesh of the fruits is utilized to produce cooking oils, margarine, etc. The kernels are used to produce kernel oil and palm kernel cake. The palm kernel oil is utilized for soaps, candles, pharmaceutical products, and cosmetics, while the palm kernel cake is utilized in livestock feeds. Total production of oil palm of South Kalimantan should be in line with the ripening stage of crops some of oil palm have been in ripening stage and the others still in immature stage. The following scheme of CPO production could draw the raw materials supply. Oil palm plantation development of South Kalimantan has been started in 1996 and by year of 2003 total oil palm is 155,668 ha (see Table 3.8). Of this total, 110,796 ha are harvesting stage, 44,863 ha are young crops, and 9 ha are damaging crops. Beside, existing oil palm plantation area in South Kalimantan still available another 593,301 Ha in Kabupaten Tanah Laut and Tanah Bumbu / Kotabaru that area suitable for oil palm. If this 593,301 ha have been planted by oil palm crops in year of 2006, the total fresh fruit bunch (TBS) of South Kalimantan in next 25 years or in year of 2027 would be estimated at 9,046,708.10 ton or equivalent to 1,809,341.62 ton CPO (see Table 3.8). Percentage CPO production development would be increasing with peak in year of 2011. By assumption the CPO capacity is 60 ton per hour to process the fresh fruit bunch into CPO needs about 10 CPO processing plant. To maintain the CPO supply the replanting should be started at 2022 with properly schedule plan. By doing so the sustainable CPO supply could be maintained for downstream industries, such as cooking oil, oleo-chemical processing.
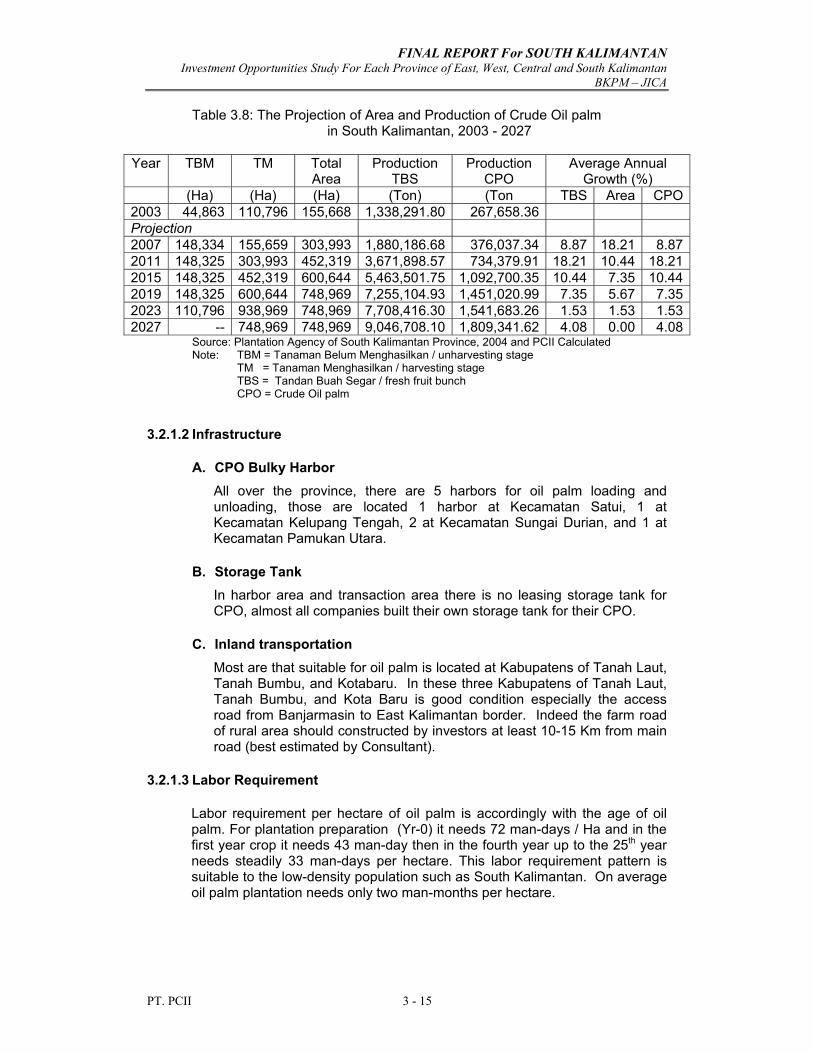
FINAL REPORT For SOUTH KALIMANTAN Investment Opportunities Study For Each Province of East, West, Central and South Kalimantan
BKPM – JICA
PT. PCII 3 - 15
Table 3.8: The Projection of Area and Production of Crude Oil palm in South Kalimantan, 2003 - 2027
Year TBM
TM
Total Area
Production TBS
Production CPO
Average Annual Growth (%)
(Ha) (Ha) (Ha) (Ton) (Ton TBS Area CPO2003 44,863 110,796 155,668 1,338,291.80 267,658.36 Projection 2007 148,334 155,659 303,993 1,880,186.68 376,037.34 8.87 18.21 8.872011 148,325 303,993 452,319 3,671,898.57 734,379.91 18.21 10.44 18.212015 148,325 452,319 600,644 5,463,501.75 1,092,700.35 10.44 7.35 10.442019 148,325 600,644 748,969 7,255,104.93 1,451,020.99 7.35 5.67 7.352023 110,796 938,969 748,969 7,708,416.30 1,541,683.26 1.53 1.53 1.532027 -- 748,969 748,969 9,046,708.10 1,809,341.62 4.08 0.00 4.08
Source: Plantation Agency of South Kalimantan Province, 2004 and PCII Calculated Note: TBM = Tanaman Belum Menghasilkan / unharvesting stage TM = Tanaman Menghasilkan / harvesting stage TBS = Tandan Buah Segar / fresh fruit bunch CPO = Crude Oil palm
3.2.1.2 Infrastructure
A. CPO Bulky Harbor All over the province, there are 5 harbors for oil palm loading and unloading, those are located 1 harbor at Kecamatan Satui, 1 at Kecamatan Kelupang Tengah, 2 at Kecamatan Sungai Durian, and 1 at Kecamatan Pamukan Utara.
B. Storage Tank In harbor area and transaction area there is no leasing storage tank for CPO, almost all companies built their own storage tank for their CPO.
C. Inland transportation Most are that suitable for oil palm is located at Kabupatens of Tanah Laut, Tanah Bumbu, and Kotabaru. In these three Kabupatens of Tanah Laut, Tanah Bumbu, and Kota Baru is good condition especially the access road from Banjarmasin to East Kalimantan border. Indeed the farm road of rural area should constructed by investors at least 10-15 Km from main road (best estimated by Consultant).
3.2.1.3 Labor Requirement
Labor requirement per hectare of oil palm is accordingly with the age of oil palm. For plantation preparation (Yr-0) it needs 72 man-days / Ha and in the first year crop it needs 43 man-day then in the fourth year up to the 25th year needs steadily 33 man-days per hectare. This labor requirement pattern is suitable to the low-density population such as South Kalimantan. On average oil palm plantation needs only two man-months per hectare.
FINAL REPORT For SOUTH KALIMANTAN Investment Opportunities Study For Each Province of East, West, Central and South Kalimantan
BKPM – JICA
PT. PCII 3 - 16
Fortunately the Kabupaten Tanah Bumbu and Kabupaten Kotabaru have transmigration settlement. This could be the labor source for these Kabupaten.
3.2.1.4 Supporting Industries / Business
a. Seedling Seedling centers that have reputable sources of oil palm planting material in Indonesia are as follow: 1. Oil palm planting material of Dolok Sinumbuh 2. Oil palm planting material of Lame 3. Oil palm planting material of Yangambi 4. Oil palm planting material of Bah Jambi 5. Oil palm planting material of Marihat 6. Oil palm planting material of Avros All centers are located in North Sumatra Province.
b. Chemical Fertilizer and Insecticide Kiosk Almost all Kabupaten of South Kalimantan Province have chemical fertilizer and insecticide kiosk at Kecamatan level, but government manages fertilizer, insecticide for estate plantation with price higher than price for smallholders. However, these materials are available at Kabupaten market.
3.2.1.5 Market
World consumption of oil palm is comparable to soybean oil, these two cropping oil sources has a trend to increase year by year. Demand for crude oil palm is expected to grow in coming years and reach 40.5 million tones by the year 2010 (Oil World, 1996). While the world production is 38,273 million tones in 2010 (See Table 3.10). Of this production projection Indonesia production is at level 46.4% of world production. Most of the demand for oil palm will continue to come from within Indonesia itself, China, India, Pakistan, and Malaysia (Casson,2000). Oil palm producers are expected to increase their share in the vegetable oil market because: (a) Oil palm trees produce a much higher yield per hectare than any other
seed oil and (b) Oil palm can usually be produced more cheaply than other vegetable oils. In 2003 the oil palm share of world consumption is about 28.09% of CPO and 3.46% of palm kernel. In total it could be 31.45%. On the hand the soybean is about 31.26% then rape oil about 13.85%. These three oils are the main oil consumed by the world. The disadvantage of soybean and rape oils are extracted from seasonal crops. Each year It would be planted as a new cropping, while the oil palm is perennial crops that has cycle of 25 years to be replanting. Detailed is presented in Figure 3.2 and Table 3.9
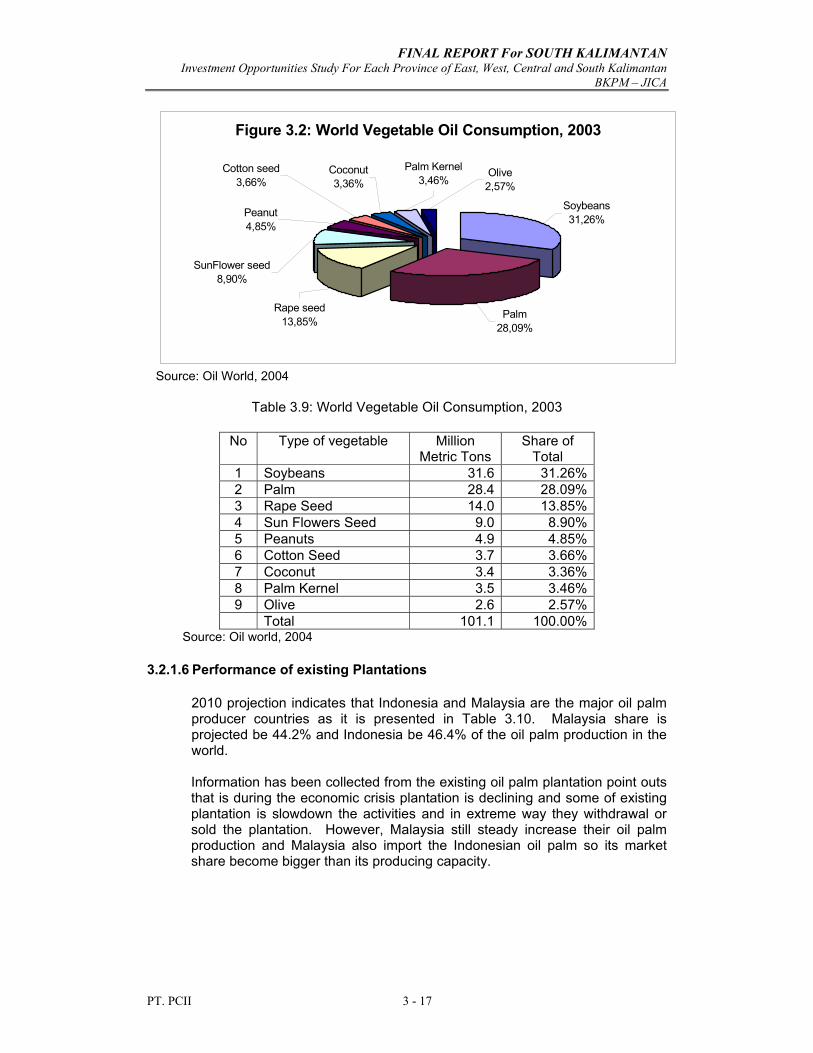
FINAL REPORT For SOUTH KALIMANTAN Investment Opportunities Study For Each Province of East, West, Central and South Kalimantan
BKPM – JICA
PT. PCII 3 - 17
Figure 3.2: World Vegetable Oil Consumption, 2003
Palm Kernel3,46%
Olive2,57%
Rape seed13,85%
SunFlower seed8,90%
Cotton seed3,66%
Peanut4,85%
Coconut3,36%
Palm28,09%
Soybeans31,26%
Source: Oil World, 2004
Table 3.9: World Vegetable Oil Consumption, 2003
No Type of vegetable Million Metric Tons
Share of Total
1 Soybeans 31.6 31.26% 2 Palm 28.4 28.09% 3 Rape Seed 14.0 13.85% 4 Sun Flowers Seed 9.0 8.90% 5 Peanuts 4.9 4.85% 6 Cotton Seed 3.7 3.66% 7 Coconut 3.4 3.36% 8 Palm Kernel 3.5 3.46% 9 Olive 2.6 2.57% Total 101.1 100.00%
Source: Oil world, 2004
3.2.1.6 Performance of existing Plantations
2010 projection indicates that Indonesia and Malaysia are the major oil palm producer countries as it is presented in Table 3.10. Malaysia share is projected be 44.2% and Indonesia be 46.4% of the oil palm production in the world. Information has been collected from the existing oil palm plantation point outs that is during the economic crisis plantation is declining and some of existing plantation is slowdown the activities and in extreme way they withdrawal or sold the plantation. However, Malaysia still steady increase their oil palm production and Malaysia also import the Indonesian oil palm so its market share become bigger than its producing capacity.
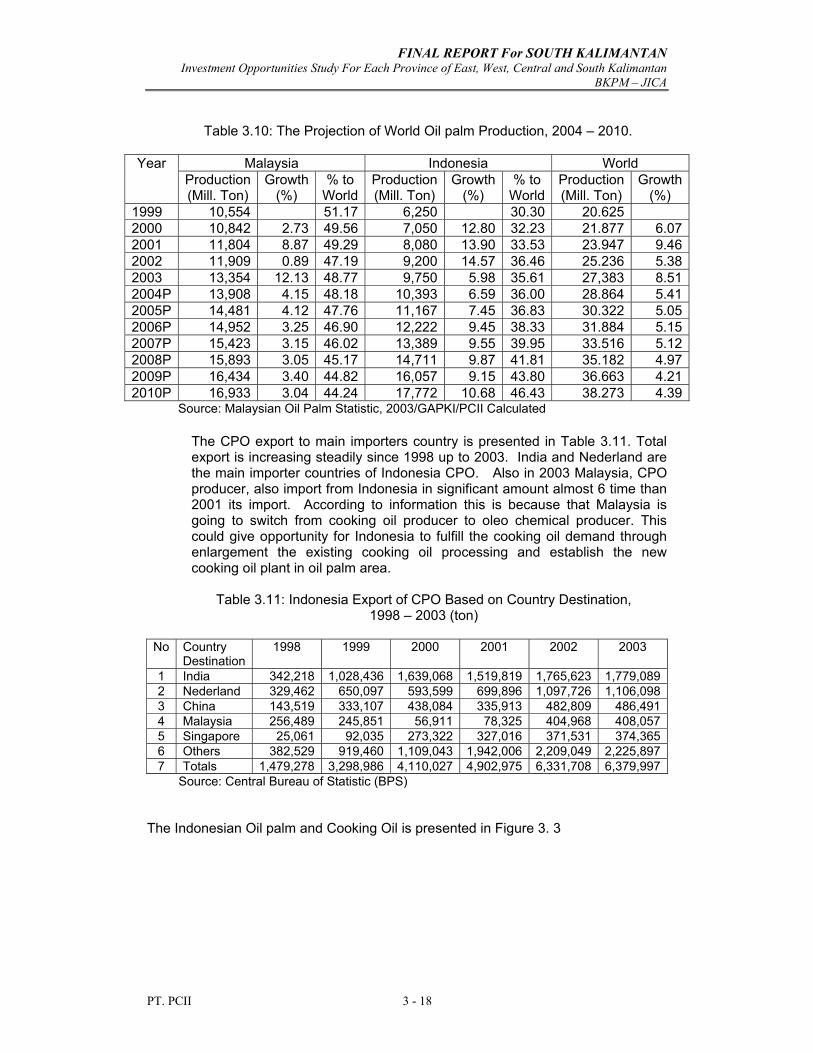
FINAL REPORT For SOUTH KALIMANTAN Investment Opportunities Study For Each Province of East, West, Central and South Kalimantan
BKPM – JICA
PT. PCII 3 - 18
Table 3.10: The Projection of World Oil palm Production, 2004 – 2010.
Malaysia Indonesia World Year
Production (Mill. Ton)
Growth (%)
% to World
Production(Mill. Ton)
Growth (%)
% to World
Production (Mill. Ton)
Growth (%)
1999 10,554 51.17 6,250 30.30 20.625 2000 10,842 2.73 49.56 7,050 12.80 32.23 21.877 6.072001 11,804 8.87 49.29 8,080 13.90 33.53 23.947 9.462002 11,909 0.89 47.19 9,200 14.57 36.46 25.236 5.382003 13,354 12.13 48.77 9,750 5.98 35.61 27,383 8.512004P 13,908 4.15 48.18 10,393 6.59 36.00 28.864 5.412005P 14,481 4.12 47.76 11,167 7.45 36.83 30.322 5.052006P 14,952 3.25 46.90 12,222 9.45 38.33 31.884 5.152007P 15,423 3.15 46.02 13,389 9.55 39.95 33.516 5.122008P 15,893 3.05 45.17 14,711 9.87 41.81 35.182 4.972009P 16,434 3.40 44.82 16,057 9.15 43.80 36.663 4.212010P 16,933 3.04 44.24 17,772 10.68 46.43 38.273 4.39
Source: Malaysian Oil Palm Statistic, 2003/GAPKI/PCII Calculated
The CPO export to main importers country is presented in Table 3.11. Total export is increasing steadily since 1998 up to 2003. India and Nederland are the main importer countries of Indonesia CPO. Also in 2003 Malaysia, CPO producer, also import from Indonesia in significant amount almost 6 time than 2001 its import. According to information this is because that Malaysia is going to switch from cooking oil producer to oleo chemical producer. This could give opportunity for Indonesia to fulfill the cooking oil demand through enlargement the existing cooking oil processing and establish the new cooking oil plant in oil palm area.
Table 3.11: Indonesia Export of CPO Based on Country Destination, 1998 – 2003 (ton)
No Country
Destination 1998 1999 2000 2001 2002 2003
1 India 342,218 1,028,436 1,639,068 1,519,819 1,765,623 1,779,0892 Nederland 329,462 650,097 593,599 699,896 1,097,726 1,106,0983 China 143,519 333,107 438,084 335,913 482,809 486,4914 Malaysia 256,489 245,851 56,911 78,325 404,968 408,0575 Singapore 25,061 92,035 273,322 327,016 371,531 374,3656 Others 382,529 919,460 1,109,043 1,942,006 2,209,049 2,225,8977 Totals 1,479,278 3,298,986 4,110,027 4,902,975 6,331,708 6,379,997
Source: Central Bureau of Statistic (BPS) The Indonesian Oil palm and Cooking Oil is presented in Figure 3. 3
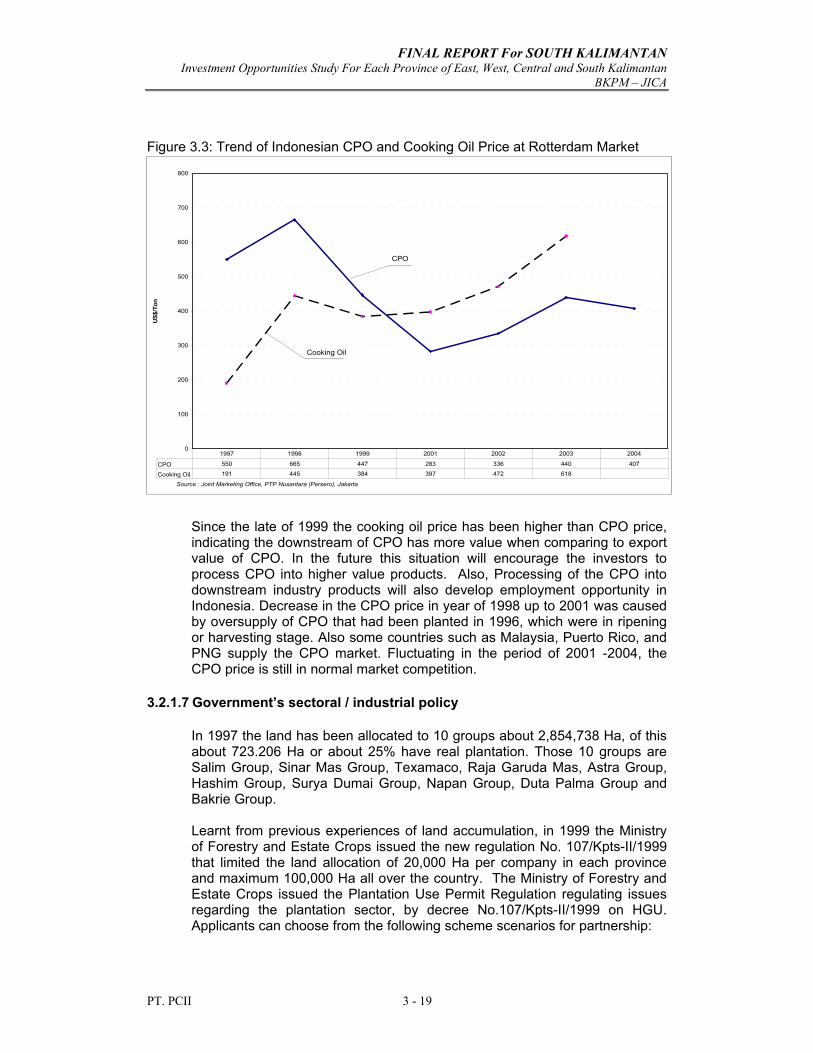
FINAL REPORT For SOUTH KALIMANTAN Investment Opportunities Study For Each Province of East, West, Central and South Kalimantan
BKPM – JICA
PT. PCII 3 - 19
0
100
200
300
400
500
600
700
800
US$
/Ton
CPO 550 665 447 283 336 440 407
Cooking Oil 191 445 384 397 472 618
1997 1998 1999 2001 2002 2003 2004
Source : Joint Marketing Office, PTP Nusantara (Persero), Jakarta
CPO
Cooking Oil
Figure 3.3: Trend of Indonesian CPO and Cooking Oil Price at Rotterdam Market
Since the late of 1999 the cooking oil price has been higher than CPO price, indicating the downstream of CPO has more value when comparing to export value of CPO. In the future this situation will encourage the investors to process CPO into higher value products. Also, Processing of the CPO into downstream industry products will also develop employment opportunity in Indonesia. Decrease in the CPO price in year of 1998 up to 2001 was caused by oversupply of CPO that had been planted in 1996, which were in ripening or harvesting stage. Also some countries such as Malaysia, Puerto Rico, and PNG supply the CPO market. Fluctuating in the period of 2001 -2004, the CPO price is still in normal market competition.
3.2.1.7 Government’s sectoral / industrial policy
In 1997 the land has been allocated to 10 groups about 2,854,738 Ha, of this about 723.206 Ha or about 25% have real plantation. Those 10 groups are Salim Group, Sinar Mas Group, Texamaco, Raja Garuda Mas, Astra Group, Hashim Group, Surya Dumai Group, Napan Group, Duta Palma Group and Bakrie Group. Learnt from previous experiences of land accumulation, in 1999 the Ministry of Forestry and Estate Crops issued the new regulation No. 107/Kpts-II/1999 that limited the land allocation of 20,000 Ha per company in each province and maximum 100,000 Ha all over the country. The Ministry of Forestry and Estate Crops issued the Plantation Use Permit Regulation regulating issues regarding the plantation sector, by decree No.107/Kpts-II/1999 on HGU. Applicants can choose from the following scheme scenarios for partnership:
FINAL REPORT For SOUTH KALIMANTAN Investment Opportunities Study For Each Province of East, West, Central and South Kalimantan
BKPM – JICA
PT. PCII 3 - 20
(a) Management operator: A plantation company is given a mandate to operate the cooperative plantations on fee basis;
(b) 35:65 equity ownership: Cooperative will buy 35% stake of the plantation owner’s equity or will inject the equivalent amount of money;
(c) 20:80 equity ownership: Instead of injecting funds into plantation companies, cooperative will provide land. In return, they can own 20 percent stake in a plantation;
(d) Build, Operate and Transfer (BOT): Under this scheme, the plantation is owned by cooperatives from the tree planting stage, and transfers the operation to the cooperative after 15 years. During the 15 years, expenses and income are to be recorded by the plantation company; and
(e) Mortgage system: This allows cooperatives to borrow money from banks to finance the acquisition of plantations from developers. The principal along with the interest will be repaid over several years
Current various regulations should to be reviewed to attractive investor but Nucleus and Plasma (PIR) scheme should be promoted under which technical support and market access will be provided improving welfare of smallholder For business that needs bulky raw materials such as CPO the factory should be built close to oil palm plantation. In 2003, establishment 155,668 Ha oil palm plantations so the oil palm is under harvesting stage. Yield oil palm is estimated at 2 ton CPO per hectare then in total the CPO would be at least 311,336 ton all over South Kalimantan. At present the CPO is ship to Java or Sulawesi or abroad for further processing to end products, such as cooking oil, margarine, oleo chemical etc.
3.2.1.8 Plantation Business Permit Procedure
As procedures for the Plantation Business Permit (based on SK The Minister of Forestry and Estate Crop No. 107/Kpts-II/1999), investors should submit an application letter to Minister of Agriculture through Director General of Plantation Production Management, with acquired recommendation letters of the Province Estate Crop Service and other required letters shown below:
1. Principle land use permit issued by concerned Bupati; 2. Technical consideration and recommendation on availability of land issued
by Province Forestry Service; 3. Recommendation letter issued by Governor; 4. Plantation business plan; 5. Tax Number of Principal (NPWP); 6. Company establishment documents; 7. Map of proposed plantation site, size 1:100,000 8. Land Ownership Statement that verifies land owned by firm or its group
does not exceeded the maximum land allowable, issued by firm or its group;
All of this should be managed in Nucleus and Plasma (PIR) Scheme or in private company plantation.
FINAL REPORT For SOUTH KALIMANTAN Investment Opportunities Study For Each Province of East, West, Central and South Kalimantan
BKPM – JICA
PT. PCII 3 - 21
3.2.1.9 Possibility of Down Stream Industry of CPO
Palm Olein is the liquid fraction obtained by the fractionation of palm oil after crystallization at controlled temperature, such as: a. Cooking oil
Cooking oil is the easiest product to be processed as downstream industry prodcuct of palm oil. CPO is processed through saturation process to get the clean cooking oil then bottling and packaging to market. Currently the cooking oil is the most acceptable product generated from the palm oil plantation. Unfortunately the cooking oil processing have been established in East Java, Jakarta, West Java, North Sumatra, Riau, and North Sulawesi. Cooking oil mostly sold in domestic market such as mall, plaza, and retailed as well.
b. Margarine Margarine is a water-in-oil emulsion and is used as an alternative to butter. Industrial margarine with a buttery flavor and aroma is excellent for the production of biscuits, cakes, wafers, puff pastry, etc.
c. Shortening Shortening is originally formulated as substitute for lard. One of its most important characteristics is to tenderize or shorten baked products.
d. Deep Frying Fat Deep frying fat produced from palm oil fractionhas a very high resistance to oxidation and gumming, low smoking, foaming and darkening. And also it has nutrionally good fatty acid composition together with an extra long shelf life.
e. Palm Stearin Palm stearin is a more solid fraction than palm olein obtained by fraction of palm oil after crystallization at controlled temperatures. Palm stearin is a very useful source of a fully natural hard fat composing products such as shortenings, margarine, etc.
f. Palm Fatty Acid Distillate Palm fatty acid distillate is widely used for animal feed, rubber processing, the flavor and fragrance industry, manufacturing candles, cosmetics, toiletries and pharmaceutical products.
At present, of those possible CPO downstream industries the cooking oil industry is the most feasible to be established in South Kalimantan area. It requires relatively small starting capital and the labor for this industry is relatively easy to be trained
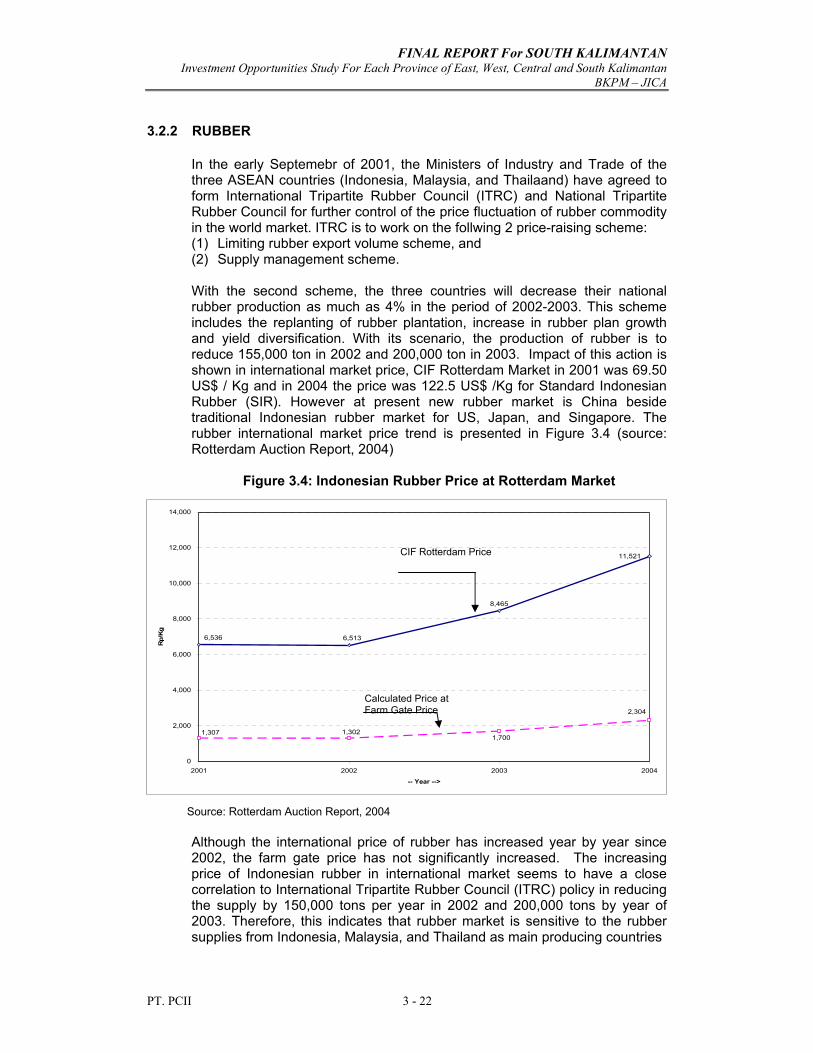
FINAL REPORT For SOUTH KALIMANTAN Investment Opportunities Study For Each Province of East, West, Central and South Kalimantan
BKPM – JICA
PT. PCII 3 - 22
3.2.2 RUBBER
In the early Septemebr of 2001, the Ministers of Industry and Trade of the three ASEAN countries (Indonesia, Malaysia, and Thailaand) have agreed to form International Tripartite Rubber Council (ITRC) and National Tripartite Rubber Council for further control of the price fluctuation of rubber commodity in the world market. ITRC is to work on the follwing 2 price-raising scheme: (1) Limiting rubber export volume scheme, and (2) Supply management scheme. With the second scheme, the three countries will decrease their national rubber production as much as 4% in the period of 2002-2003. This scheme includes the replanting of rubber plantation, increase in rubber plan growth and yield diversification. With its scenario, the production of rubber is to reduce 155,000 ton in 2002 and 200,000 ton in 2003. Impact of this action is shown in international market price, CIF Rotterdam Market in 2001 was 69.50 US$ / Kg and in 2004 the price was 122.5 US$ /Kg for Standard Indonesian Rubber (SIR). However at present new rubber market is China beside traditional Indonesian rubber market for US, Japan, and Singapore. The rubber international market price trend is presented in Figure 3.4 (source: Rotterdam Auction Report, 2004)
Figure 3.4: Indonesian Rubber Price at Rotterdam Market
Source: Rotterdam Auction Report, 2004
Although the international price of rubber has increased year by year since 2002, the farm gate price has not significantly increased. The increasing price of Indonesian rubber in international market seems to have a close correlation to International Tripartite Rubber Council (ITRC) policy in reducing the supply by 150,000 tons per year in 2002 and 200,000 tons by year of 2003. Therefore, this indicates that rubber market is sensitive to the rubber supplies from Indonesia, Malaysia, and Thailand as main producing countries
6,536
8,465
6,513
11,521
1,307
2,304
1,7001,302
0
2,000
4,000
6,000
8,000
10,000
12,000
14,000
2001 2002 2003 2004
-- Year -->
Rp/
Kg
Calculated Price at Farm Gate Price
CIF Rotterdam Price
FINAL REPORT For SOUTH KALIMANTAN Investment Opportunities Study For Each Province of East, West, Central and South Kalimantan
BKPM – JICA
PT. PCII 3 - 23
However, a rule of thumb in agro-economic phenomena, individual can not influence the market it should be in common action but whenever the market price establish every individual country will go to the market so the price will be going down. ITRC should strength their cooperation and invite the other rubber producing countries to establish the common market.
3.2.2.1 Natural Resources / Raw Material
Based on their management system, rubber plantings, in Indonesia fall into three categories: Government Estate (PTP), Private Estate, and Smallholdings. In late 2003, total rubber plantings in South Kalimantan is 162,614 Ha, of this 89.18% is smallholding, 4.01% Government Estate, and 6.81% Private Estate (details see Table 3.12) Maximal rubber production can be achieved only on fertile soil, however this crop is very adaptable to poorer soil conditions and can be cultivated on soils of lower fertility such as red yellow podlsolics, latososl, and alluvial as well. Also rubber is tolerant of a wide soil reaction of soil acidity from pH 3.6 to 8 and the most suitable range is pH 5 to 6. This, such conditions mostly found in Kabupaten Tabalong, Hulu Sungai Utara, Hulu Sungai Selatan, Hulu Sungai Tengah, Tapin, and Banjar. The existing rubber plantings mostly in Kabupaten Tabalong, Hulu Sungai Utara, Hulu Sungai Tengah, Hulu Sungai Selatan, Tapin, and Banjar. Table 3.12 indicates that the Government Estate and Private Estate is not significant in rubber production. In improving the rubber plantings should be included the smallholders in win-win arrangement such as Nucleus Estate Scheme (PIR). Therefore the new investor should consider seriously this arrangement before any action taken in the filed.
Table 3.12: Area of Rubber Plantation by Type of Business Management and
Kabupaten, 2003
Kabupaten Small Holder Area
State Own Area
Private Co. Area
Total Rubber Plantation
(Ha) (Ha) (Ha) (Ha) Tabalong 43,483 -- 3,490 46,973 Hulu Sungai Utara 29,675 536 -- 30,211 Hulu Sungai Tengah 14,469 -- -- 14,469 Hulu Sungai Selatan 9,995 -- -- 9,995 Tapin 15,608 -- 990 16,598 Tanah Laut 5,059 -- 4,083 9,142 Kota Baru 2,044 -- -- 2,044 Tanah Bumbu 5,875 2,054 2,010 9,939 Banjar 18,745 3,928 502 23,175 Barito Kuala 68 -- -- 68 Total 145,921 6,518 11,075 163,514
Source: Plantation Agency of South Kalimantan Province, 2003
Of total existing rubber plantings 40,818 Ha is very old trees and in damaging condition. Of 40,818 Ha the smallholdings is 36,938 Ha, Private Estate 2,380 Ha, and Government Estate 1,500 Ha.
FINAL REPORT For SOUTH KALIMANTAN Investment Opportunities Study For Each Province of East, West, Central and South Kalimantan
BKPM – JICA
PT. PCII 3 - 24
Data indicates that 25,126 Ha of the young rubber plantings have been, Of this total 20,991 Ha has done by smallholdings, 3,164 Ha by Private Estate, and 971 Ha by Government Estate. To maintain the good price of rubber the replanting is the strategic way instead of opening of the new plantation. This newly replanting area could produce the rubber for new market of China. Local Government of South Kalimantan, in 2004, has replanting the smallholding rubber at 500 Ha and in fiscal year 2005 the target is 1,000 Ha in order to recovery the old rubber or damaging trees. As total local government target is 36,938 Ha equal to area that belong to smallholders. New investors could participate in rubber replanting program under PIR scheme, whether in improving the rubber processing and improving the rubber sheet quality that could meet the international market requirement. The new investors can improve the processing models that could process the rubber to meet the international quality. By inviting the new investors in replanting program the local government could speed up the rubber plantings rehabilitation with out facing the government budget constraints. For this purpose the Government of South Kalimantan could offer the incentives. For example accelerate of depreciation, amortization, free tax of dividend for certain period, compensation of lost/risk, etc. And to investor are expected to set up a partnership with smallholder in the form of Nucleus and Plasma (PIR) Scheme.
Smallholdings rubber yield is 900.8 Kg/Ha, Private Estate is 1,481.91 Kg/Ha, and Government Estate is 1,158.10 Kg/Ha, and average yield for South Kalimantan is 944.82 Kg/Ha. The low of rubber yield of smallholding is because most of them not using the un-recommended planting materials. Low yield of smallholdings rubber has impact to raw material supply to 7 (seven) rubber processing plants that existing in South Kalimantan. To overcome this problems the processing plants buy the rubber raw material about 50% from South Kalimantan, 30% from Central Kalimantan, 10% from East Kalimantan, 5% from West Kalimantan, and 5% from Java. Among this supply area the Central and South Kalimantan would be the most promising area in providing the raw materials for rubber processing of South Kalimantan Province. Therefore the Kabupaten Barito Timur, Barito Selatan, Barito Utara, and Kapuas of Central Kalimantan Province should cooperate in rubber plantation development with Kabupatens of northern part of South Kalimantan Province. These areas have a common water transportation system of Barito and Kapuas. While the East Kalimantan would be minor supplier, and rubber from Java needs sea communication and rivers as well.
3.2.2.2 Infrastructure
A. Trisakti Harbor Rubber processing plants are located along the Barito River of Banjarmasin. Banjarmasin as it was preneted in Chapter 2, is accessible to the northern part of South Kalimantan by inland and water transportation pass through Barito and Kapuas rivers. Also, Trisakti harbor Serves both interisland and international shipment.
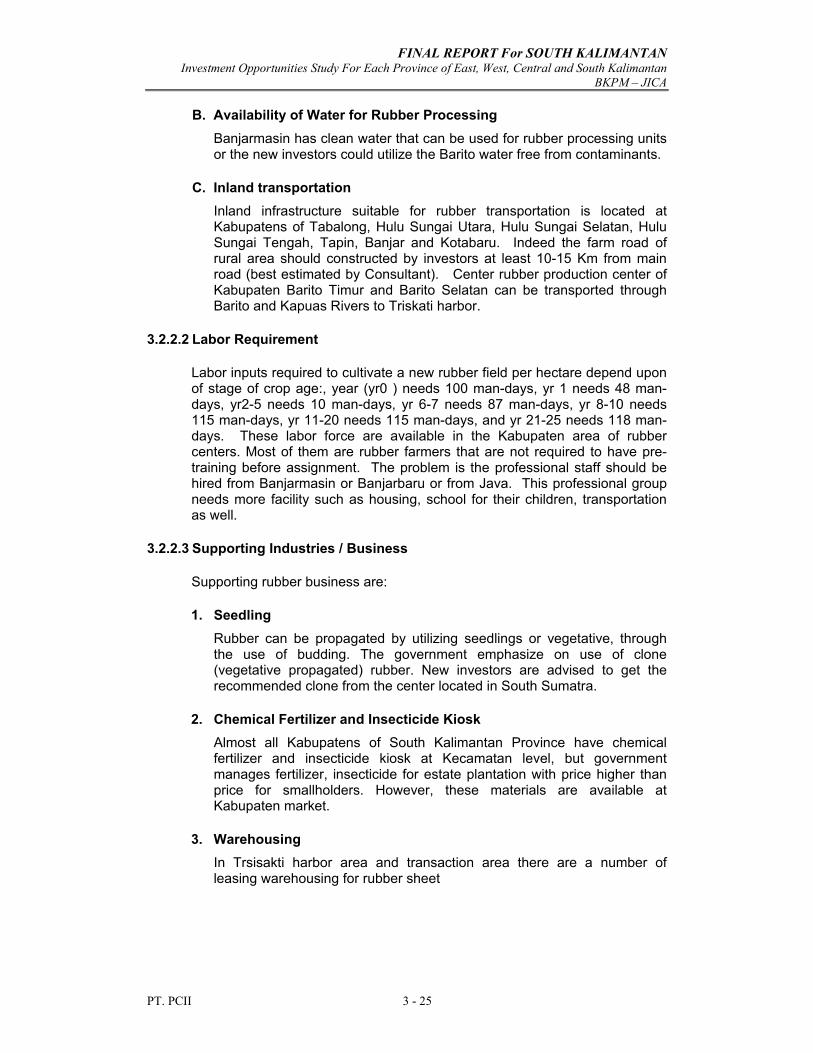
FINAL REPORT For SOUTH KALIMANTAN Investment Opportunities Study For Each Province of East, West, Central and South Kalimantan
BKPM – JICA
PT. PCII 3 - 25
B. Availability of Water for Rubber Processing Banjarmasin has clean water that can be used for rubber processing units or the new investors could utilize the Barito water free from contaminants.
C. Inland transportation Inland infrastructure suitable for rubber transportation is located at Kabupatens of Tabalong, Hulu Sungai Utara, Hulu Sungai Selatan, Hulu Sungai Tengah, Tapin, Banjar and Kotabaru. Indeed the farm road of rural area should constructed by investors at least 10-15 Km from main road (best estimated by Consultant). Center rubber production center of Kabupaten Barito Timur and Barito Selatan can be transported through Barito and Kapuas Rivers to Triskati harbor.
3.2.2.2 Labor Requirement
Labor inputs required to cultivate a new rubber field per hectare depend upon of stage of crop age:, year (yr0 ) needs 100 man-days, yr 1 needs 48 man-days, yr2-5 needs 10 man-days, yr 6-7 needs 87 man-days, yr 8-10 needs 115 man-days, yr 11-20 needs 115 man-days, and yr 21-25 needs 118 man-days. These labor force are available in the Kabupaten area of rubber centers. Most of them are rubber farmers that are not required to have pre-training before assignment. The problem is the professional staff should be hired from Banjarmasin or Banjarbaru or from Java. This professional group needs more facility such as housing, school for their children, transportation as well.
3.2.2.3 Supporting Industries / Business
Supporting rubber business are:
1. Seedling Rubber can be propagated by utilizing seedlings or vegetative, through the use of budding. The government emphasize on use of clone (vegetative propagated) rubber. New investors are advised to get the recommended clone from the center located in South Sumatra.
2. Chemical Fertilizer and Insecticide Kiosk Almost all Kabupatens of South Kalimantan Province have chemical fertilizer and insecticide kiosk at Kecamatan level, but government manages fertilizer, insecticide for estate plantation with price higher than price for smallholders. However, these materials are available at Kabupaten market.
3. Warehousing In Trsisakti harbor area and transaction area there are a number of leasing warehousing for rubber sheet
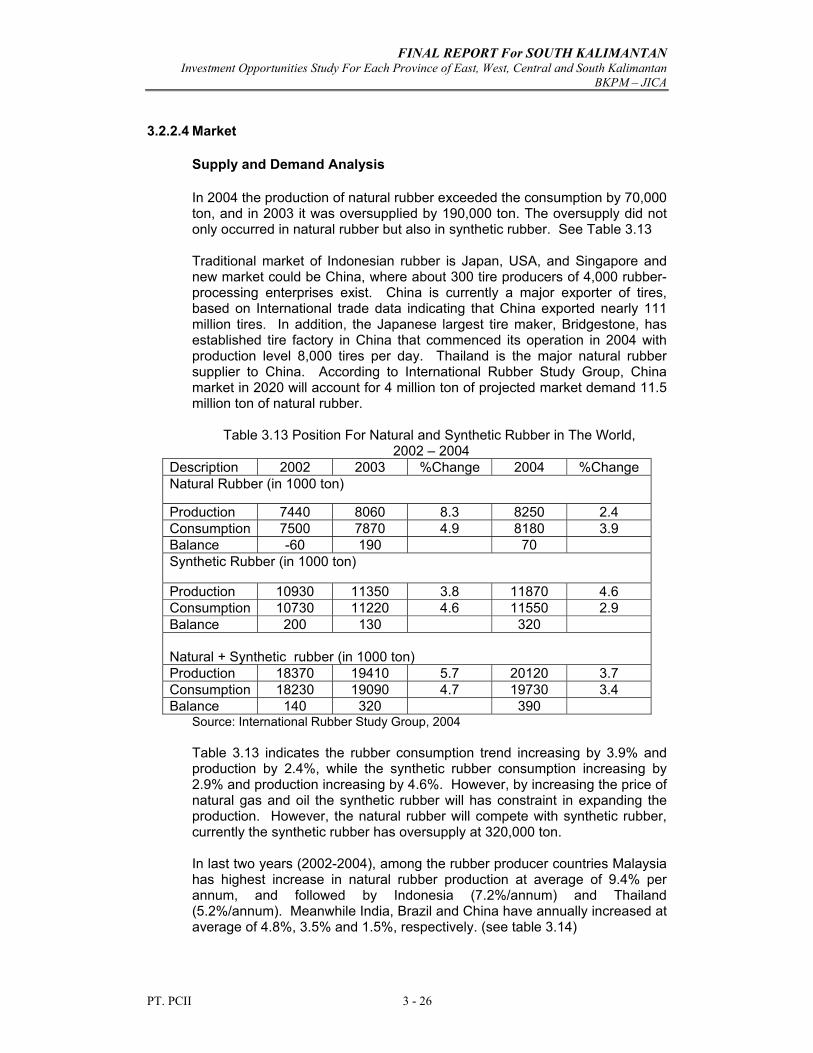
FINAL REPORT For SOUTH KALIMANTAN Investment Opportunities Study For Each Province of East, West, Central and South Kalimantan
BKPM – JICA
PT. PCII 3 - 26
3.2.2.4 Market
Supply and Demand Analysis
In 2004 the production of natural rubber exceeded the consumption by 70,000 ton, and in 2003 it was oversupplied by 190,000 ton. The oversupply did not only occurred in natural rubber but also in synthetic rubber. See Table 3.13 Traditional market of Indonesian rubber is Japan, USA, and Singapore and new market could be China, where about 300 tire producers of 4,000 rubber-processing enterprises exist. China is currently a major exporter of tires, based on International trade data indicating that China exported nearly 111 million tires. In addition, the Japanese largest tire maker, Bridgestone, has established tire factory in China that commenced its operation in 2004 with production level 8,000 tires per day. Thailand is the major natural rubber supplier to China. According to International Rubber Study Group, China market in 2020 will account for 4 million ton of projected market demand 11.5 million ton of natural rubber.
Table 3.13 Position For Natural and Synthetic Rubber in The World,
2002 – 2004 Description 2002 2003 %Change 2004 %Change Natural Rubber (in 1000 ton)
Production 7440 8060 8.3 8250 2.4 Consumption 7500 7870 4.9 8180 3.9 Balance -60 190 70 Synthetic Rubber (in 1000 ton)
Production 10930 11350 3.8 11870 4.6 Consumption 10730 11220 4.6 11550 2.9 Balance 200 130 320 Natural + Synthetic rubber (in 1000 ton) Production 18370 19410 5.7 20120 3.7 Consumption 18230 19090 4.7 19730 3.4 Balance 140 320 390
Source: International Rubber Study Group, 2004 Table 3.13 indicates the rubber consumption trend increasing by 3.9% and production by 2.4%, while the synthetic rubber consumption increasing by 2.9% and production increasing by 4.6%. However, by increasing the price of natural gas and oil the synthetic rubber will has constraint in expanding the production. However, the natural rubber will compete with synthetic rubber, currently the synthetic rubber has oversupply at 320,000 ton. In last two years (2002-2004), among the rubber producer countries Malaysia has highest increase in natural rubber production at average of 9.4% per annum, and followed by Indonesia (7.2%/annum) and Thailand (5.2%/annum). Meanwhile India, Brazil and China have annually increased at average of 4.8%, 3.5% and 1.5%, respectively. (see table 3.14)
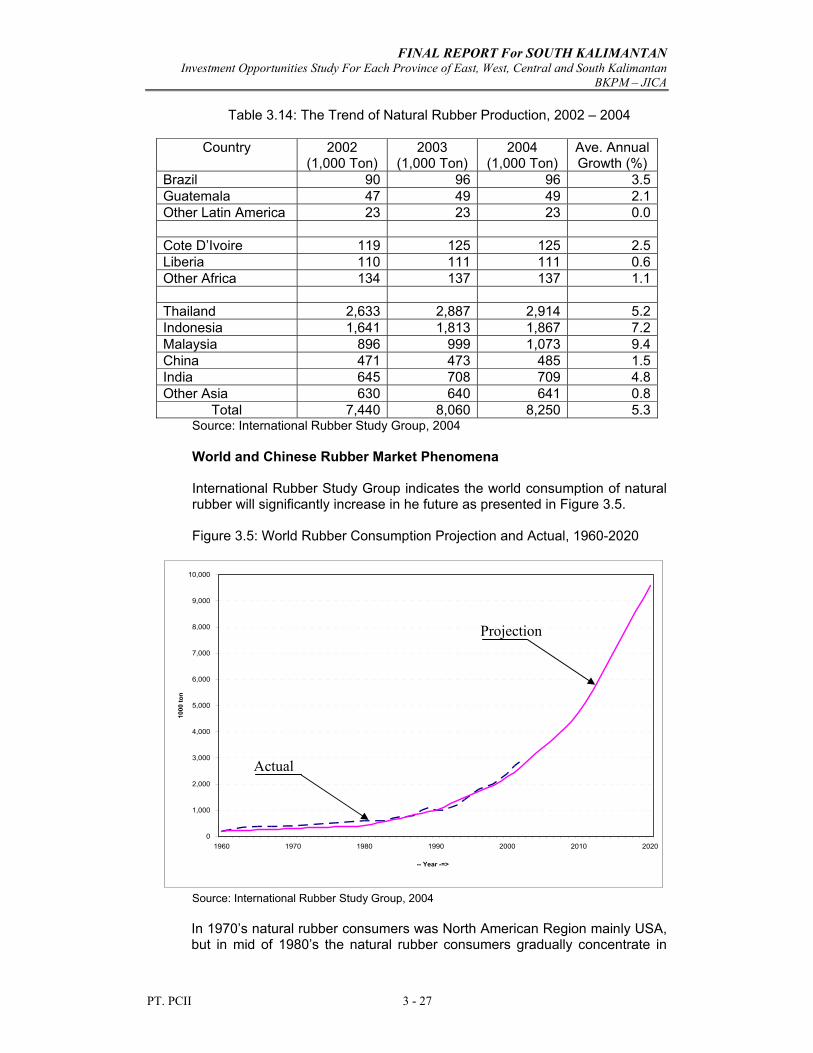
FINAL REPORT For SOUTH KALIMANTAN Investment Opportunities Study For Each Province of East, West, Central and South Kalimantan
BKPM – JICA
PT. PCII 3 - 27
0
1,000
2,000
3,000
4,000
5,000
6,000
7,000
8,000
9,000
10,000
1960 1970 1980 1990 2000 2010 2020
-- Year -=>
1000
ton
Table 3.14: The Trend of Natural Rubber Production, 2002 – 2004
Country 2002 (1,000 Ton)
2003 (1,000 Ton)
2004 (1,000 Ton)
Ave. Annual Growth (%)
Brazil 90 96 96 3.5 Guatemala 47 49 49 2.1 Other Latin America 23 23 23 0.0 Cote D’Ivoire 119 125 125 2.5 Liberia 110 111 111 0.6 Other Africa 134 137 137 1.1 Thailand 2,633 2,887 2,914 5.2 Indonesia 1,641 1,813 1,867 7.2 Malaysia 896 999 1,073 9.4 China 471 473 485 1.5 India 645 708 709 4.8 Other Asia 630 640 641 0.8
Total 7,440 8,060 8,250 5.3 Source: International Rubber Study Group, 2004 World and Chinese Rubber Market Phenomena International Rubber Study Group indicates the world consumption of natural rubber will significantly increase in he future as presented in Figure 3.5. Figure 3.5: World Rubber Consumption Projection and Actual, 1960-2020 Source: International Rubber Study Group, 2004
In 1970’s natural rubber consumers was North American Region mainly USA, but in mid of 1980’s the natural rubber consumers gradually concentrate in
Actual
Projection
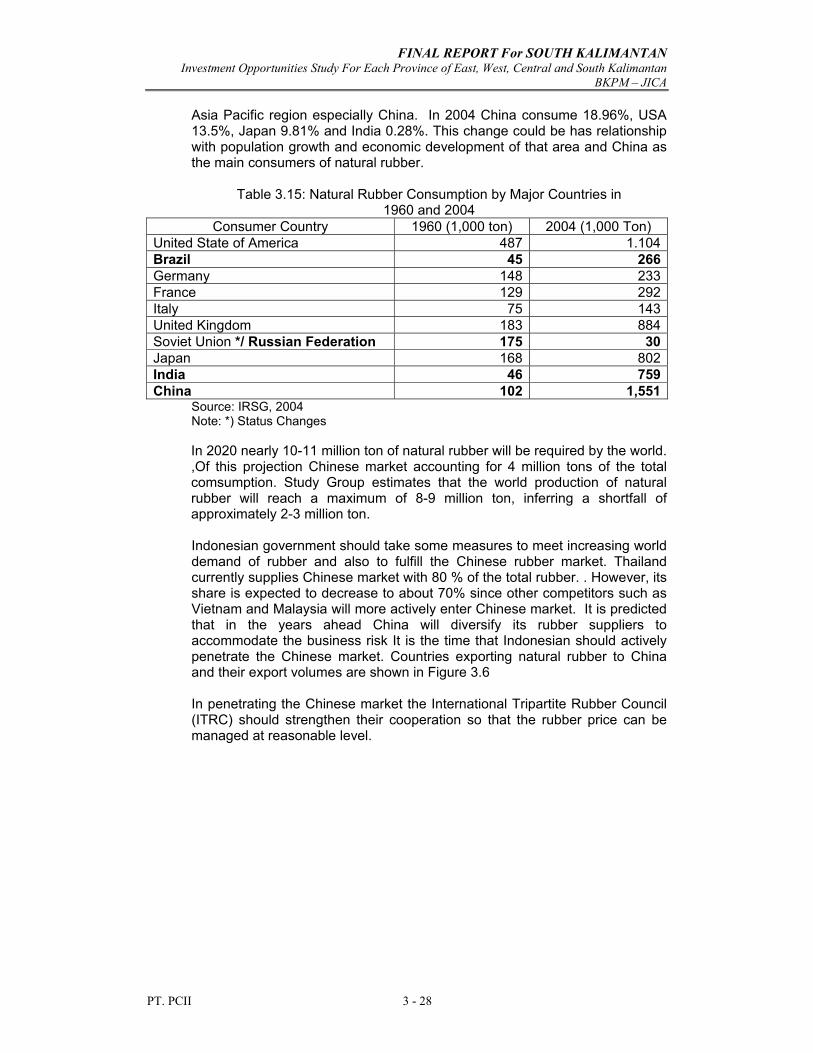
FINAL REPORT For SOUTH KALIMANTAN Investment Opportunities Study For Each Province of East, West, Central and South Kalimantan
BKPM – JICA
PT. PCII 3 - 28
Asia Pacific region especially China. In 2004 China consume 18.96%, USA 13.5%, Japan 9.81% and India 0.28%. This change could be has relationship with population growth and economic development of that area and China as the main consumers of natural rubber.
Table 3.15: Natural Rubber Consumption by Major Countries in 1960 and 2004
Consumer Country 1960 (1,000 ton) 2004 (1,000 Ton) United State of America 487 1.104Brazil 45 266Germany 148 233France 129 292Italy 75 143United Kingdom 183 884Soviet Union */ Russian Federation 175 30Japan 168 802India 46 759China 102 1,551
Source: IRSG, 2004 Note: *) Status Changes In 2020 nearly 10-11 million ton of natural rubber will be required by the world. ,Of this projection Chinese market accounting for 4 million tons of the total comsumption. Study Group estimates that the world production of natural rubber will reach a maximum of 8-9 million ton, inferring a shortfall of approximately 2-3 million ton. Indonesian government should take some measures to meet increasing world demand of rubber and also to fulfill the Chinese rubber market. Thailand currently supplies Chinese market with 80 % of the total rubber. . However, its share is expected to decrease to about 70% since other competitors such as Vietnam and Malaysia will more actively enter Chinese market. It is predicted that in the years ahead China will diversify its rubber suppliers to accommodate the business risk It is the time that Indonesian should actively penetrate the Chinese market. Countries exporting natural rubber to China and their export volumes are shown in Figure 3.6 In penetrating the Chinese market the International Tripartite Rubber Council (ITRC) should strengthen their cooperation so that the rubber price can be managed at reasonable level.
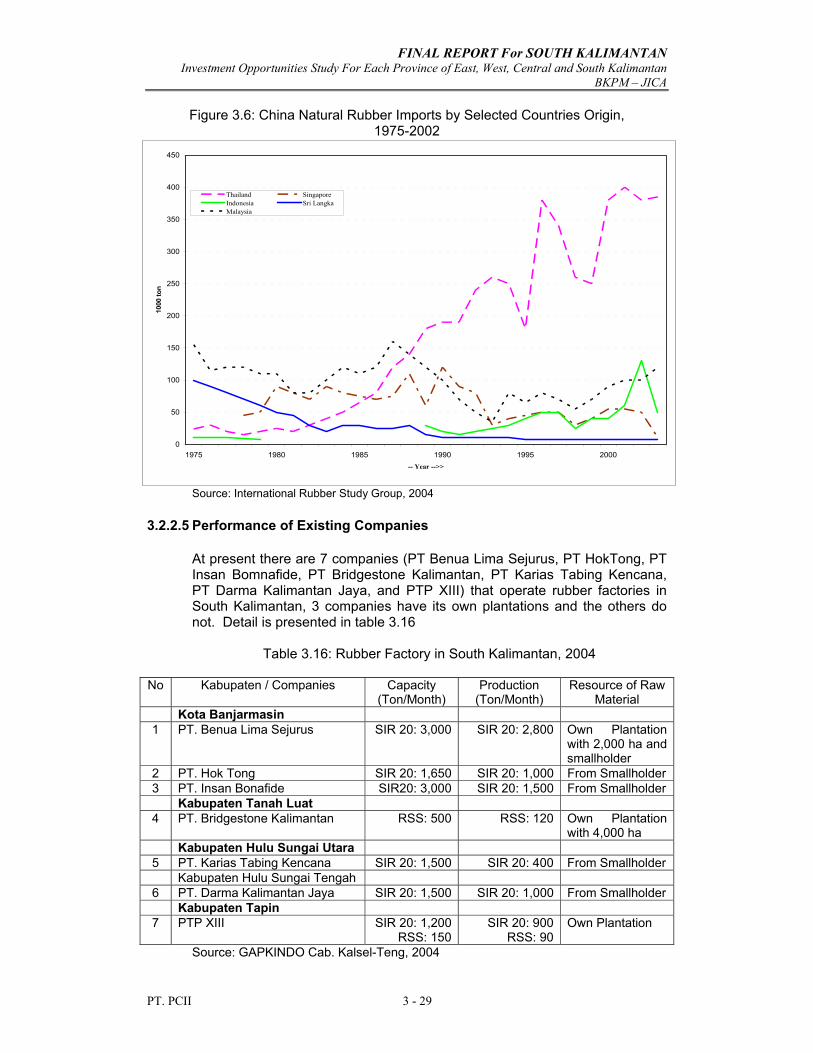
FINAL REPORT For SOUTH KALIMANTAN Investment Opportunities Study For Each Province of East, West, Central and South Kalimantan
BKPM – JICA
PT. PCII 3 - 29
0
50
100
150
200
250
300
350
400
450
1975 1980 1985 1990 1995 2000-- Year -->>
1000
ton
Thailand SingaporeIndonesia Sri LangkaMalaysia
Figure 3.6: China Natural Rubber Imports by Selected Countries Origin, 1975-2002
Source: International Rubber Study Group, 2004
3.2.2.5 Performance of Existing Companies
At present there are 7 companies (PT Benua Lima Sejurus, PT HokTong, PT Insan Bomnafide, PT Bridgestone Kalimantan, PT Karias Tabing Kencana, PT Darma Kalimantan Jaya, and PTP XIII) that operate rubber factories in South Kalimantan, 3 companies have its own plantations and the others do not. Detail is presented in table 3.16
Table 3.16: Rubber Factory in South Kalimantan, 2004
No Kabupaten / Companies Capacity (Ton/Month)
Production (Ton/Month)
Resource of Raw Material
Kota Banjarmasin 1 PT. Benua Lima Sejurus SIR 20: 3,000 SIR 20: 2,800 Own Plantation
with 2,000 ha and smallholder
2 PT. Hok Tong SIR 20: 1,650 SIR 20: 1,000 From Smallholder 3 PT. Insan Bonafide SIR20: 3,000 SIR 20: 1,500 From Smallholder Kabupaten Tanah Luat
4 PT. Bridgestone Kalimantan RSS: 500 RSS: 120 Own Plantation with 4,000 ha
Kabupaten Hulu Sungai Utara 5 PT. Karias Tabing Kencana SIR 20: 1,500 SIR 20: 400 From Smallholder Kabupaten Hulu Sungai Tengah
6 PT. Darma Kalimantan Jaya SIR 20: 1,500 SIR 20: 1,000 From Smallholder Kabupaten Tapin
7 PTP XIII SIR 20: 1,200RSS: 150
SIR 20: 900RSS: 90
Own Plantation
Source: GAPKINDO Cab. Kalsel-Teng, 2004
FINAL REPORT For SOUTH KALIMANTAN Investment Opportunities Study For Each Province of East, West, Central and South Kalimantan
BKPM – JICA
PT. PCII 3 - 30
Up to 1998, one of rubber factory of South Kalimantan has used to be produced the glove, unfortunately in 1999 this factory is fired and up to this moment the factory owner not rehabilitate the factory yet.
3.2.2.6 Government’s Sectoral/Industry Policy In line with National Rubber Council the Province of South Kalimantan has policy to promote the rubber replanting program for smallholders. In the fiscal year of 2004 and 2005 about 1,500 Ha is to be replanted by smallholders at Kabupaten Tabalong, Hulu Sungai Utara, and Banjar. In addition to this direct action program, the local government encourages the private and government estates to participate in replanting of the smallholding rubber plantations in win-win arrangement such as PIR (Nucleus and Plasma Scheme).
3.2.2.7 Possibility of Down Stream Industry of Rubber Abundant natural rubber in South Kalimantan could encourage the downstream industries of rubber products, such as latex, rubber sheet, rubber crepe, and crumb rubber to process into end using products:
a. Health and Laboratory equipments such as: Stethoscope nose, Condom, Glove, Diaphragm (Family planning goods), rubber nose, pharmacy equipment etc.
b. Rubber Foam c. Children necessities such as toy, balloon, milk bottle etc. d. Vehicle necessities and parts such as tyres, brake canvass, etc. e. Home necessities.
3.2.2.8 Opportunities of Up Stream Business of Rubber Considering the fact that installed capacity of rubber processing exceeds the raw material supply and production of rubber products is limited by ITRC policy, local government should encourage the private and government estate to participate in rubber replanting and to facilitate smallholders accessing to rubber replanting technology. One of the businesses that can be offered to private companies is rubber seedling nursery business. It is suggested that in motivating the investors willingness to involve in seedling nursery business, each investor be authorized to deal with certain rubber smallholding area in contract farming system. For contract farming system, smallholders and investor sign the contract in which the investor will supply the recommended seedling and has obligation to buy its product, while the smallholders should practice all recommended technology given by investor. The sale price should be based on market price at the moment of rubber delivery. Even though the existing (2004) installed capacity of rubber processing industries exceed raw material supplies, in the long run by ever increasing price of oil and natural gas, the natural rubber will be more competitive than synthetic rubber. Meanwhile more rubber planting area is expanding /replanting by smallholder with better seed quality, better productivity and waiting for mature stage for harvest. Rubber processing industries to produce SIR and RSS are also to be promoted in South Kalimantan to anticipate the increasing world market demand of natural rubber. In the future, this integrated industry of rubber from seedling, replanting, trading and processing industries become a strategic investment opportunity
FINAL REPORT For SOUTH KALIMANTAN Investment Opportunities Study For Each Province of East, West, Central and South Kalimantan
BKPM – JICA
PT. PCII 3 - 31
3.2.3 BRACKISH WATER SHRIMP AQUACULTURE
3.2.3.1 Natural Resources / Raw Material
The area of brackish water with about 53,382 ha spreading over the coastal area of South Kalimantan has a great potential in shrimp aquaculture. Brackish water shrimp farms are located in Kabupatens of Tanah Laut, Tanah Bumbu, and Kotabaru. Investment opportunities are still widely opened for about 48,593.5 Ha.
Table 3.17: Potential and Exploitation of Brackish water Area, 2003
No Kabupaten Potential (Ha)
Exploited (Ha)
Remains (Ha)
1 Kabupaten Tanah Laut 12,542.0 2,144.0 10,398.0 2 Kabupaten Tanah Bumbu 14,400.0 1,294.0 13,106.0 3 Kabupaten Kotabaru 26,350.0 1,279.0 25,071.0 4 Kabupaten Banjar 90.0 71.5 18.5 5 Kabupaten Barito Kuala 0.0 1.1 0.0 Total 53,382.0 4,860.6 48,593.5
Source: Fisheries and Marine Agency of South Kalimantan Province, 2004 Some of the brackish water aquaculture is cultivated for the Giant Tiger Prawn (Paneus monodon) and the rest for milkfish or mixed between milkfish and shrimp. However, the milkfish market mostly in Java Island not in local due to population of South Kalimantan not so familiar to consume this species. The Giant Tiger Prawn (udang windu) has good market in both local and overseas market. At present the shrimp brackish water is estimated at 4,860 Ha and its production has increasing trend by average 1.47% annually, while the milkfish has increasing by 49.50% annually. See Table 3.18. This remarkable increasing could be because of a lot of milkfish fry come to the existing ponds and the milkfish is not the main products of brackish water aquaculture of the area. On the other hand the capture shrimp production from seawater and freshwater is decreasing, this indicates that the cultivated shrimp has steadily increased. (Table 3.19)
Table 3.18: Cultivated Shrimp and Milkfish Production in Brackish water Ponds, 1998 – 2003
Year Shrimp (Ton) Milkfish (Ton) 1998 1,998.0 103.2 1999 1,708.5 515.4 2000 2,293.7 41.4 2001 2,463.7 272.2 2002 2,343.2 475.9 2003 2,149.5 770.6
Average annual growth 1998-2003 1.47% 49.50% Source: Fisheries and Marine Agency of South Kalimantan Province, 2004
FINAL REPORT For SOUTH KALIMANTAN Investment Opportunities Study For Each Province of East, West, Central and South Kalimantan
BKPM – JICA
PT. PCII 3 - 32
Table 3.19: Trend of Shrimp Production from Seawater, Freshwater, and Cultivated in South Kalimantan
Catching (Ton) Year Cultivated
(Ton) Sea Area Freshwater 1998 1,998.0 26,649.0 4,630.8 1999 1,708.5 36,721.1 3,789.3 2000 2,293.7 34,595.5 3,843.0 2001 2,463.7 38,866.8 3,960.1 2002 2,343.2 25,434.7 2,794.3 2003 2,149.5 24,405.0 2,672.9
Average annual growth 1998-2003
1.47% -1.74% -10.4%
Source: Fisheries and Marine Agency of South Kalimantan Province, 2004 Natural resources in term of land suitability and facilities for brackishwater aquaculture, primary and secondary canals already existing in: a. Kabupaten Kotabaru, at Kecamatan. Pamukan Selatan, Sampanahan,
Kelumpang Utara, Kelumpang Tengah, Kelumpang Selatan, and Pulau Laut.
b. Kabupaten Tanah Bumbu, at Kecamatan Sungai Loban. c. Kabupaten Tanah Laut, at Kurau, Takisung and Kintap. d. Kabupaten Banjar, at Kecamatan Aluh-aluh. e. Kabupaten Barito Kuala, at Kecamatan Tabunganen.
3.2.3.2 Infrastructure
Transportation Roads for the brackish water aquaculture area are relatively good and passable by motorbike and four-wheel vehicle, and especially the main access road to Kabupaten is a good condition.
Canal The government has built brackish water pond canal in Muara Kintap, Kabupaten Tanah Laut and Sungai Loban, Kabupaten Tanah Bumbu. The brackish water pond canal capacity in Muara Kintap able to supply the water to around 500 ha and for the Sungai Loban area is around 430 ha. The establishment of the Sungai Loban canal plan is to supply water around 1,200 ha and it will complete in next three fiscal years.
Harbor/Port There are 1 (one) special port fish, called seashore fisheries port (PPP) in Banjarmasin and 4 (four) Fish Landing Place in Muara Kintap and Jorong at Kabupaten Tanah Laut, Pagatan and Batulicin at Kabupaten Tanah Bumbu
3.2.3.3 Labor Requirement
Brackish water aquaculture needs professional staff in water quality management, fish biologist, fish quality control in HACCP (Hazard Analysis Control Critical Points), a procedure to control the food industry products applied in almost all major countries such as USA, UK, Europe, and Japan. These trained professional should be hired from Java or other islands.
FINAL REPORT For SOUTH KALIMANTAN Investment Opportunities Study For Each Province of East, West, Central and South Kalimantan
BKPM – JICA
PT. PCII 3 - 33
Also the packaging professional staff should be hired from outside, while fish farmers of the area could be hired as non-professional labor.
3.2.3.4 Supporting Industries / Business
a. Shrimp Fry It is necessary to bring shrimp fry from East Java and South Sulawesi, because shrimp fry from hatchery in South Kalimantan is insufficient to meet local needs. From existing hatchery that operated in South Kalimantan produce shrimp fry around 10 million piece and from natural the shrimp farmers take 5 million pieces.
b. Ice Factory The need of ice for post harvesting start from the harvest process until it comes to the customer’s hand or to the next process (freezing or canning). At present the ice factory is available in South Kalimantan especially near the fish ponds and the fishing ports
c. Cold Storage There are 10 (ten) Cold Storage in South Kalimantan. Theses are not for leasing, so each fishery business has its own cold storage.
d. Peeled factory In 1998, PT Suri Tani Pemuka, the bracishwater aquaculture enterprise established the peeled for aquaculture and shrimp cultivation in South Kalimantan. This company sold 90% its products to shrimp brackish water farmers and use 10% for its own shrimp farming.
e. Others The facilities for fisheries development such as Laboratory of The Construction and Examination of Fisheries Production Quality (LPPMHP) have been constructed at Banjarbaru City. Another infrastructure that closely related to handling the qualities of fisheries products is hygienic fish market, located in Handil Bakti Village in Kabupaten Barito Kuala.
3.2.3.5 Market
Japan and USA Market
The main markets of Indonesian shrimp are Japan (60%), USA (16.5%), and European Community countries (11.6%) and other Asian countries (11.9%). The frozen shrimp export to US market is about 22,258.1 tons or about 4% of US total import 462,152 tons. US has mainly imported frozen shrimp from Thailand, accounting for about 26% (121,087 tons) of its total import. Since US has suspended its embargo on shrimp import from Indonesia since 03 January 2004, the US shrimp market is open for Indonesian. At present Indonesia can export its shrimp to US and European countries At present Indonesian has possibility to sale its shrimp to US and European countries. While the other six countries Thailand, China, India, Vietnam, Ecuador, and Brazil are still in antidumping embargo by US. Implication of these situation the six countries also has penetration the Japanese market of shrimp and also penetrated the shrimp domestic market of Indonesia with low
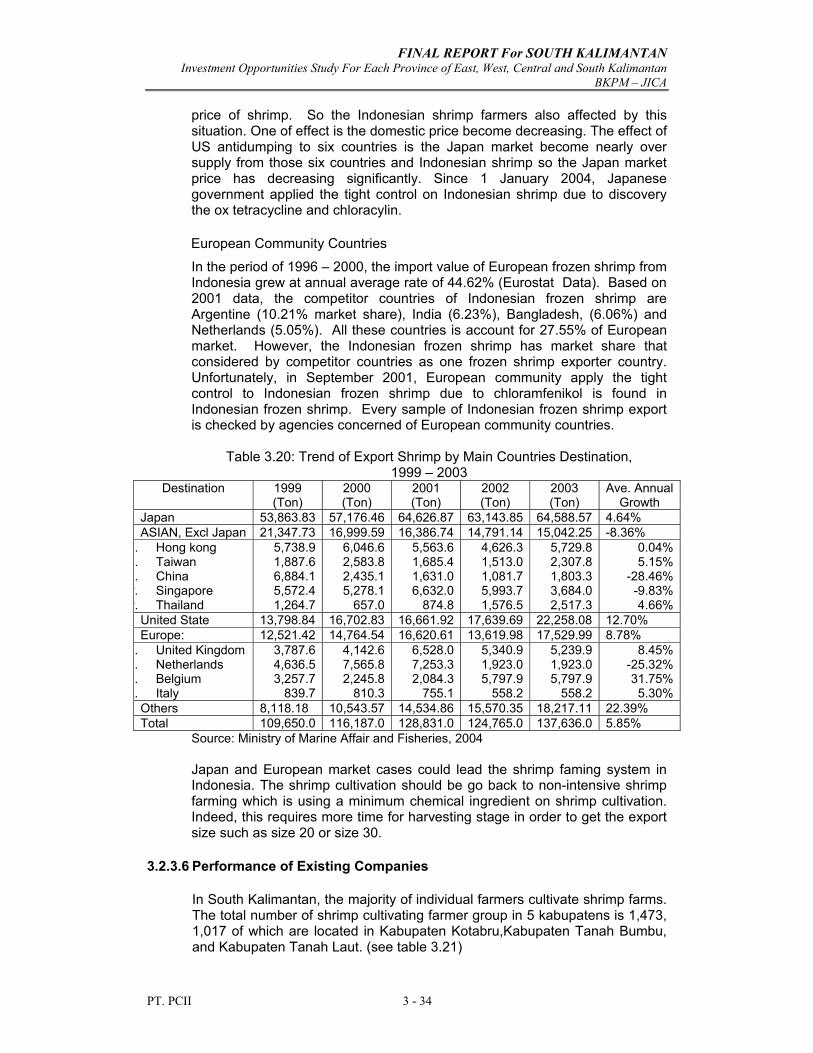
FINAL REPORT For SOUTH KALIMANTAN Investment Opportunities Study For Each Province of East, West, Central and South Kalimantan
BKPM – JICA
PT. PCII 3 - 34
price of shrimp. So the Indonesian shrimp farmers also affected by this situation. One of effect is the domestic price become decreasing. The effect of US antidumping to six countries is the Japan market become nearly over supply from those six countries and Indonesian shrimp so the Japan market price has decreasing significantly. Since 1 January 2004, Japanese government applied the tight control on Indonesian shrimp due to discovery the ox tetracycline and chloracylin.
European Community Countries
In the period of 1996 – 2000, the import value of European frozen shrimp from Indonesia grew at annual average rate of 44.62% (Eurostat Data). Based on 2001 data, the competitor countries of Indonesian frozen shrimp are Argentine (10.21% market share), India (6.23%), Bangladesh, (6.06%) and Netherlands (5.05%). All these countries is account for 27.55% of European market. However, the Indonesian frozen shrimp has market share that considered by competitor countries as one frozen shrimp exporter country. Unfortunately, in September 2001, European community apply the tight control to Indonesian frozen shrimp due to chloramfenikol is found in Indonesian frozen shrimp. Every sample of Indonesian frozen shrimp export is checked by agencies concerned of European community countries.
Table 3.20: Trend of Export Shrimp by Main Countries Destination, 1999 – 2003
Destination 1999 (Ton)
2000 (Ton)
2001 (Ton)
2002 (Ton)
2003 (Ton)
Ave. Annual Growth
Japan 53,863.83 57,176.46 64,626.87 63,143.85 64,588.57 4.64% ASIAN, Excl Japan 21,347.73 16,999.59 16,386.74 14,791.14 15,042.25 -8.36%
. Hong kong
. Taiwan
. China v. Singapore v. Thailand
5,738.9 1,887.6 6,884.1 5,572.4 1,264.7
6,046.62,583.82,435.15,278.1
657.0
5,563.61,685.41,631.06,632.0
874.8
4,626.31,513.01,081.75,993.71,576.5
5,729.8 2,307.8 1,803.3 3,684.0 2,517.3
0.04%5.15%
-28.46%-9.83%4.66%
United State 13,798.84 16,702.83 16,661.92 17,639.69 22,258.08 12.70% Europe: 12,521.42 14,764.54 16,620.61 13,619.98 17,529.99 8.78%
. United Kingdom
. Netherlands
. Belgium x. Italy
3,787.6 4,636.5 3,257.7
839.7
4,142.67,565.82,245.8
810.3
6,528.07,253.32,084.3
755.1
5,340.91,923.05,797.9
558.2
5,239.9 1,923.0 5,797.9
558.2
8.45%-25.32%31.75%5.30%
Others 8,118.18 10,543.57 14,534.86 15,570.35 18,217.11 22.39% Total 109,650.0 116,187.0 128,831.0 124,765.0 137,636.0 5.85%
Source: Ministry of Marine Affair and Fisheries, 2004 Japan and European market cases could lead the shrimp faming system in Indonesia. The shrimp cultivation should be go back to non-intensive shrimp farming which is using a minimum chemical ingredient on shrimp cultivation. Indeed, this requires more time for harvesting stage in order to get the export size such as size 20 or size 30.
3.2.3.6 Performance of Existing Companies
In South Kalimantan, the majority of individual farmers cultivate shrimp farms. The total number of shrimp cultivating farmer group in 5 kabupatens is 1,473, 1,017 of which are located in Kabupaten Kotabru,Kabupaten Tanah Bumbu, and Kabupaten Tanah Laut. (see table 3.21)
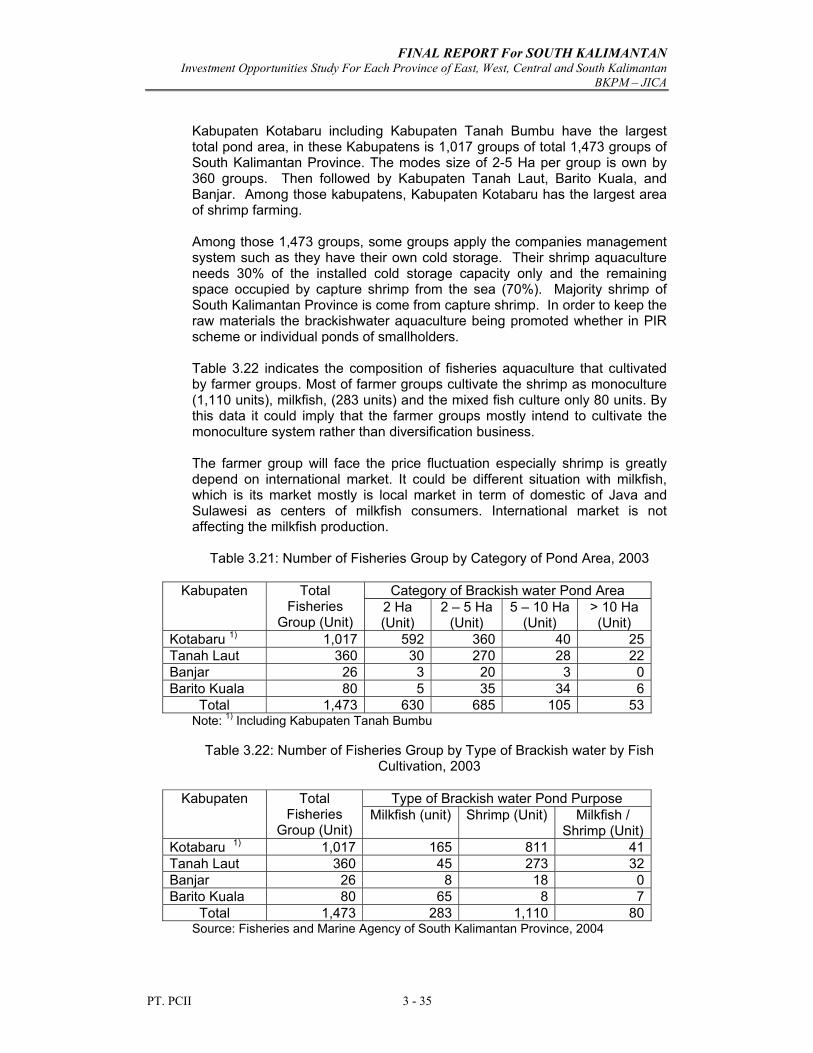
FINAL REPORT For SOUTH KALIMANTAN Investment Opportunities Study For Each Province of East, West, Central and South Kalimantan
BKPM – JICA
PT. PCII 3 - 35
Kabupaten Kotabaru including Kabupaten Tanah Bumbu have the largest total pond area, in these Kabupatens is 1,017 groups of total 1,473 groups of South Kalimantan Province. The modes size of 2-5 Ha per group is own by 360 groups. Then followed by Kabupaten Tanah Laut, Barito Kuala, and Banjar. Among those kabupatens, Kabupaten Kotabaru has the largest area of shrimp farming. Among those 1,473 groups, some groups apply the companies management system such as they have their own cold storage. Their shrimp aquaculture needs 30% of the installed cold storage capacity only and the remaining space occupied by capture shrimp from the sea (70%). Majority shrimp of South Kalimantan Province is come from capture shrimp. In order to keep the raw materials the brackishwater aquaculture being promoted whether in PIR scheme or individual ponds of smallholders. Table 3.22 indicates the composition of fisheries aquaculture that cultivated by farmer groups. Most of farmer groups cultivate the shrimp as monoculture (1,110 units), milkfish, (283 units) and the mixed fish culture only 80 units. By this data it could imply that the farmer groups mostly intend to cultivate the monoculture system rather than diversification business. The farmer group will face the price fluctuation especially shrimp is greatly depend on international market. It could be different situation with milkfish, which is its market mostly is local market in term of domestic of Java and Sulawesi as centers of milkfish consumers. International market is not affecting the milkfish production.
Table 3.21: Number of Fisheries Group by Category of Pond Area, 2003
Category of Brackish water Pond Area Kabupaten Total Fisheries
Group (Unit) 2 Ha (Unit)
2 – 5 Ha (Unit)
5 – 10 Ha (Unit)
> 10 Ha (Unit)
Kotabaru 1) 1,017 592 360 40 25 Tanah Laut 360 30 270 28 22 Banjar 26 3 20 3 0 Barito Kuala 80 5 35 34 6
Total 1,473 630 685 105 53 Note: 1) Including Kabupaten Tanah Bumbu
Table 3.22: Number of Fisheries Group by Type of Brackish water by Fish
Cultivation, 2003
Type of Brackish water Pond Purpose Kabupaten Total Fisheries
Group (Unit) Milkfish (unit) Shrimp (Unit) Milkfish /
Shrimp (Unit) Kotabaru 1) 1,017 165 811 41 Tanah Laut 360 45 273 32 Banjar 26 8 18 0 Barito Kuala 80 65 8 7
Total 1,473 283 1,110 80 Source: Fisheries and Marine Agency of South Kalimantan Province, 2004
FINAL REPORT For SOUTH KALIMANTAN Investment Opportunities Study For Each Province of East, West, Central and South Kalimantan
BKPM – JICA
PT. PCII 3 - 36
3.2.3.7 Government Sectoral / Industrial Policy
Every company within fishery business must have the Fisheries Business License (IUP) in fish cultivation and the Fish Carrier Boat Letter (SIKPI), which based on the decree of Ministry of Marine and Fishery No 02/MEN/2004 regarding the Fisheries Business permit, the license for the fish cultivation in freshwater, brackish water, and seawater that has foreign capital and or the foreign worker, the authority to issued by Ministry or the appointed officer (Director General of Aquaculture). The Governor or the appointed officer could issue the license for the fish cultivation in freshwater, brackish water, and seawater that has no foreign capital and or the foreign worker. The exception to have IUP/SIKPI is for those run fisheries business size as follow: a. Freshwater aquaculture smallholder cultivation not more than 2 (two) Ha, b. Brackishwater aquaculture cultivation not more than 4 (four) ha, or the
density 50,000 shrimp fry/ha c. Mariculture smallholders cultivation not more 0.50 ha. Within this constraints, Consultant suggest to new Investor, they could establish their own scheme by following the PIR scheme, the investor should have some area as nucleus farming and the smallholders to be the plasma scheme so the efficient area could be achieved.
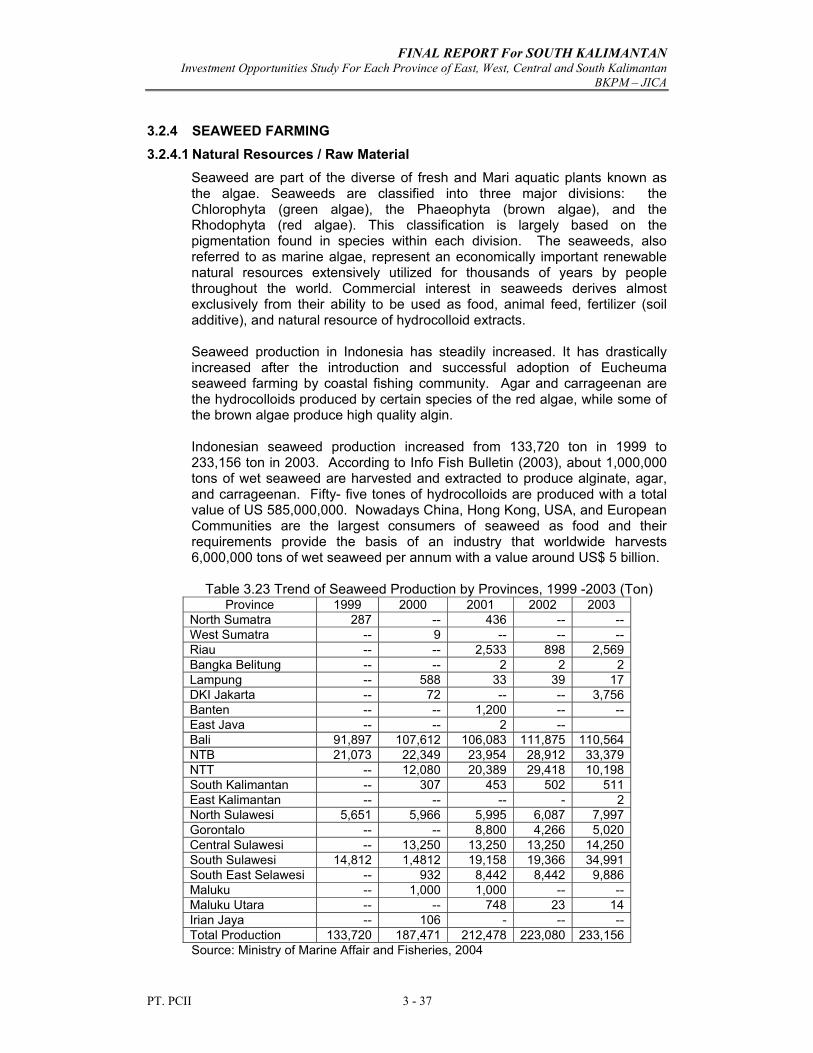
FINAL REPORT For SOUTH KALIMANTAN Investment Opportunities Study For Each Province of East, West, Central and South Kalimantan
BKPM – JICA
PT. PCII 3 - 37
3.2.4 SEAWEED FARMING 3.2.4.1 Natural Resources / Raw Material
Seaweed are part of the diverse of fresh and Mari aquatic plants known as the algae. Seaweeds are classified into three major divisions: the Chlorophyta (green algae), the Phaeophyta (brown algae), and the Rhodophyta (red algae). This classification is largely based on the pigmentation found in species within each division. The seaweeds, also referred to as marine algae, represent an economically important renewable natural resources extensively utilized for thousands of years by people throughout the world. Commercial interest in seaweeds derives almost exclusively from their ability to be used as food, animal feed, fertilizer (soil additive), and natural resource of hydrocolloid extracts. Seaweed production in Indonesia has steadily increased. It has drastically increased after the introduction and successful adoption of Eucheuma seaweed farming by coastal fishing community. Agar and carrageenan are the hydrocolloids produced by certain species of the red algae, while some of the brown algae produce high quality algin. Indonesian seaweed production increased from 133,720 ton in 1999 to 233,156 ton in 2003. According to Info Fish Bulletin (2003), about 1,000,000 tons of wet seaweed are harvested and extracted to produce alginate, agar, and carrageenan. Fifty- five tones of hydrocolloids are produced with a total value of US 585,000,000. Nowadays China, Hong Kong, USA, and European Communities are the largest consumers of seaweed as food and their requirements provide the basis of an industry that worldwide harvests 6,000,000 tons of wet seaweed per annum with a value around US$ 5 billion.
Table 3.23 Trend of Seaweed Production by Provinces, 1999 -2003 (Ton) Province 1999 2000 2001 2002 2003
North Sumatra 287 -- 436 -- -- West Sumatra -- 9 -- -- -- Riau -- -- 2,533 898 2,569 Bangka Belitung -- -- 2 2 2 Lampung -- 588 33 39 17 DKI Jakarta -- 72 -- -- 3,756 Banten -- -- 1,200 -- -- East Java -- -- 2 -- Bali 91,897 107,612 106,083 111,875 110,564 NTB 21,073 22,349 23,954 28,912 33,379 NTT -- 12,080 20,389 29,418 10,198 South Kalimantan -- 307 453 502 511 East Kalimantan -- -- -- - 2 North Sulawesi 5,651 5,966 5,995 6,087 7,997 Gorontalo -- -- 8,800 4,266 5,020 Central Sulawesi -- 13,250 13,250 13,250 14,250 South Sulawesi 14,812 1,4812 19,158 19,366 34,991 South East Selawesi -- 932 8,442 8,442 9,886 Maluku -- 1,000 1,000 -- -- Maluku Utara -- -- 748 23 14 Irian Jaya -- 106 - -- -- Total Production 133,720 187,471 212,478 223,080 233,156 Source: Ministry of Marine Affair and Fisheries, 2004
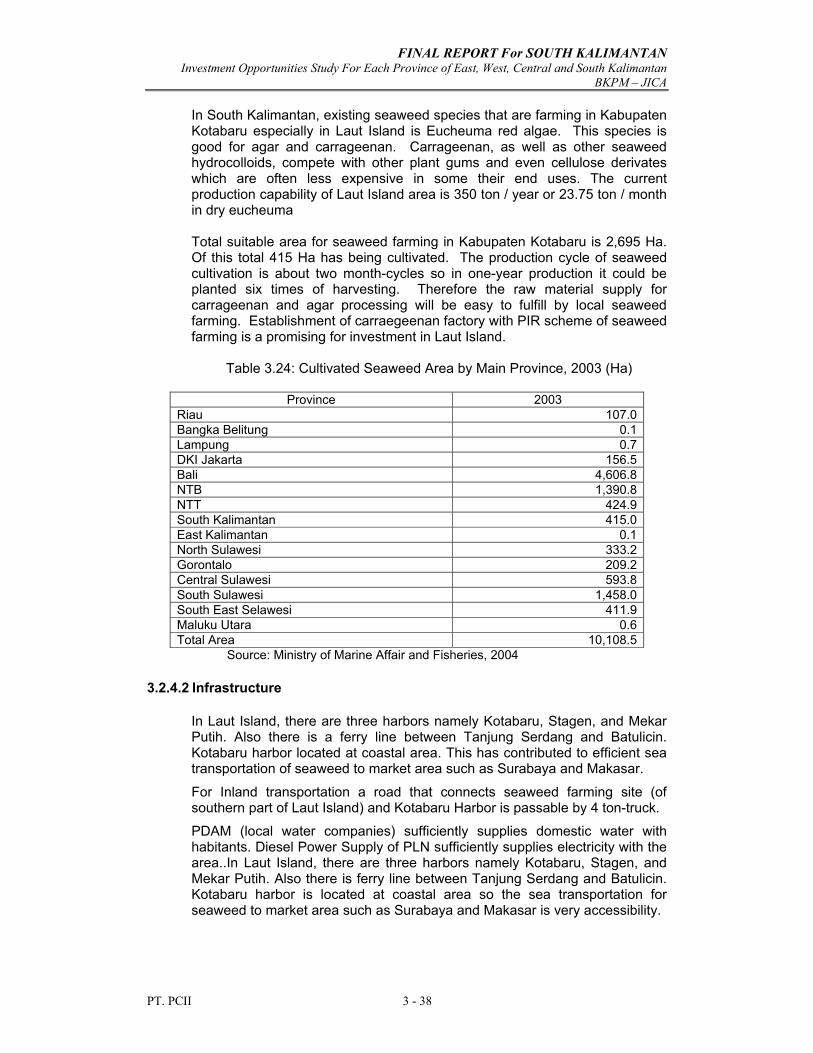
FINAL REPORT For SOUTH KALIMANTAN Investment Opportunities Study For Each Province of East, West, Central and South Kalimantan
BKPM – JICA
PT. PCII 3 - 38
In South Kalimantan, existing seaweed species that are farming in Kabupaten Kotabaru especially in Laut Island is Eucheuma red algae. This species is good for agar and carrageenan. Carrageenan, as well as other seaweed hydrocolloids, compete with other plant gums and even cellulose derivates which are often less expensive in some their end uses. The current production capability of Laut Island area is 350 ton / year or 23.75 ton / month in dry eucheuma Total suitable area for seaweed farming in Kabupaten Kotabaru is 2,695 Ha. Of this total 415 Ha has being cultivated. The production cycle of seaweed cultivation is about two month-cycles so in one-year production it could be planted six times of harvesting. Therefore the raw material supply for carrageenan and agar processing will be easy to fulfill by local seaweed farming. Establishment of carraegeenan factory with PIR scheme of seaweed farming is a promising for investment in Laut Island.
Table 3.24: Cultivated Seaweed Area by Main Province, 2003 (Ha)
Province 2003 Riau 107.0 Bangka Belitung 0.1 Lampung 0.7 DKI Jakarta 156.5 Bali 4,606.8 NTB 1,390.8 NTT 424.9 South Kalimantan 415.0 East Kalimantan 0.1 North Sulawesi 333.2 Gorontalo 209.2 Central Sulawesi 593.8 South Sulawesi 1,458.0 South East Selawesi 411.9 Maluku Utara 0.6 Total Area 10,108.5
Source: Ministry of Marine Affair and Fisheries, 2004
3.2.4.2 Infrastructure
In Laut Island, there are three harbors namely Kotabaru, Stagen, and Mekar Putih. Also there is a ferry line between Tanjung Serdang and Batulicin. Kotabaru harbor located at coastal area. This has contributed to efficient sea transportation of seaweed to market area such as Surabaya and Makasar.
For Inland transportation a road that connects seaweed farming site (of southern part of Laut Island) and Kotabaru Harbor is passable by 4 ton-truck.
PDAM (local water companies) sufficiently supplies domestic water with habitants. Diesel Power Supply of PLN sufficiently supplies electricity with the area..In Laut Island, there are three harbors namely Kotabaru, Stagen, and Mekar Putih. Also there is ferry line between Tanjung Serdang and Batulicin. Kotabaru harbor is located at coastal area so the sea transportation for seaweed to market area such as Surabaya and Makasar is very accessibility.
FINAL REPORT For SOUTH KALIMANTAN Investment Opportunities Study For Each Province of East, West, Central and South Kalimantan
BKPM – JICA
PT. PCII 3 - 39
3.2.4.3 Labor Requirement
Seaweed farming needs very simple cultivation techniques, most of farmers or coastal community could learn the seaweed farming easily. Currently 415 Ha of seaweed-farm needs 352 people: labor requirement for each hectare is 0.8 people.
3.2.4.4 Supporting Industries / Business
Eucheuma seaweed seedling is available in Bali, Lombok Island and Central Sulawesi. After farmers produce their own seedling and sell it at the price of Rp 1,000 per Kg. Bamboo and plastic rope is available at local market. Processing facility such as drying floor or dryer as well is not established yet at local level. The packaging and semi-process machines of seaweed are not available in the area.
3.2.4.5 Market
Increasing demand of seaweed over the last fifty years outstripped the ability to supply requirements from natural (wild) stocks. Research into the life cycles of this algae has led to the development of cultivation industries that now produce more than 90% of the market’s demand. Nowadays, Chinese, Hong Kong, USA, and European Communities are the largest consumers of seaweed as food and their requirements. The three most important seaweeds used as human food are species of Porphyra (common Japanese name, nori), Laminaria (kombu), and Undaria (wakame). Pophyra is classed as a red seaweed, laminaria and Undaria are brown seaweeds. As it is found in Laut Island the red seaweed could be the Porphyra species. This species could has a good prospect market for Japan, Chinese, USA and Europe. Domestic trade flows for carrageenan indicates Surabaya would be the center of carrageenan market. The major Eucheuma producer provinces of South Sulawesi, Bali, NTB, Central Sulawesi, South East Sulawesi, North Sulawesi, Mollucacas, Papua sold their products to Surabaya market. Some Eucheuma from South Sulawesi, Central Sulawesi, and South East Sulawesi send their products to Jakarta and North Sumatra. This situation bring an advantage for Kabupaten Kotabaru especially Laut Island that has close distance to Surabaya. While the agar market is Surabaya, Jakarta, and North Sumatra. Mostly agar gracilaria produced by South Sulawesi and NTB provinces. In period of the last four years (1999-2003) seaweed domestic consumption increasing by average 15.41% per year and has a increase trend. This could be happened because of increasing demand for seaweed for agar, jelly food, and biscuit; also the demand of carregenan increasing for various purposes. This demand situation could encourage the supply of seaweed in near future. For illustration the Figure 3.8 and 3.9. Indicates the trading flow of carragenan and agar in domestic market. Currently the seaweed production of Laut Island is still very small at 350 ton dried seaweed with value Rp.1,085 million. Of production total (350 ton) about 240 ton produced by West Laut Island and 110 ton produced by South Laut
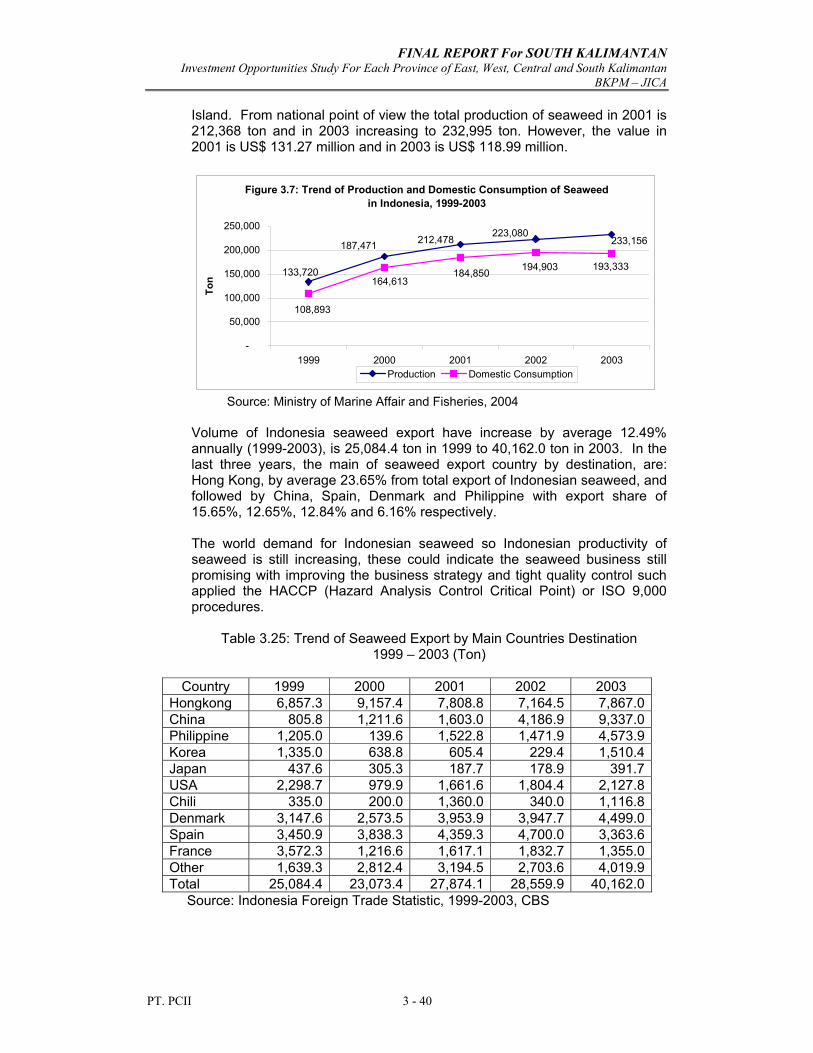
FINAL REPORT For SOUTH KALIMANTAN Investment Opportunities Study For Each Province of East, West, Central and South Kalimantan
BKPM – JICA
PT. PCII 3 - 40
Island. From national point of view the total production of seaweed in 2001 is 212,368 ton and in 2003 increasing to 232,995 ton. However, the value in 2001 is US$ 131.27 million and in 2003 is US$ 118.99 million.
Figure 3.7: Trend of Production and Domestic Consumption of Seaweed in Indonesia, 1999-2003
233,156223,080
212,478187,471
133,720 194,903184,850164,613
108,893
193,333
-
50,000
100,000
150,000
200,000
250,000
1999 2000 2001 2002 2003
Ton
Production Domestic Consumption
Source: Ministry of Marine Affair and Fisheries, 2004 Volume of Indonesia seaweed export have increase by average 12.49% annually (1999-2003), is 25,084.4 ton in 1999 to 40,162.0 ton in 2003. In the last three years, the main of seaweed export country by destination, are: Hong Kong, by average 23.65% from total export of Indonesian seaweed, and followed by China, Spain, Denmark and Philippine with export share of 15.65%, 12.65%, 12.84% and 6.16% respectively. The world demand for Indonesian seaweed so Indonesian productivity of seaweed is still increasing, these could indicate the seaweed business still promising with improving the business strategy and tight quality control such applied the HACCP (Hazard Analysis Control Critical Point) or ISO 9,000 procedures.
Table 3.25: Trend of Seaweed Export by Main Countries Destination 1999 – 2003 (Ton)
Country 1999 2000 2001 2002 2003
Hongkong 6,857.3 9,157.4 7,808.8 7,164.5 7,867.0 China 805.8 1,211.6 1,603.0 4,186.9 9,337.0 Philippine 1,205.0 139.6 1,522.8 1,471.9 4,573.9 Korea 1,335.0 638.8 605.4 229.4 1,510.4 Japan 437.6 305.3 187.7 178.9 391.7 USA 2,298.7 979.9 1,661.6 1,804.4 2,127.8 Chili 335.0 200.0 1,360.0 340.0 1,116.8 Denmark 3,147.6 2,573.5 3,953.9 3,947.7 4,499.0 Spain 3,450.9 3,838.3 4,359.3 4,700.0 3,363.6 France 3,572.3 1,216.6 1,617.1 1,832.7 1,355.0 Other 1,639.3 2,812.4 3,194.5 2,703.6 4,019.9 Total 25,084.4 23,073.4 27,874.1 28,559.9 40,162.0
Source: Indonesia Foreign Trade Statistic, 1999-2003, CBS
FINAL REPORT For SOUTH KALIMANTAN Investment Opportunities Study For Each Province of East, West, Central and South Kalimantan
BKPM – JICA
PT. PCII 3 - 41
3.2.4.6 Performance of Existing Companies
At moment there is no company involves directly in upstream of seaweed farming, most of the companies are still as buyers of products. Most of them is located in Surabaya, Jakarta, and Medan. Major industries that bought the seaweed is agar industry while the carregeenan would be exported to overseas by Surabaya, Jakarta, and Medan businessmen.
3.2.4.7 Government Sectoral / Industrial Policy
The Government Kabupaten of Kotabaru has a policy to encourage the interested investor in fishery sector, especially seaweed cultivation. Also at certain period the investor will have free local contribution. The contact agency for this incentive the Investors can contact the BAPPEDA Officer in charge.
3.2.4.8 Procedure of Seaweed Business
No specific procedure that applied to seaweed business development except the general business permit for investment in the area through Kabupaten Marine Affairs and Fisheries Service.
For sustainability of seaweed farming the environment assessment should be considered, due to seaweed sensitive to pollutions.
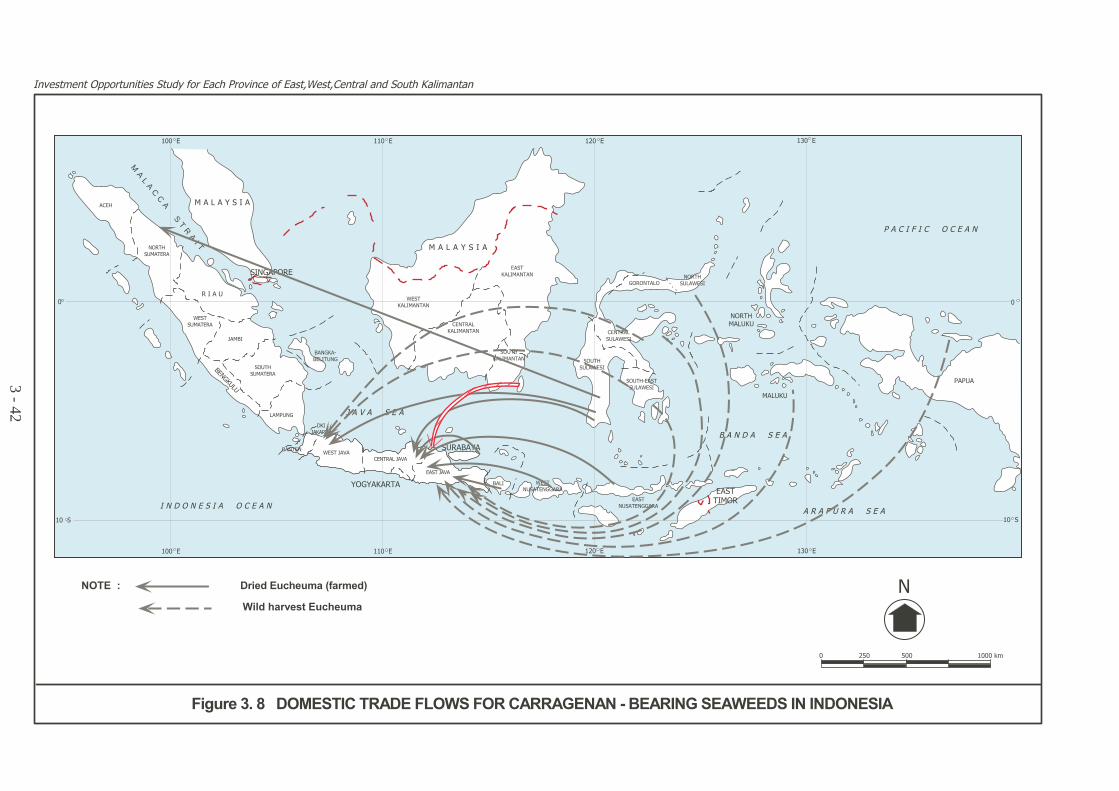
�������������� ����������������������������������������������������������������
�
� ��� ��� �������
��� ���
� � � � � � �
�����
�����
� � � � � �
�����
���
�
� � � � � � � � �
����������
��������
�����
�����
��������
�����
��
��������
�����
���
����������
��
����
� � � � �
�����
�� ����
�����
�� ����
��
�� ����
� � �
�����
� � �
���
� �����
�����
�����
������
� � � � � � � � � �
����
���
�����
�� ���
�������
�
MA
LA
CC
A S
TR
AI T�����
�����
�����
�����
����� �����
��������������
�����
�����
�����
����������
�����
�� ���� �����
�����
���
�� ����
!"#$%�#!%��&&'(%)!*%*#$��%)+,�-'(�./0��('"*!/#�'-�.$%1�#$%1�#!%(.2�.!+��')%0��.2*�.!%.!
��
�� ���
����
3 - 42
������� ������������� �!" ����#
��$��� �%�&'��������
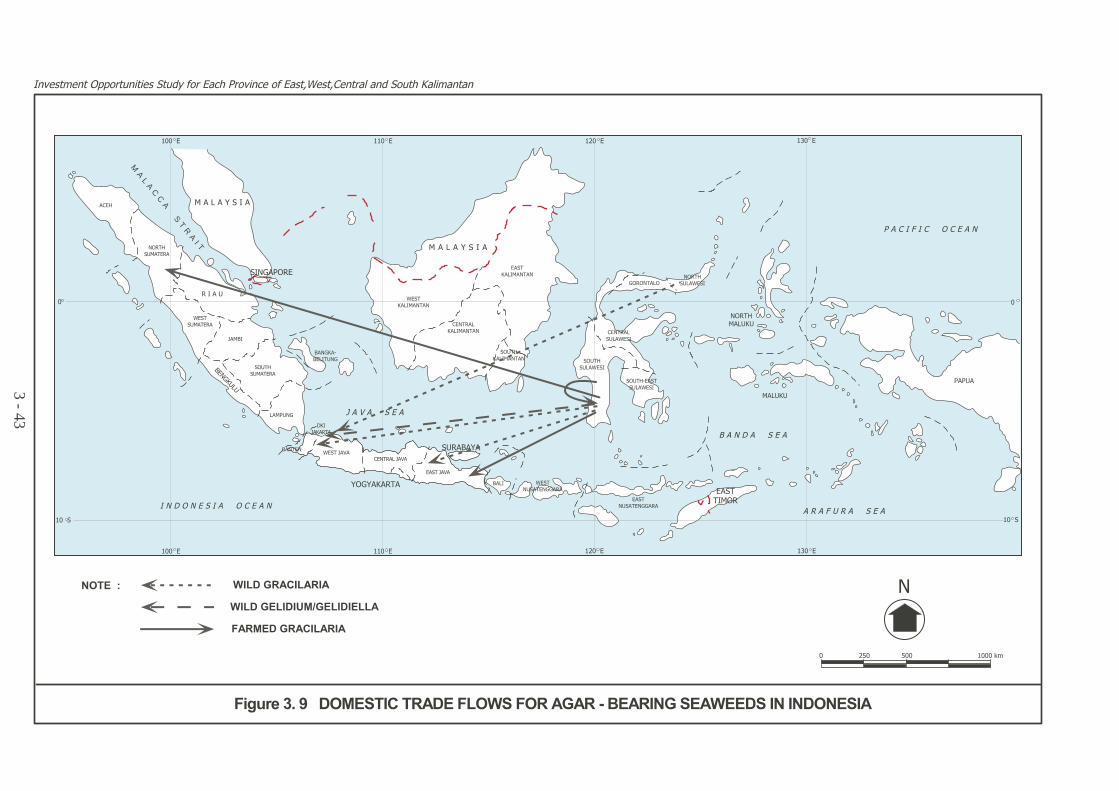
�������������� ����������������������������������������������������������
�
� ��� ��� �������
��� ���
� � � � � � �
�����
�����
� � � � � �
�����
���
�
� � � � � � � � �
����������
��������
�����
�����
��������
�����
��
��������
�����
���
����������
��
����
� � � � �
�����
�� ����
�����
�� ����
��
�� ����
� � �
�����
� � �
���
� �����
�����
�����
������
� � � � � � � � � �
����
���
�����
�� ���
�������
�
MA
LA
CC
A S
TR
AI T�����
�����
�����
�����
����� �����
��������������
�����
�����
�����
����������
�����
�� ���� �����
�����
���
�� ����
!"#$%�#!%��&&'(%)!*%*#$��%)+,�-'(�./0��('"*!/#�'-�.$%1�#$%1�#!%(.2�.!+��')%0��.2*�.!%.!
��
�� ���
����
3 - 43
������� ���������������
������������ �����������
��� �������������
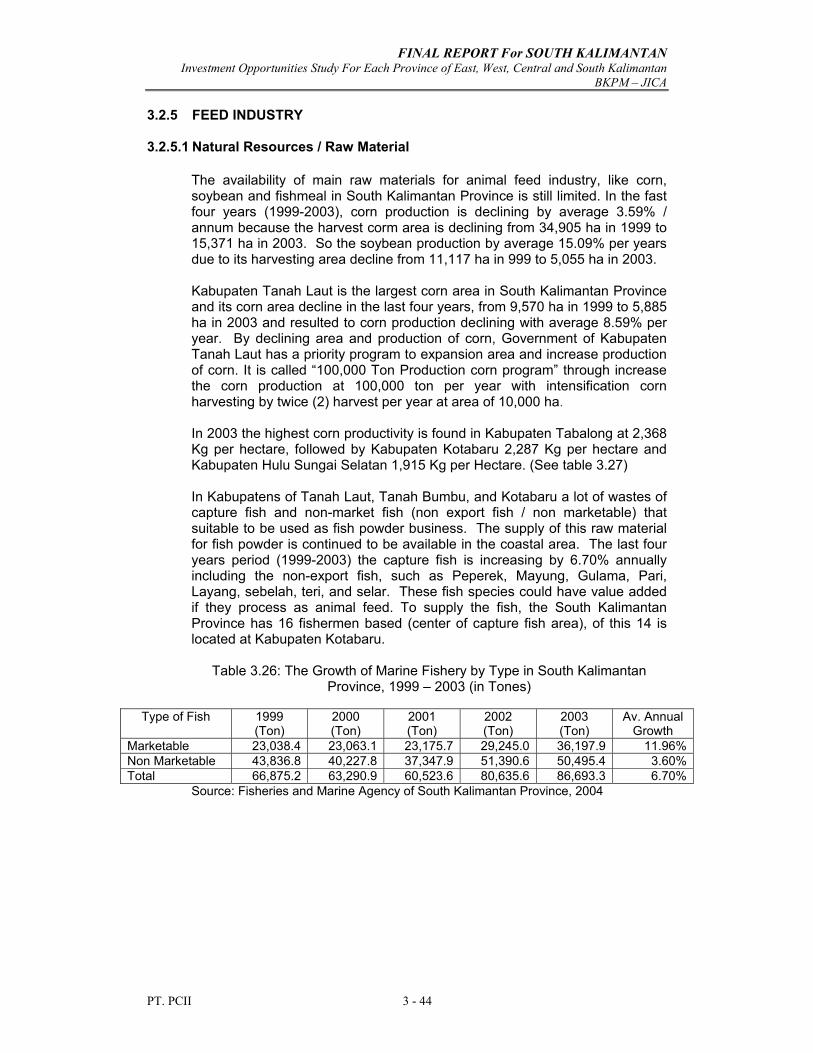
FINAL REPORT For SOUTH KALIMANTAN Investment Opportunities Study For Each Province of East, West, Central and South Kalimantan
BKPM – JICA
PT. PCII 3 - 44
3.2.5 FEED INDUSTRY 3.2.5.1 Natural Resources / Raw Material
The availability of main raw materials for animal feed industry, like corn, soybean and fishmeal in South Kalimantan Province is still limited. In the fast four years (1999-2003), corn production is declining by average 3.59% / annum because the harvest corm area is declining from 34,905 ha in 1999 to 15,371 ha in 2003. So the soybean production by average 15.09% per years due to its harvesting area decline from 11,117 ha in 999 to 5,055 ha in 2003. Kabupaten Tanah Laut is the largest corn area in South Kalimantan Province and its corn area decline in the last four years, from 9,570 ha in 1999 to 5,885 ha in 2003 and resulted to corn production declining with average 8.59% per year. By declining area and production of corn, Government of Kabupaten Tanah Laut has a priority program to expansion area and increase production of corn. It is called “100,000 Ton Production corn program” through increase the corn production at 100,000 ton per year with intensification corn harvesting by twice (2) harvest per year at area of 10,000 ha. In 2003 the highest corn productivity is found in Kabupaten Tabalong at 2,368 Kg per hectare, followed by Kabupaten Kotabaru 2,287 Kg per hectare and Kabupaten Hulu Sungai Selatan 1,915 Kg per Hectare. (See table 3.27) In Kabupatens of Tanah Laut, Tanah Bumbu, and Kotabaru a lot of wastes of capture fish and non-market fish (non export fish / non marketable) that suitable to be used as fish powder business. The supply of this raw material for fish powder is continued to be available in the coastal area. The last four years period (1999-2003) the capture fish is increasing by 6.70% annually including the non-export fish, such as Peperek, Mayung, Gulama, Pari, Layang, sebelah, teri, and selar. These fish species could have value added if they process as animal feed. To supply the fish, the South Kalimantan Province has 16 fishermen based (center of capture fish area), of this 14 is located at Kabupaten Kotabaru.
Table 3.26: The Growth of Marine Fishery by Type in South Kalimantan Province, 1999 – 2003 (in Tones)
Type of Fish 1999
(Ton) 2000 (Ton)
2001 (Ton)
2002 (Ton)
2003 (Ton)
Av. Annual Growth
Marketable 23,038.4 23,063.1 23,175.7 29,245.0 36,197.9 11.96%Non Marketable 43,836.8 40,227.8 37,347.9 51,390.6 50,495.4 3.60%Total 66,875.2 63,290.9 60,523.6 80,635.6 86,693.3 6.70%
Source: Fisheries and Marine Agency of South Kalimantan Province, 2004
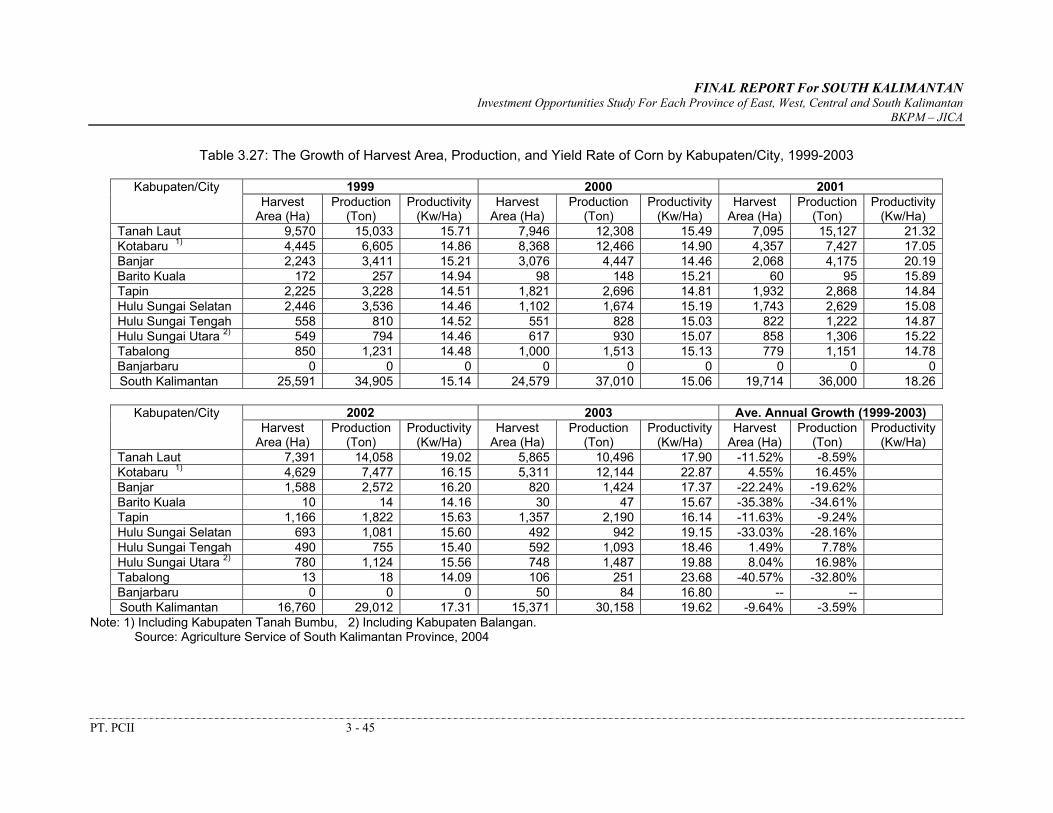
FINAL REPORT For SOUTH KALIMANTAN Investment Opportunities Study For Each Province of East, West, Central and South Kalimantan
BKPM – JICA
PT. PCII 3 - 45
Table 3.27: The Growth of Harvest Area, Production, and Yield Rate of Corn by Kabupaten/City, 1999-2003
1999 2000 2001 Kabupaten/City Harvest
Area (Ha) Production
(Ton) Productivity
(Kw/Ha) Harvest
Area (Ha) Production
(Ton) Productivity
(Kw/Ha) Harvest
Area (Ha) Production
(Ton) Productivity
(Kw/Ha) Tanah Laut 9,570 15,033 15.71 7,946 12,308 15.49 7,095 15,127 21.32Kotabaru 1) 4,445 6,605 14.86 8,368 12,466 14.90 4,357 7,427 17.05Banjar 2,243 3,411 15.21 3,076 4,447 14.46 2,068 4,175 20.19Barito Kuala 172 257 14.94 98 148 15.21 60 95 15.89Tapin 2,225 3,228 14.51 1,821 2,696 14.81 1,932 2,868 14.84Hulu Sungai Selatan 2,446 3,536 14.46 1,102 1,674 15.19 1,743 2,629 15.08Hulu Sungai Tengah 558 810 14.52 551 828 15.03 822 1,222 14.87Hulu Sungai Utara 2) 549 794 14.46 617 930 15.07 858 1,306 15.22Tabalong 850 1,231 14.48 1,000 1,513 15.13 779 1,151 14.78Banjarbaru 0 0 0 0 0 0 0 0 0South Kalimantan 25,591 34,905 15.14 24,579 37,010 15.06 19,714 36,000 18.26
2002 2003 Ave. Annual Growth (1999-2003) Kabupaten/City
Harvest Area (Ha)
Production (Ton)
Productivity (Kw/Ha)
Harvest Area (Ha)
Production (Ton)
Productivity (Kw/Ha)
Harvest Area (Ha)
Production (Ton)
Productivity (Kw/Ha)
Tanah Laut 7,391 14,058 19.02 5,865 10,496 17.90 -11.52% -8.59%Kotabaru 1) 4,629 7,477 16.15 5,311 12,144 22.87 4.55% 16.45%Banjar 1,588 2,572 16.20 820 1,424 17.37 -22.24% -19.62%Barito Kuala 10 14 14.16 30 47 15.67 -35.38% -34.61%Tapin 1,166 1,822 15.63 1,357 2,190 16.14 -11.63% -9.24%Hulu Sungai Selatan 693 1,081 15.60 492 942 19.15 -33.03% -28.16%Hulu Sungai Tengah 490 755 15.40 592 1,093 18.46 1.49% 7.78%Hulu Sungai Utara 2) 780 1,124 15.56 748 1,487 19.88 8.04% 16.98%Tabalong 13 18 14.09 106 251 23.68 -40.57% -32.80%Banjarbaru 0 0 0 50 84 16.80 -- --South Kalimantan 16,760 29,012 17.31 15,371 30,158 19.62 -9.64% -3.59%
Note: 1) Including Kabupaten Tanah Bumbu, 2) Including Kabupaten Balangan. Source: Agriculture Service of South Kalimantan Province, 2004
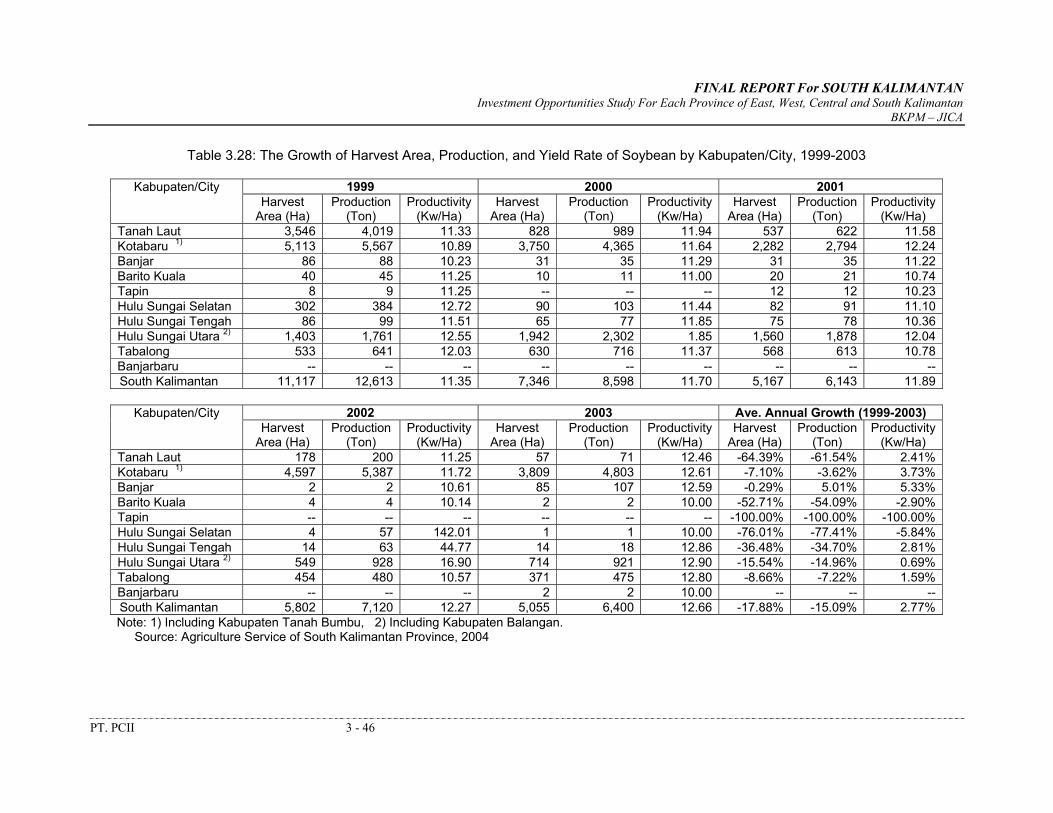
FINAL REPORT For SOUTH KALIMANTAN Investment Opportunities Study For Each Province of East, West, Central and South Kalimantan
BKPM – JICA
PT. PCII 3 - 46
Table 3.28: The Growth of Harvest Area, Production, and Yield Rate of Soybean by Kabupaten/City, 1999-2003
1999 2000 2001 Kabupaten/City Harvest
Area (Ha) Production
(Ton) Productivity
(Kw/Ha) Harvest
Area (Ha) Production
(Ton) Productivity
(Kw/Ha) Harvest
Area (Ha) Production
(Ton) Productivity
(Kw/Ha) Tanah Laut 3,546 4,019 11.33 828 989 11.94 537 622 11.58Kotabaru 1) 5,113 5,567 10.89 3,750 4,365 11.64 2,282 2,794 12.24Banjar 86 88 10.23 31 35 11.29 31 35 11.22Barito Kuala 40 45 11.25 10 11 11.00 20 21 10.74Tapin 8 9 11.25 -- -- -- 12 12 10.23Hulu Sungai Selatan 302 384 12.72 90 103 11.44 82 91 11.10Hulu Sungai Tengah 86 99 11.51 65 77 11.85 75 78 10.36Hulu Sungai Utara 2) 1,403 1,761 12.55 1,942 2,302 1.85 1,560 1,878 12.04Tabalong 533 641 12.03 630 716 11.37 568 613 10.78Banjarbaru -- -- -- -- -- -- -- -- --South Kalimantan 11,117 12,613 11.35 7,346 8,598 11.70 5,167 6,143 11.89
2002 2003 Ave. Annual Growth (1999-2003) Kabupaten/City
Harvest Area (Ha)
Production (Ton)
Productivity (Kw/Ha)
Harvest Area (Ha)
Production (Ton)
Productivity (Kw/Ha)
Harvest Area (Ha)
Production (Ton)
Productivity (Kw/Ha)
Tanah Laut 178 200 11.25 57 71 12.46 -64.39% -61.54% 2.41%Kotabaru 1) 4,597 5,387 11.72 3,809 4,803 12.61 -7.10% -3.62% 3.73%Banjar 2 2 10.61 85 107 12.59 -0.29% 5.01% 5.33%Barito Kuala 4 4 10.14 2 2 10.00 -52.71% -54.09% -2.90%Tapin -- -- -- -- -- -- -100.00% -100.00% -100.00%Hulu Sungai Selatan 4 57 142.01 1 1 10.00 -76.01% -77.41% -5.84%Hulu Sungai Tengah 14 63 44.77 14 18 12.86 -36.48% -34.70% 2.81%Hulu Sungai Utara 2) 549 928 16.90 714 921 12.90 -15.54% -14.96% 0.69%Tabalong 454 480 10.57 371 475 12.80 -8.66% -7.22% 1.59%Banjarbaru -- -- -- 2 2 10.00 -- -- --South Kalimantan 5,802 7,120 12.27 5,055 6,400 12.66 -17.88% -15.09% 2.77%Note: 1) Including Kabupaten Tanah Bumbu, 2) Including Kabupaten Balangan.
Source: Agriculture Service of South Kalimantan Province, 2004
FINAL REPORT For SOUTH KALIMANTAN Investment Opportunities Study For Each Province of East, West, Central and South Kalimantan
BKPM – JICA
PT. PCII 3 - 47
By the decline corn and soybean production and moreover South Kalimantan has no fishmeal factory to supply proposed animal feed industry, so the animal feed business is not feasible for investment in this area.
3.2.6 Coal Briquette
South Kalimantan Province has a huge coal supply that tradionally sold to Java or overseas. This coal deposit is estimated at 1,546,663 million ton that scatter over the Kabupatens of Kotabaru, Tanah Laut, Banjar, Tapin, Hulu Sungai Tengah, Hulu Sungai Selatan, Hulu Sungai Utara, and Tabalong. Beside these Kabupaten, the coal of Central Kalimantan is transported and sold in South Kalimantan harbors. Possibility of coal briquette production is analysis from the existing market point of view especially Jakarta coal briquette market. Bukit Asam mining company of South Sumatra produces most of coal briquette that are sold in Jakarta.
Since the kerosene is lower than coal briquette price the market is not possible. Currently the retailed market of coal briquette in Jakarta is Rp.1,700 per kg and at wholesale is Rp.1,300 per kg, while, the kerosene retailed price is Rp.1,000 per liter or Rp.1,250 per liter at home gate. Currently, coal briquette is limited using for heater of poultry flock of poultry farming in the area that is not available the electricity. Therefore the coal briquette business is not feasible for investment.
3.2.7 Portland Cement
3.2.7.1 Natural Resources / Raw Material
The cement raw materials Limestone, Clay and Quartz/Silica sand are available almost in every kabupaten of South Kalimantan Province. Table 3.29 indicates the hypothetic amount of Limestone is 6,214.06 million ton potential deposit, of this total 45% is available at Kabupaten Kotabaru including Kabupaten Tanah Bumbu, 17% at Kabupaten Hulu Sungai Utara including Kabupaten Balangan, 16% at Kabupaten Hulu Sungai Selatan, 11% at Kabupaten Hulu Sungai Tengah, and the remaining spread over other kabupatens in small amount. The total in term of inferred is 2,597.4 million ton so the exploration survey is necessary to be taken in estimating the real total amount of limestone available in South Kalimantan Province. However the hypothetic figure could lead to conclusion the huge limestone available for cement product in the area. At the same Table the hypothetic amount of clay is 177,578.37 million ton, of this total 99% is available at Kabupaten Hulu Sungai Selatan, and the rest with small amount spread over in Kabupatens of Tabalong, Hulu Sungai Tengah, Hulu Sungai Utara, Tanah Laut, and Kotabaru. Of this hypothetic amount, 559.77 million ton has been measured so the actual clay is already known and it could be ready and some place is being exploited. The other is still necessary to have further exploration survey.
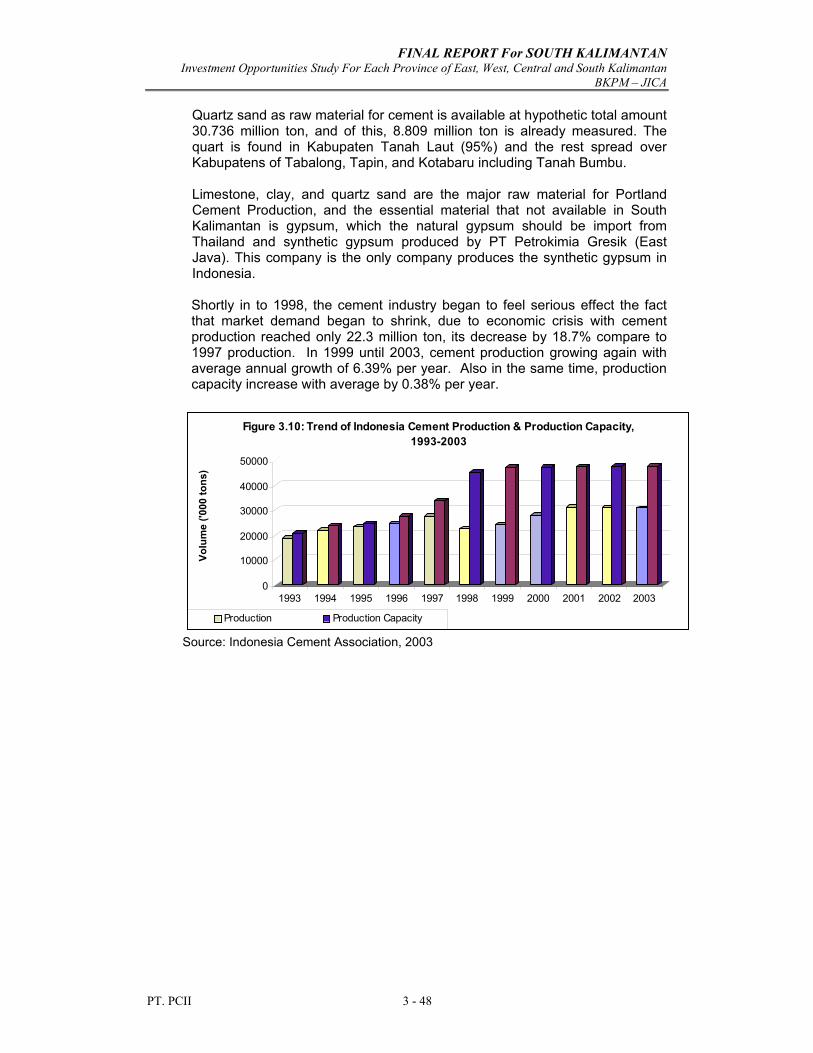
FINAL REPORT For SOUTH KALIMANTAN Investment Opportunities Study For Each Province of East, West, Central and South Kalimantan
BKPM – JICA
PT. PCII 3 - 48
Quartz sand as raw material for cement is available at hypothetic total amount 30.736 million ton, and of this, 8.809 million ton is already measured. The quart is found in Kabupaten Tanah Laut (95%) and the rest spread over Kabupatens of Tabalong, Tapin, and Kotabaru including Tanah Bumbu. Limestone, clay, and quartz sand are the major raw material for Portland Cement Production, and the essential material that not available in South Kalimantan is gypsum, which the natural gypsum should be import from Thailand and synthetic gypsum produced by PT Petrokimia Gresik (East Java). This company is the only company produces the synthetic gypsum in Indonesia. Shortly in to 1998, the cement industry began to feel serious effect the fact that market demand began to shrink, due to economic crisis with cement production reached only 22.3 million ton, its decrease by 18.7% compare to 1997 production. In 1999 until 2003, cement production growing again with average annual growth of 6.39% per year. Also in the same time, production capacity increase with average by 0.38% per year.
0
10000
20000
30000
40000
50000
Volu
me
('000
tons
)
1993 1994 1995 1996 1997 1998 1999 2000 2001 2002 2003
Figure 3.10: Trend of Indonesia Cement Production & Production Capacity, 1993-2003
Production Production Capacity
Source: Indonesia Cement Association, 2003
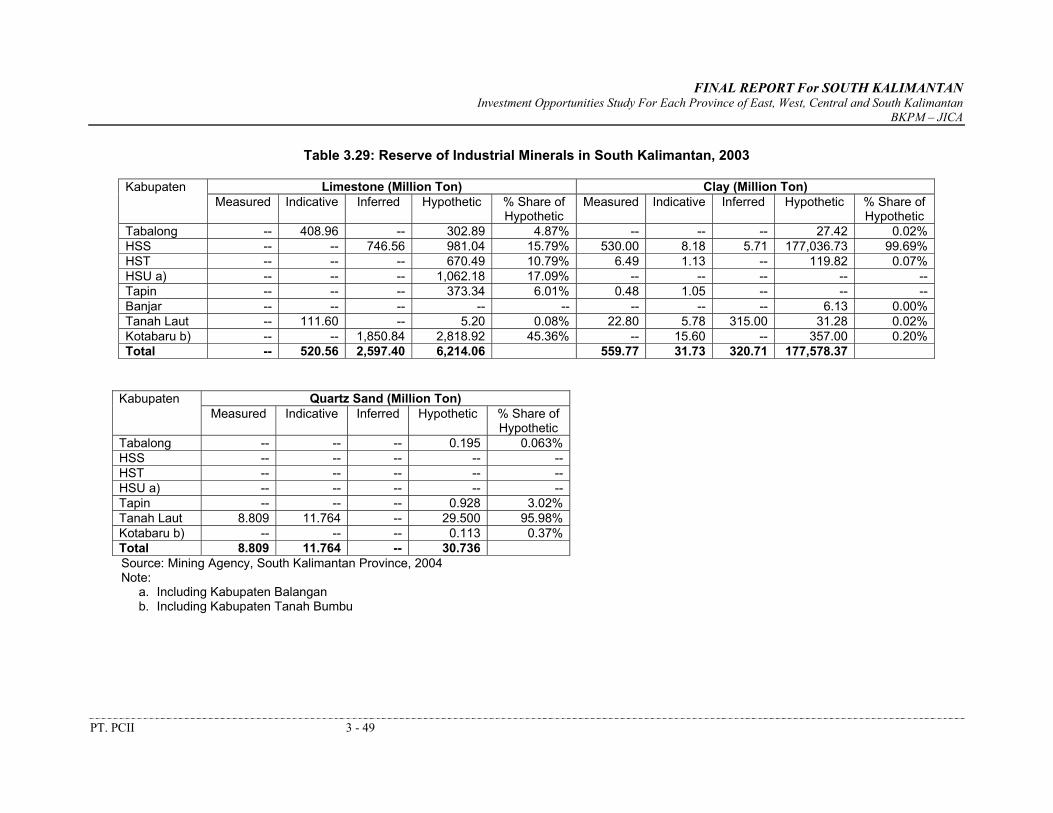
FINAL REPORT For SOUTH KALIMANTAN Investment Opportunities Study For Each Province of East, West, Central and South Kalimantan
BKPM – JICA
PT. PCII 3 - 49
Table 3.29: Reserve of Industrial Minerals in South Kalimantan, 2003
Limestone (Million Ton) Clay (Million Ton) Kabupaten Measured Indicative Inferred Hypothetic % Share of
Hypothetic Measured Indicative Inferred Hypothetic % Share of
Hypothetic Tabalong -- 408.96 -- 302.89 4.87% -- -- -- 27.42 0.02%HSS -- -- 746.56 981.04 15.79% 530.00 8.18 5.71 177,036.73 99.69%HST -- -- -- 670.49 10.79% 6.49 1.13 -- 119.82 0.07%HSU a) -- -- -- 1,062.18 17.09% -- -- -- -- --Tapin -- -- -- 373.34 6.01% 0.48 1.05 -- -- --Banjar -- -- -- -- -- -- -- -- 6.13 0.00%Tanah Laut -- 111.60 -- 5.20 0.08% 22.80 5.78 315.00 31.28 0.02%Kotabaru b) -- -- 1,850.84 2,818.92 45.36% -- 15.60 -- 357.00 0.20%Total -- 520.56 2,597.40 6,214.06 559.77 31.73 320.71 177,578.37
Quartz Sand (Million Ton) Kabupaten Measured Indicative Inferred Hypothetic % Share of
Hypothetic Tabalong -- -- -- 0.195 0.063%HSS -- -- -- -- --HST -- -- -- -- --HSU a) -- -- -- -- --Tapin -- -- -- 0.928 3.02%Tanah Laut 8.809 11.764 -- 29.500 95.98%Kotabaru b) -- -- -- 0.113 0.37%Total 8.809 11.764 -- 30.736Source: Mining Agency, South Kalimantan Province, 2004 Note:
a. Including Kabupaten Balangan b. Including Kabupaten Tanah Bumbu
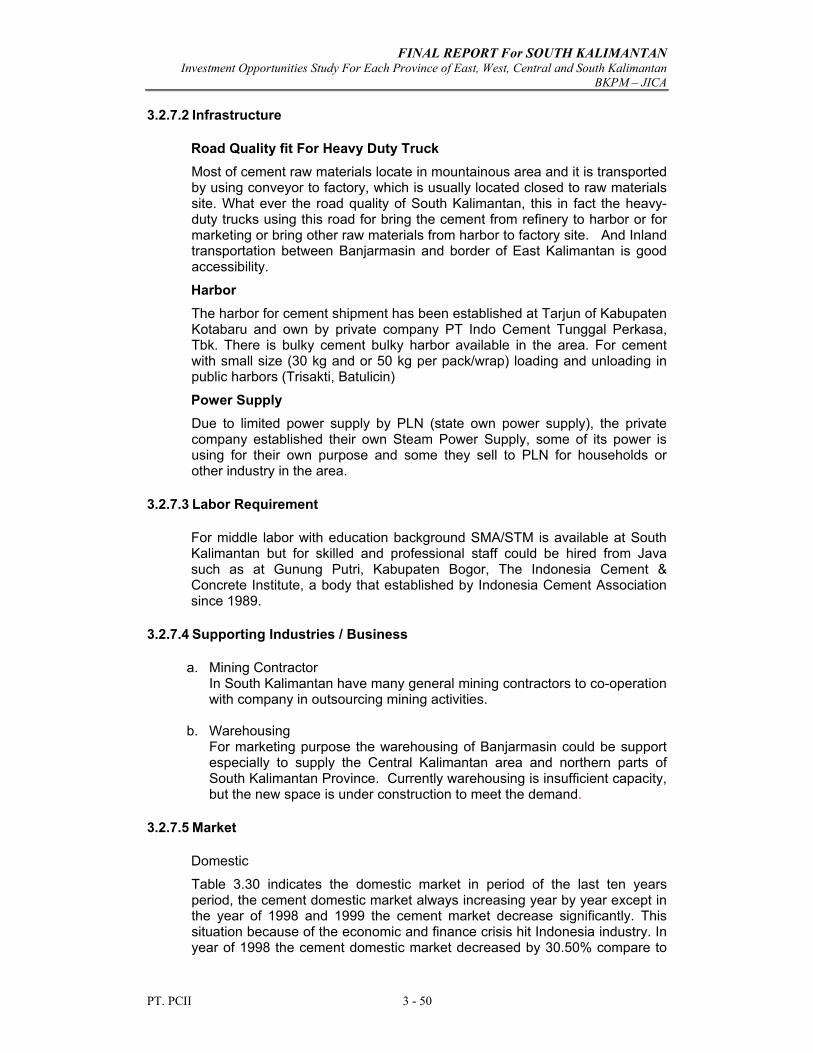
FINAL REPORT For SOUTH KALIMANTAN Investment Opportunities Study For Each Province of East, West, Central and South Kalimantan
BKPM – JICA
PT. PCII 3 - 50
3.2.7.2 Infrastructure
Road Quality fit For Heavy Duty Truck Most of cement raw materials locate in mountainous area and it is transported by using conveyor to factory, which is usually located closed to raw materials site. What ever the road quality of South Kalimantan, this in fact the heavy-duty trucks using this road for bring the cement from refinery to harbor or for marketing or bring other raw materials from harbor to factory site. And Inland transportation between Banjarmasin and border of East Kalimantan is good accessibility.
Harbor The harbor for cement shipment has been established at Tarjun of Kabupaten Kotabaru and own by private company PT Indo Cement Tunggal Perkasa, Tbk. There is bulky cement bulky harbor available in the area. For cement with small size (30 kg and or 50 kg per pack/wrap) loading and unloading in public harbors (Trisakti, Batulicin)
Power Supply Due to limited power supply by PLN (state own power supply), the private company established their own Steam Power Supply, some of its power is using for their own purpose and some they sell to PLN for households or other industry in the area.
3.2.7.3 Labor Requirement
For middle labor with education background SMA/STM is available at South Kalimantan but for skilled and professional staff could be hired from Java such as at Gunung Putri, Kabupaten Bogor, The Indonesia Cement & Concrete Institute, a body that established by Indonesia Cement Association since 1989.
3.2.7.4 Supporting Industries / Business
a. Mining Contractor In South Kalimantan have many general mining contractors to co-operation with company in outsourcing mining activities.
b. Warehousing For marketing purpose the warehousing of Banjarmasin could be support especially to supply the Central Kalimantan area and northern parts of South Kalimantan Province. Currently warehousing is insufficient capacity, but the new space is under construction to meet the demand.
3.2.7.5 Market
Domestic
Table 3.30 indicates the domestic market in period of the last ten years period, the cement domestic market always increasing year by year except in the year of 1998 and 1999 the cement market decrease significantly. This situation because of the economic and finance crisis hit Indonesia industry. In year of 1998 the cement domestic market decreased by 30.50% compare to
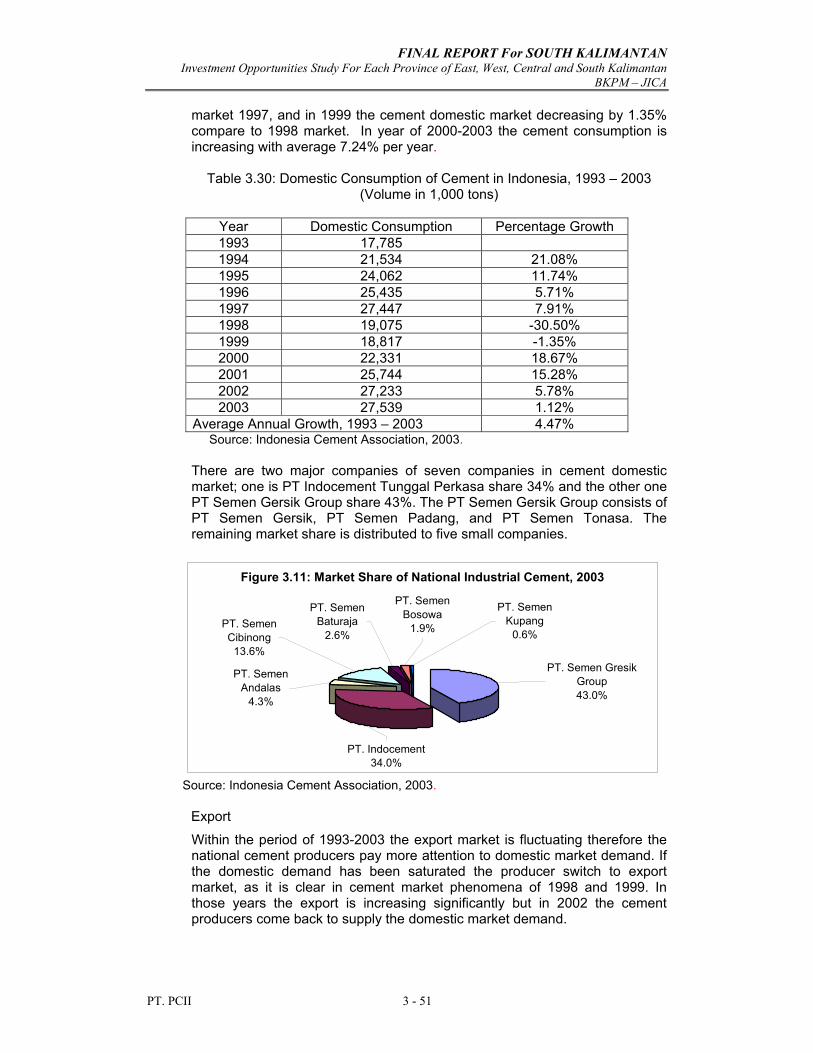
FINAL REPORT For SOUTH KALIMANTAN Investment Opportunities Study For Each Province of East, West, Central and South Kalimantan
BKPM – JICA
PT. PCII 3 - 51
market 1997, and in 1999 the cement domestic market decreasing by 1.35% compare to 1998 market. In year of 2000-2003 the cement consumption is increasing with average 7.24% per year.
Table 3.30: Domestic Consumption of Cement in Indonesia, 1993 – 2003 (Volume in 1,000 tons)
Year Domestic Consumption Percentage Growth 1993 17,785 1994 21,534 21.08% 1995 24,062 11.74% 1996 25,435 5.71% 1997 27,447 7.91% 1998 19,075 -30.50% 1999 18,817 -1.35% 2000 22,331 18.67% 2001 25,744 15.28% 2002 27,233 5.78% 2003 27,539 1.12%
Average Annual Growth, 1993 – 2003 4.47% Source: Indonesia Cement Association, 2003.
There are two major companies of seven companies in cement domestic market; one is PT Indocement Tunggal Perkasa share 34% and the other one PT Semen Gersik Group share 43%. The PT Semen Gersik Group consists of PT Semen Gersik, PT Semen Padang, and PT Semen Tonasa. The remaining market share is distributed to five small companies.
Figure 3.11: Market Share of National Industrial Cement, 2003
PT. Semen Gresik Group43.0%
PT. Indocement34.0%
PT. Semen Andalas
4.3%
PT. Semen Cibinong
13.6%
PT. Semen Kupang
0.6%
PT. Semen Bosowa
1.9%
PT. Semen Baturaja
2.6%
Source: Indonesia Cement Association, 2003. Export
Within the period of 1993-2003 the export market is fluctuating therefore the national cement producers pay more attention to domestic market demand. If the domestic demand has been saturated the producer switch to export market, as it is clear in cement market phenomena of 1998 and 1999. In those years the export is increasing significantly but in 2002 the cement producers come back to supply the domestic market demand.
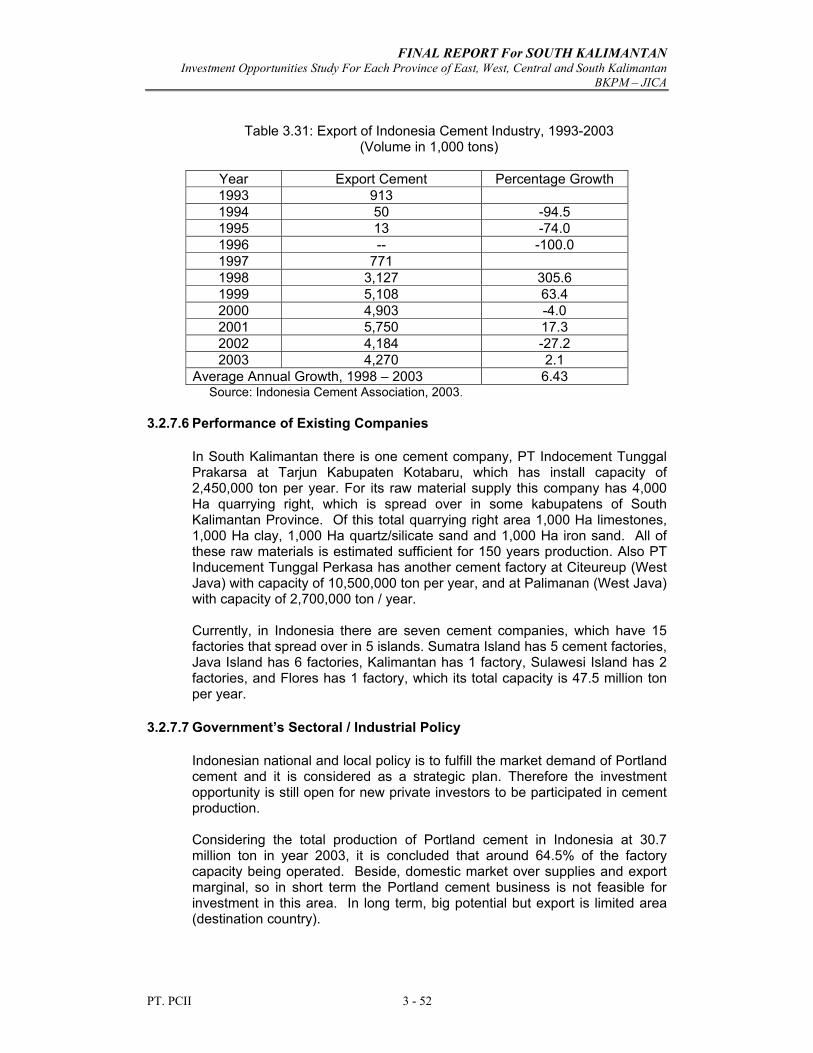
FINAL REPORT For SOUTH KALIMANTAN Investment Opportunities Study For Each Province of East, West, Central and South Kalimantan
BKPM – JICA
PT. PCII 3 - 52
Table 3.31: Export of Indonesia Cement Industry, 1993-2003
(Volume in 1,000 tons)
Year Export Cement Percentage Growth 1993 913 1994 50 -94.5 1995 13 -74.0 1996 -- -100.0 1997 771 1998 3,127 305.6 1999 5,108 63.4 2000 4,903 -4.0 2001 5,750 17.3 2002 4,184 -27.2 2003 4,270 2.1
Average Annual Growth, 1998 – 2003 6.43 Source: Indonesia Cement Association, 2003.
3.2.7.6 Performance of Existing Companies
In South Kalimantan there is one cement company, PT Indocement Tunggal Prakarsa at Tarjun Kabupaten Kotabaru, which has install capacity of 2,450,000 ton per year. For its raw material supply this company has 4,000 Ha quarrying right, which is spread over in some kabupatens of South Kalimantan Province. Of this total quarrying right area 1,000 Ha limestones, 1,000 Ha clay, 1,000 Ha quartz/silicate sand and 1,000 Ha iron sand. All of these raw materials is estimated sufficient for 150 years production. Also PT Inducement Tunggal Perkasa has another cement factory at Citeureup (West Java) with capacity of 10,500,000 ton per year, and at Palimanan (West Java) with capacity of 2,700,000 ton / year. Currently, in Indonesia there are seven cement companies, which have 15 factories that spread over in 5 islands. Sumatra Island has 5 cement factories, Java Island has 6 factories, Kalimantan has 1 factory, Sulawesi Island has 2 factories, and Flores has 1 factory, which its total capacity is 47.5 million ton per year.
3.2.7.7 Government’s Sectoral / Industrial Policy
Indonesian national and local policy is to fulfill the market demand of Portland cement and it is considered as a strategic plan. Therefore the investment opportunity is still open for new private investors to be participated in cement production. Considering the total production of Portland cement in Indonesia at 30.7 million ton in year 2003, it is concluded that around 64.5% of the factory capacity being operated. Beside, domestic market over supplies and export marginal, so in short term the Portland cement business is not feasible for investment in this area. In long term, big potential but export is limited area (destination country).
CURRENT SITUATION AND FUTURE PROSPECT OF MAJOR STREATEGIC
AREAS
FINAL REPORT For South Kalimantan Investment Opportunities Study For Each Province of East, West, Central and South Kalimantan
BKPM - JICA
4 - 1
CHAPTER 4
CURRENT SITUATION AND FUTURE PROSPECT OF MAJOR STRATEGIC AREAS
4.1 Major Strategic Areas by Leading Sectors
Kota Banjarmasin, Kabupatens of Tanah Laut (Pleihari), Tanahbumbu (Batulicin), and Kotabaru are the highest potential area for developing the downstream industries of palm oil, fisheries, especially brackish water pond, coal, and trading zone. The economic development of these zones, beside its own products that produce locally, some products such as coal, wood/log are coming from Central Kalimantan and its hinterland as well.
4.1.1 Kota Banjarmasin
Kota Banjarmasin is a capital city of South Kalimantan Province where the Governor Office and strategic government service are located. In line with economic development Kota Banjarmasin also be a center of trading and business activities in term of bank, warehousing, harbor, transportation service, hotel, rental office space, etc. Most of downstream industries also located in Kota Banjarmasin. In economic development analysis the Kota Banjarmasin should included the Kabupaten of Barito Kuala. Regional economic activities of Kota Banjarmasin with other regions of South Kalimantan and Central Kalimantan are linking by the following sub-sectors. Kota Banjarmasin is distribution marketing based of coal and wood industries products for market in Java and overseas as well; while the Central Kalimantan is the raw material resources. Therefore the Kota Banjarmasin could generate the economic activities of northern Kabupaten of South Kalimantan, and also generate the economic activities of Kabupaten Barito Utara, Barito Selatan, and Barito Timur of Central Kalimantan Province. Coal sub-sector Coal of Central Kalimantan is transported from Kabupaten Buntok and Kabupaten Barito Timur to Trisakti Harbor (Banjarmasin) in South Kalimantan area pass through water transportation. From Trisakti harbor, the coal will be sent to Java or overseas. There are 66 special harbors for coal, of this total number 1 harbor at Kabupaten Tapin, 10 at Kabupaten Tanah Laut, 22 at Kabupaten Tanah Bumbu, and 33 Harbors at Kabupaten Kotabaru. Future prospect of coal mining area will face the environment rehabilitation problems due it is open mining system practicing. In future, a lot of wild ponds will establish in the coal mining area which is in rainy season will filled by water and dry season will be undulating area. An example is Bangka Tin mining area, currently a lot of wild ponds occurred in the area. Wood and Timber Estate (HTI) sub-sector Previously the raw materials of wood are come from Central Kalimantan and South Kalimantan as well. By change of government policy on forestry especially the logging quota, currently the wood raw material also come from Sulawesi, Maluku, and Papua provinces.
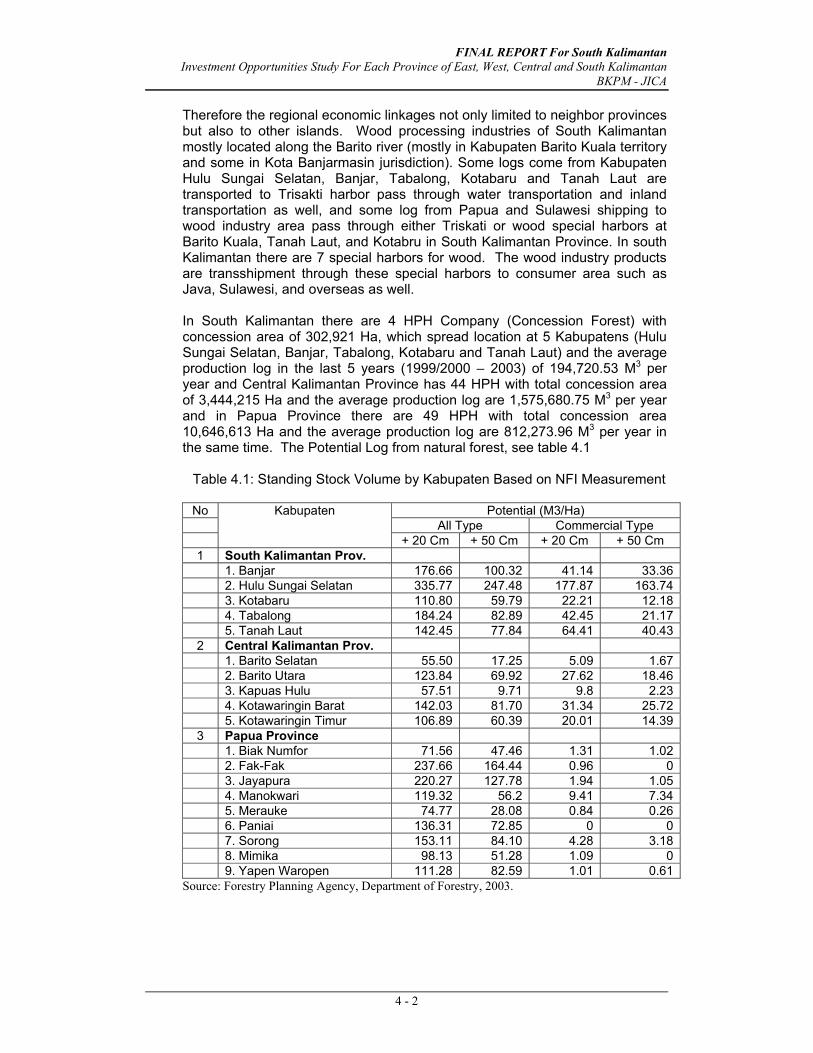
FINAL REPORT For South Kalimantan Investment Opportunities Study For Each Province of East, West, Central and South Kalimantan
BKPM - JICA
4 - 2
Therefore the regional economic linkages not only limited to neighbor provinces but also to other islands. Wood processing industries of South Kalimantan mostly located along the Barito river (mostly in Kabupaten Barito Kuala territory and some in Kota Banjarmasin jurisdiction). Some logs come from Kabupaten Hulu Sungai Selatan, Banjar, Tabalong, Kotabaru and Tanah Laut are transported to Trisakti harbor pass through water transportation and inland transportation as well, and some log from Papua and Sulawesi shipping to wood industry area pass through either Triskati or wood special harbors at Barito Kuala, Tanah Laut, and Kotabru in South Kalimantan Province. In south Kalimantan there are 7 special harbors for wood. The wood industry products are transshipment through these special harbors to consumer area such as Java, Sulawesi, and overseas as well. In South Kalimantan there are 4 HPH Company (Concession Forest) with concession area of 302,921 Ha, which spread location at 5 Kabupatens (Hulu Sungai Selatan, Banjar, Tabalong, Kotabaru and Tanah Laut) and the average production log in the last 5 years (1999/2000 – 2003) of 194,720.53 M3 per year and Central Kalimantan Province has 44 HPH with total concession area of 3,444,215 Ha and the average production log are 1,575,680.75 M3 per year and in Papua Province there are 49 HPH with total concession area 10,646,613 Ha and the average production log are 812,273.96 M3 per year in the same time. The Potential Log from natural forest, see table 4.1
Table 4.1: Standing Stock Volume by Kabupaten Based on NFI Measurement
No Potential (M3/Ha) All Type Commercial Type
Kabupaten
+ 20 Cm + 50 Cm + 20 Cm + 50 Cm 1 South Kalimantan Prov. 1. Banjar 176.66 100.32 41.14 33.36 2. Hulu Sungai Selatan 335.77 247.48 177.87 163.74 3. Kotabaru 110.80 59.79 22.21 12.18 4. Tabalong 184.24 82.89 42.45 21.17 5. Tanah Laut 142.45 77.84 64.41 40.432 Central Kalimantan Prov. 1. Barito Selatan 55.50 17.25 5.09 1.67 2. Barito Utara 123.84 69.92 27.62 18.46 3. Kapuas Hulu 57.51 9.71 9.8 2.23 4. Kotawaringin Barat 142.03 81.70 31.34 25.72 5. Kotawaringin Timur 106.89 60.39 20.01 14.393 Papua Province 1. Biak Numfor 71.56 47.46 1.31 1.02 2. Fak-Fak 237.66 164.44 0.96 0 3. Jayapura 220.27 127.78 1.94 1.05 4. Manokwari 119.32 56.2 9.41 7.34 5. Merauke 74.77 28.08 0.84 0.26 6. Paniai 136.31 72.85 0 0 7. Sorong 153.11 84.10 4.28 3.18 8. Mimika 98.13 51.28 1.09 0 9. Yapen Waropen 111.28 82.59 1.01 0.61
Source: Forestry Planning Agency, Department of Forestry, 2003.
FINAL REPORT For South Kalimantan Investment Opportunities Study For Each Province of East, West, Central and South Kalimantan
BKPM - JICA
4 - 3
The future the wood industry hopefully could get the raw material from timber estate (HTI) program of South Kalimantan Province. South Kalimantan government should enhance the HTI program as it being started. Detailed timber estate program is presented in Table 4.1; its program 553,920.79 Ha has been allocated for HTI. Of this allocated area 350,300.84 Ha have been plan for timber estate, and of the plan 200,967.04 Ha or 57.37% of plan and it is 36.28% of allocated area have been in realization. Timber estate program has been started in 1990 or some of timer have 14 years old (by 2004) so the raw material supply for wood industry of South Kalimantan from its own HTI could be sustainable. Of total allocated land, 13,153.43 ha that is belonging to 3 HTI companies are idle due to social conflict and its business permits has been withdrawal. By 2004, HTI wood potential is 4,564,430.57 m3 of vary Acacia Magnium from 113,959.22 ha. Detailed information of existing HTI program is presented in Table 4-2. Therefore the investment opportunity for HTI development is still wide room for new investments.
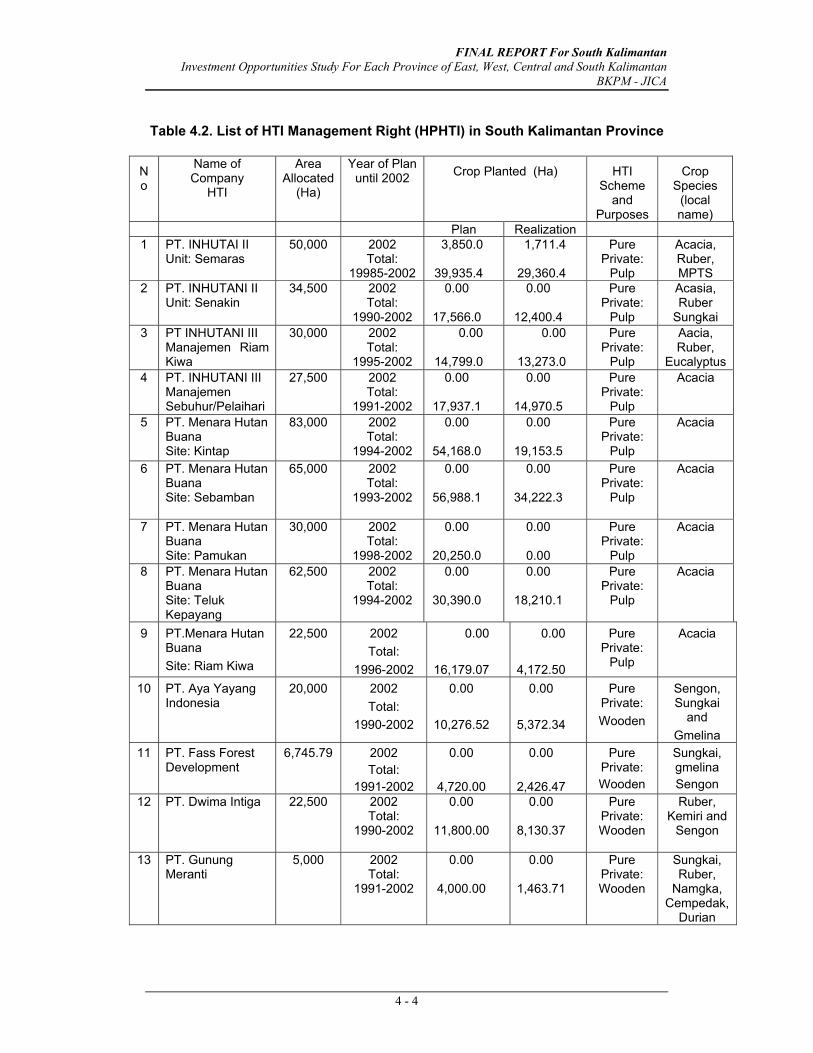
FINAL REPORT For South Kalimantan Investment Opportunities Study For Each Province of East, West, Central and South Kalimantan
BKPM - JICA
4 - 4
Table 4.2. List of HTI Management Right (HPHTI) in South Kalimantan Province
No
Name of Company
HTI
Area Allocated
(Ha)
Year of Plan until 2002 Crop Planted (Ha) HTI
Scheme and
Purposes
Crop Species
(local name)
Plan Realization 1
PT. INHUTAI II Unit: Semaras
50,000 2002 Total:
19985-2002
3,850.0
39,935.4
1,711.4
29,360.4
Pure Private:
Pulp
Acacia, Ruber, MPTS
2 PT. INHUTANI II Unit: Senakin
34,500
2002 Total:
1990-2002
0.00
17,566.0
0.00
12,400.4
Pure Private:
Pulp
Acasia, Ruber
Sungkai 3
PT INHUTANI III Manajemen Riam Kiwa
30,000
2002 Total:
1995-2002
0.00
14,799.0
0.00
13,273.0
Pure Private:
Pulp
Aacia, Ruber,
Eucalyptus4
PT. INHUTANI III Manajemen Sebuhur/Pelaihari
27,500
2002 Total:
1991-2002
0.00
17,937.1
0.00
14,970.5
Pure Private:
Pulp
Acacia
5
PT. Menara Hutan Buana Site: Kintap
83,000
2002 Total:
1994-2002
0.00
54,168.0
0.00
19,153.5
Pure Private:
Pulp
Acacia
6
PT. Menara Hutan Buana Site: Sebamban
65,000
2002 Total:
1993-2002
0.00
56,988.1
0.00
34,222.3
Pure Private:
Pulp
Acacia
7
PT. Menara Hutan Buana Site: Pamukan
30,000 2002 Total:
1998-2002
0.00
20,250.0
0.00
0.00
Pure Private:
Pulp
Acacia
8 PT. Menara Hutan Buana Site: Teluk Kepayang
62,500
2002 Total:
1994-2002
0.00
30,390.0
0.00
18,210.1
Pure Private:
Pulp
Acacia
9 PT.Menara Hutan Buana Site: Riam Kiwa
22,500
2002 Total:
1996-2002
0.00
16,179.07
0.00
4,172.50
Pure Private:
Pulp
Acacia
10 PT. Aya Yayang Indonesia
20,000
2002 Total:
1990-2002
0.00
10,276.52
0.00
5,372.34
Pure Private: Wooden
Sengon, Sungkai
and Gmelina
11 PT. Fass Forest Development
6,745.79
2002 Total:
1991-2002
0.00
4,720.00
0.00
2,426.47
Pure Private: Wooden
Sungkai, gmelina Sengon
12 PT. Dwima Intiga
22,500
2002 Total:
1990-2002
0.00
11,800.00
0.00
8,130.37
Pure Private: Wooden
Ruber, Kemiri and
Sengon
13 PT. Gunung Meranti
5,000 2002 Total:
1991-2002
0.00
4,000.00
0.00
1,463.71
Pure Private: Wooden
Sungkai, Ruber,
Namgka, Cempedak,
Durian
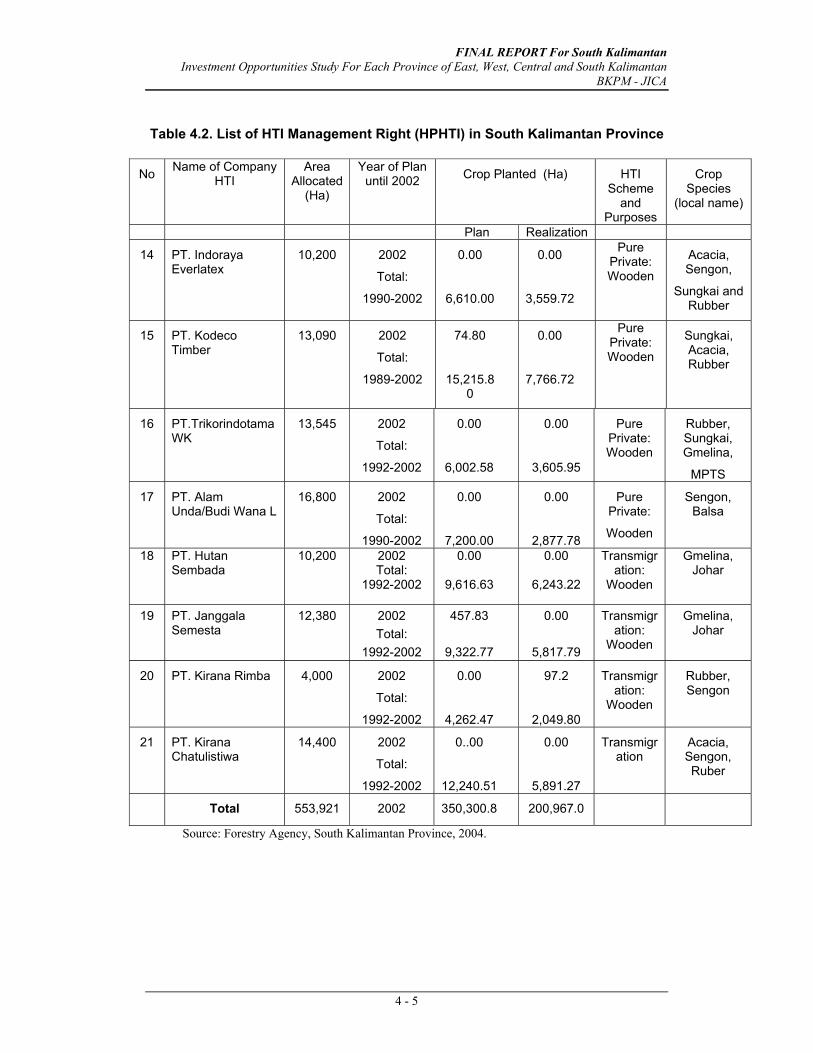
FINAL REPORT For South Kalimantan Investment Opportunities Study For Each Province of East, West, Central and South Kalimantan
BKPM - JICA
4 - 5
Table 4.2. List of HTI Management Right (HPHTI) in South Kalimantan Province
No Name of Company HTI
Area Allocated
(Ha)
Year of Plan until 2002 Crop Planted (Ha) HTI
Scheme and
Purposes
Crop Species
(local name)
Plan Realization
14 PT. Indoraya Everlatex
10,200 2002
Total:
1990-2002
0.00
6,610.00
0.00
3,559.72
Pure Private: Wooden
Acacia, Sengon,
Sungkai and Rubber
15 PT. Kodeco Timber
13,090 2002
Total:
1989-2002
74.80
15,215.80
0.00
7,766.72
Pure Private: Wooden
Sungkai, Acacia, Rubber
16 PT.Trikorindotama WK
13,545 2002
Total:
1992-2002
0.00
6,002.58
0.00
3,605.95
Pure Private: Wooden
Rubber, Sungkai, Gmelina,
MPTS
17 PT. Alam Unda/Budi Wana L
16,800 2002
Total:
1990-2002
0.00
7,200.00
0.00
2,877.78
Pure Private:
Wooden
Sengon, Balsa
18 PT. Hutan Sembada
10,200 2002 Total:
1992-2002
0.00
9,616.63
0.00
6,243.22
Transmigration:
Wooden
Gmelina, Johar
19 PT. Janggala Semesta
12,380 2002 Total:
1992-2002
457.83
9,322.77
0.00
5,817.79
Transmigration:
Wooden
Gmelina, Johar
20 PT. Kirana Rimba 4,000 2002
Total:
1992-2002
0.00
4,262.47
97.2
2,049.80
Transmigration:
Wooden
Rubber, Sengon
21 PT. Kirana Chatulistiwa
14,400 2002
Total:
1992-2002
0..00
12,240.51
0.00
5,891.27
Transmigration
Acacia, Sengon, Ruber
Total 553,921 2002 350,300.8 200,967.0
Source: Forestry Agency, South Kalimantan Province, 2004.
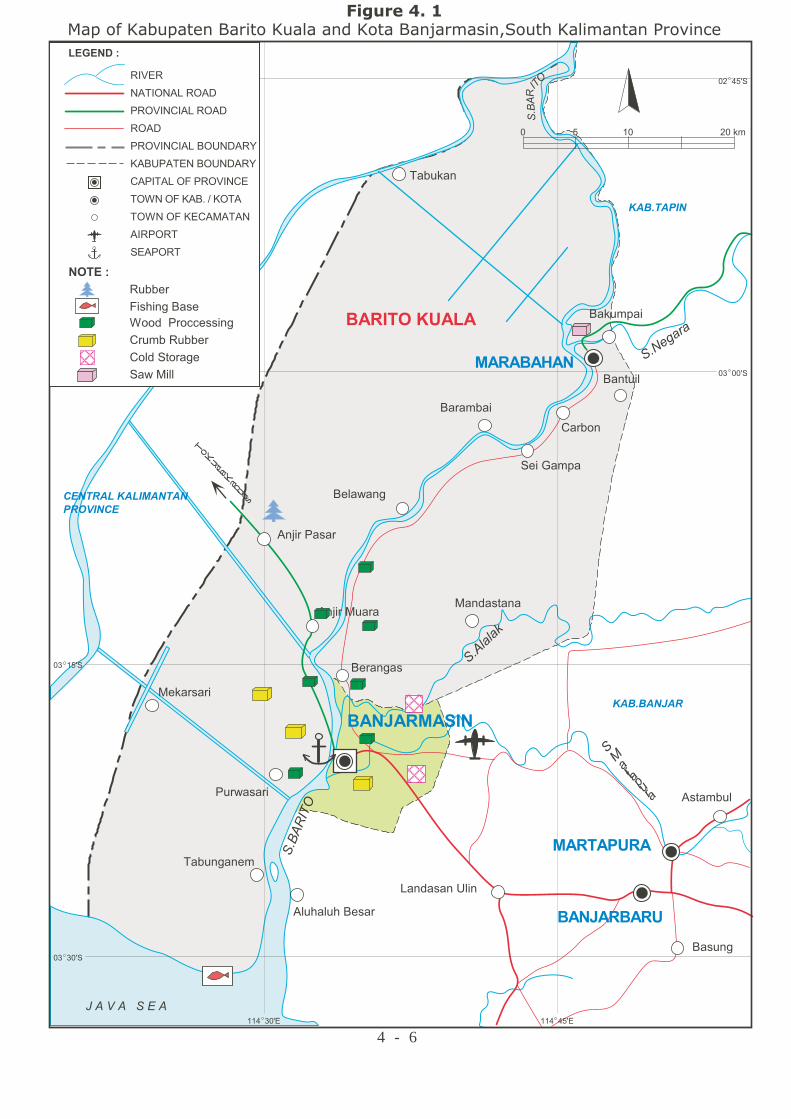
��������� ���������
�������
������
�������
�������
� � �� ����
��������
���
��������� ���
���
� ��������������� �
���������������� �
������������ ������
�������������������
������������ ����
�� �� �
���� �
� ��������� ���
�!"#$!"#��%&$'
�$()$&$(��!*(
�$&"(+
�&,$�-"!
%*�.$�/$
�$(,"*!
�$'$�-$*
�%!$0$(+
$()$&,$($
���
��������
�(1*'��$&$'
�(1*'� "$'$
��
�
� �
������
�����
����
���������
��� ���
�%'$(+$&
%�$'&$'*
�"'0$&$'*
�$-"(+$(%�
��
�
� ��
�$-"�$(
�$�"�/$*
�$'-2(
����
���
��������
������������
�2��"$!$��$/"$&
������������������������ ������������������ ���������������������������������
"--%'
������
�*&#*(+��$&%
$0� *!!
�22)���'233%&&*(+
�'"�-� "--%'
�2!)�,2'$+%
����������������
�� ����
���������
�������
4 - 6
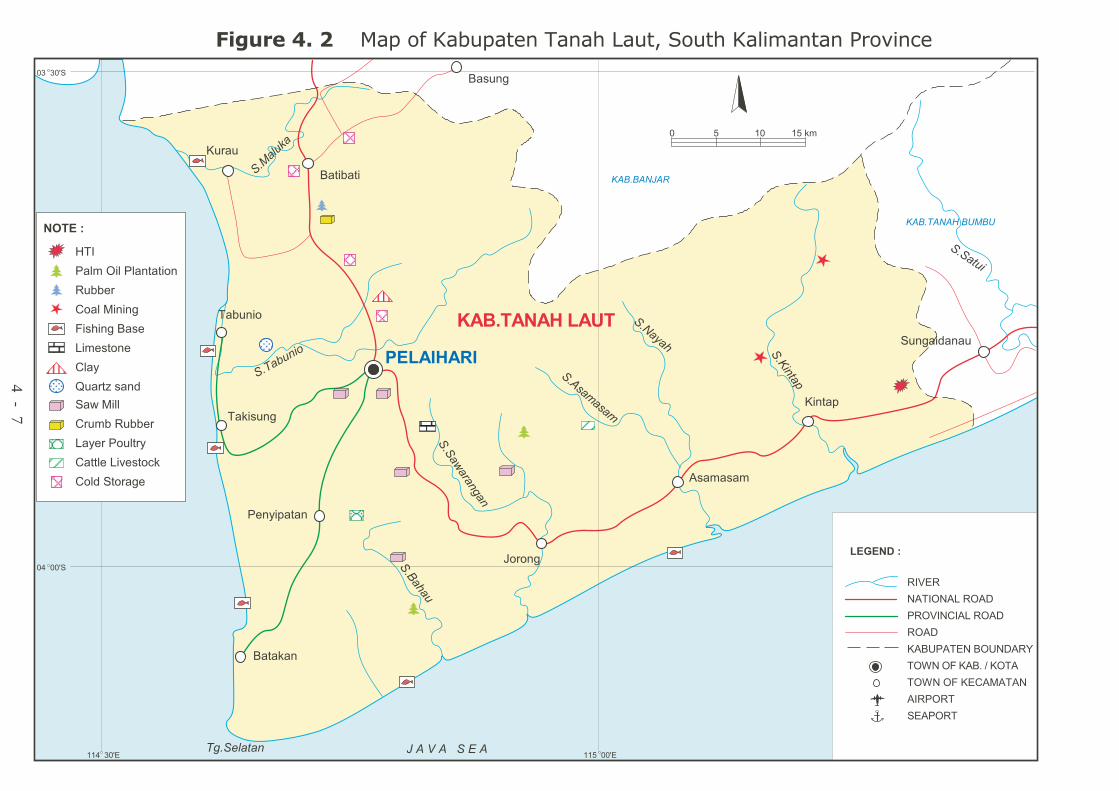
���������
��������
� � �� ���
���������
��������
���������������
��������� ��
���������
��������
� ���
��� ���������
����
������������������
�������������������
�����������������
� �����
�������
���� �� �������
� !"#$%
� $&"#'
�(#)$* + #
� + #
��������
�", "
� +$! +$
-%,%#'
�& &
�$#+ *
�"#' $. # "
������
� &"#'
�����
���������������������������� �������������������������������
���������
�������
������
���������
�����������
������
������
�����!�
4 - 7
� /��$/��/ #+ +$%#
�% /��$#$#'
�"!!(,
������
0�
�$&1$#'�� &(
�$(&+%#(
�/ )
2" ,+3�& #.
� 4��$//
� )(,��%"/+,)
� ++/(��$5(&+%6
�,"!��"!!(,
�%/.��+%, '(
FINAL REPORT For South Kalimantan Investment Opportunities Study For Each Province of East, West, Central and South Kalimantan
BKPM - JICA
4 - 8
4.1.2 Kabupaten Tanah Laut
Kabupaten Tanah Laut is situated at flat area toward the coastal area. Previously at Pelaihari there is Sugar Cane Plantation but currently this plantation is going to be sold by PTP, it is under collapse situation. Kabupaten Tanah Laut is promising area for back up raw material of Kota Banjarmasin industries due its location about 80 Km from Banjarmasin. The products of Kabupaten Tanah Laut would be marketed through Banjarmasin and it could take advantage of existing business facilities that available in Banjarmasin. Future prospect of Kabupaten Tanah Laut would be spill over of Banjarmasin business due its location and this Kabupaten has their own coastal which could be develop the sea communication. Governments including the Central Government have established Research Center for Ruminant Livestock, Animal Husbandry School, and extension centers for Livestock and other crops as well. A long the coastal area the brackishwater ponds are developed for shrimp farming. Also the location of Kabupaten Tanah Laut (with capital Pelaihari) is on the way to East Kalimantan. There is power plant of Asam-asam, good inland transportation to East Kalimantan, one special harbor for fisheries. Kabupaten Government of Tanah Laut has projection for this kabupaten to be centers of Palm oil, livestock, brackishwater shrimp, capture fisheries, coal mining, iron ore mining. An illustration of business opportunity in this area is fisheries sector. At present brackishwater shrimp farming is located a long the coastal area of Kabupaten Tanah Laut. Its main species are black tiger shrimp, and this is main product of brackishwater farming of this area. Currently the shrimp farming has faced the problem of insufficient fry, mostly the fry they bought from Java with high risk of mortality. Presently Kabupaten Tanah Laut has facility for fisheries development such as special harbor for fisheries capture. Tanah Laut is located on the way from Banjarmasin to East Kalimantan Province, the inland transportation is relatively good condition. Therefore the Kabupaten Tanah Laut (Pelaihari) could be an economic growth center for southern part area of South Kalimantan Province.
4.1.3 Kabupaten Tanah Bumbu and Kabupaten Kota Baru
Both Kabupatens have similar in term of geomorphology, however at present this area has been split out into two Kabupaten jurisdiction namely Kabupaten Tanah Bumbu with capital of Batulicin and Kabupaten Kotabaru with capital of Kotabaru (located at Laut Island). These Kabupatens have good labor for agriculture, most of them are transmigrates from Java that have settled since 1990s. Their skill in agriculture is much better than the indigenous habitant, so their productivity. Therefore these Kabupatens are conducive for intensive labor plantation. Kabupaten Tanah Bumbu has sea communication linkage through the Batulicin harbor, and the harbor is constructed in coastal area of Kabupaten Tanah Bumbu. While the Kabupaten Kotabaru has the Kotabaru harbor for sea communication so the products of mainland area of Kabupaten Kotabaru should transported to Kotabaru harbor by ferry.
FINAL REPORT For South Kalimantan Investment Opportunities Study For Each Province of East, West, Central and South Kalimantan
BKPM - JICA
4 - 9
However both harbors have good shape for transshipment due to the depth of waters of harbors sufficient to accommodate the big ships. According to inland transportation plan the Provincial Government of South Kalimantan will link the Kandangan and Batulicin, and at moment the work has began from Kandangan. Therefore in future the coal and rubber from northern parts of South Kalimantan will not pass through the Trisakti harbor any longer. The on going policy of Kabupaten Kotabaru and Tanah Bumbu encourage the sectors of Oil Palm plantation and Cement industry. Kabupaten Kotabaru also encourage the fisheries sector especially the seaweed farming in Laut Island. Main sectors of both Kabupatens is illustrated as follow.
Oil Palm Sub-sector Oil palm plantation is mostly located in Kabupaten of Kotabaru and Tanah Bumbu. Facilities available are 5 special harbors for palm oil transshipment. This area have labor source from previous transmigrations settlement project so lot of oil palm plantations are developed. Demand for crude palm oil is expected to grow in coming years and reach 40.5 million tones by the year 2020 (Oil World, 1996). Most of the demand for palm oil will continue to come from within Indonesia itself, China, India, Pakistan, and Malaysia (Casson,2000). Palm oil producers are expected to increase their share in the vegetable oil market because: (a) oil palm trees produce a much higher yield per hectare than any other seed oil; and (b) palm oil can usually be produced more cheaply than other vegetable oils. Cement Sub-sector The raw material of cement is Clinker, at moment the export price of Clinker is increasing. Statistic indicated that Clinker could make US$ 20,567,551.21 foreign currency for South Kalimantan. This Clinker exports through one special harbor at Kabupaten Kotabaru. Seaweed Farming Sub-sector Existing seaweed species that are farming in Kabupaten Kotabaru especially in Laut Island is Eucheuma red algae. This species is good for agar and carrageenan. Carrageenan, as well as other seaweed hydrocolloids, compete with other plant gums and even cellulose derivates which are often less expensive in some their end uses. The production capability of Laut Island area is 350 ton / year or 23.75 ton / month in dry eucheuma. Total suitable area for seaweed farming in Kabupaten Kotabaru is 2,695 Ha. Of this total 415 Ha has being cultivated. The production cycle of seaweed cultivation is about two month-cycle so in one year production it could be planted six times of harvesting. Therefore the raw material supply for carrageenan and agar processing will be easy to fulfill by local seaweed farming. Establishment of carraegeenan factory with PIR scheme of seaweed farming is a promising for investment in Laut Island.

116 00’E115 30’E
04 00’S
03 30’S
03 00’S
02 00’S
116 30’E
0 5 10 20 km
Saw M ill
CPO
Cold Storage
Palm Oil Plantation
Coal M ining
Rubber
Gold
NOTE :
HTI
Fishing Base
Lim estone
Clay
Quartz sand
Special Port CPO
4 -10
LEGEND :
RIVER
NATIONAL ROAD
ROAD
PROVINCIAL BOUNDARY
KABUPATEN BOUNDARY
TOW N OF KAB. / KOTA
TOW N OF KECAM ATAN
AIRPORT
SEAPORT
PROVINCIAL ROAD
Rantaupanjang
Stagen
Berangas
Sarungga
Sungaibali
P.SEBUKUSalinau
P.LAUT
Batubai
Karam bai
Lontar
Telukkem uning
Tg.Seloka
Palawan
Pantai
Sungaikupang
Sangkahanm elayu
Sansang
Sengayam
Dam ardatar
Gondang
S.Cengal
S.Sam pa
han
Batuam paran
Sungaidanau Satui
S.Satui
Lasung
Batukem udi
S.Batulicin
Pagatan
Sebam ban
M andam
Sam alantakanTg.Pam ukan
Sungaianyar
KO TABARU
BATULICIN
TANAH BUM BU
KOTABARU
To Kandangan
Figure 4. 3 M ap of M ain Natural Resources in Kabupaten Tanah Bum bu and Kabupaten Kotabaru, South Kalim antan Province
Tanjungbatu
Gunungbatubesar
Bakau
J A V A S E A
KAB.HULU SUNGAIUTARA
KAB.HULUSUNGAITENG AH
KAB.HULUSUNGAISELATAN
KAB.BANJAR
EAST KALIM ANTAN PROVINCE
MAKASSAR STRAIT
Sungaidurian
Ham pang
Sungailoban
Senakin
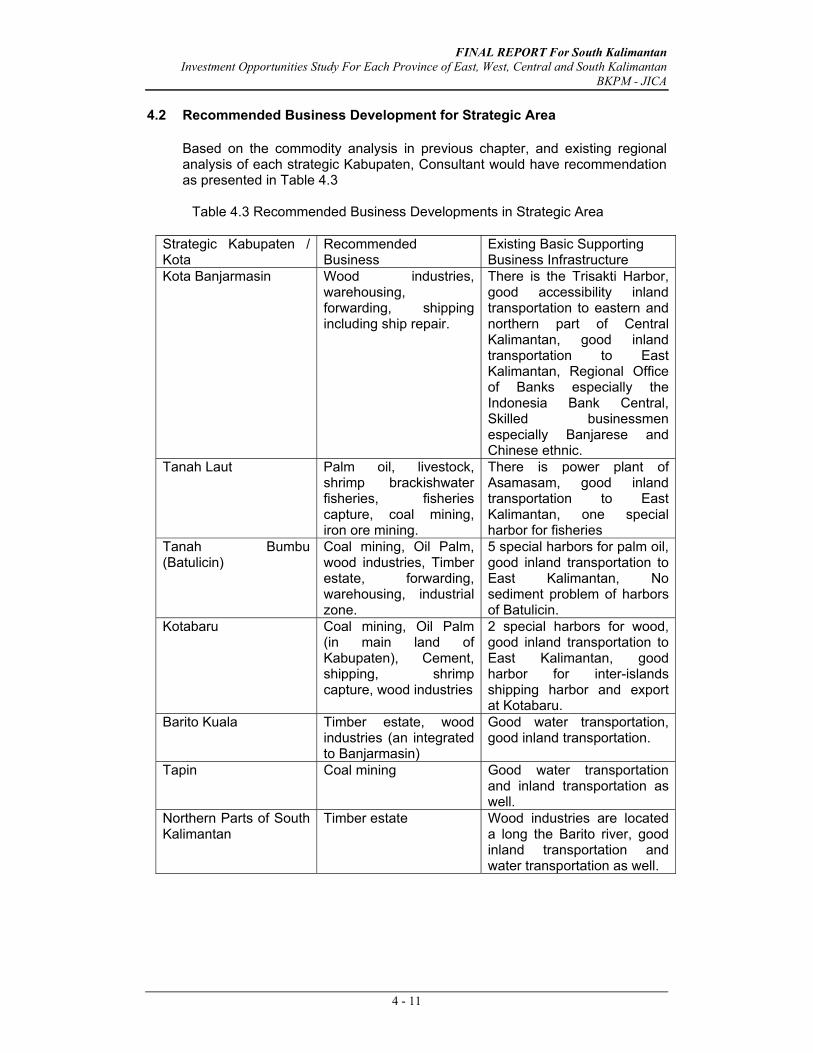
FINAL REPORT For South Kalimantan Investment Opportunities Study For Each Province of East, West, Central and South Kalimantan
BKPM - JICA
4 - 11
4.2 Recommended Business Development for Strategic Area
Based on the commodity analysis in previous chapter, and existing regional analysis of each strategic Kabupaten, Consultant would have recommendation as presented in Table 4.3
Table 4.3 Recommended Business Developments in Strategic Area
Strategic Kabupaten / Kota
Recommended Business
Existing Basic Supporting Business Infrastructure
Kota Banjarmasin Wood industries, warehousing, forwarding, shipping including ship repair.
There is the Trisakti Harbor, good accessibility inland transportation to eastern and northern part of Central Kalimantan, good inland transportation to East Kalimantan, Regional Office of Banks especially the Indonesia Bank Central, Skilled businessmen especially Banjarese and Chinese ethnic.
Tanah Laut Palm oil, livestock, shrimp brackishwater fisheries, fisheries capture, coal mining, iron ore mining.
There is power plant of Asamasam, good inland transportation to East Kalimantan, one special harbor for fisheries
Tanah Bumbu (Batulicin)
Coal mining, Oil Palm, wood industries, Timber estate, forwarding, warehousing, industrial zone.
5 special harbors for palm oil, good inland transportation to East Kalimantan, No sediment problem of harbors of Batulicin.
Kotabaru Coal mining, Oil Palm (in main land of Kabupaten), Cement, shipping, shrimp capture, wood industries
2 special harbors for wood, good inland transportation to East Kalimantan, good harbor for inter-islands shipping harbor and export at Kotabaru.
Barito Kuala Timber estate, wood industries (an integrated to Banjarmasin)
Good water transportation, good inland transportation.
Tapin Coal mining Good water transportation and inland transportation as well.
Northern Parts of South Kalimantan
Timber estate Wood industries are located a long the Barito river, good inland transportation and water transportation as well.
FINAL REPORT For South Kalimantan Investment Opportunities Study For Each Province of East, West, Central and South Kalimantan
BKPM - JICA
4 - 12
4.3 Government’s Regional Development Policy 4.3.1 Inland Transportation
This section presents the inter linkage analysis between South Kalimantan and Central Kalimantan Province. It is shown in Map No. 4.4 Regional Economic Linkages between Central and South Kalimantan Province. Fact indicates that South Kalimantan has leading in market oriented economic development, while Central Kalimantan has production oriented economic development. South Kalimantan has an advantage of inland transportation system to East Kalimantan through the corridor of Banjarmasin to Balikpapan through Rantau-Kandangan-Barabai and Tanjung. Also this corridor could go to Central Kalimantan through Amuntai – Tamianglayang – Buntok and Maurateweh of Central Kalimantan. The corridors of Banjarmasin pass through Pelaihari- Batulicin – to Tanah Grogot of East Kalimantan. The other corridor is Banjarmasin pass through Pulangpisau to Palangkaraya (Central Kalimantan). Kapuas and Barito are sailable up to Buntok area as the water transportation to bring coals that exploited in Kabupaten Buntok and Barito Timur (Central Kalimantan) should bring to Trisakti Harbor of South Kalimantan. Advantage for Central Kalimantan province especially the Kabupatens of Barito Utara, Barito Selatan, Barito Timur, Pulangpisau, and Kapuas is could send their products to end users and enjoy the business service of South Kalimantan through the Trisaksti harbor, inland transportation from Palangkaraya to Banjarmasin and East Kalimantan as well.
4.3.2 South Kalimantan Economic Market based, and Central Kalimantan Economic Development Product based.
Both Central and South Kalimantan should have a synergy effort in pursing their own economic development target. Based on existing inland transportation and water transportation network South Kalimantan Province is much better than Central Kalimantan. However, Infrastructures of South Kalimantan would not be benefit without the flow raw materials from Central Kalimantan Province to reach the intermediate area of transshipment to Java, Sulawesi, Malaysia, Brunei, Philippines, Chinese, Hongkong, Japan market. This situation would be taken many years before the situation is changed. It would be clear-cut between Central and South Kalimantan. Regional economic policy of South Kalimantan Province would be market oriented economic development policy, while the Central Kalimantan Province would be product oriented economic development policy. By this existing arrangement both provinces could synergic to each others. Almost the raw materials of palm oil, wood, and coal that are processed in South Kalimantan Province are come from Central Kalimantan Province.
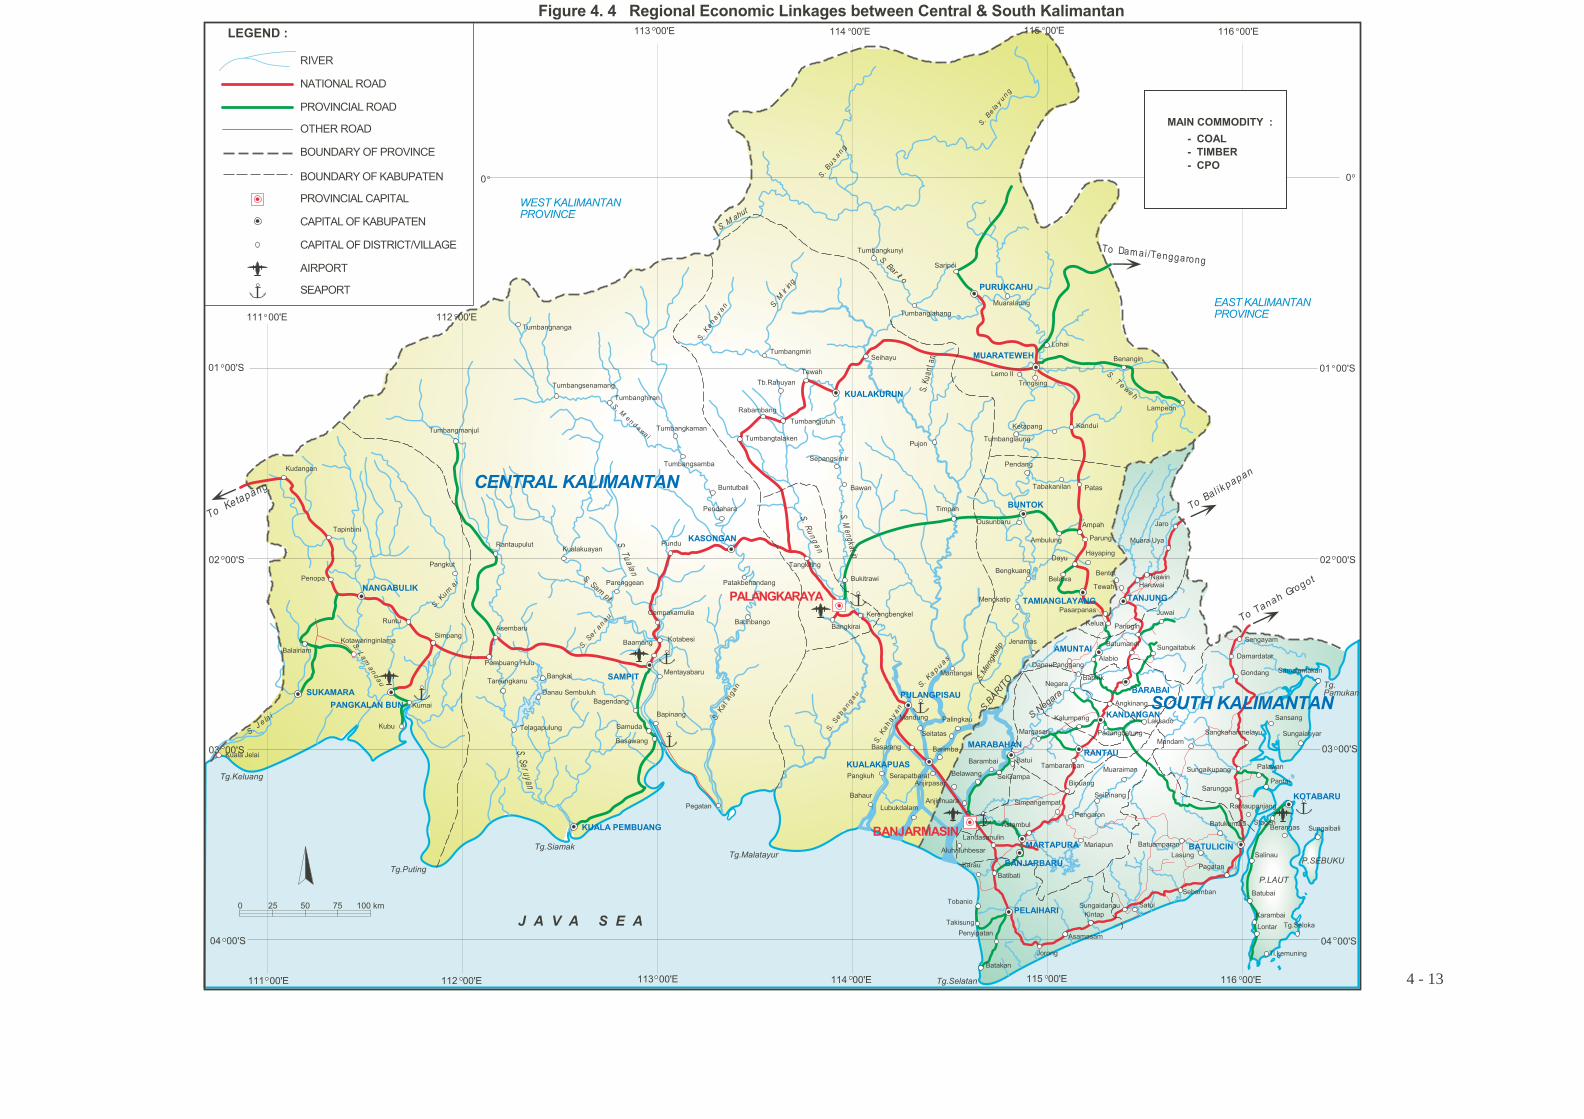
���������
��������
�������
�������
��������
�����������������������������������
�
�����������������
��������
�������� ��������� ���������
�
��������
�������
�������
���������
����� ������
��������
������
� ��� ����
���������������
���� ����!��
"�#!� ���#�!
$%����
&%#��
$%�������
�%�����!�
$%'�#�
��#�!����������
(%'��
�%�� ��
��'!�����
$��! )�
�%!�����
*�)��+�'�
$�����
������� �%�����)����
$�������
���+���
��������!
$��!���#!
(%�%��)%���%'
$����!��!
&! ���
�����)���
� )�'���
&�)����!'��
�%�+���
&� )���'����
(��+�!(%������
&�!���!��
*% ��,,
*���!
���!��!
�����'����
&� )���'�����
$%����!�
*� �%��
$�#��$�����)�'!
�%�+�����
&����!'!��
�����)%���+���
$���)����
�%�����
-% ���� �'!�
$�� ���(���)%�!
�%�����)���
$��!����
�� �+�
$���#���
$��%�+���
&%'�����'���
���������
�������% )�'��
$�����'&��.�������
��% )����! ����
�% )����� �'�
/�������'��(��'�������
���%���%��
���+�
(�+�����
��������
/,0�/
"�&,1"�*�/1��
�/10,"-,�*�/1��
1& �/�/1��
$1�"��/2�13��/10,"-�
$1�"��/2�13�(�$���&�"
�/10,"-,�*�-��,&�*
-��,&�*�13�(�$���&�"
-��,&�*�13��,�&/,-&40,**�5�
�,/�1/&
����1/&
&��!�)!�!
&� )��� ��.�'
�%����
�������
$�'�!�!�
/����
(���#��!��!�'� �
(� �!
(�)�
(��'���%'�!
�������� �
���� ����
����� ���
������ ���
���������
���� ��
�������
&� )�������!
�%!����
&%#��
&� )��� !�!
&� )���.����
&)6/������
/�)� )���
&� )�����'��%�
�%�����! !�
��.��
&� )����!���
&� )����� ��
&� )����� )�
&� )��������
&� )����%�� ���
����������������������
������
���������
������
�������
��������
������
�����
�����
����
������
������
��������
�����!��)��
����
����������
����������������������
����������������������
�%�����
�� ��+����
5��+��� �� �'�������
�����!�����
�������
���+�
��������� %'���
�����!������ ��'�#��
�����!��������
��������!
��.!������
��.!� ����
$������
&�)��!�
&��!����
�%��!�����
������
$��!)��!
��� ���
(!����
�����!+���� ����!
�%)� )��
�������
*�����
$���� �����
$����% �+!
/��������.���
����%�
��'!���
$%������ �����!)�'!
$���)�!
(��� )�!
*����� &�6�%'���
&'6�% ��!��
������
��������
���!��!�
$��� ��+!
�'�)!��������������
�����! ��
$!�����
�%!�!����
�%������
$���!
�! ����% ���
�%!5� ��
$��� )�!
$%'�#���&� )�������
���!����
������
���� )�'
(����
�'���'��)%���
*��+�����'!�
"%����$�)!�!�
����!����
(�'� ����
��+���)�����
*����+�
�����������
��������
����
� ����
��������
��������
������� �
��������� �����
�������� �����
���������
������������������� !"#��$ ! %�$���!&"��'�(�)*��!���!)�"#�+� �),��"#�%"!)"!
4 - 13
����������������
-�����
-��������
-�����
��������
��������
���������
FINAL REPORT For South Kalimantan Investment Opportunities Study For Each Province of East, West, Central and South Kalimantan
BKPM - JICA
4 - 14
The following scenario of investment policy would be recommended.
a. Capital Intensive Investment
People of South Kalimantan have a long experience with rubber cultivation which total community rubber plantation is 162,614 Ha. Almost all rubber belong to smallholding scheme so low quality due to simple processing technology. Effort of government to improved this scheme is to introduce the Nucleus Estate Scheme (PIR). Main problem of rubber production is to improve the efficiency of processing units through improving the rubber yield and extension the plantation. To establish a new rubber plantation needs a capital they no need the technology of rubber cultivation techniques. This situation the capital could be provided by local bank through promoting the PIR scheme. Bank Indonesia has initiated to promote the small scale enterprise through introducing the lower interest rate of investment. The scheme could be in form of PIR that can accommodate the local initiatives.
b. Capital and Technology based Investment
Due to poor infrastructures and existing availability of CPO in South Kalimantan the establishment the down stream industry of CPO would has affect the efficiency of transportation of product to market. Establishment of Cooking Oil refinery or Oleo chemical factory could be investment opportunity available in South Kalimantan. Therefore in future the CPO is necessary to transport to Java or Sulawesi any longer. Instead of CPO the end products such as cooking oil, oleo chemical, etc would be the main products of South Kalimantan in future. This down stream industry needs capital and technology. At first step the new investors are recommended to make a joint venture with existing oil palm owners in establishment the cooking oil or oleo chemical industry, then after establish their own oil palm plantation. Another sector could belong to this scenario is cement, ceramic factory for local market that can utilize the existing raw material of zircon that available in South Kalimantan.
c. Market and Capital based Investment
A lot of industry that no need high technology but the product is demanded by international market such as coal, fisheries, food industry etc. Those products are marketable in international market so the market and capital based investment is needed.
d. Market, Technology, and Capital based Investment
The products that international market oriented such as Coal, Nickel, Iron, Gold, Marble, Coarse send, Ocher, Koalinesi, Clay, Limestone, Granite, etc, dominated by strategic industries. For South Kalimantan those resources are indicated available at almost all Kabupatens. However at moment there is no accurate data available at South Kalimantan Government and national as well. The investment opportunity is still open for further exploration. This industry needs market, technology and capital.
FINAL REPORT For South Kalimantan Investment Opportunities Study For Each Province of East, West, Central and South Kalimantan
BKPM - JICA
4 - 15
4.4 Future Prospect of Major Strategic Area
4.4.1 Kota Banjarmasin with respect to Environmental Aspect
Trisakti harbor of Banjarmasin has problem of sediment that needs every year should be dredging while the Batulicin and Kotabaru harbors do not a such problems. The sedimentation of Triskati harbor is related to open space of up stream of Kapuas and Barito river. The excessive open space is because of coal mining in northern parts of South Kalimantan and kabupaten of Barito Timur, Barito Selatan, and Barito Utara (under Central Kalimantan Province jurisdiction). If this situation and environmental aspect not taking seriously considered the future of Trisakti harbor will be endanger. At present (when this study conducted) the transshipment in Barito estuary is a common practiced. The 5,000 DWT ship loading the cargo at a half part then sail back to estuary and waiting the small cargo ships in the estuary or sea for transshipment. For anticipating this situation the improvement open coal mining system should be seriously re-study. Whenever the Trisakti harbor not functioning as it expected the Batulicin and Kotabaru harbors would be replaced the Trisakti harbor function. Therefore the Central Kalimantan would also has the impact to transportation cost of their products. Moreover, the industries that located along the Barito river would affect directly, in turn the slowdown of industries or withdrawal from the area.
4.4.2 Kabupaten Tanah Laut, Tanah Bumbu, and Kotabaru with respect to Economic Development
Kabupaten Tanah Laut
Table 1.8 of Chapter 1 point outs the present population growth of Tanah Laut and Kotabaru (including Tanah Bumbu) is 2.5% and 3.0% respectively; and the density of Tanah Laut is 66.09 persons/sq.Km and Kotabaru (including Tanah Bumbu) is 31.31 persons/sq.Km. This high population growth is not only because of birth but also because of population mobility from other Kabupaten and out siders as well. The economic development of Kota Pleihari (Kabupaten Tanah Laut) in brackishwater pond for shrimps and oil palm plantation encourage the mobility of population from out side. Also, the Kabupaten Government is much concerned to fisheries development and corn production. The government also have attention in developing the livestock business, the government efforts would be established the Ruminant Livestock Research Center, Animal Husbandry Schools, Extension Centers. If availability corn, soybean and fish-meal industry in the area, the animal feed industry would be a promising.
Kabupaten Tanah Bumbu and Kotabaru
Batulicin and Kotabaru harbors have no sedimentation problems and its capacity possible to accommodate big ships. For Batulicin harbor the government is under going to link the Batulicin with Kandangan through inland transportation so the products from the northern part of South Kalimantan will go directly to Batulicin harbor. Beside this, the inland transportation from Central Kalimantan to East Kalimantan will pass through the Batulicin Town.
FINAL REPORT For South Kalimantan Investment Opportunities Study For Each Province of East, West, Central and South Kalimantan
BKPM - JICA
4 - 16
Due to position of Batulicin almost half way between Central and East Kalimantan borders it could be predictable Batulicin could be also as transit town with hotel, restaurant business development.
Kotabaru harbor is located at Laut island, this harbor is predicable to be an stopped port of ship on the way to Sulawesi straits or overseas. This Laut Island has potential in fisheries sectors. While the Kabupaten Kotabaru will be a center of oil palm plantation area of South Kalimantan in turn it will be an income sources for local budget (PAD).
4.5 Batulicin Industrial Development Bonded Zone / KAPET Batulicin
South Kalimantan has KAPET Batulicin with size is around 14,000,000 hectares covering both Kabupaten Kotabaru dan Tanah Bumbu. The location of the center of activities of Batulicin is in Kecamatan Batulicin in Kabupaten Tanah Bumbu. At present the office of KAPET is using for Bupati Office of Batu Licin Regency. Information that collected during study point out the KAPET is paralysed condition, no KAPET official available in the office so no confirmation on the KAPET function. Therefore there is no balance information can be collected during the survey. In concept of KAPET is a good idea, in the area of KAPET government facilities with some incentive for investment such as: Special tax application in KAPET Zone including the speed up the amortization of capital, fiscal lost compensation, and income tax of dividend is 10%, free tax of PPh article 22 on import of capital or equipment, construction, capital goods, raw materials, see Government Regulation No. 20/2000 and its complements, Ministry of Finance decree No 300/KMK.04/2000 This incentive is not make sense to the investors; they prefer to invest their business based on market oriented area. Therefore at moment the KAPET concept still in paper and each Kabupaten prefer has his own industrial development zone in their jurisdiction area. Restudy of KAPET operational plan could be recommended especially in context of autonomy system.
CONSTRAINTS IN INVESTMENT CLIMATE
FINAL REPORT For South Kalimantan Investment Opportunities Study For Each Province of East, West, Central and South Kalimantan
BKPM - JICA
5 - 1
CHAPTER 5
CONSTRAINTS IN INVESTMENT CLIMATE
5.1. Infrastructure Issues 5.1.1. Road and drainage
South Kalimantan Province has faced with the problems originated from natural environmental constraints. Flat area with slope 0-2% 1,615,630 Ha accounts for 40% of total province area 3,753,052 Ha. Moreover, rivers and high rainfalls in the flat area frequently cause flooding. This area needs an efficient and comprehensive drainage system. The comprehensive drainage system could not effectively function if the drainage canals are were constructed on partial basis. In case of road construction, the area faces with the problems of soft soil and very limited quarry especially stone. On the other hand, since there is no road that directly connects plantation sites and the main roads, the investors should construct their own access road and drainage system. Indeed in this study it is not possible to estimate the figure of the length of road or to decide whether new investors should construct drainage canals. This is because necessity and specification of these infrastructures depend upon the each project
5.1.2. Port / Harbor Triskati Port of Banjarmasin, one of the ports in South Kalimantan Province has a severe problem of sediment due to bare land in upstream and excessive open coal mining practices. Regular dredging is needed to address this problem. The most part of upstream area of Barito river is under jurisdiction of Central Kalimantan Provinces. Environmental Hazardous analysis should be integrated in one system of Kabupaten Barito Utara, Barito Timur, Barito Selatan (Central Kalimantan), Tabalong, Balangan, Hulu Sungai Utara, Hulu Sungai Tengah, Hulu Sungai Selatan, and Banjar (South Kalimantan Province jurisdiction). The run off from these Kabupatens will deposit sediments to Triskati Harbor of Bajarmasin. Also the sediments are deposited by excessive open coal mining in Kabupaten Barito Utara, Barito Timur, and Barito Sekatan area of Central Kalimantan Province; therefore, the Trisakti Harbor needs annual dredging to meet big ship requirements. Obviously this transshipment practice will affect the transportation cost. The excessive sediments are caused by not only open mining practices but also bare land in upstream watershed due to logging. According to South Kalimantan Communication Service, dredging and river widening will be completed, financed by Government budget The other prospective port is Batulicin Port, located in the Batulicin Integrated Economic Development Zone (IEDZ or KAPET).
FINAL REPORT For South Kalimantan Investment Opportunities Study For Each Province of East, West, Central and South Kalimantan
BKPM - JICA
5 - 2
The location of this port is very strategic in that it has access closely to international route of Makasar strait. It also has another advantage of deep sea. This port already has a pier of 170-meter length and 10 meter width. It serves for both inter island and international shipping with maximum 200,000 DWT and also this zone has docking facility.
5.1.3. Supporting Industry including Distribution sector / facility In South Kalimantan Province the facility of supporting industry is almost sufficient especially in the main cities such as Banjarmasin, but the new investment area have still faced the constraints. Most facilities of the supporting industry and distribution sector are located in Banjarmasin City, capital of South Kalimantan Province. In this city these exist a number of hotels with star classification, Banks, and communication facilities, in contrast, the new prospected areas such as Kabupatens of Tanah Laut, Tanah Bumbu, Kotabaru are not well equipped with such facilities. Especially In Banjarmasin in Trisakti harbor area there are a number of rental warehouses that can support the business activities. Also, a ring road has been constructed to ease the flow of goods and services to and from Trisakti port. In Kabupaten Tanah Laut, a power plant supplies the power to South Kalimantan and Central Kalimantan as well. Kabupatens of Tanah Bumbu and Kotabaru have supporting facilities such as special port for cement loading and CPO as well. Also the repair shop for ships is available in the area.
Almost all main Kabupatens in South Kalimantana have good main access road to connect border of Central Kalimantan (pass through Kota Banjarmasin, kabupatens of Tanah Laut, Tanah Bumbu, Kotabaru) and border of East Kalimantan. Also there is another main road in northern part, connecting Banjarmasin and Tabalong in northern part of South Kalimantan Province as well as Buntok, Muarateweh cities of Central Kalimantan Province. Inland and water transportation mode are sufficient for business purposes; however, in dry season the water transportation mode has restriction with the shorter sailable length than that in rainy season. The good road condition is mostly found in the main cities. In most cases, rural road especially road for plantation site needs to be constructed by investorin Indonesia and even in Sumatra Island.
5.2. Land Related Issues 5.2.1. Lack of database / information
Lack of coordination, update and continuous monitoring system regarding of land data has resulted in problem of map provision: - Inconsistency in sectoral land use map(forestry, plantation, mining, etc.). - Lacking of suitable map provided by local government, whereas some field
data are available in other agency such as university and private sector. - Investor always receive an old map with obsolete data; possibility the same
map given to earlier investor before they make field investigation or survey. - Overlapping of sectoral land use due to a lack of sectoral coordination in
database monitoring.
FINAL REPORT For South Kalimantan Investment Opportunities Study For Each Province of East, West, Central and South Kalimantan
BKPM - JICA
5 - 3
For these reason described above, new investors should examine the sites from many sources of map in selecting the project. Furthermore, they should discuss with local people at village level if necessary.
5.2.2. Overlapped Concession Land Certification: - Utilization permit (HGU) application process is still operated by central
government (BPN). This takes time results in complication and inconsistence in boundaries of cross sectoral land use (mining overtaking agricultural land use), especially for the area of 200 Ha or more.
- HGU is valid only for 30 years: however, around at least 5 years is spent for land preparation, community empowerment and planting (agriculture sector). Therefore a comprehensive plan should be prepared in advance.
- Investors use HGU for Bank Loan Corrateral and remain land development progress left behind; this causes the idle land problem.
5.2.3. Land Dispute With Local People - Land dispute regarding local/ indigenous ownership arises with many claims
referring to traditional unwritten law. As understand large part of indigenous are practicing shifting cultivation, where the left area are considered as their belonging although it has re-growth into secondary forest
- All actors, local government, communities, and stakeholders should be involved in the each stage (from the planning to the production stage) to minimize land dispute
5.2.4. HGU Issued by Central Government HGU for the area 200 Ha or more should be issued by the Central Government, Agency for National Land Affairs in Jakarta. The Bupati issues only the principle permits. In special case of South Kalimantan, the process to obtain land for rubber and oil palm plantation is “Adat” procedure in which communities and investors directory negotiate so that they can effectively avoid land disputes in future.
5.2.5. Land / Property Tax - The land/property tax is applied to any plantation or HTI, soon after local
government approves application and no grace period is applied Along 5-7 years before production period, investor has to pay property tax classified as produced plantation.
- The value of land/property tax are arranged by the central government. There is similar value for plantation utilization applies both to conversion area with better infrastructure (Sumatra) and remote isolated area (Kalimantan). Investor will choose Sumatra instead of Kalimantan by same property tax.
FINAL REPORT For South Kalimantan Investment Opportunities Study For Each Province of East, West, Central and South Kalimantan
BKPM - JICA
5 - 4
5.2.6. Huge Idle Land
Spatial Plan (RTRWP) of South Kalimantan Province indicates that the total area for plantation development will reach 955,085 Ha (year 2006).
- HGU issued : 159,566 Ha - Smallholders planting : 223,105 Ha - Total utilized land : 382,671 Ha Idle land: In this study it is estimated that total issued permit in process & “adat” unutilized land, is 562,414 Ha (955,085 - 382,671 Ha), while the Plantation Service’s estimation is 593,301 Ha.
Unutilized land does not necessarily imply that the land is available for new investors since it might belong to “Adat” or individual or state. Therefore if a project comprises the historical site, investor should conduct survey on the site prior to submission of an application.
5.3. Lack of Government’s Facility / Support 5.3.1. Incentives
Kabupaten Governments provide no incentive for investment; they only follow the guideline. Investment incentives are that given by BKPM (Investment Coordinating Board).
5.3.2. Levy / Retribution Many Kabupatens and cities are not able to allocate their routine budget from PAD (local revenue), except some wealthy Kabupaten. Excessive effort to collect revenue from tax and retribution results in a further high economy cost and low competitiveness that discourages investors. of the region to attract investment. PAD is the main target of local government, but at some extent the GRDP of Kabupaten is neglected. This could be happened because of Bupati faces the problem of insufficient budget for personnel salary, routine activity, etc. Also it might be the reason of this situation is the GRDP improvement take long time span if comparing to PAD improvement, while on the hand the Bupati’s tenure is limited in period of five years. So the GRDP improvement is not attractive to Bupati or Kabupaten DPRD. To overcome the problem of PAD in South Kalimantan the Kabupaten Government and Kabupaten Parliament issued the local regulation (PERDA) relevant to legal levies on commodities that pass through the river or road. Each commodity transferred through water and land transportation mode is levied by Kabupaten. For instance, the CPO passing through three Kabupaten has to be levied 3 times at respective post, each kilogram CPO charge at Rp.10.- per post. The term ”donation of third party” is used in PERDA instead of retribution. Experiences of businessmen of oil palm plantation the levy also collected during the fruit still in fresh harvest.
FINAL REPORT For South Kalimantan Investment Opportunities Study For Each Province of East, West, Central and South Kalimantan
BKPM - JICA
5 - 5
Their own generator, electricity in plantation complex also should pay the retribution. All of this could increase the production cost that could negatively influence end users and wages of labor as well
5.3.3. Over Regulation / Red Tape Plantation Business Permit (based on SK The Minister of Forestry and Estate Crop No. 107/Kpts-II/1999) limits the size of plantation scheme at 20,000 Ha for each company at one province, or limits the size 100,000 Ha per company at all over provinces of Indonesia. Business permits for pulp and paper plant is issued by Ministry of Trade and Industry while the business permit for timber estate (HTI) is issued by Ministry of Forestry; thus, new investors planning to submit the proposal should count the coordination among related agencies. Kabupaten Government should issue business permit for aquaculture as long as it is under 12 mile zone from the coast.
5.3.4. Lack of Support for Investment Dispute Including Land Dispute - Land dispute regarding local/ indigenous ownership arises with many claims
referring to traditional unwritten law. As understood most indigenous people are practicing shifting cultivation, where the left area are considered as their belonging although it has re-growth into secondary forest
- All actors, local government, communities, and stakeholders should be involved in the each stage (from the planning to the production stage) to minimize land dispute.
5.4. Labor Cost
Minimum wage rate of South Kalimantan Province, Rp 536,300 per month (in 2005), is the lowest among four provinces of Kalimantan. This increased by 11.22% compared to that of 2004. In addition to the general basis of minimum wage, the Governor of South Kalimantan has issued the minimum wage by sector basis through its decree No.059/2004, as follow: Bank sector :Rp.550,000 per month Cement and Coal / oil sector :Rp.545,000 per month Livestock, Food industry, “jamu” industry, spare-part, repair and Maintenance :less than Rp.545,000/month Daily Wage based on working day is greatly depend upon the season and place. In this study these are estimated as follows: 1. Semiskilled for construction works :Rp.50,000 per day 2. Semiskilled for agriculture works :Rp.35,000 per day 3. Semiskilled for operators :Rp.40,000 per day 4 Skilled artisan (Gold / jewelry smith etc) :Rp.80,000 per day The main problem of labor is deference in productivity. At some place the productivity of migrant labor is higher than the local counterpart, but to hire the migrant labor especially from outside could create jealous problem.
FINAL REPORT For South Kalimantan Investment Opportunities Study For Each Province of East, West, Central and South Kalimantan
BKPM - JICA
5 - 6
5.5. Land Price in Major Kabupaten/Kota
Market price of land of South Kalimantan varies greatly depending upon the location and its utilization plan. For instance in Banjarmasin city at commercial area the land price is Rp.4,500,000 – Rp.5,500,000 per m2 This is lower than that of rural area in the same region. Cost of HGU needed for plantation development is about Rp.100,000 per hectare consisting of two types of administrative cost (legal charge) and land acquisition cost that greatly depends upon the NJOP value (land property tax value). The land price in accessible area of Kabupaten Tanah Laut (Pelaihari), Tanah Bumbu (Batulicin), and Kotabaru is much lower than that in Banjarmasin. It is estimated at about 15-25% of Banjarmasin land price. Obviously the land price of remote area is much lower than that of accessible area.
5.6. Government’s Efforts
At present the Provincial Government has re-inventory the land dispute and idle land as well. To a certain extent, it is possible to improve the existing procedures of investment for South Kalimantan Province; however, the revised law No 22/1999 should be helpful in improving the investment procedures. The Parliament has issued the law No. 32/2004 and 33/2004 to solve the emerging problems caused by application of law No 22/1999. However, for the time being the effectiveness of those new laws still waiting the government regulations and detailed ministries concerned decrees.
5.7. Proposal
(1) The government should carefully consider further oil palm development; the existing plantation should be encouraged to plant their land with estate crops. The area of forestland considered suitable for oil palm development and conversion is already limited in this province. New investors should be encouraged to establish the down stream industries of CPO such as palm olein industry.
(2) The government should be more serious in limiting the size of land holdings by private companies by prohibiting conglomeracy.
(3) Local government should actively consult local communities about land acquisition necessary for further development before Kabupaten government allocates land to a particular company.
(4) HTI development should be encouraged especially in degraded lands rather than forestlands. Redirecting HTI development from forestland to degraded lands would allow the government to facilitate development HTI while minimizing the impact of further development on Indonesia’s forest cover.
FINAL REPORT For South Kalimantan Investment Opportunities Study For Each Province of East, West, Central and South Kalimantan
BKPM - JICA
5 - 7
(5) Government should simplify procedure and examine sufficient measures against law enforcement and its consistency.
(6) Enforce the Kabupaten Government and Kabupaten’s legislative; they should socialization the proposed local regulation (PERDA) at least 2 (two) years before its commencement. Authorized the Provincial Government charged as Ombudsman (mediator) Agency is to control and review the Kabupaten PERDA.
(7) It is recommended to review present regulations (Perda) to find out if they have disadvantages in promoting investment. The problem every local government faces is that application for investment is always greater than its realization. Local government should balance protections for smallholders and stimulation of investment by means of encouraging the present practices of Nucleus Estate Scheme (PIR) or contract farming.
PROPOSAL OF PROSPECTIVE PROJECTS
FINAL REPORT For SOUTH KALIMANTAN Investment Opportunities Study For Each Province of East, West, Central and South Kalimantan
BKPM - JICA
6 - 1
CHAPTER 6
PROPOSAL OF PROSPECTIVE PROJECTS
Detailed Project Profile of prospective commodity is explain base to present competitive condition including Production, Market with consideration to the national and word consumption. The following commodity could be recommended for investors to establish the business in South Kalimantan:
1. Crude Palm Oil Based Cooking Oil Factory 2. Integrated Rubber Business: Rubber Nursery, Replanting, Trading and Rubber
Processing 3. Hatchery and Shrimp Development 4. Seaweed Farming Development
Each propsed project will present in the following order:
1. Production Process, 2. Competitiveness 3. Market Opportunity 4. Potential Location 5. Infrastructure and Business Support Facilities 6. Proposed Business Scale 7. Cost of Factors
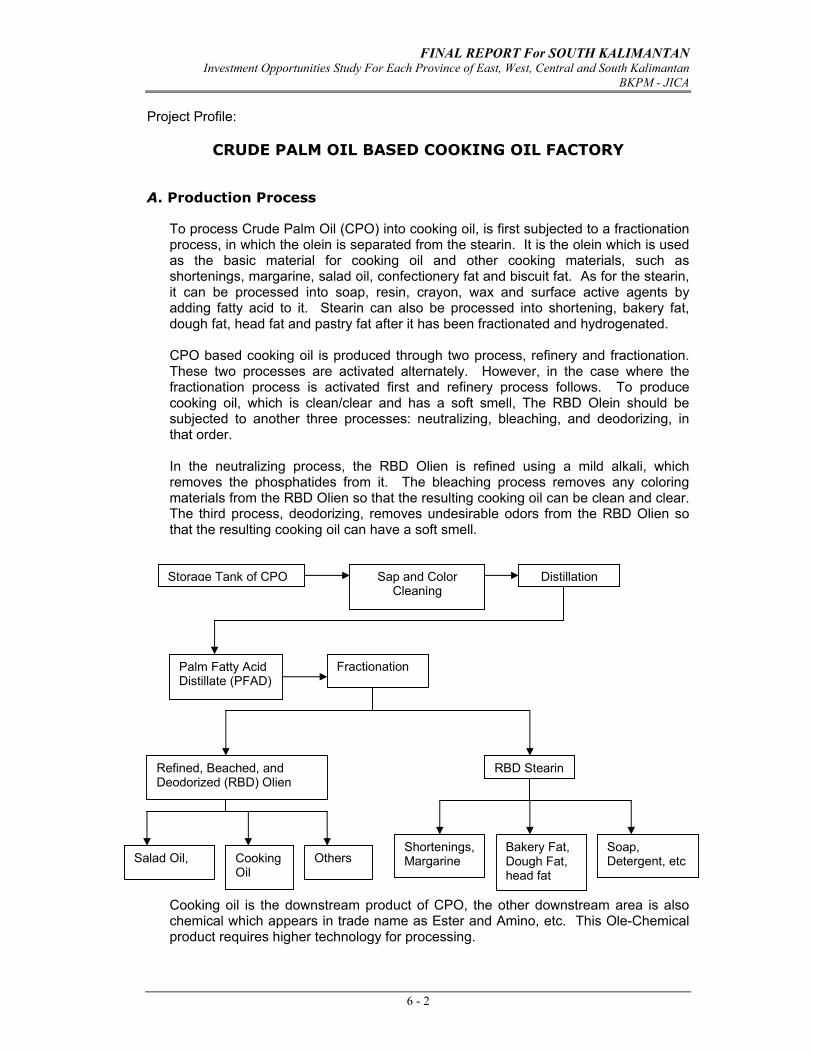
FINAL REPORT For SOUTH KALIMANTAN Investment Opportunities Study For Each Province of East, West, Central and South Kalimantan
BKPM - JICA
6 - 2
Project Profile:
CRUDE PALM OIL BASED COOKING OIL FACTORY A. Production Process
To process Crude Palm Oil (CPO) into cooking oil, is first subjected to a fractionation process, in which the olein is separated from the stearin. It is the olein which is used as the basic material for cooking oil and other cooking materials, such as shortenings, margarine, salad oil, confectionery fat and biscuit fat. As for the stearin, it can be processed into soap, resin, crayon, wax and surface active agents by adding fatty acid to it. Stearin can also be processed into shortening, bakery fat, dough fat, head fat and pastry fat after it has been fractionated and hydrogenated. CPO based cooking oil is produced through two process, refinery and fractionation. These two processes are activated alternately. However, in the case where the fractionation process is activated first and refinery process follows. To produce cooking oil, which is clean/clear and has a soft smell, The RBD Olein should be subjected to another three processes: neutralizing, bleaching, and deodorizing, in that order. In the neutralizing process, the RBD Olien is refined using a mild alkali, which removes the phosphatides from it. The bleaching process removes any coloring materials from the RBD Olien so that the resulting cooking oil can be clean and clear. The third process, deodorizing, removes undesirable odors from the RBD Olien so that the resulting cooking oil can have a soft smell. Cooking oil is the downstream product of CPO, the other downstream area is also chemical which appears in trade name as Ester and Amino, etc. This Ole-Chemical product requires higher technology for processing.
Storage Tank of CPO Sap and Color Cleaning
Distillation
Palm Fatty Acid Distillate (PFAD)
Fractionation
Refined, Beached, and Deodorized (RBD) Olien
RBD Stearin
Cooking Oil
Salad Oil, Others Shortenings, Margarine
Bakery Fat, Dough Fat, head fat
Soap, Detergent, etc
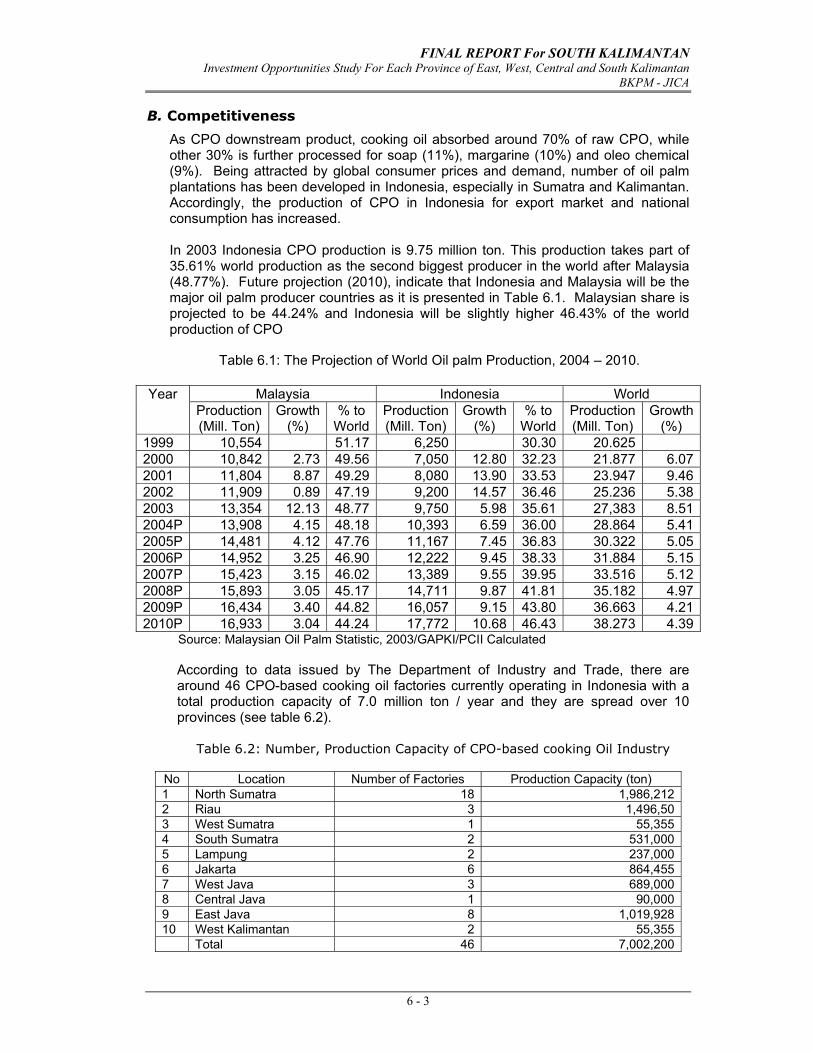
FINAL REPORT For SOUTH KALIMANTAN Investment Opportunities Study For Each Province of East, West, Central and South Kalimantan
BKPM - JICA
6 - 3
B. Competitiveness
As CPO downstream product, cooking oil absorbed around 70% of raw CPO, while other 30% is further processed for soap (11%), margarine (10%) and oleo chemical (9%). Being attracted by global consumer prices and demand, number of oil palm plantations has been developed in Indonesia, especially in Sumatra and Kalimantan. Accordingly, the production of CPO in Indonesia for export market and national consumption has increased.
In 2003 Indonesia CPO production is 9.75 million ton. This production takes part of 35.61% world production as the second biggest producer in the world after Malaysia (48.77%). Future projection (2010), indicate that Indonesia and Malaysia will be the major oil palm producer countries as it is presented in Table 6.1. Malaysian share is projected to be 44.24% and Indonesia will be slightly higher 46.43% of the world production of CPO
Table 6.1: The Projection of World Oil palm Production, 2004 – 2010.
Malaysia Indonesia World Year Production (Mill. Ton)
Growth (%)
% to World
Production(Mill. Ton)
Growth (%)
% to World
Production (Mill. Ton)
Growth (%)
1999 10,554 51.17 6,250 30.30 20.625 2000 10,842 2.73 49.56 7,050 12.80 32.23 21.877 6.072001 11,804 8.87 49.29 8,080 13.90 33.53 23.947 9.462002 11,909 0.89 47.19 9,200 14.57 36.46 25.236 5.382003 13,354 12.13 48.77 9,750 5.98 35.61 27,383 8.512004P 13,908 4.15 48.18 10,393 6.59 36.00 28.864 5.412005P 14,481 4.12 47.76 11,167 7.45 36.83 30.322 5.052006P 14,952 3.25 46.90 12,222 9.45 38.33 31.884 5.152007P 15,423 3.15 46.02 13,389 9.55 39.95 33.516 5.122008P 15,893 3.05 45.17 14,711 9.87 41.81 35.182 4.972009P 16,434 3.40 44.82 16,057 9.15 43.80 36.663 4.212010P 16,933 3.04 44.24 17,772 10.68 46.43 38.273 4.39
Source: Malaysian Oil Palm Statistic, 2003/GAPKI/PCII Calculated According to data issued by The Department of Industry and Trade, there are around 46 CPO-based cooking oil factories currently operating in Indonesia with a total production capacity of 7.0 million ton / year and they are spread over 10 provinces (see table 6.2).
Table 6.2: Number, Production Capacity of CPO-based cooking Oil Industry
No Location Number of Factories Production Capacity (ton) 1 North Sumatra 18 1,986,2122 Riau 3 1,496,503 West Sumatra 1 55,3554 South Sumatra 2 531,0005 Lampung 2 237,0006 Jakarta 6 864,4557 West Java 3 689,0008 Central Java 1 90,0009 East Java 8 1,019,92810 West Kalimantan 2 55,355 Total 46 7,002,200
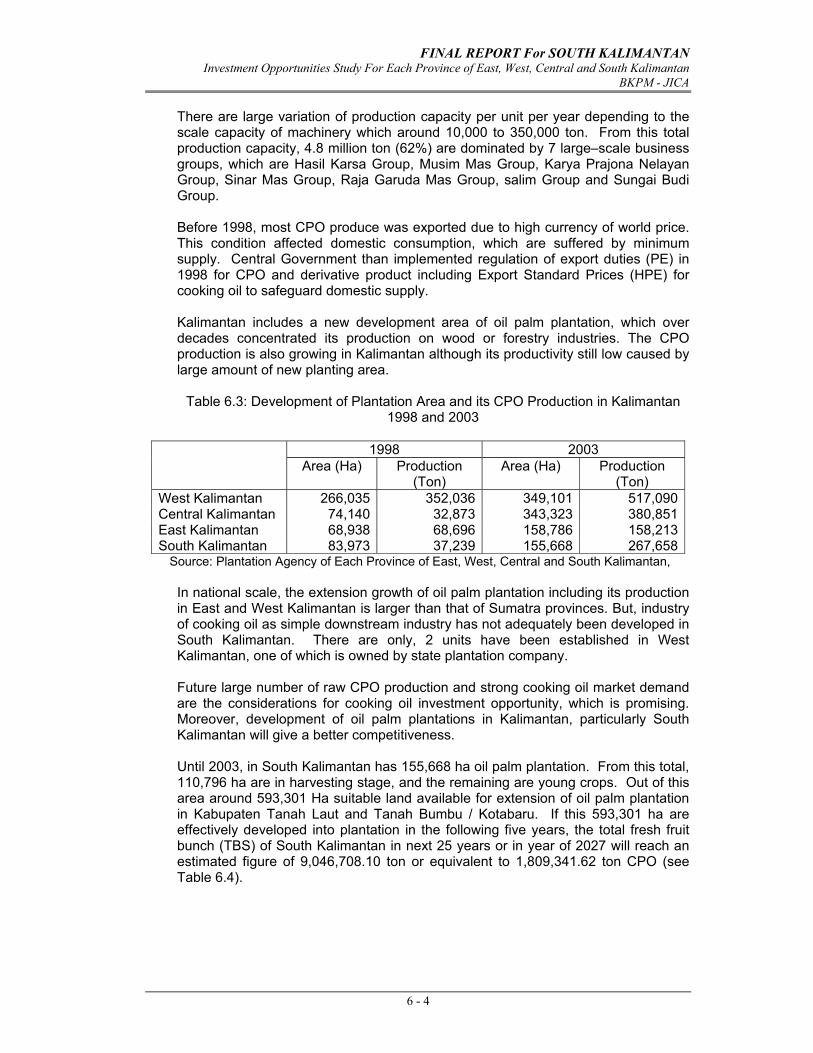
FINAL REPORT For SOUTH KALIMANTAN Investment Opportunities Study For Each Province of East, West, Central and South Kalimantan
BKPM - JICA
6 - 4
There are large variation of production capacity per unit per year depending to the scale capacity of machinery which around 10,000 to 350,000 ton. From this total production capacity, 4.8 million ton (62%) are dominated by 7 large–scale business groups, which are Hasil Karsa Group, Musim Mas Group, Karya Prajona Nelayan Group, Sinar Mas Group, Raja Garuda Mas Group, salim Group and Sungai Budi Group. Before 1998, most CPO produce was exported due to high currency of world price. This condition affected domestic consumption, which are suffered by minimum supply. Central Government than implemented regulation of export duties (PE) in 1998 for CPO and derivative product including Export Standard Prices (HPE) for cooking oil to safeguard domestic supply. Kalimantan includes a new development area of oil palm plantation, which over decades concentrated its production on wood or forestry industries. The CPO production is also growing in Kalimantan although its productivity still low caused by large amount of new planting area.
Table 6.3: Development of Plantation Area and its CPO Production in Kalimantan 1998 and 2003
1998 2003 Area (Ha) Production
(Ton) Area (Ha) Production
(Ton) West Kalimantan 266,035 352,036 349,101 517,090Central Kalimantan 74,140 32,873 343,323 380,851East Kalimantan 68,938 68,696 158,786 158,213South Kalimantan 83,973 37,239 155,668 267,658
Source: Plantation Agency of Each Province of East, West, Central and South Kalimantan, In national scale, the extension growth of oil palm plantation including its production in East and West Kalimantan is larger than that of Sumatra provinces. But, industry of cooking oil as simple downstream industry has not adequately been developed in South Kalimantan. There are only, 2 units have been established in West Kalimantan, one of which is owned by state plantation company. Future large number of raw CPO production and strong cooking oil market demand are the considerations for cooking oil investment opportunity, which is promising. Moreover, development of oil palm plantations in Kalimantan, particularly South Kalimantan will give a better competitiveness. Until 2003, in South Kalimantan has 155,668 ha oil palm plantation. From this total, 110,796 ha are in harvesting stage, and the remaining are young crops. Out of this area around 593,301 Ha suitable land available for extension of oil palm plantation in Kabupaten Tanah Laut and Tanah Bumbu / Kotabaru. If this 593,301 ha are effectively developed into plantation in the following five years, the total fresh fruit bunch (TBS) of South Kalimantan in next 25 years or in year of 2027 will reach an estimated figure of 9,046,708.10 ton or equivalent to 1,809,341.62 ton CPO (see Table 6.4).
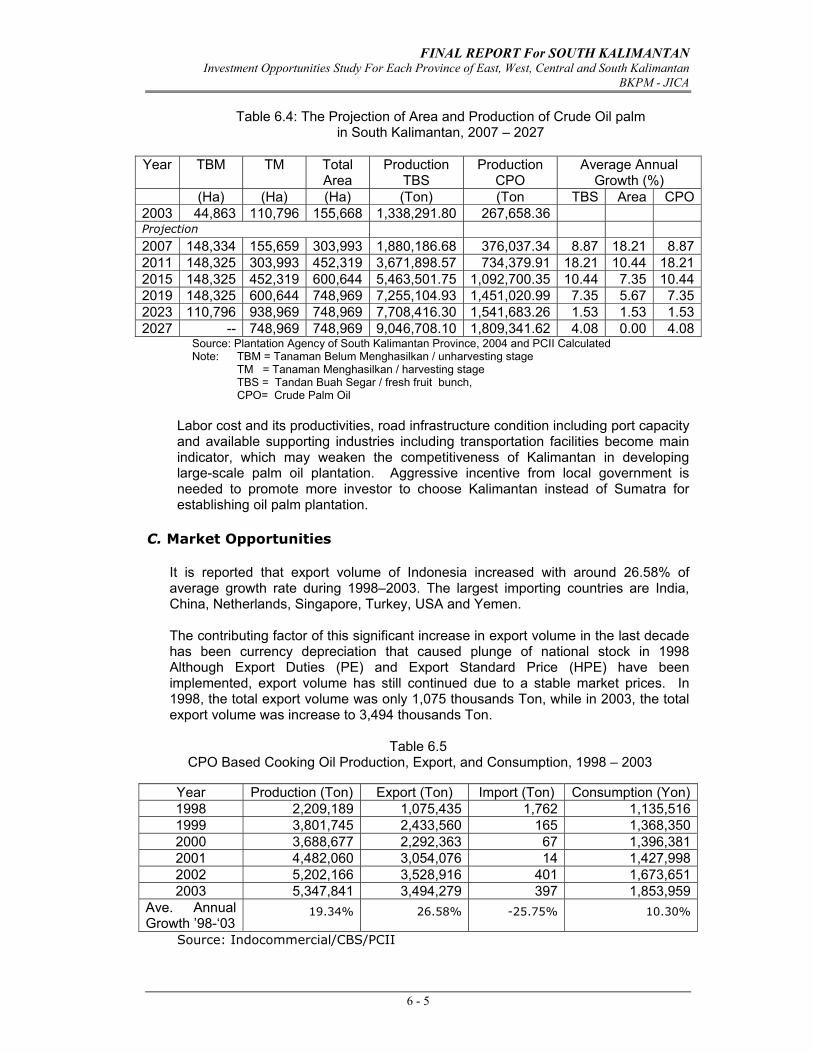
FINAL REPORT For SOUTH KALIMANTAN Investment Opportunities Study For Each Province of East, West, Central and South Kalimantan
BKPM - JICA
6 - 5
Table 6.4: The Projection of Area and Production of Crude Oil palm
in South Kalimantan, 2007 – 2027
Year TBM
TM
Total Area
Production TBS
Production CPO
Average Annual Growth (%)
(Ha) (Ha) (Ha) (Ton) (Ton TBS Area CPO2003 44,863 110,796 155,668 1,338,291.80 267,658.36 Projection 2007 148,334 155,659 303,993 1,880,186.68 376,037.34 8.87 18.21 8.872011 148,325 303,993 452,319 3,671,898.57 734,379.91 18.21 10.44 18.212015 148,325 452,319 600,644 5,463,501.75 1,092,700.35 10.44 7.35 10.442019 148,325 600,644 748,969 7,255,104.93 1,451,020.99 7.35 5.67 7.352023 110,796 938,969 748,969 7,708,416.30 1,541,683.26 1.53 1.53 1.532027 -- 748,969 748,969 9,046,708.10 1,809,341.62 4.08 0.00 4.08
Source: Plantation Agency of South Kalimantan Province, 2004 and PCII Calculated Note: TBM = Tanaman Belum Menghasilkan / unharvesting stage TM = Tanaman Menghasilkan / harvesting stage TBS = Tandan Buah Segar / fresh fruit bunch,
CPO= Crude Palm Oil Labor cost and its productivities, road infrastructure condition including port capacity and available supporting industries including transportation facilities become main indicator, which may weaken the competitiveness of Kalimantan in developing large-scale palm oil plantation. Aggressive incentive from local government is needed to promote more investor to choose Kalimantan instead of Sumatra for establishing oil palm plantation.
C. Market Opportunities
It is reported that export volume of Indonesia increased with around 26.58% of average growth rate during 1998–2003. The largest importing countries are India, China, Netherlands, Singapore, Turkey, USA and Yemen. The contributing factor of this significant increase in export volume in the last decade has been currency depreciation that caused plunge of national stock in 1998 Although Export Duties (PE) and Export Standard Price (HPE) have been implemented, export volume has still continued due to a stable market prices. In 1998, the total export volume was only 1,075 thousands Ton, while in 2003, the total export volume was increase to 3,494 thousands Ton.
Table 6.5 CPO Based Cooking Oil Production, Export, and Consumption, 1998 – 2003
Year Production (Ton) Export (Ton) Import (Ton) Consumption (Yon)1998 2,209,189 1,075,435 1,762 1,135,5161999 3,801,745 2,433,560 165 1,368,3502000 3,688,677 2,292,363 67 1,396,3812001 4,482,060 3,054,076 14 1,427,9982002 5,202,166 3,528,916 401 1,673,6512003 5,347,841 3,494,279 397 1,853,959
Ave. Annual Growth ’98-‘03
19.34% 26.58% -25.75% 10.30%
Source: Indocommercial/CBS/PCII
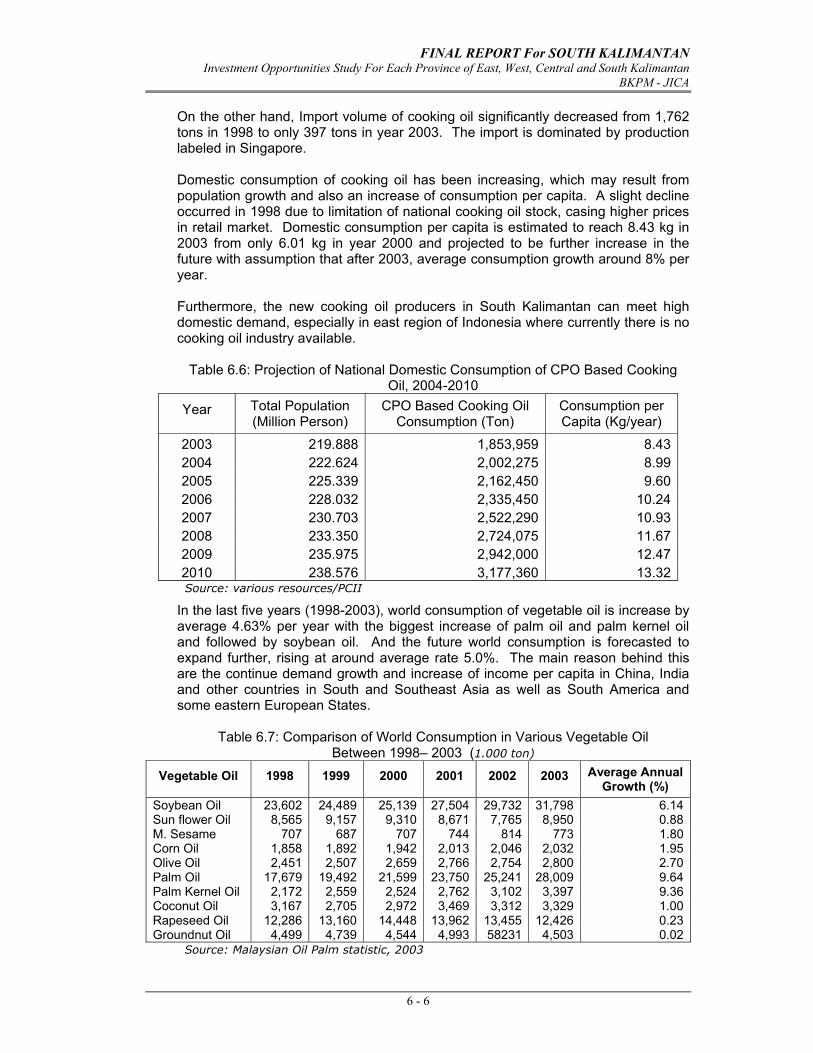
FINAL REPORT For SOUTH KALIMANTAN Investment Opportunities Study For Each Province of East, West, Central and South Kalimantan
BKPM - JICA
6 - 6
On the other hand, Import volume of cooking oil significantly decreased from 1,762 tons in 1998 to only 397 tons in year 2003. The import is dominated by production labeled in Singapore. Domestic consumption of cooking oil has been increasing, which may result from population growth and also an increase of consumption per capita. A slight decline occurred in 1998 due to limitation of national cooking oil stock, casing higher prices in retail market. Domestic consumption per capita is estimated to reach 8.43 kg in 2003 from only 6.01 kg in year 2000 and projected to be further increase in the future with assumption that after 2003, average consumption growth around 8% per year. Furthermore, the new cooking oil producers in South Kalimantan can meet high domestic demand, especially in east region of Indonesia where currently there is no cooking oil industry available.
Table 6.6: Projection of National Domestic Consumption of CPO Based Cooking
Oil, 2004-2010
Year Total Population (Million Person)
CPO Based Cooking Oil Consumption (Ton)
Consumption per Capita (Kg/year)
2003 219.888 1,853,959 8.432004 222.624 2,002,275 8.992005 225.339 2,162,450 9.602006 228.032 2,335,450 10.242007 230.703 2,522,290 10.932008 233.350 2,724,075 11.672009 235.975 2,942,000 12.472010 238.576 3,177,360 13.32Source: various resources/PCII
In the last five years (1998-2003), world consumption of vegetable oil is increase by average 4.63% per year with the biggest increase of palm oil and palm kernel oil and followed by soybean oil. And the future world consumption is forecasted to expand further, rising at around average rate 5.0%. The main reason behind this are the continue demand growth and increase of income per capita in China, India and other countries in South and Southeast Asia as well as South America and some eastern European States.
Table 6.7: Comparison of World Consumption in Various Vegetable Oil Between 1998– 2003 (1.000 ton)
Vegetable Oil 1998 1999 2000 2001 2002 2003 Average Annual Growth (%)
Soybean Oil 23,602 24,489 25,139 27,504 29,732 31,798 6.14Sun flower Oil 8,565 9,157 9,310 8,671 7,765 8,950 0.88M. Sesame 707 687 707 744 814 773 1.80Corn Oil 1,858 1,892 1,942 2,013 2,046 2,032 1.95Olive Oil 2,451 2,507 2,659 2,766 2,754 2,800 2.70Palm Oil 17,679 19,492 21,599 23,750 25,241 28,009 9.64Palm Kernel Oil 2,172 2,559 2,524 2,762 3,102 3,397 9.36Coconut Oil 3,167 2,705 2,972 3,469 3,312 3,329 1.00Rapeseed Oil 12,286 13,160 14,448 13,962 13,455 12,426 0.23Groundnut Oil 4,499 4,739 4,544 4,993 58231 4,503 0.02
Source: Malaysian Oil Palm statistic, 2003
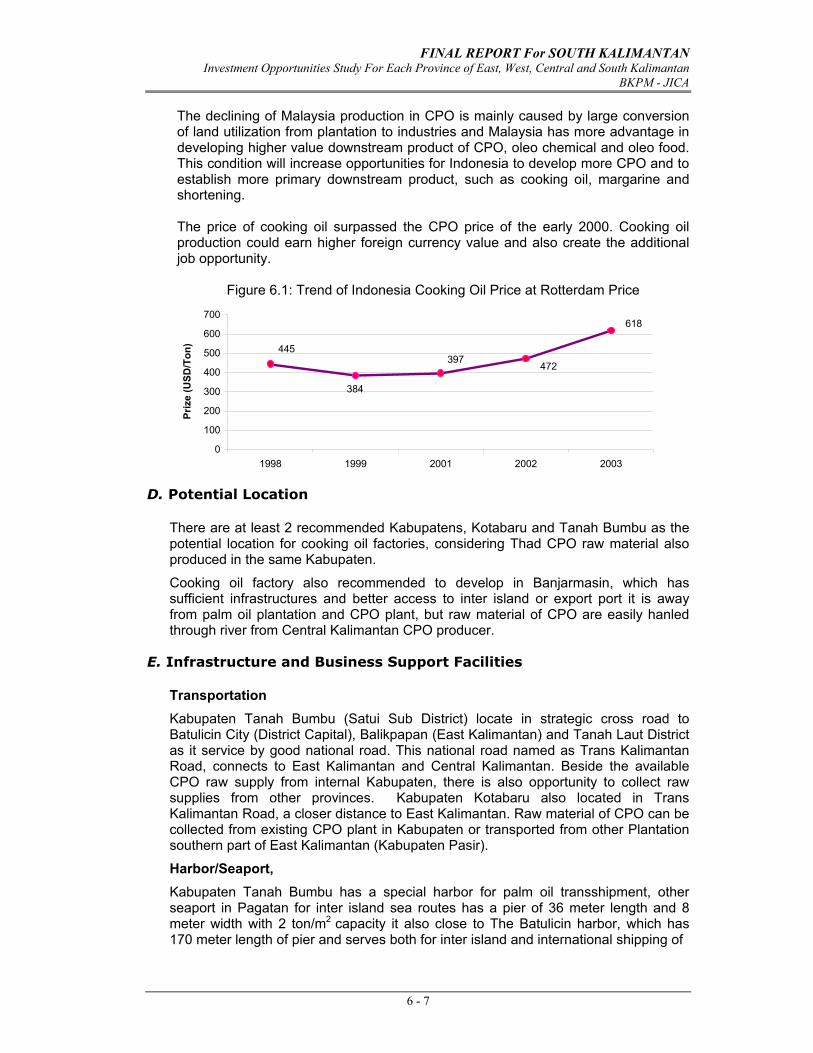
FINAL REPORT For SOUTH KALIMANTAN Investment Opportunities Study For Each Province of East, West, Central and South Kalimantan
BKPM - JICA
6 - 7
The declining of Malaysia production in CPO is mainly caused by large conversion of land utilization from plantation to industries and Malaysia has more advantage in developing higher value downstream product of CPO, oleo chemical and oleo food. This condition will increase opportunities for Indonesia to develop more CPO and to establish more primary downstream product, such as cooking oil, margarine and shortening. The price of cooking oil surpassed the CPO price of the early 2000. Cooking oil production could earn higher foreign currency value and also create the additional job opportunity.
Figure 6.1: Trend of Indonesia Cooking Oil Price at Rotterdam Price
618
472397
384
445
0
100
200
300
400
500
600
700
1998 1999 2001 2002 2003
Priz
e (U
SD/T
on)
D. Potential Location
There are at least 2 recommended Kabupatens, Kotabaru and Tanah Bumbu as the potential location for cooking oil factories, considering Thad CPO raw material also produced in the same Kabupaten.
Cooking oil factory also recommended to develop in Banjarmasin, which has sufficient infrastructures and better access to inter island or export port it is away from palm oil plantation and CPO plant, but raw material of CPO are easily hanled through river from Central Kalimantan CPO producer.
E. Infrastructure and Business Support Facilities
Transportation Kabupaten Tanah Bumbu (Satui Sub District) locate in strategic cross road to Batulicin City (District Capital), Balikpapan (East Kalimantan) and Tanah Laut District as it service by good national road. This national road named as Trans Kalimantan Road, connects to East Kalimantan and Central Kalimantan. Beside the available CPO raw supply from internal Kabupaten, there is also opportunity to collect raw supplies from other provinces. Kabupaten Kotabaru also located in Trans Kalimantan Road, a closer distance to East Kalimantan. Raw material of CPO can be collected from existing CPO plant in Kabupaten or transported from other Plantation southern part of East Kalimantan (Kabupaten Pasir).
Harbor/Seaport, Kabupaten Tanah Bumbu has a special harbor for palm oil transshipment, other seaport in Pagatan for inter island sea routes has a pier of 36 meter length and 8 meter width with 2 ton/m2 capacity it also close to The Batulicin harbor, which has 170 meter length of pier and serves both for inter island and international shipping of
FINAL REPORT For SOUTH KALIMANTAN Investment Opportunities Study For Each Province of East, West, Central and South Kalimantan
BKPM - JICA
6 - 8
maximum 200,000 DWT. Kabuapten Kotabaru is facilitate with a special harbor for palm oil transshipment and other The Gunung Batu Besar Seaport Harbor to serve inter island as shipping routes. Banjarmasin City and Surrounding has Trisakti harbor as main harbor in South Kalimantan. This harbor is not only benefit for South Kalimantan Province but also for Central Kalimantan Province. It serves both inter island and international shipment
Airport, Kabupaten Tanah Bumbu has an airport (Batulicin Airport), which is managed by Local Government of Kabupaten Tanah Bumbu. It only serves local routes, to Banjarmasin
Banjarmasin City and Surrounding has an airport (Syamsuddin Noor Airport), which is centrally managed PT. Angkasa Pura. It serves local routes, like to Batulicin and Kotabaru, national routes to Jakarta, Semarang, Surabaya, Makasar, and other cities. During Hajj season, the airport also serve international direct flights to Saudi Arabia.
Electricity In general South Kalimantan Province has limited capacity of electricity particurlaly for larger industries. Investor is requested to build their own independenpower supplier for cooking oil factory, with ranging capacity 2 – 5 megawatt.
F. Proposed Business Scale
The consideration with production CPO in South Kalimantan, then efficiency to establishment cooking oil factory is 55,000 ton per year in this area.
G. Cost of Factor
For cooking oil industry, several components of the project and also as main factors of cost should be prepared. And main cost of factor divided into investment cost and operational cost are: Investment Cost: • Permit : Location permit, HGU, IMB and IUT. • Land : Land price for cooking oil industry has a various fluctuated depend
on location strategic and position of land in KIK which about Rp.85,000 to Rp.150,000 per meter square.
• Building/factory: Special factory building needs for produce cooking oil. In the building area also needs other facilities such as office, transportation/equipment warehouse, plant of maintenance activities, and products warehouse.
• Equipment/Machine: Factory equipments for cooking oil processing including the CPO clearness, CPO saturated fat rate, steam, distillation, product control small laboratory, and packaging installation, etc.
• Electricity: Diesel Power Supply, 2-5 Megawatt. • Clean Water: Clean water unit (jet pump) is needed for general processing.
It should sufficient number and capacity. Operational Cost: • Labor : Labor wage for cooking oil industry in South Kalimantan is
Rp.545,000 per month. • Raw Material: CPO with price followed international price • Transportation/Vehicle: Cost for transportation various fluctuated depends on
activities, type and distance, like cost of truck with capacity 5,000 liter, minimum Rp.4,500,000/month from factory to harbor
FINAL REPORT For SOUTH KALIMANTAN Investment Opportunities Study For Each Province of East, West, Central and South Kalimantan
BKPM - JICA
6 - 9
Project Profile
INTEGRATED RUBBER BUSINESS: RUBER NURSERY, REPLANTING,TRADING BUSINESS AND RUBBER PROCESSING
A. Production Process
This is an integrated business between nursery business, replanting, trading business and rubber processing in one scheme. This is necessary to be establishing due to the rubber seedling nursery business take time to have a return. While it is waiting, the investors do the rubber trading and improving the rubber production of smallholders planting. On the hand the businessmen provide the seedling of recommended rubber clone for smallholder rubber replanting program, they could make an arrangement mutual benefit agreement such as the PIR scheme or Contract Farming. At early stage, the smallholder sell their rubber to company and the company will provide the seedling materials and some agriculture inputs. In long term the smallholders will sell their rubber to company at market price. All of this should be based on business contract. Rubber can be propagated utilizing seedling or vegetative, through the use of budding. Although the use of selected polyclonal seedlings should play a more important role in Indonesian rubber development than is currently the case, Government and local government emphasize the replanting of the smallholder’s rubber, especially the Province Government has initiated the replanting through its local budget. Also the Government emphasize is thus far directed towards the exclusive use of clonal (vegetative propagated) rubber. For all rubber plantings, it is essential to match the genetic type and variability to the site and requirements of the users. In the case of smallholders, it is necessary to ensure genetic diversity to avoid repeating the many errors of the past, when undue reliance was placed on too limited a range of clones. Currently recommended method of propagating rubber for smallholders is through bud grafting. Main procedures of seedling production process are: Seed Sowing, Seed Transplanting, Seedling Nursery, Budding and the polybag plant – Finishing Nursery.
B. Competitiveness
The competitor of rubber seedling business is a private or state own rubber planting material producer that have been establishing in North Sumatra and South Sumatra. However, the recommended rubber clones for West Kalimantan, East Kalimantan, and Central Kalimantan are almost the similar the rubber agro-climate while the South Kalimantan is similar to South Sulawesi, Central Sulawesi, Papua. Rubber clones that produce in South Kalimantan will have advantage in market area to South Sulawesi, Central Sulawesi, and Papua province therefore the competitiveness of rubber planting materials that produce in South Kalimantan has wide area of market region. Rubber processing industries in South Kalimantan are currently experiencing production capacity (idle production) because of the shortage of raw material supplies caused by low natural rubber production. But in the mid and long term with has result rubber trees from replanting, rubber processing industries that produce RSS (rubber smoke sheet) and SIR (standard Indonesian rubber) will
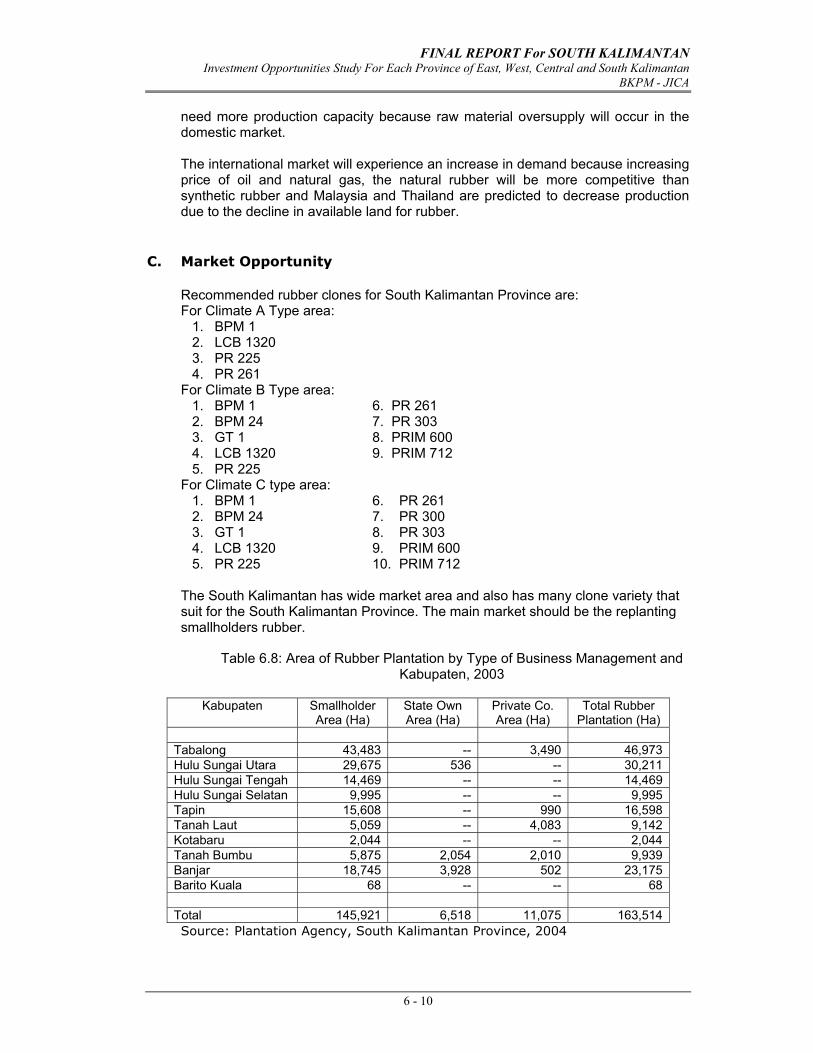
FINAL REPORT For SOUTH KALIMANTAN Investment Opportunities Study For Each Province of East, West, Central and South Kalimantan
BKPM - JICA
6 - 10
need more production capacity because raw material oversupply will occur in the domestic market. The international market will experience an increase in demand because increasing price of oil and natural gas, the natural rubber will be more competitive than synthetic rubber and Malaysia and Thailand are predicted to decrease production due to the decline in available land for rubber.
C. Market Opportunity
Recommended rubber clones for South Kalimantan Province are: For Climate A Type area:
1. BPM 1 2. LCB 1320 3. PR 225 4. PR 261
For Climate B Type area: 1. BPM 1 6. PR 261 2. BPM 24 7. PR 303 3. GT 1 8. PRIM 600 4. LCB 1320 9. PRIM 712 5. PR 225
For Climate C type area: 1. BPM 1 6. PR 261 2. BPM 24 7. PR 300 3. GT 1 8. PR 303 4. LCB 1320 9. PRIM 600 5. PR 225 10. PRIM 712
The South Kalimantan has wide market area and also has many clone variety that suit for the South Kalimantan Province. The main market should be the replanting smallholders rubber.
Table 6.8: Area of Rubber Plantation by Type of Business Management and Kabupaten, 2003
Kabupaten Smallholder
Area (Ha) State Own Area (Ha)
Private Co. Area (Ha)
Total Rubber Plantation (Ha)
Tabalong 43,483 -- 3,490 46,973Hulu Sungai Utara 29,675 536 -- 30,211Hulu Sungai Tengah 14,469 -- -- 14,469Hulu Sungai Selatan 9,995 -- -- 9,995Tapin 15,608 -- 990 16,598Tanah Laut 5,059 -- 4,083 9,142Kotabaru 2,044 -- -- 2,044Tanah Bumbu 5,875 2,054 2,010 9,939Banjar 18,745 3,928 502 23,175Barito Kuala 68 -- -- 68 Total 145,921 6,518 11,075 163,514Source: Plantation Agency, South Kalimantan Province, 2004
FINAL REPORT For SOUTH KALIMANTAN Investment Opportunities Study For Each Province of East, West, Central and South Kalimantan
BKPM - JICA
6 - 11
If the new investors could establish the rubber seedling nursery business in South Kalimantan the expected market is existing rubber planting 163,514 Ha or equivalent to seedling materials of 40,878,500 sticks. This is sufficient market for a nursery business. Also any prospect in Papua province. Competitiveness of proposed South Kalimantan rubber seedling nursery from the distance point of view is more competitive against the Sumatra seedling for eastern part market.
International Rubber Study Group indicates the world consumption of natural rubber in 2020 nearly 10-11 million ton. Of this projection Chinese market accounting for 4 million tons of the total consumption. Study Group estimates that the world production of natural rubber will reach a maximum of 8-9 million ton, inferring a shortfall of approximately 2-3 million ton.
Indonesian rubber community should take some measures to meet increasing world demand of rubber and also to fulfill the Chinese rubber market. Thailand currently supplies Chinese market with 80 % of the total rubber. . However, its share is expected to decrease to about 70% since other competitors such as Vietnam and Malaysia will more actively enter Chinese market. It is predicted that in the years ahead China will diversify its rubber suppliers to accommodate the business risk It is the time that Indonesian should actively penetrate the Chinese market.
D. Potential Location
There are at least 4 Kabupatens has rubber concentrated area in South Kalimantan, namely: kabupaten Tabalong, Balangan, Banjar and Kabupaten Tapin. And area that have potential for rubber nursery, replanting and trading business, are:
- Kabupaten Tabalong at Kecamatan Haruwai, - Kabupatens Balangan at Kecamatan Juwai - Kabupaten Tapin, at Kecamatan Margasari - Kabuapetn banjar, at Kecamatan Pengaron
And potential location to rubber processing industries in Kabupaten Barito Kuala, at Alalak Industrial Estate.
E. Infrastructure and Business Support Facilities
Transportation The access road is existing in the area of rubber plantation development indeed the road quality still needs some improvement.
Harbor/Port There is main harbor for inter island transportation of Trisakti, and Batulicin.
Water Sources Water resources of river should be considered as an asset of this area. The water is essential for watering the seedling and for domestic consumption as well.
FINAL REPORT For SOUTH KALIMANTAN Investment Opportunities Study For Each Province of East, West, Central and South Kalimantan
BKPM - JICA
6 - 12
F. Proposed Business Scale
The scheme of nursery should be at production level about 10,000 rubber planting materials per year. While the trading business scale is recommended at 3,000 ton per month or about 36,000 ton per year. This also equivalent to total production area of 36,000 Ha, at pessimistic estimated yield at 1,000 Kg/Ha. Assuming the smallholder product is 145,000 ton per year, it is equivalent to about 25% of smallholders’ total production of South Kalimantan. With the existing in production capacity and the future rubber production considerations, so to develop of rubber processing industry that produce SIR (Standard Indonesian Rubber) and RSS (Rubber Smoke Sheet) with production capacity are 3,000 ton per month and 1,000 ton per month, respectively.
G. Main of Cost Factors
Main cost of factor for rubber nursery, replanting and trading business divided into investment cost and Operational cost, are: Investment Cost to establishment rubber nursery, replanting, trading business and rubber processing, approximately of Rp.5,500 million, consist of: • Permit: Location permit, HGU, IMB and IUT. • Land price for plantation development to get HGU about Rp.100,000 / Ha • Building / Laboratory of nursery; Station and staff housing compound • Special laboratory building needs for produce rubber nursery. In the building
area also needs other facilities such as office, plant of maintenance activities. • Green house: For manage the seedling while in polybag stage. • Clean Water unit (jet pump) is needed for general processing. It should
sufficient number and capacity. • Factory building as well as equipment:
- For produce SIR (Crumb rubber), need land are minimal 1.5 Ha with need minimal cost of Rp.30 billion
- For produce RSS need land area minimal 400 meter square with need minimal cost of Rp.25 million.
Operational Cost:
• Labor: Semiskilled for rubber nursery works Rp.35,000 per day • Labor for rubber processing works depends on minimum wage (UMR)
effectively. In 2005, minimum wage for rubber processing is Rp.536,300/month • Raw Material, From parent stock scion trees about Rp.3,500,000 per hectare • Raw material for rubber processing depend on market price. • Transport/Vehicle, cost for transportation various fluctuated depends on
activities and type, about Rp.4,500,000 – Rp.7,000,000 per month. • Rent of Warehousing, • Chemical Fertilizer and Insecticide
FINAL REPORT For SOUTH KALIMANTAN Investment Opportunities Study For Each Province of East, West, Central and South Kalimantan
BKPM - JICA
6 - 13
Project Profile:
HATCHERY AND SHRIMP DEVELOPMENT A. Product Description
In Indonesia Penaeidea (Shrimp) family has 9 species: Penaeus Monodon, P. Semisulcatus, P. Merguiensis, P. Chinensis, P. Indicus, Metapenaeus monoceros, M. Ensis and M. Elegans. And the shrimp production either from capture and cultivated which is Penaeus Monodon (the giant tiger prawn) species.
B. Competitiveness
The Giant Tiger Prawn has good market in both local and overseas market. At present the shrimp brackish water is estimated at 4,860 Ha and its production has increasing trend by average 1.47% annually. On the other hand the capture shrimp production from seawater and freshwater is decreasing, this indicates that the cultivated shrimp has steadily increased. (Table 6.9)
Table 6.9: Trend of Shrimp Production from Seawater, Freshwater, and Cultivated in South Kalimantan
Catching (Ton) Year Cultivated (Ton)
Sea Area Freshwater 1998 1,998.0 26,649.0 4,630.8 1999 1,708.5 36,721.1 3,789.3 2000 2,293.7 34,595.5 3,843.0 2001 2,463.7 38,866.8 3,960.1 2002 2,343.2 25,434.7 2,794.3 2003 2,149.5 24,405.0 2,672.9
Average annual growth 1998-2003 1.47% -1.74% -10.4% Source: Fisheries and Marine Agency of South Kalimantan Province, 2004
To fulfill the need of shrimp fry for some the brackishwater pond, they still take from provinces of East Java and South Sulawesi, because the local production of shrimp fry hatchery in South Kalimantan is insufficient. From existing hatchery that operated in South Kalimantan produce shrimp fry around 10 million piece and from natural the shrimp farmers take 5 million pieces. Farmers caught the shrimp brooders from Semalantakan and seloka cape area at Kabupaten Kotabaru, it is sold to hatchery company. The species of shrimp brooder is he giant tiger prawn The area of brackish water in South Kalimantan is really potential with total area about 53,382 ha spread over the coastal of South Kalimantan. Of those total area 4,860 Ha have been cultivated for shrimp and milkfish aquaculture. Existing brackishwater shrimp farming is located in Kabupatens of Tanah Laut, Tanah Bumbu, and Kotabaru. The investment opportunity still wide open it is about 48,593.5 Ha.
FINAL REPORT For SOUTH KALIMANTAN Investment Opportunities Study For Each Province of East, West, Central and South Kalimantan
BKPM - JICA
6 - 14
C. Market Opportunities
World shrimp markets have been dominating by Japan, USA and European consumer countries. The situation of the those market, generally as presented follows:
Japan and USA Market:
According to Ministry of Marine Affairs and Fisheries, countries with high demand volume of Indonesian shrimp are Japan (60%), USA (16.5%), European Community countries (11.6%), and the rest absorb by other minor consume of Asia. US have suspended its embargo of shrimp from Indonesia since January 2004, which means the US market has been open for Indonesian shrimp. While still in restrict the other six countries of Thailand, China, India, Vietnam, Ecuador, and Brazil consume. This situation implies that theses six countries also has a potentials to enter the Japanese shrimp market and also penetrate the domestic shrimp market of Indonesia with lower prices. This can negatively affect Indonesian shrimp farmers.
European Community Countries:
In the period of 1996 – 2000, the import value of European frozen shrimp from Indonesia grew at annual average rate of 44.62%, while the volume grew at the rate of 42.33% (Eurostat Data). Based on 2001 data, the competitor countries of Indonesian frozen shrimp are Argentine (10.21% market share), India (6.23%), and Bangladesh (6.06%). Unfortunately, in September 2001, European community applies the tight control to Indonesian frozen shrimp because there are cases about chloramfenicol content in some of Indonesia product. Since then, every sample of Indonesian frozen shrimp to be exported is inspected by the agencies representing European community countries.
General situation:
Shrimp, especially tiger shrimp is a high demand commodity particularly in Japan and USA, which requires quality assurance for food safety to any shrimp, which imported to their countries.
Table 6.10: Trend of Export Shrimp by Main Countries Destination, 1999-2003
Destination 1999 (Ton)
2000 (Ton)
2001 (Ton)
2002 (Ton)
2003 (Ton)
Ave. Annual Growth
Japan 53,863.83 57,176.46 64,626.87 63,143.85 64,588.57 4.64% ASIAN, Excl Japan 21,347.73 16,999.59 16,386.74 14,791.14 15,042.25 -8.36% - Hong kong - Taiwan - China - Singapore - Thailand
5,738.91,887.66,884.15,572.41,264.7
6,046.62,583.82,435.15,278.1
657.0
5,563.61,685.41,631.06,632.0
874.8
4,626.31,513.01,081.75,993.71,576.5
5,729.8 2,307.8 1,803.3 3,684.0 2,517.3
0.04%5.15%
-28.46%-9.83%4.66%
United State 13,798.84 16,702.83 16,661.92 17,639.69 22,258.08 12.70% Europe: 12,521.42 14,764.54 16,620.61 13,619.98 17,529.99 8.78% - United Kingdom - Netherlands - Belgium - Italy
3,787.64,636.53,257.7
839.7
4,142.67,565.82,245.8
810.3
6,528.07,253.32,084.3
755.1
5,340.91,923.05,797.9
558.2
5,239.9 1,923.0 5,797.9
558.2
8.45%-25.32%31.75%5.30%
Others 8,118.18 10,543.57 14,534.86 15,570.35 18,217.11 22.39% Total 109,650.0 116,187.0 128,831.0 124,765.0 137,636.0 5.85%
Source: Ministry of Marine Affair and Fisheries, 2004
FINAL REPORT For SOUTH KALIMANTAN Investment Opportunities Study For Each Province of East, West, Central and South Kalimantan
BKPM - JICA
6 - 15
Japan and European market cases could lead the shrimp faming system in Indonesia. The shrimp cultivation should be go back to non-intensive shrimp farming which is using a minimum chemical ingredient on shrimp cultivation. Indeed, this requires more time for harvesting stage in order to get the export The shrimp farmer applied the simple technology to produce shrimp with average density 20,000 pieces/ha with two times plant season, so if it is counted the need of shrimp fry that should be fulfilled for the entire brackish water pond in South Kalimantan predicted that it reaches the amount of 196 million pieces/year,
D. Potential Location
Natural resources in term of land suitability and facilities for brackishwater aquaculture, primary and secondary canals already existing in: a. Kabupaten Kotabaru, at Kecamatan. Pamukan Selatan, Sampanahan,
Kelumpang Utara, Kelumpang Tengah, Kelumpang Selatan, and Pulau Laut. b. Kabupaten Tanah Bumbu, at Kecamatan Sungai Loban. c. Kabupaten Tanah Laut, at Kurau, Takisung and Kintap. d. Kabupaten Banjar, at Kecamatan Aluh-aluh. e. Kabupaten Barito Kuala, at Kecamatan Tabunganen.
E. Infrastructure and Business Support Facilities
Transportation Road to the brackish water aquaculture area is relatively good in term passable by motorbike and four wheel vehicle, indeed the main access road to Kabupaten is good condition. Harbor/Seaport, There are 1 (one) special port fish, called seashore fisheries port (PPP) in Banjarmasin and 4 (four) Fish Landing Place in Muara Kintap and Jorong at Kabupaten Tanah Laut, Pagatan and Batulicin at Kabupaten Tanah Bumbu
Ice Factory The need of ice for post harvesting start from the harvest process until it comes to the customer’s hand or to the next process (freezing or canning). At present the ice factory is available in South Kalimantan near from fish pound and fish port.
Canal The government has built brackish water pond canal in Muara Kintap, Kabupaten Tanah Laut and Sungai Loban, Kabupaten Tanah Bumbu. The brackish water pond canal capacity in Muara Kintap able to supply the water to around 500 ha and for the Sungai Loban area is around 430 ha. The establishment of the Sungai Loban canal plan is to supply water around 1,200 ha and it will complete in next three fiscal years.
Others Laboratory of The Construction and Examination of Fisheries Production Quality (LPPMHP) located in Banjarbaru City. Infrastructure that related closely in handling the fisheries product quality is the hygienic fish market, located in Handil Bakti Village in Kabupaten Barito Kuala.
FINAL REPORT For SOUTH KALIMANTAN Investment Opportunities Study For Each Province of East, West, Central and South Kalimantan
BKPM - JICA
6 - 16
F. Proposed Business Scale
There are 3 scheme of shrimp brackish water culture: intensive, semi-intensive and traditional techniques. Intensive technique done by high density of shrimp culture (more than 25 shrimps/M2) and using feed up to 80% from shrimp feeding requirement. Semi intensive technique done by medium density of shrimp culture (more than 15 to 25 shrimps/M2) and using feed 40% to 80% from shrimp feeding requirement. While traditional technique done by low density of shrimp culture (less than 15 shrimps/M2) and using feed up to less than 25% from shrimp feeding requirement. Considering to the sustainability of production and hazard environment impact from waste of feed, etc, which usually occurred in intensive technique, the semi intensive technique scheme is proposed to apply in this project. And the needed fry of shrimp fry in South Kalimantan is around 196 million pieces/year, so to development of shrimp fry hatchery business scale with production capacity around 181 million pieces/year.
G. Cost of Factor
Main cost of factor for hatchery and shrimp cultivation divided into investment cost and Operational cost, are: Investment Cost to establishment hatchery and shrimp cultivation, approximately of Rp.400.0 million, consist of: • Permit: IUP/SIKPI • Land price for building hatchery development around Rp.85,000 per meter
square • Hatchery building needs for produce shrimp fry. In the building area also needs
other facilities such as office, plant of maintenance, around Rp.125,000 per meter square
• Hatchery equipment and maintenance, around Rp.12,5000,000 • Pond equipment and maintenance around Rp.10,000,000 per hectare
Operational Cost: • Labor for semiskilled around Rp.25,000 per day • Raw Material:
Farmers caught the shrimp brooders, it is sold to hatchery company. The species of shrimp brooder is he giant tiger prawn.
• Feed animal • Transport/Vehicle
Cost for transportation various fluctuated depends on activities and Type, about Rp.4,500,000 – Rp.7,000,000 per month
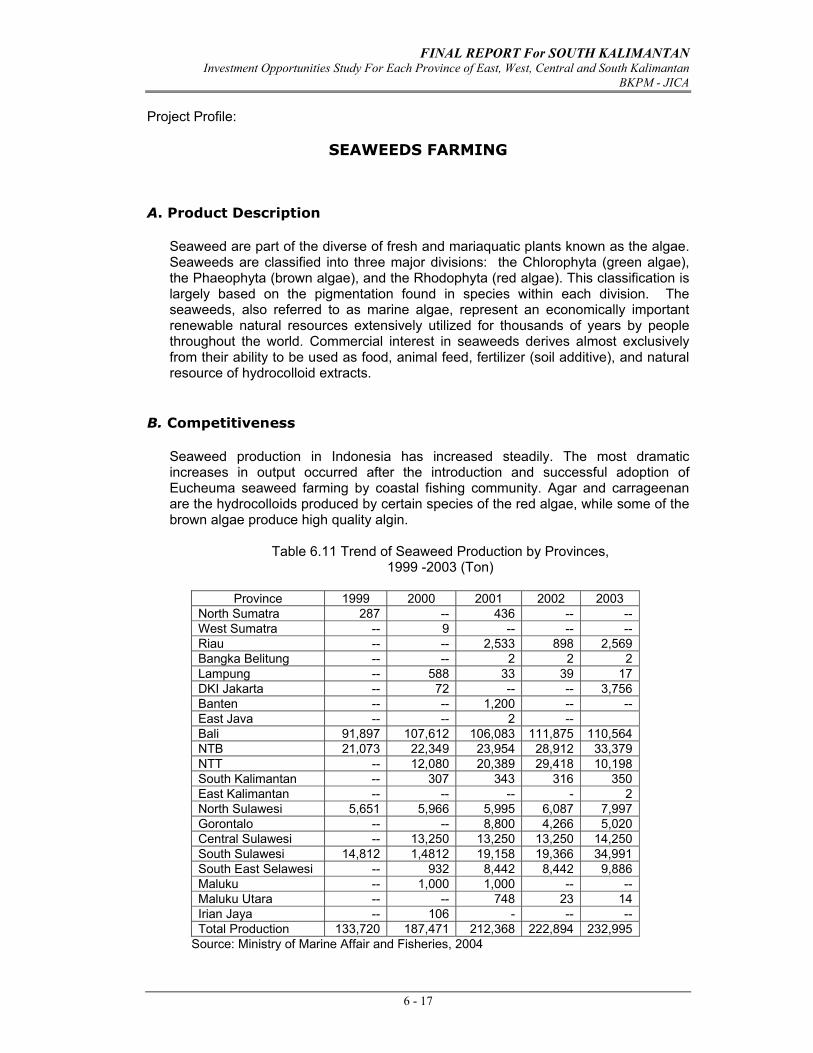
FINAL REPORT For SOUTH KALIMANTAN Investment Opportunities Study For Each Province of East, West, Central and South Kalimantan
BKPM - JICA
6 - 17
Project Profile:
SEAWEEDS FARMING A. Product Description
Seaweed are part of the diverse of fresh and mariaquatic plants known as the algae. Seaweeds are classified into three major divisions: the Chlorophyta (green algae), the Phaeophyta (brown algae), and the Rhodophyta (red algae). This classification is largely based on the pigmentation found in species within each division. The seaweeds, also referred to as marine algae, represent an economically important renewable natural resources extensively utilized for thousands of years by people throughout the world. Commercial interest in seaweeds derives almost exclusively from their ability to be used as food, animal feed, fertilizer (soil additive), and natural resource of hydrocolloid extracts.
B. Competitiveness
Seaweed production in Indonesia has increased steadily. The most dramatic increases in output occurred after the introduction and successful adoption of Eucheuma seaweed farming by coastal fishing community. Agar and carrageenan are the hydrocolloids produced by certain species of the red algae, while some of the brown algae produce high quality algin.
Table 6.11 Trend of Seaweed Production by Provinces,
1999 -2003 (Ton)
Province 1999 2000 2001 2002 2003 North Sumatra 287 -- 436 -- -- West Sumatra -- 9 -- -- -- Riau -- -- 2,533 898 2,569 Bangka Belitung -- -- 2 2 2 Lampung -- 588 33 39 17 DKI Jakarta -- 72 -- -- 3,756 Banten -- -- 1,200 -- -- East Java -- -- 2 -- Bali 91,897 107,612 106,083 111,875 110,564 NTB 21,073 22,349 23,954 28,912 33,379 NTT -- 12,080 20,389 29,418 10,198 South Kalimantan -- 307 343 316 350 East Kalimantan -- -- -- - 2 North Sulawesi 5,651 5,966 5,995 6,087 7,997 Gorontalo -- -- 8,800 4,266 5,020 Central Sulawesi -- 13,250 13,250 13,250 14,250 South Sulawesi 14,812 1,4812 19,158 19,366 34,991 South East Selawesi -- 932 8,442 8,442 9,886 Maluku -- 1,000 1,000 -- -- Maluku Utara -- -- 748 23 14 Irian Jaya -- 106 - -- -- Total Production 133,720 187,471 212,368 222,894 232,995
Source: Ministry of Marine Affair and Fisheries, 2004
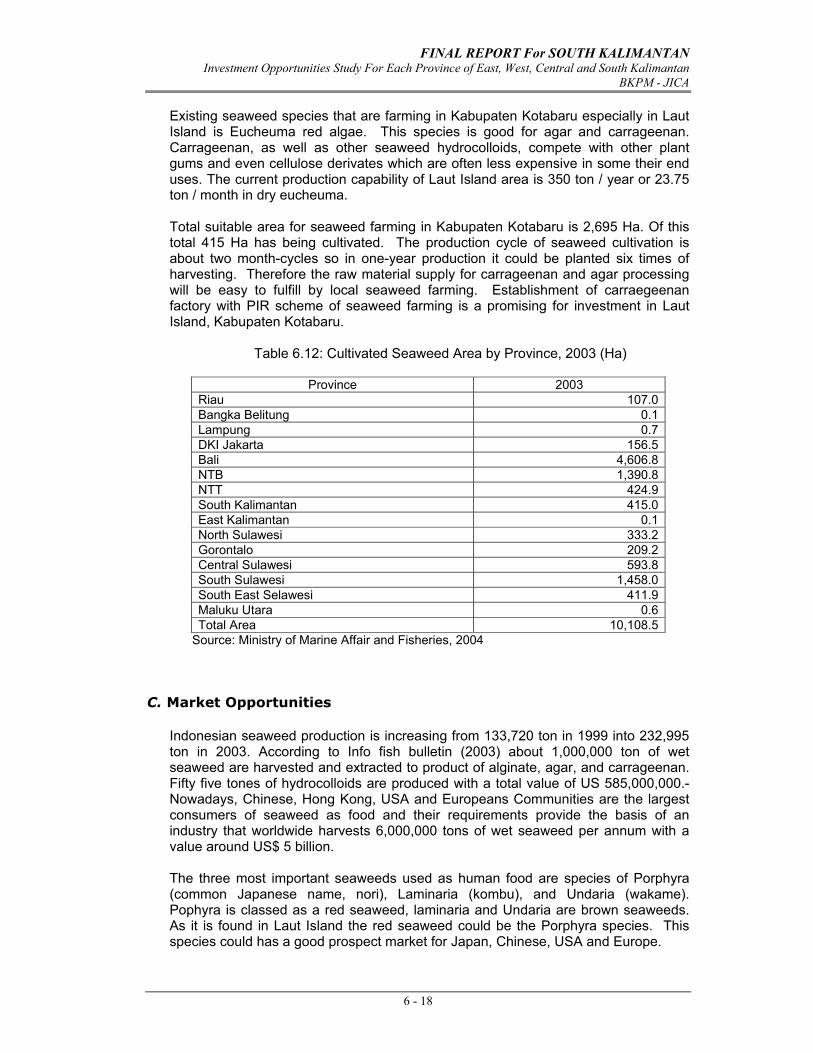
FINAL REPORT For SOUTH KALIMANTAN Investment Opportunities Study For Each Province of East, West, Central and South Kalimantan
BKPM - JICA
6 - 18
Existing seaweed species that are farming in Kabupaten Kotabaru especially in Laut Island is Eucheuma red algae. This species is good for agar and carrageenan. Carrageenan, as well as other seaweed hydrocolloids, compete with other plant gums and even cellulose derivates which are often less expensive in some their end uses. The current production capability of Laut Island area is 350 ton / year or 23.75 ton / month in dry eucheuma. Total suitable area for seaweed farming in Kabupaten Kotabaru is 2,695 Ha. Of this total 415 Ha has being cultivated. The production cycle of seaweed cultivation is about two month-cycles so in one-year production it could be planted six times of harvesting. Therefore the raw material supply for carrageenan and agar processing will be easy to fulfill by local seaweed farming. Establishment of carraegeenan factory with PIR scheme of seaweed farming is a promising for investment in Laut Island, Kabupaten Kotabaru.
Table 6.12: Cultivated Seaweed Area by Province, 2003 (Ha)
Province 2003
Riau 107.0Bangka Belitung 0.1Lampung 0.7DKI Jakarta 156.5Bali 4,606.8NTB 1,390.8NTT 424.9South Kalimantan 415.0East Kalimantan 0.1North Sulawesi 333.2Gorontalo 209.2Central Sulawesi 593.8South Sulawesi 1,458.0South East Selawesi 411.9Maluku Utara 0.6Total Area 10,108.5
Source: Ministry of Marine Affair and Fisheries, 2004
C. Market Opportunities
Indonesian seaweed production is increasing from 133,720 ton in 1999 into 232,995 ton in 2003. According to Info fish bulletin (2003) about 1,000,000 ton of wet seaweed are harvested and extracted to product of alginate, agar, and carrageenan. Fifty five tones of hydrocolloids are produced with a total value of US 585,000,000.- Nowadays, Chinese, Hong Kong, USA and Europeans Communities are the largest consumers of seaweed as food and their requirements provide the basis of an industry that worldwide harvests 6,000,000 tons of wet seaweed per annum with a value around US$ 5 billion. The three most important seaweeds used as human food are species of Porphyra (common Japanese name, nori), Laminaria (kombu), and Undaria (wakame). Pophyra is classed as a red seaweed, laminaria and Undaria are brown seaweeds. As it is found in Laut Island the red seaweed could be the Porphyra species. This species could has a good prospect market for Japan, Chinese, USA and Europe.
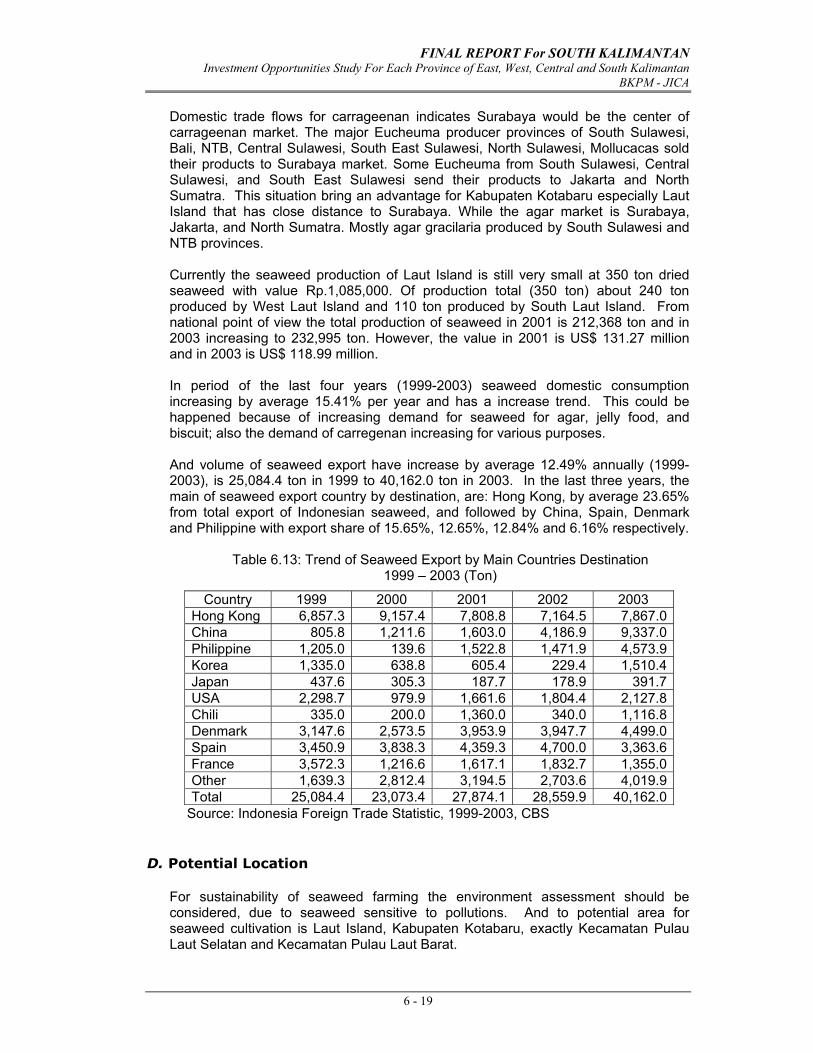
FINAL REPORT For SOUTH KALIMANTAN Investment Opportunities Study For Each Province of East, West, Central and South Kalimantan
BKPM - JICA
6 - 19
Domestic trade flows for carrageenan indicates Surabaya would be the center of carrageenan market. The major Eucheuma producer provinces of South Sulawesi, Bali, NTB, Central Sulawesi, South East Sulawesi, North Sulawesi, Mollucacas sold their products to Surabaya market. Some Eucheuma from South Sulawesi, Central Sulawesi, and South East Sulawesi send their products to Jakarta and North Sumatra. This situation bring an advantage for Kabupaten Kotabaru especially Laut Island that has close distance to Surabaya. While the agar market is Surabaya, Jakarta, and North Sumatra. Mostly agar gracilaria produced by South Sulawesi and NTB provinces. Currently the seaweed production of Laut Island is still very small at 350 ton dried seaweed with value Rp.1,085,000. Of production total (350 ton) about 240 ton produced by West Laut Island and 110 ton produced by South Laut Island. From national point of view the total production of seaweed in 2001 is 212,368 ton and in 2003 increasing to 232,995 ton. However, the value in 2001 is US$ 131.27 million and in 2003 is US$ 118.99 million. In period of the last four years (1999-2003) seaweed domestic consumption increasing by average 15.41% per year and has a increase trend. This could be happened because of increasing demand for seaweed for agar, jelly food, and biscuit; also the demand of carregenan increasing for various purposes. And volume of seaweed export have increase by average 12.49% annually (1999-2003), is 25,084.4 ton in 1999 to 40,162.0 ton in 2003. In the last three years, the main of seaweed export country by destination, are: Hong Kong, by average 23.65% from total export of Indonesian seaweed, and followed by China, Spain, Denmark and Philippine with export share of 15.65%, 12.65%, 12.84% and 6.16% respectively.
Table 6.13: Trend of Seaweed Export by Main Countries Destination 1999 – 2003 (Ton)
Country 1999 2000 2001 2002 2003 Hong Kong 6,857.3 9,157.4 7,808.8 7,164.5 7,867.0China 805.8 1,211.6 1,603.0 4,186.9 9,337.0Philippine 1,205.0 139.6 1,522.8 1,471.9 4,573.9Korea 1,335.0 638.8 605.4 229.4 1,510.4Japan 437.6 305.3 187.7 178.9 391.7USA 2,298.7 979.9 1,661.6 1,804.4 2,127.8Chili 335.0 200.0 1,360.0 340.0 1,116.8Denmark 3,147.6 2,573.5 3,953.9 3,947.7 4,499.0Spain 3,450.9 3,838.3 4,359.3 4,700.0 3,363.6France 3,572.3 1,216.6 1,617.1 1,832.7 1,355.0Other 1,639.3 2,812.4 3,194.5 2,703.6 4,019.9Total 25,084.4 23,073.4 27,874.1 28,559.9 40,162.0
Source: Indonesia Foreign Trade Statistic, 1999-2003, CBS
D. Potential Location
For sustainability of seaweed farming the environment assessment should be considered, due to seaweed sensitive to pollutions. And to potential area for seaweed cultivation is Laut Island, Kabupaten Kotabaru, exactly Kecamatan Pulau Laut Selatan and Kecamatan Pulau Laut Barat.
FINAL REPORT For SOUTH KALIMANTAN Investment Opportunities Study For Each Province of East, West, Central and South Kalimantan
BKPM - JICA
6 - 20
E. Infrastructure and Business Support Facilities
Transportation Inland transportation from seaweed farming (of southern part of Laut Island) to Kotabaru Harbor passable by 4 ton-truck
Harbor/Seaport, In Laut Island, there are three harbors namely Kotabaru, Stagen, and Mekar Putih. Also there is ferry line between Tanjung Serdang and Batulicin. Kotabaru harbor is located at coastal area so the sea transportation for seaweed to market area such as Surabaya and Makasar is very accessibility.
Electricity Diesel Power Supply of PLN supplies electricity
Seeding Eucheuma seaweed seedling is available in Bali, Lombok Island and Central Sulawesi. Then after the farmers produce their own seedling and sold it with Rp.1,000 per Kg.
Others Cultivation materials, like bamboo and plastic rope is available at local market. Processing facility such as drying floor or dryer as well is not established yet at local level. The packaging and semi-process machines of seaweed are not available in the area.
F. Proposed Business Scale
Business scale is 10 units with beach with long of 5,000 meter square.
G. Cost of Factor
Seaweed farming greatly depend upon the method of production is adopted in case of South Kalimantan using the waft which is one unit composed of 20 wafts with dimension 5m x 2.5m with materials of: - Bamboo, diameter 10-15 cm total 80 pieces - Polyethyline (PE) circle rope with diameter 10 mm total 80 meter or 6 Kg - PE long rope with diameter 4 mm, total 2,800 meter or 33 Kg (260 meter/waft) - Amchor 4 units, with steel or cement weight - PE rope D16, with total 60 bunches - Place of Clothesline - Cultivation Equipment (basket, knife, saw and chopping knife) - Canoe/rowboat, 1 unit
FINAL REPORT For SOUTH KALIMANTAN Investment Opportunities Study For Each Province of East, West, Central and South Kalimantan
BKPM - JICA
6 - 21
Main cost of factor for seaweed farming divided into investment cost and Operational cost, are: Investment Cost to establishment 10 units (5,000 meter square), approximately of Rp.45.0 million, consist of • Permit: IUP/SIKPI • Land price for place of clothesline seaweeds around Rp.85,000 per meter square • Building needs for storage. In the building area also needs other facilities such
as office, plant of maintenance, around Rp.125,000 per meter square • Cultivation materials, around Rp.16,000,000 • Canoe/Rowboat, 2 unit @ Rp.2,000,000 Operational Cost: • 2 Staff, around Rp.800,000 per month • Contract Workers for seed planting, around Rp.3,600,000 • Seaweed fry, around Rp.7,200,000 • Transport/Vehicle: Cost for transportation various fluctuated depends on activities
and type, about Rp.4,500,000 – Rp.7,000,000 per month
APPENDIX
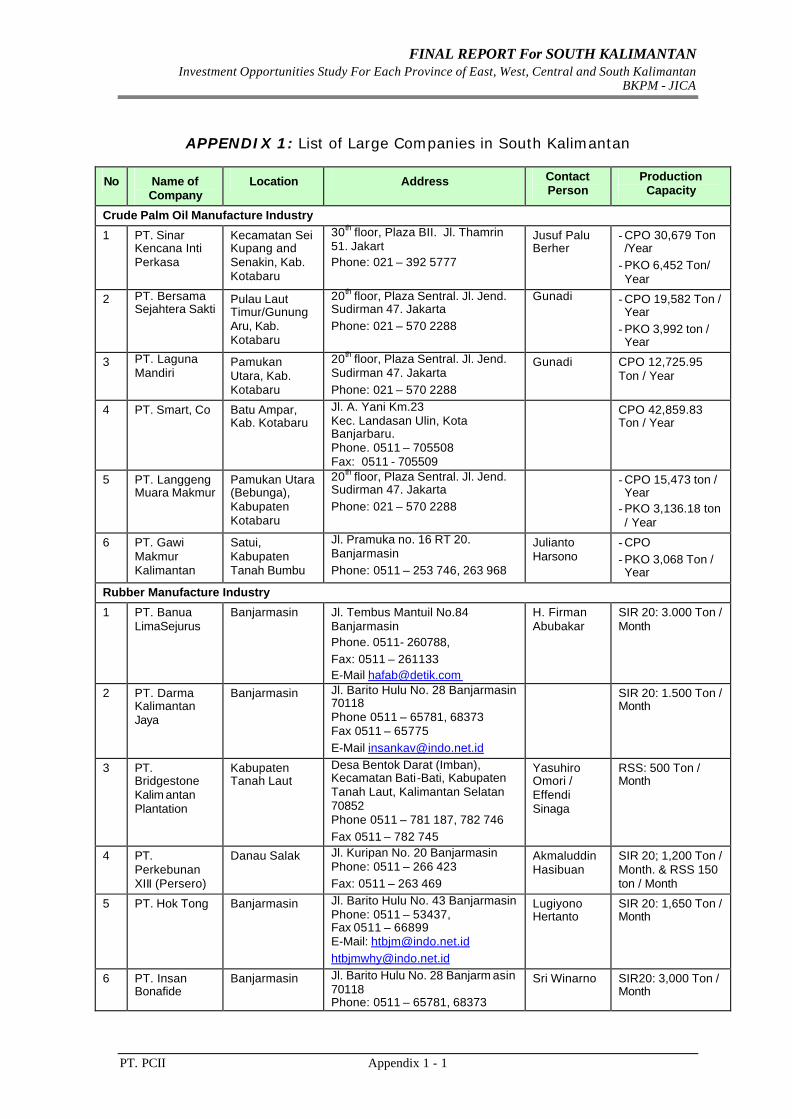
FINAL REPORT For SOUTH KALIMANTAN Investment Opportunities Study For Each Province of East, West, Central and South Kalimantan
BKPM - JICA
PT. PCII Appendix 1 - 1
APPENDIX 1: List of Large Companies in South Kalimantan
No Name of Company
Location Address Contact Person
Production Capacity
Crude Palm Oil Manufacture Industry
1 PT. Sinar Kencana Inti Perkasa
Kecamatan Sei Kupang and Senakin, Kab. Kotabaru
30th floor, Plaza BII. Jl. Thamrin 51. Jakart Phone: 021 – 392 5777
Jusuf Palu Berher
- CPO 30,679 Ton /Year
- PKO 6,452 Ton/ Year
2 PT. Bersama Sejahtera Sakti
Pulau Laut Timur/Gunung Aru, Kab. Kotabaru
20th floor, Plaza Sentral. Jl. Jend. Sudirman 47. Jakarta Phone: 021 – 570 2288
Gunadi - CPO 19,582 Ton / Year
- PKO 3,992 ton / Year
3 PT. Laguna Mandiri
Pamukan Utara, Kab. Kotabaru
20th floor, Plaza Sentral. Jl. Jend. Sudirman 47. Jakarta Phone: 021 – 570 2288
Gunadi CPO 12,725.95 Ton / Year
4 PT. Smart, Co Batu Ampar, Kab. Kotabaru
Jl. A. Yani Km.23 Kec. Landasan Ulin, Kota Banjarbaru. Phone. 0511 – 705508 Fax: 0511 - 705509
CPO 42,859.83 Ton / Year
5 PT. Langgeng Muara Makmur
Pamukan Utara (Bebunga), Kabupaten Kotabaru
20th floor, Plaza Sentral. Jl. Jend. Sudirman 47. Jakarta Phone: 021 – 570 2288
- CPO 15,473 ton / Year
- PKO 3,136.18 ton / Year
6 PT. Gawi Makmur Kalimantan
Satui, Kabupaten Tanah Bumbu
Jl. Pramuka no. 16 RT 20. Banjarmasin Phone: 0511 – 253 746, 263 968
Julianto Harsono
- CPO - PKO 3,068 Ton / Year
Rubber Manufacture Industry
1 PT. Banua LimaSejurus
Banjarmasin Jl. Tembus Mantuil No.84 Banjarmasin Phone. 0511- 260788, Fax: 0511 – 261133 E-Mail [email protected]
H. Firman Abubakar
SIR 20: 3.000 Ton / Month
2 PT. Darma Kalimantan Jaya
Banjarmasin Jl. Barito Hulu No. 28 Banjarmasin 70118 Phone 0511 – 65781, 68373 Fax 0511 – 65775 E-Mail [email protected]
SIR 20: 1.500 Ton / Month
3 PT. Bridgestone Kalim antan Plantation
Kabupaten Tanah Laut
Desa Bentok Darat (Imban), Kecamatan Bati-Bati, Kabupaten Tanah Laut, Kalimantan Selatan 70852 Phone 0511 – 781 187, 782 746 Fax 0511 – 782 745
Yasuhiro Omori / Effendi Sinaga
RSS: 500 Ton / Month
4 PT. Perkebunan XIII (Persero)
Danau Salak Jl. Kuripan No. 20 Banjarmasin Phone: 0511 – 266 423 Fax: 0511 – 263 469
Akmaluddin Hasibuan
SIR 20; 1,200 Ton / Month. & RSS 150 ton / Month
5 PT. Hok Tong Banjarmasin Jl. Barito Hulu No. 43 Banjarmasin Phone: 0511 – 53437, Fax 0511 – 66899 E-Mail: [email protected] [email protected]
Lugiyono Hertanto
SIR 20: 1,650 Ton / Month
6 PT. Insan Bonafide
Banjarmasin Jl. Barito Hulu No. 28 Banjarm asin 70118 Phone: 0511 – 65781, 68373
Sri Winarno SIR20: 3,000 Ton / Month
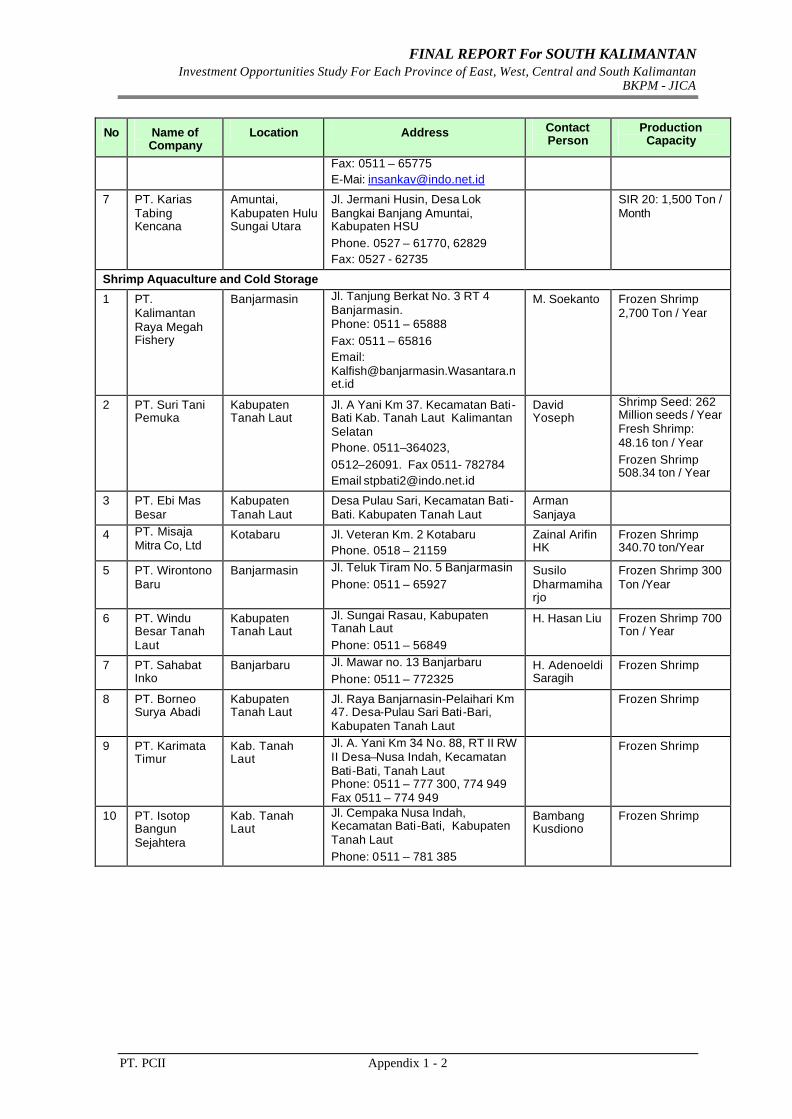
FINAL REPORT For SOUTH KALIMANTAN Investment Opportunities Study For Each Province of East, West, Central and South Kalimantan
BKPM - JICA
PT. PCII Appendix 1 - 2
No Name of Company
Location Address Contact Person
Production Capacity
Fax: 0511 – 65775 E-Mai: [email protected]
7 PT. Karias Tabing Kencana
Amuntai, Kabupaten Hulu Sungai Utara
Jl. Jermani Husin, Desa Lok Bangkai Banjang Amuntai, Kabupaten HSU Phone. 0527 – 61770, 62829 Fax: 0527 - 62735
SIR 20: 1,500 Ton / Month
Shrimp Aquaculture and Cold Storage
1 PT. Kalimantan Raya Megah Fishery
Banjarmasin Jl. Tanjung Berkat No. 3 RT 4 Banjarmasin. Phone: 0511 – 65888 Fax: 0511 – 65816 Email: [email protected]
M. Soekanto Frozen Shrimp 2,700 Ton / Year
2 PT. Suri Tani Pemuka
Kabupaten Tanah Laut
Jl. A Yani Km 37. Kecamatan Bati-Bati Kab. Tanah Laut Kalimantan Selatan Phone. 0511–364023, 0512–26091. Fax 0511- 782784 Email [email protected]
David Yoseph
Shrimp Seed: 262 Million seeds / Year Fresh Shrimp: 48.16 ton / Year Frozen Shrimp 508.34 ton / Year
3 PT. Ebi Mas Besar
Kabupaten Tanah Laut
Desa Pulau Sari, Kecamatan Bati-Bati. Kabupaten Tanah Laut
Arman Sanjaya
4 PT. Misaja Mitra Co, Ltd
Kotabaru Jl. Veteran Km. 2 Kotabaru Phone. 0518 – 21159
Zainal Arifin HK
Frozen Shrimp 340.70 ton/Year
5 PT. Wirontono Baru
Banjarmasin Jl. Teluk Tiram No. 5 Banjarmasin Phone: 0511 – 65927
Susilo Dharmamiharjo
Frozen Shrimp 300 Ton /Year
6 PT. Windu Besar Tanah Laut
Kabupaten Tanah Laut
Jl. Sungai Rasau, Kabupaten Tanah Laut Phone: 0511 – 56849
H. Hasan Liu Frozen Shrimp 700 Ton / Year
7 PT. Sahabat Inko
Banjarbaru Jl. Mawar no. 13 Banjarbaru Phone: 0511 – 772325
H. Adenoeldi Saragih
Frozen Shrimp
8 PT. Borneo Surya Abadi
Kabupaten Tanah Laut
Jl. Raya Banjarnasin-Pelaihari Km 47. Desa-Pulau Sari Bati-Bari, Kabupaten Tanah Laut
Frozen Shrimp
9 PT. Karimata Timur
Kab. Tanah Laut
Jl. A. Yani Km 34 No. 88, RT II RW II Desa–Nusa Indah, Kecamatan Bati-Bati, Tanah Laut Phone: 0511 – 777 300, 774 949 Fax 0511 – 774 949
Frozen Shrimp
10 PT. Isotop Bangun Sejahtera
Kab. Tanah Laut
Jl. Cempaka Nusa Indah, Kecamatan Bati-Bati, Kabupaten Tanah Laut Phone: 0511 – 781 385
Bambang Kusdiono
Frozen Shrimp
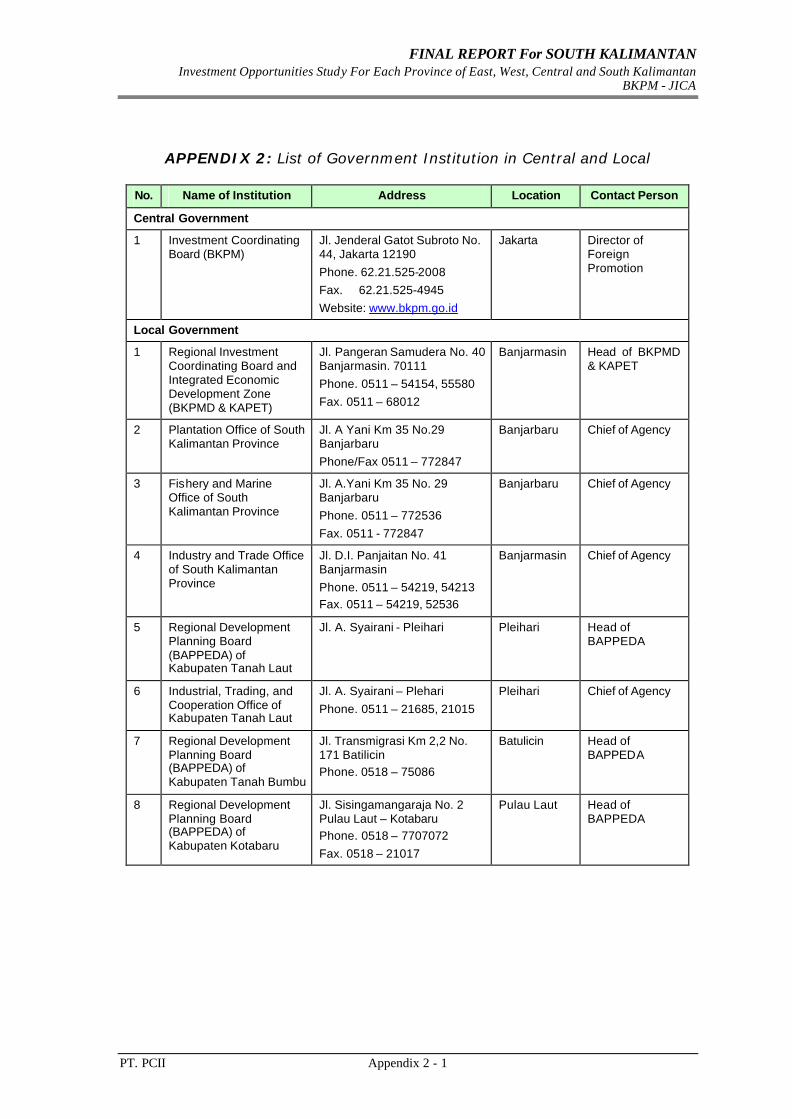
FINAL REPORT For SOUTH KALIMANTAN Investment Opportunities Study For Each Province of East, West, Central and South Kalimantan
BKPM - JICA
PT. PCII Appendix 2 - 1
APPENDIX 2: List of Government Institution in Central and Local
No. Name of Institution Address Location Contact Person
Central Government
1 Investment Coordinating Board (BKPM)
Jl. Jenderal Gatot Subroto No. 44, Jakarta 12190 Phone. 62.21.525-2008 Fax. 62.21.525-4945 Website: www.bkpm.go.id
Jakarta Director of Foreign Promotion
Local Government
1 Regional Investment Coordinating Board and Integrated Economic Development Zone (BKPMD & KAPET)
Jl. Pangeran Samudera No. 40 Banjarmasin. 70111 Phone. 0511 – 54154, 55580 Fax. 0511 – 68012
Banjarmasin Head of BKPMD & KAPET
2 Plantation Office of South Kalimantan Province
Jl. A Yani Km 35 No.29 Banjarbaru Phone/Fax 0511 – 772847
Banjarbaru Chief of Agency
3 Fishery and Marine Office of South Kalimantan Province
Jl. A.Yani Km 35 No. 29 Banjarbaru Phone. 0511 – 772536 Fax. 0511 - 772847
Banjarbaru Chief of Agency
4 Industry and Trade Office of South Kalimantan Province
Jl. D.I. Panjaitan No. 41 Banjarmasin Phone. 0511 – 54219, 54213 Fax. 0511 – 54219, 52536
Banjarmasin Chief of Agency
5 Regional Development Planning Board (BAPPEDA) of Kabupaten Tanah Laut
Jl. A. Syairani - Pleihari Pleihari Head of BAPPEDA
6 Industrial, Trading, and Cooperation Office of Kabupaten Tanah Laut
Jl. A. Syairani – Plehari Phone. 0511 – 21685, 21015
Pleihari Chief of Agency
7 Regional Development Planning Board (BAPPEDA) of Kabupaten Tanah Bumbu
Jl. Transmigrasi Km 2,2 No. 171 Batilicin Phone. 0518 – 75086
Batulicin Head of BAPPEDA
8 Regional Development Planning Board (BAPPEDA) of Kabupaten Kotabaru
Jl. Sisingamangaraja No. 2 Pulau Laut – Kotabaru Phone. 0518 – 7707072 Fax. 0518 – 21017
Pulau Laut Head of BAPPEDA