Embed Size (px)
Citation preview


6
the behaviour of investors as well as the value of investment projects. In previous papers
(McDonald and Siegel, 1986; Cortazar and Schwartz, 1997; Yeo and Qiu, 2003; Kjӕrland, 2007)
it was proved that timing flexibility and optionality add a significant value to the investment
project.
In our study we use the real options framework provided by Dixit and Pindyck (1994).
The real options methodology described in Dixit and Pindyck (1994) has been broadly used in
energy related studies. However, regarding gas storage markets, the real options analysis has
been mainly applied for modelling gas prices, optimizing injection and withdrawal schedules
(Thompson et al., 2003; Boogert and Jong, 2006; Holland, 2007). In our paper we attempt to
contribute to filling the niche of real options applications in gas storage research and, instead of
optimizing the storage schedule, we optimize the investment timing of storage projects. Hence,
the main question of this paper is: what is the optimal timing of investments in gas storage in
partially or totally depleted gas fields under uncertainty? Furthermore, we also aim to determine
how optionality affects the value of the storage project and the impact of various parameters –
such as volatility, investment costs and gas price spread - on investment timing. In order to
answer these questions, we will build a model based on the real options approach and perform a
sensitivity analysis to the results found.
In this paper we try to address these questions by looking at the investment opportunity
through the perspective of a private company which has a right to invest in underground gas
storage. We will analyze two different cases of this investment problem. In the first case the
company can invest in a completely depleted gas field. In the second case the company holds a
right to invest in a partially depleted gas field, which still has a sufficient amount of gas that
could be used as cushion gas in the storage project. Hence in the second case the company has
two options – either to deplete the field first and start storage later on, or to keep the gas in the
field and start storage without buying cushion gas. The goal of the analysis is to derive the
trigger gas prices for investing in each option. Besides determining the trigger gas prices, we will
also obtain the values of the option and the net payoffs of storage projects. Moreover, after
deriving the analytical results of the model, we will estimate the numerical trigger prices and the
values of the options in the numerical case. This numerical case will be applied to the Dutch gas
market.

7
In our study various data sources are used such as Bloomberg, reports and observations
from previous research. However, the access to European gas price data is very restricted. As a
consequence, regarding gas prices, we mainly use historical data on US gas prices.
The remainder of this paper is organized as follows: in chapter 2 we will provide a
literature review about previous research on gas storage and real options applications in energy
related studies. In chapter 3 an overview of the gas market will be given. We will look at the
historical and projected gas market aspects such as gas demand, gas supply, gas production and
gas price. In chapter 4 we will discuss three main types of underground gas storage facilities and
storage costs. The real options methodology will be provided in chapter 5. In chapter 6 we will
apply this methodology on valuing investment opportunities in gas storage. In chapter 7 we will
present a numerical case. We will give conclusions in chapter 8.

8
2. Literature Review
2.1. Previous research on gas storage
The changing patterns in the gas market bring challenges to the whole world, as well as
to separate regions and countries. Due to the depletion of gas fields and rising energy demand,
the need for gas storage is increasing significantly. A lot of attention has been paid to the scarcity
of natural gas resources, changes in gas production and consumption levels. However, there has
been less focus on the essential part of the gas market – seasonal flexibility. There are several
articles and reports analyzing gas storage, seasonal flexibility and its challenges.
The need of seasonal flexibility was already discussed in early papers. Welch et al.
(1971) emphasize the problem of meeting seasonal peak demands of natural gas. The authors
mention five ways to face this problem; one of those is gas storage. However, due to the very
limited gas storage capacity, other measures were analyzed in the paper. In another work Caton
(1982) also points out the importance of gas supply and storage planning. In a recent paper of
CIEP (2006) the role of seasonal gas storage is identified as the crucial tool for offsetting the
increasing European demand for seasonal gas flexibility.
There are a few papers focusing on gas demand and its factors. In one of them Levary
and Dean (1980) construct a model which provides the optimal amount of stored natural gas
every year. In the paper it is concluded, that in order to get a good estimate of gas demand,
weather forecasts have to be updated and future gas storage demand recalculated after every
period. The authors derive the optimal strategy for purchasing seasonal gas which precisely
covers the swing supply. In the paper it is also proved that planned seasonal gas storage brings
economic efficiency as the gas price for consumers (compared to the price with gas shortage) is
reduced. Furthermore, Lyness (1984) stresses the impact of seasonal changes in temperature on
demand. He summarizes the paper stating that mathematical methods used for forecasting gas
demand are only useful in the short term, whereas in the long term they become unreliable due to
high uncertainty about the environment. It is also concluded that interaction between forecasting
gas demand and planning gas storage is increasing significantly in the long term.
Concerning future expectations of gas storage capacities, Höffler and Kübler (2007)
estimate that, besides existing forecasted stored gas capacity, there will be additional demand of

9
storage between 10 (without strategic storage) and 29 billion m3 (with strategic storage of
imported gas from non-European countries) until 2030 in North-Western Europe. In another
article, Joode and Özdemir (2010) expand the Höffler and Kübler (2007) analysis by
incorporating other sources of seasonal flexibility provisions such as imports via pipeline, LNG
imports and gas production. They build a dynamic gas market model (GASTALE) and use it for
estimating demand for gas storage in North-Western countries2 until 2030. The authors
determine that additional storage capacity demand will be between 13 billion m3 (in the low gas
demand scenario) and 20 billion m3 (in the reference gas demand scenario) in targeted countries
until 2030.
The most typical gas storage facilities are salt caverns, aquifers, or depleted gas fields. In
CIEP (2006) depleted gas fields are mentioned as the preferred seasonal storage facility.
Furthermore, in EBN report (2010) it is presented that small Dutch gas fields are expected to be
depleted in 20-30 years. Together with additional available storage facilities, this implies that
there will be a great potential for converting depleted gas fields into storage reservoirs.
2.2. Main obstacles for investment in seasonal storage
Despite gas storage necessity, increasing demand and availability of storage facilities,
investors are reluctant to invest in gas storage projects. Several papers (CIEP, 2006; Höffler and
Kübler, 2007) indicate that market liberalization has led to higher investment risks due to
increased uncertainties over market share and future regulatory regime. Furthermore, in CIEP
(2006) it is emphasized that long project building time and gas spot market volatility increase the
uncertainty over future revenues. Besides, in this paper it is also pointed out that future demand
of gas storage is not certain either. In a number of papers (Caton, 1984; CIEP, 2006; Codognet
and Glachant, 2006; Höffler and Kübler, 2007) it is stressed that storage projects require very
high investment costs. Since large storage volumes are needed for balancing seasonal
fluctuations, it means that gas storage facilities have to be sufficiently big, which implies high
sunk costs. An important obstacle for investment in gas storage is also the necessity of transport
2 J.de Joode and Ö. Özdemir use the concept of Northwestern countries for Belgium, Denmark, France,
Germany, Luxembourg, Ireland, The Netherlands, UK, while Höffler and Kübler add Switzerland, but do not include Luxembourg and Ireland.

10
capacity (CIEP, 2006). Höffler and Kübler (2007) state that competition-favorable conditions for
integrating storage and transport systems are needed, as well as unbundling of storage providers
from transport providers.
In Codognet and Glachant (2006) it is stated that at around 50-80 percent of total sunk
costs comprises of expenses used for buying cushion gas which is required for maintaining the
pressure in the field. Consequently, high volatility of gas prices and long development time
increase the uncertainty over investments costs. Moreover, in the same article the uncertainty
over future revenues from gas storage projects (which depend on the summer-winter gas price
spread) is stressed.
The common conclusion in these papers is that the uncertainties related to storage market
regulation, demand and gas price make investors reluctant to invest in very costly storage
projects. Hence, under-investment in gas storage occurs.
2.3. Real options applications in energy related studies
The essential real options theory is provided by Dixit and Pindyck (1994). The real
options framework from their book is often used in scientific articles in various fields, including
the energy area. Real option valuation takes into account the irreversibility of investment,
uncertainties in cash flows and timing flexibility (Dixit and Pindyck, 1994).
One of the earliest articles that study the importance of investment timing is written by
McDonald and Siegel (1986). They derive the optimal investment rule and the formula for
estimating the value of an investment option. McDonald and Siegel (1986) prove that optionality
adds value to the investment project. According to them, it is optimal to wait and invest when
benefits are twice higher than the investment costs.
Also the importance of investment timing flexibility is stressed in several articles
(Cortazar and Schwartz, 1997; Yeo and Qiu, 2003; Kjӕrland, 2007). Kjӕrland (2007) uses the
real options framework provided by Dixit and Pindyck (1994) to evaluate investment
opportunities in hydropower in Norway. The author also determines the trigger price for starting
investment. Moreover, in the article Kjӕrland (2007) summarizes that the results of his analysis
are supported by real investment behaviour in the Norwegian hydropower industry. Hence, the
usage of real options valuation proves to be more reliable than previous methods.

11
In recent articles the real options approach has also been used to evaluate investments in
renewable energy and R&D projects (Martínez-Ceseña and Mutale, 2011; Siddiqui and Fleten,
2010; Lee and Shih, 2010; Siddiqui et al., 2007). Siddiqui and Fleten (2010) apply the real
options methodology for valuing and comparing two alternative energy projects. The authors
stochastically define two uncertainties - electricity price and operating cost. In another paper Fan
and Zhu (2010) expand the analysis and develop a model based on real options for valuing
overseas oil-resource investment decisions under oil price, exchange rate and investment
environment uncertainties3. In the paper they determine the option value index (OVI) which can
be used for comparison of oil-investment conditions in different countries.
However, real options applications in gas storage market are still limited. In the previous
papers attention was mostly paid to modeling gas prices stochastically (including mean-reversion
process), optimizing injection and withdrawal schedules using Monte-Carlo simulations
(Thompson et al., 2003; Boogert and Jong, 2006; Holland, 2007). In addition, the storage
schedule valuation is expanded in Felix et al. (2009), where the authors apply real options
analysis for valuing gas storage while taking limited gas market liquidity into account. They
determine that illiquidity decreases gas storage value as well as injection and withdrawal
amounts.
Real options connect the theory with uncertain market and business environments as well
as managerial flexibility. Hence, real options analysis has been acknowledged as a useful tool for
making decisions in investment behaviour, optimal production and other actions. It is expected
that, despite their complexity, real options applications will increase significantly.
3 The authors measure the investment environment parameter using the World Bank “Ease of Doing Business Index”.

12
3. Gas Market Overview
The recognition of the need for seasonal flexibility was already discussed in chapter 2.
However, the knowledge of gas market and its historical and projected trends are very important
for realizing the necessity of seasonal gas storage. In this chapter we will look at the actual
situation in the gas market and present the natural gas demand, gas production, trade and storage.
Furthermore, we will also take a look at the gas price’s trends and its characteristics, as the gas
price is a very important gas market feature which also affects the investments in gas storage.
3.1. Natural Gas Demand
The importance of natural gas supply is increasing significantly as natural gas share in
meeting world energy demand is rising every year. According to the World Energy Outlook
2010 (WEO) projections, world gas demand is going to increase drastically across all three
different scenarios4, at least for the projection period (until 2035).
Figure 1. World primary natural gas demand by scenarios (Source: WEO 2010)
4 There are three different scenarios in the World Energy Outlook 2010: The New Policies Scenario (It is
newly presented in WEO 2010. The main feature of this scenario is that policy commitments and plans that were announced by the governments are taken into account); The Current Policies Scenario (In this scenario it is assumed that no actions are taken since 2010 and there is no change in policies); The 450
Scenario (This is climate change mitigation scenario in which 2°C of global warming and 450 ppm concentration of CO2-eq are taken as one of the main goals).
13
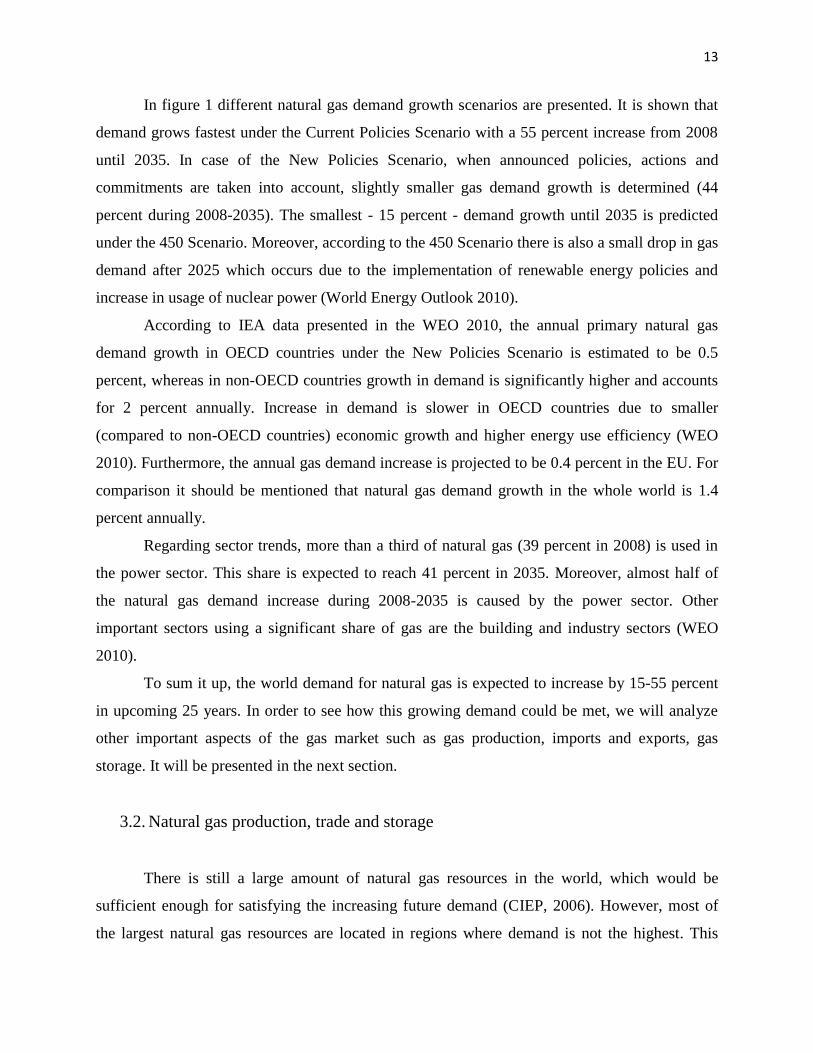
In figure 1 different natural gas demand growth scenarios are presented. It is shown that
demand grows fastest under the Current Policies Scenario with a 55 percent increase from 2008
until 2035. In case of the New Policies Scenario, when announced policies, actions and
commitments are taken into account, slightly smaller gas demand growth is determined (44
percent during 2008-2035). The smallest - 15 percent - demand growth until 2035 is predicted
under the 450 Scenario. Moreover, according to the 450 Scenario there is also a small drop in gas
demand after 2025 which occurs due to the implementation of renewable energy policies and
increase in usage of nuclear power (World Energy Outlook 2010).
According to IEA data presented in the WEO 2010, the annual primary natural gas
demand growth in OECD countries under the New Policies Scenario is estimated to be 0.5
percent, whereas in non-OECD countries growth in demand is significantly higher and accounts
for 2 percent annually. Increase in demand is slower in OECD countries due to smaller
(compared to non-OECD countries) economic growth and higher energy use efficiency (WEO
2010). Furthermore, the annual gas demand increase is projected to be 0.4 percent in the EU. For
comparison it should be mentioned that natural gas demand growth in the whole world is 1.4
percent annually.
Regarding sector trends, more than a third of natural gas (39 percent in 2008) is used in
the power sector. This share is expected to reach 41 percent in 2035. Moreover, almost half of
the natural gas demand increase during 2008-2035 is caused by the power sector. Other
important sectors using a significant share of gas are the building and industry sectors (WEO
2010).
To sum it up, the world demand for natural gas is expected to increase by 15-55 percent
in upcoming 25 years. In order to see how this growing demand could be met, we will analyze
other important aspects of the gas market such as gas production, imports and exports, gas
storage. It will be presented in the next section.
3.2. Natural gas production, trade and storage
There is still a large amount of natural gas resources in the world, which would be
sufficient enough for satisfying the increasing future demand (CIEP, 2006). However, most of
the largest natural gas resources are located in regions where demand is not the highest. This

14
implies the need for gas transportation and supply to other regions. Moreover, in natural gas
markets, uncertainties over resource exploration and development remain, bringing insecurities
for the future (WEO 2010). It is also very important to stress that only at around 10 percent of
world gas resources are found in OECD countries. According to the IEA projections under the
New Policies Scenario, natural gas production in the whole world will increase by 1.3 percent
annually during the 2008-2035 period, while in the European Union it will decrease by 3.1
percent annually. This fall in production is influenced by depletion of gas fields in the North Sea
region. In addition, the largest increase in gas production is projected in non-OECD countries
(1.9 percent annually during 2008-2035).
Currently 25 percent of primary natural gas demand is imported by OECD countries and
almost half of Europe’s primary gas demand is met by imports. According to the WEO (2010),
Europe’s dependency on gas supply from outside the region will increase drastically by more
than 20 percent and will be equal to 67 percent in 2035 (under the New Policies Scenario).
Taking European Union countries separately, this dependency becomes even worse – from 60
percent in 2008 to 84 percent in 2035.
Figure 2. Swing Supply in North-Western countries 1995-2004.
(Source: F.Höffler and M. Kübler, 2007)
Having in mind Europe’s reliance on natural gas imports from other regions, it is
important to analyze how seasonal fluctuations in gas demand are covered. Figure 2 represents
historical data on how seasonal gas imbalances were met during 1995-2004 in North-Western

15
countries. Three different ways of covering demand are shown: production, imports and storage.
At the beginning of the period gas production was the main source for gas swing supply (52
percent). However, it started to decrease gradually and in 2004 it covered only 39 percent of
swing demand. It can be observed that the gas storage share in mitigating the imbalances had
increased from approximately 30 percent in 1995 to 40 percent in 2004.
It is clear that declining production in North-Western Countries and their growing
dependency on suppliers from outside the region lead to necessity of sufficient gas storage
capacity for securing gas supply. Moreover, the large supply routes bring even more insecurity
due to long transportation distance, transportation costs, extended delivery time and political and
regulatory issues. The recent conflict between Russia and Ukraine in 2006 has increased the
awareness of gas storage importance. During this incident Russia stopped exporting gas through
Ukraine, thus affecting a number of countries that were dependent on those gas imports.
Furthermore, seasonal gas storage not only secures the gas supply, but also helps to avoid
high fluctuations in gas prices. In case of spot priced markets, shortages in gas supply would lead
to very high and volatile gas prices. On the other hand, if gas prices are set according to
indexation to oil prices, supply shortage would result in cutting down gas supplies to some of the
consumers (CIEP, 2006). Thus the lack of storage capacity could bring damages to industrial and
residential gas consumers as well as to the countries’ economy, thereby affecting the whole
society.
Figure 3. Planned or being constructed storage capacities in Europe.
(Source: Natural Gas Market Review 2009)

16
Gas storage has already been acknowledged as a crucial and essential part of the gas
value chain (CIEP, 2006; Höffler and Kübler, 2007; Natural Gas Market Review 2009).
Furthermore, it was estimated that until 2030 the gap in gas capacity and demand will be
between 10 to 30 billion cubic meters in North-western Countries (Höffler and Kübler, 2007).
As stated before, the main reasons for under-investment in gas storage are related to uncertainties
regarding the regulatory regime and the demand context. This problem is also presented in figure
3. It can be seen that there are plenty of storage projects planned, however due to uncertainties it
is not definite yet when they will be implemented.
Regarding the recent gas storage situation, it should be mentioned that in 2009 there was
82 billion cubic meters of installed operating working storage capacity in Europe. More than 65
percent of stored gas was placed in depleted gas or oil fields, 20 percent in salt aquifers and 12
percent in salt caverns.
Having in mind the growing geographical difference between gas production and demand
locations, the required gas storage capacity in Europe is expected to increase significantly. In the
following section we will analyze the gas market of the Netherlands which have a considerable
position in Europe’s gas market. However, it appears that for remaining this position in the
future, more storage capacity is required.
3.3. The gas market in the Netherlands
After the discovery of the Groningen gas field in the early 1960s, the Netherlands became
a gas producing country and started to play a very important role in the international gas market.
The Netherlands has been using the “small fields’ policy” which was introduced in order to
increase production from small fields as well as to encourage development and exploration of it,
leaving the large Groningen field mainly for provision of swing supply. Even with the “small
fields’ policy” the Netherlands has maintained an important position as a large producer and
exporter in Europe. It should be noted that more than a third of total European Union gas
production was produced in the Netherlands in 2007 (Foreest, 2010). In addition, 54 percent of
primary gas production in the Netherlands in 2008, which in total accounted for 85.7 billion
cubic meters, was from the Groningen field, the rest came from small fields (Natural Gas Market
Review 2009).

17
According to CBS data, in 2009 total natural gas consumption in the Netherlands was
46.3 billion cubic meters. The energy consumption by final consumers (except power plants) has
recently slightly decreased due to increasing energy efficiency. It is also expected that this
decline could have been influenced by the current financial crisis. However, natural gas demand
in the power generation sector is increasing. In 2009 electricity power plants used 9 billion cubic
meters of natural gas, which accounts for 20 percent of total gas consumption in the Netherlands
(CBS Statline).
Gas exports from the Netherlands are increasing gradually every year. In 2009 the
Netherlands’ natural gas exports were 52.7 billion cubic meters. On the other hand, gas imports
to the Netherlands have also increased significantly from 1999. In 2009 imports were equal to a
bit more than a half of natural gas exports (CBS statline). Large gas exports from the
Netherlands are essential for meeting seasonal gas demand swings in North-Western countries.
Figure 4. Natural gas historic production and forecasts in the Netherlands.
(Source: EBN, 2010)
The Netherlands can be seen as a “matured gas country” as many fields have already
been discovered and explored. It is shown in figure 4 that gas production starts declining in the
following years, especially from small fields. This implies that the Netherlands will change from
a gas exporting country into a net gas importer. However, depleted gas fields provide the country

18
with great gas storage potential. In addition, there are also considerations for turning the
Netherlands into the gas transportation hub for North-Western countries (the so called “The
Dutch gas roundabout”).
Consequently, The Netherlands have to increase the usage of underground gas storage in
order to maintain the position of covering seasonal swing gas demand in North-Western
countries. According to Gasunie (2007), in 2007 the Netherlands had 5 billion cubic meters of
stored gas, which was 11 percent of all consumed gas in the country. In North-Western Europe
stored gas volume was estimated to be 14 percent of total consumption. Taking into account
decreasing gas production, rising demand and increasing dependency on imports, it is clear that
for securing gas supply a significantly higher amount of storing capacity is required.
3.4. The gas price
The gas price is very important as it influences many economic sectors and activities. On
the other hand, the gas price is sensitive to other factors itself. Basically, the main gas price
drivers are gas demand and oil prices due to the remaining tight gas and oil price linkage (WEO
2009). Historically gas prices have been constantly increasing (figure 5), with a significant
increase from 2000. The recent economic recession had an impact on gas demand which led to a
drop in gas prices in 2009. According to gas price projections by IEA (2009), the gas price is
expected to rise modestly after 2010.5 The slower increase in the future gas price is influenced by
LNG imports (gas-to-gas competition), improvements in technology, lower exploration costs and
new developments which provide additional supply (WEO 2009).
The gas price plays an essential role in making gas storage investment decisions as it
influences the costs for buying cushion gas. Moreover, gas price volatility brings high
uncertainty over costs and future cash flows. Using the Henry Hub Spot index on US data6, it
was calculated that historical annual gas price volatility was approximately 74 percent (excluding
the highest price peaks) during 1991-2010. Due to high volatility investors prefer to postpone
their investments.
5 According to the newest Eurostat data, the gas price for industrial consumers in EU-27 has already increased by 10 percent from the first half of 2009 to the second half of 2010. 6In this paper mainly US data on gas prices is used, as access to European gas price data is very limited.

19
Figure 5. Historical gas prices. (Based on HHUB index (1991-2010))
Regarding gas storage value, the main revenues can be estimated as a difference between
gas prices in summer and winter seasons.7 Besides, usually gas storage sales are based on future
contracts. Using EIA data on monthly natural gas futures contracts, this paper determined that
between 1994-2010 the average seasonal gas price spread was 0.45 $/MMbtu which equals to
0.015 €/m3.8 Market conditions, storage supply and demand and variations in prices of gas
futures contracts have a significant influence on seasonal gas price spread.
The gas price and seasonal gas price spread play are essential for making decisions about
the investments in gas storage projects. The gas price directly affects the investment costs as
buying cushion gas is one of the main expenditures. Furthermore, the profit from gas storage
project comes in the form of a seasonal gas price spread. Later, in chapter 6, we will provide a
stochastical gas price expression and evaluate investment timing in respect to the gas price. In
the next chapter we will explain the characteristics of underground gas storage reservoirs - such
as cushion gas and working gas –, and provide the functions of different types of storage
facilities.
7 Traditionally seasonal gas storage combines seven months of gas injection (from April until October) and five months of withdrawal period (from November until March, which are peak-heating winter months). Other storage facilities with more than one gas storage cycle per year have different injection and withdrawal periods. In this paper one storage cycle per year is assumed. 8 For conversion it is taken that 1 MMBtu (million Btu) is equal to 27.7536 cubic meters; $/€=0.6944 (31
May 2011).
0
2
4
6
8
10
12
14
16
18
Jan
-91
Jan
-92
Jan
-93
Jan
-94
Jan
-95
Jan
-96
Jan
-97
Jan
-98
Jan
-99
Jan
-00
Jan
-01
Jan
-02
Jan
-03
Jan
-04
Jan
-05
Jan
-06
Jan
-07
Jan
-08
Jan
-09
Jan
-10
gas
pri
ce, d
ol/
MM
btu

20
4. Underground gas storage
Since it is clear that the need for seasonal flexibility is increasing, now it is important to
analyze the types of the main underground gas storage facilities and its characteristics. As every
underground gas storage reservoir has different geological and engineering conditions, their
suitability for storage and usage differ (FERC, 2004). In the following section, the main
measures and purposes of an underground gas storage reservoir are provided. We already
mentioned cushion gas and other gas field’s features in the previous chapters; here we will give
the explanations of it. Next, we will discuss the differences in three main types of underground
gas storage reservoirs and storage costs.
4.1. The main characteristics and functions of an underground gas storage facility
There are several measures that describe an underground gas storage reservoir. The
maximum amount of natural gas that can be placed in an underground gas storage facility is
called the total storage capacity. Total stored gas comprises base (cushion) gas and working gas.
Cushion gas is the volume of gas that is used as a permanent inventory in a storage facility. The
purpose of cushion gas is to maintain the pressure and deliverability rate in the facility. The
amount of gas in the reservoir that is above the level of cushion gas is called working gas. In the
storage project working gas is injected and withdrawn. This is the gas that is being operated.
The measure of deliverability presents the amount of gas that can be withdrawn
(delivered) from a storage site during one day. Contrary, the injection rate indicates the amount
of gas that can be injected in a storage facility within one day. Deliverability and injection rates
depend directly on the amount of total gas in the facility as it influences the pressure. When the
amount of stored gas in the site is increasing, the deliverability rate enhances, whereas injection
rate decreases.
All of the measures mentioned above are not fixed. Injection and withdrawal rates change
with the amount of gas in the storage facility. Besides, the volume of cushion gas, working gas
and total storage capacity can be influenced by changes in equipment and operational
parameters.

21
There are two main functions of an underground gas storage facility - it can be used for
covering either peak-day or seasonal gas demand swings. The storage facilities that provide with
peak-day supply need to have high deliverability rates. They are used when the difference in
daily demand is large or the gas price is very high. In case of seasonal storage, gas is typically
injected during the summer period and withdrawn in winter. Thus seasonal storage provides a
stable supply of gas during the winter period. High gas demand in winter is mainly the
consequence of heating during the cold season.
4.2. Three types of underground gas storage facilities
There are three main types of underground gas storage facilities: salt caverns, aquifers
and depleted gas/oil fields. Gas storage reservoirs differ in their geological characteristics which
lead to different usage purposes and development costs.
Salt caverns are created by performing a solution mining procedure - fresh water is
pumped into the salt dome and salt water is drained from it. The fact that this type of facility is
man-made, enables investors to determine the capacity of the reservoir which is bounded by the
size of the salt dome and other geological conditions. In comparison to other underground
storage facility types, a salt cavern has very high development costs per m3 of working gas. On
the other hand, the storage capacity of salt caverns is significantly smaller than other reservoirs,
thus development costs of a single cavern are much lower compared to the investment in a
depleted gas field or an aquifer. In addition, only 20-30 percent of total storage capacity in a salt
cavern is cushion gas, and the rest is working gas volume. Moreover, as salt caverns are
relatively small and have significantly high deliverability and injection rates, working gas can be
recycled (filled and emptied) even 10-12 times per year (FERC, 2004). Due to these
characteristics, salt caverns are mostly used for short peak-day demands.
Another storage type is an aquifer. This is an underground formation of water-bearing
permeable rocks that is suitable for storage. Aquifers have high development costs. Besides, the
required amount of cushion gas in this type of facility varies from 60 to 80 percent of total gas
capacity (FERC, 2004). However, aquifers achieve high deliverability rates and working gas can
be cycled once or more per year. High geological risks and large expenditures result in low use
of aquifers as underground storage facilities.

22
The most common underground gas storage reservoir is a depleted gas or oil field. A
depleted field that was used for gas or oil production can be used for underground gas storage.
Converting a depleted field into a gas storage facility bears a few important advantages. Firstly,
the characteristics of the field that was used before are well known. Moreover, since the reservoir
held original gas before, it proves that the facility is secure for storing the gas. In addition,
previous usage usually implies that there is an existing pipeline infrastructure nearby (IEA).
However, depleted gas fields have high development costs for converting them into storage
reservoirs. Furthermore, 50-60 percent of cushion gas is required for maintaining the pressure. In
comparison to salt caverns, depleted gas fields’ deliverability rates are lower: working gas can be
cycled usually once per year. Even though this storage facility is typically used for seasonal gas
storage, some of it can also be used for peak-day demands.
In this paper depleted gas fields are taken as an underground gas storage facility. These
reservoirs usually have a sufficient size and required deliverability characteristics for seasonal
gas storage. Furthermore, the availability of this type of facilities is increasing due to gas field
depletion.
4.3. Storage costs
Development costs of an underground gas storage facility vary a lot as these are
influenced by the type of storage facility and its performance characteristics. In addition, as gas
storage projects tend to have a very long lead time - from 5 to 10 years (Codognet and Glachant,
2006) – the costs of capital also become significant. However, for simplicity reasons the time to
build a storage facility is not taken into account in this paper. The main focus is on development
costs and tariffs.
One of the biggest elements of development costs is the expenditure on cushion gas. It
was already mentioned before that more than half of stored gas capacity has to be used as
cushion gas. In addition, not all cushion gas can be extracted at the end of the storage project life,
which implies investors’ losses. Furthermore, during the storage project life operational costs are
borne. These costs are related to activities such as gas injection and withdrawal and performance
of compressor facilities.

23
However, very little information is available regarding actual gas storage costs. Table 1
presents the investment costs in an underground gas storage facility provided by ENECO in
2000. The investment costs in Europe and USA differ significantly. This may be the result of
differences in geological and technical characteristics.
Table 1. Investment costs in developing underground gas storage facility
(capacity 100 million cubic meters) in 2000. (Source: UNECE)
Type of UGS
facility
Investment costs per working
gas volume, €/ m3
Europe USA
Aquifer 0.24-0.42 0.10
Depleted field 0.24-0.42 0.09
Salt cavern 0.49-0.70 0.21
In another source, CIEP (2006), it is given that typical storage costs (tariffs) vary from
0.05 to 0.15 €/m3 of stored gas volume. Furthermore, in the paper the required investment in
developing storage reservoirs is estimated. In respect of the given volume of working gas in each
type of the reservoir, investment costs in a depleted gas field is determined to be 0.28 €/m3, in an
aquifer – 0.32 €/m3 and in a salt cavern – 0.80 €/m3. If typical working gas capacity of a depleted
gas field is 2,500 million m3, then the required investment costs are €700 million. Whereas for a
salt cavern, which has much lower working gas capacity – typically 50 million m3 –, investment
costs are €40 million. In addition, investment in a storage facility also implies that expenditures
for building a pipeline infrastructure are needed. Transport costs depend on the transportation
distance, transport capacity and the existence of pipeline infrastructure. Typically, transport costs
per 100 km differ between 0.002-0.008 €/m3/year (CIEP, 2006).
Storage costs play an important role as they have an impact on making investment
decisions. However, as it was shown above, storage costs differ significantly and are not certain.
This brings more uncertainty over gas storage projects and worsens the problem of under-
investment.

24
5. Real Options Methodology
After discussing the practical issues of underground gas storage facilities and analyzing
the actual market conditions of investments in gas storage, we turn to the analytical part of this
paper. In this chapter we will present the real options methodology - mathematical background,
valuation method and its advantages.
We have chosen this method for valuing investments opportunities in gas storage for
several reasons. Firstly, traditional investment valuation methods which use discounted cash
flow analysis - such as NPV - are incomplete as they fail to incorporate managerial flexibility
and innovations into the analysis (Yeo and Qiu, 2003). In real life investments are made in
volatile markets with high uncertainties, thus static valuations tend to misevaluate the
investments. In contrast to NPV, real options acknowledge the actual possibilities that investors
hold – to choose to postpone investment until new information arrives or the conditions become
more favourable, or to abandon the project in case of negative changes in the investment related
environment (IBM, 2002). This means that real options analysis includes timing flexibility which
adds value to the investment project as well as affects the investment decision making process.
Moreover, not only the possibility to delay the investment but also the irreversibility of the
investment is taken into account in real options analysis.
The theory of real options is an extension of financial options. A financial call option
provides the owner with the right – but not the obligation – to buy a security at a particular pre-
determined exercise price on a specific maturity date . Likewise, a real option can be defined
as the investors’ right – without the obligation – to invest in real (tangible) assets (Martínez-
Ceseña and Mutale, 2011). Investors acquire the assets by paying an exercise price, which in
case of real options is the capital costs required for developing the investment project. The value
of both – financial and real – options can be influenced by various factors such as expiration
times, assets or stocks’ value, volatilities and risk-free rates. However, financial and real options
also have important dissimilarities, for instance different length of expiration and tradability
(Yeo and Qiu, 2003).
In real option analysis, uncertainties (for example in gas prices and costs) can be
modelled stochastically. This is essential for determining the value of the investment project.
Stochastic processes and valuation method used in this paper are presented in the next section.

25
5.1. Real options framework
In this paper the real options framework from Dixit and Pindyck (1994) is used. The
authors also provide with mathematical background that is necessary for performing real options
valuation. The basics of it are presented in this section.
5.1.1. Stochastic processes
A variable which evolves through time with some sort of randomness is called a
stochastic process. The stochastic processes can be continuous-time (in the sense that variables
change continuously over time) and discrete-time (when variables can vary only at discrete
moments in time). In this paper continuous-time processes are used.
A Wiener process, which also can be named as a Brownian motion, is a continuous-time
stochastic process. A Wiener process holds three essential features:
It is a Markov process, which implies that the probability distribution for future
values is only dependent on the current state of the value. Past values are
irrelevant for forecasting the future changes of the process.
Its increments are independent, which means that changes in the process in the
next time interval do not depend on the previous changes.
Changes in the process are normally distributed.
Mathematically a Wiener process is expressed as follows:
, (5.1)
where is the increment of a Wiener process; is a random variable with normal distribution,
zero mean and standard deviation of one; is an infinitesimally small time period.
A Wiener process can be used for building more complex processes. One of its
generalizations is the geometric Brownian motion (GBM) with drift. Geometric Brownian
motion takes into account proportional changes in variable and can be described
mathematically as
, (5.2)
where is the change in over an infinitesimally small interval of time, is the drift
parameter, is the variance parameter, is the increment of a Wiener process.

26
Geometric Brownian motion has both properties – a drift rate and a “noise” term
(expressed by a standard Weiner process). The drift rate can also be named as a growth rate as it
shows the trend of the variable. Geometric Brownian motion is often used for modelling
economic and financial variables such as stock prices, energy prices and interest rates (Dixit and
Pindyck, 1994).
5.1.2. Ito’s Lemma
The stochastic processes presented above are continuous in time, however, not
differentiable. In order to determine the differentials of the functions of geometric Brownian
motion, Ito’s lemma is used.
Ito’s Lemma can be seen as a Taylor series expansion. To begin with, assume that
follows the geometric Brownian motion (described in equation (5.2)) and the function
can be once differentiable in and more than twice in . The total differential of is
expressed as:
. (5.3)
However, in ordinary calculus higher-order terms in equation (5.3) disappear. It can be
shown by expanding the third term from the equation:
. (5.4)
Note that . Thus the expression of now becomes:
. (5.5)
The first and second terms from equation (5.5) can be eliminated because terms
and approaches zero value faster than when it becomes infinitesimally small. The
term becomes:
. (5.6)

27
Regarding the fourth term in equation (5.3), all terms in the expression of will
be raised to the power higher than 1 and as a result vanish faster than . The same counts for all
other higher order terms, for instance . Fence, all higher order terms in equation (5.3) can
be eliminated. Thus Ito’s Lemma is expressed as
. (5.7)
Ito’s Lemma will be used in the next chapter for valuing the options to investment in
storage projects. In the next section the valuation method is presented.
5.1.3. Real options valuation method
In this paper the contingent claims method is applied for valuing investment
opportunities. This analysis, which is strongly connected to financial economics, is used to
evaluate an investment project that is characterized by the flows of benefits and costs under
particular uncertainties. In addition, a company’s right to invest in a project that brings flows of
profit can be seen as an asset. Following the important assumption that markets have a sufficient
variety of traded assets, the contingent claims analysis provides the rules for evaluating the
investment opportunity – an asset – which the company holds. The techniques presented in this
section will be applied and illustrated in concrete cases in the following chapters.
To begin with, assume that investors have a right to invest in a project which value
is dependent on the project output price . This variable follows the geometric Brownian
motion9:
, (5.8)
where is the drift parameter, is the variance parameter, is the increment of a Wiener
process.
Suppose that stochastic fluctuations in output price can be spanned by assets in
financial markets. Thus an investor can build a portfolio of traded assets that precisely replicate
the risk and the return of the investment project. 9 An important assumption in contingent claims analysis is that the underlying uncertainties can be mainly modelled by an Ito’s process, which special case is the geometric Brownian motion.

28
In this analysis the investor’s portfolio is constructed by holding a long position in the
project (which is aimed to be valued) and having a short position in units of the project output
. Next, is determined to make the portfolio riskless. Since the portfolio is free from risk, it
also earns the risk-free rate of return. Using these properties, the differential equation is derived
which can be solved by applying boundary conditions. Once the value of the investment
opportunity is known, the optimal investment timing and other conditions can be determined.
Now assume that is the function of and follows the geometric Brownian motion
with the same parameters and :
. (5.9)
Following contingent claims method, the replicating portfolio is built which price is .
This portfolio is perfectly correlated with and its price follows the stochastic process described
as:
, (5.10)
where is the drift rate, is the variance parameter, is the increment of a Wiener process.
The parameters and differ from the ones presented in equation (5.9). As spans the
stochastic fluctuations in , it is the increment of a Wiener process - - that is the same in both
equations (5.9 and 5.10).
Investors will hold this portfolio of assets only if they receive a total expected rate of
return . This is the risk-adjusted expected discount rate of return, which according to the capital
asset pricing model (CAPM) can be described as
, (5.11)
where is the risk-free rate, is the market price of risk, and indicates the correlation
between returns on a particular asset and the market portfolio .
We assume that the return from the portfolio comes only from capital gains as portfolio
does not pay dividend. It follows that, in order make investors willing to hold the portfolio,
return from portfolio has to be equal to . Thus the price of the portfolio can be described as:
. (5.12)
29
It is important to note, that - the growth rate of the value of the project - has to be
smaller than risk-adjusted discount rate . Otherwise the value would be unbounded as
with choosing higher the integral of equation (5.9) could be made indefinitely large. In other
words, this would imply that the growth rate of the value of the project would be expected to be
higher than the discount rate. As a consequence, waiting for longer would always be a better
choice and investment would not be implemented.
Regarding total return from the portfolio, a part of it arises from the expected capital
gain .10 As another part of the return comes in the form of some sort of dividend:
. (5.13)
As by assumption the output of the project is a commodity that can be stored,
characterizes the convenience yield from storage.11 To be more precise, represents the flow of
benefits (such as the capability to keep the production steady and prevent the stock shortage) that
investors get due to holding a commodity. For example, imagine that the company owns
storehouses of wheat. A natural disaster such as a drought occurs and damages large fields of
wheat. These circumstances lead to a shortage of wheat in the market and consequently a
significant increase in its prices. It is clear that the company which is holding the wheat in
storehouses now can get great benefits from it.
The use of contingent claims analysis gives a few more advantages. Firstly, the ability to
span stochastic changes in variables with the existing assets in the market means that there is no
need to take into account investors’ or firms’ risk preferences and discount rates. In this analysis
these are market’s beliefs and preferences that play a role (Smith and McCardle, 1999). Another
advantage of contingent claims valuation is that variables which follow a stochastic process do
not need to be forecasted (Kjӕrland, 2007).
In the following chapter we will analyze and value the options to invest in gas storage
projects. For this purpose we will use the real options methodology and framework which was
provided in this chapter. Furthermore, we will also present the approximations and assumptions
used in our analysis.
10
Parameter is expressed as the growth rate in the geometric Brownian motion. 11 Note that in this paper convenience yield and the risk-free rate of return are assumed to be exogenous parameters.

30
6. Valuing Investment in Gas Storage Project
It was shown in chapter 3 that the gap in seasonal gas storage capacity is increasing.
Furthermore, many gas storage projects have been delayed. In the section where storage costs
were discussed, it was mentioned that the expenditure for buying cushion gas accounts for the
largest share of the investment costs12. In addition, these costs for cushion gas are very uncertain
as they depend on the volatile gas price. An important feature of investments in gas storage
projects is irreversibility as sunk costs cannot be recovered. Besides, timing flexibility plays an
essential role as investors could change their investment decision according to new information
on gas price changes and market conditions.
Real options valuation is suitable for analyzing investment problems that bear the
characteristics mentioned above. A company’s right to invest in a gas storage project can be seen
as a real option, with the possibility to wait and delay the investment. The uncertain gas price can
be modelled as a stochastic variable which follows the geometric Brownian motion.
Furthermore, as the output of the storage project is natural gas, the assumption of tradability in
the markets (discussed in chapter 5) clearly holds.
We use real option analysis in this paper in order to value the investment in gas storage
and to determine the optimal timing of it. We describe this investment problem in two different
cases. Firstly, we assume that the gas field is completely depleted. This implies that, for
converting a gas field into a storage facility, additional costs are borne for buying cushion gas. In
this case we aim to estimate the trigger gas price at which it is optimal to invest in gas
storage and buy cushion gas. Furthermore, in the second case it is assumed that there is still
enough gas left in the field for using it as cushion gas and converting the field into gas storage.
The goal in this case is to determine two types of gas prices:
the price at which it is optimal to deplete the field completely and
afterwards, when the gas price drops to the level , to switch to gas storage;
12
According Codognet and Glachant (2006), the costs for buying cushion gas are estimated to be 50-80 percent of total investment costs.
31
the price at which it is optimal to immediately13 convert the gas field into a
storage facility.
There are several important assumptions made in our analysis. Firstly, the storage project
lasts for an infinitively long period. Besides, there is no leading time in developing the storage
project and there is no depreciation of it. As it was already mentioned, the gas field that could be
used for the storage project is either completely depleted, or contains a particular amount of gas
that would be sufficient for leaving it as cushion gas for the storage project. It is also assumed
that in case of not completely depleted gas field, all gas in place could be extracted and sold.
Furthermore, the characteristics of the gas field’s capacity do not change during the operational
period which means that deliverability and injection rates and working gas capacity remain
constant. Hence, there is a particular known amount of working gas that is stored and extracted
every year. The profit depends on the gas price spread, which is taken as a constant.
Furthermore, operational costs are included in the gas price spreads. In addition, transportation
costs of natural gas are excluded from our analysis. We assume that the existing pipeline
infrastructure can be used and transportation costs account only for a small share of gas storage
costs.
The analysis is based on the contingent claims method. In both cases we will firstly
determine the value of the investment. Secondly, we will determine the value of the option to
invest. The boundary conditions will be used for obtaining the solutions.
6.1. Valuing investment in completely depleted gas fields
6.1.1. The value and costs of the investment project
Now we analyze the case when the investment can be done in a completely depleted gas
field. To begin with, assume the company has a right to invest in a gas storage facility. As the
field is completely empty, this means that besides basic investment , which is needed for
13
Note that in this analysis we use the term “immediate” in the sense that the gas field will not be depleted before converting it into a storage facility. “Immediate storage” does not imply start of gas storage right away after getting the right to invest, but instead indicates that no other actions are taken before storage.
32
procedures such as changing equipment and installations, an additional investment for buying
cushion gas is required. The basic investment is taken as a constant. Additional investment is
a function of the gas price , which changes according to the geometric Brownian motion:
, (6.1)
where is the drift coefficient, is the proportional variance coefficient and is the increment
of a standard Wiener process.
As accounts for the price of all bought cushion gas and can be expressed by
multiplying gas price and the amount of gas that is needed for making it as cushion gas, it
also follows the geometric Brownian motion and has the same drift and variance coefficients:
. (6.2)
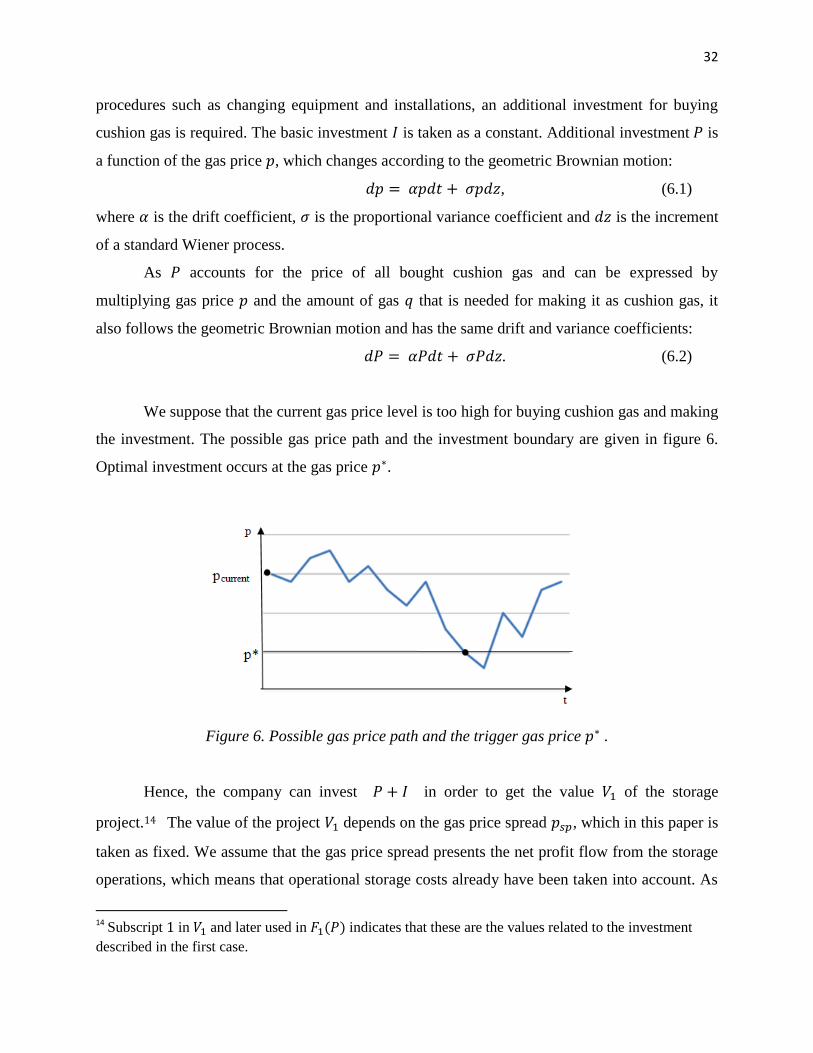
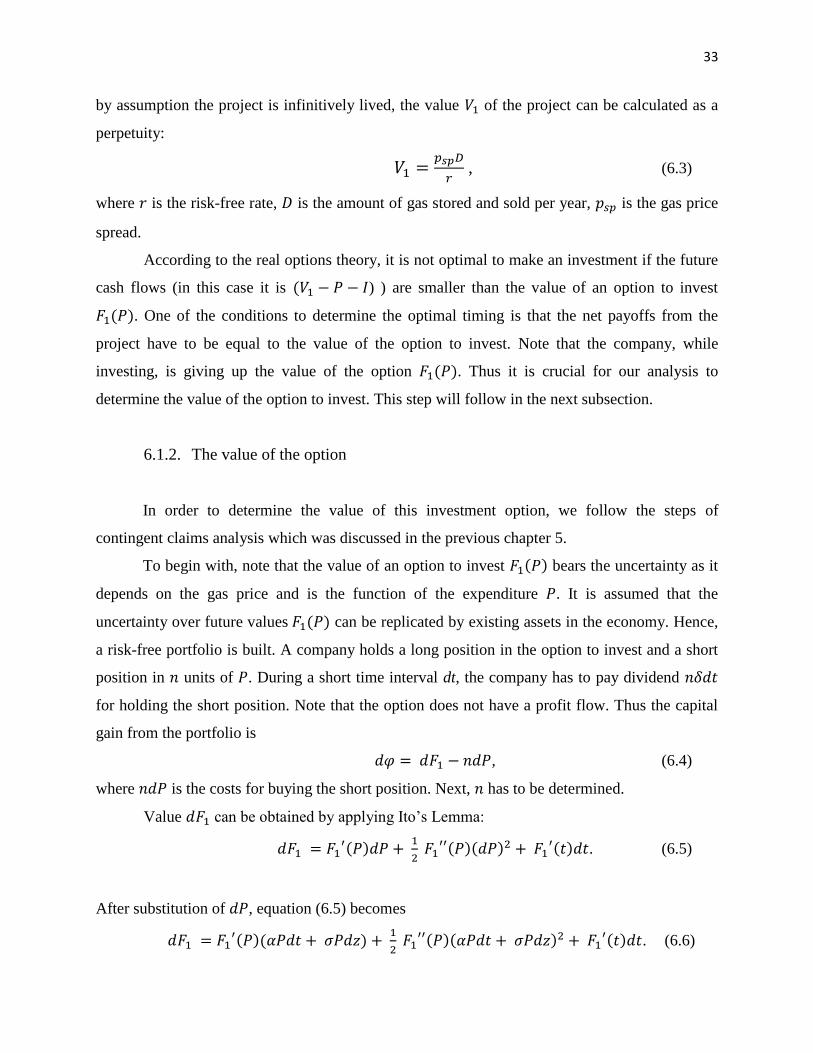
We suppose that the current gas price level is too high for buying cushion gas and making
the investment. The possible gas price path and the investment boundary are given in figure 6.
Optimal investment occurs at the gas price .
Figure 6. Possible gas price path and the trigger gas price .
Hence, the company can invest in order to get the value of the storage
project.14 The value of the project depends on the gas price spread , which in this paper is
taken as fixed. We assume that the gas price spread presents the net profit flow from the storage
operations, which means that operational storage costs already have been taken into account. As
14
Subscript in and later used in indicates that these are the values related to the investment described in the first case.
33
by assumption the project is infinitively lived, the value of the project can be calculated as a
perpetuity:
, (6.3)
where is the risk-free rate, is the amount of gas stored and sold per year, is the gas price
spread.
According to the real options theory, it is not optimal to make an investment if the future
cash flows (in this case it is ) ) are smaller than the value of an option to invest
. One of the conditions to determine the optimal timing is that the net payoffs from the
project have to be equal to the value of the option to invest. Note that the company, while
investing, is giving up the value of the option . Thus it is crucial for our analysis to
determine the value of the option to invest. This step will follow in the next subsection.
6.1.2. The value of the option
In order to determine the value of this investment option, we follow the steps of
contingent claims analysis which was discussed in the previous chapter 5.
To begin with, note that the value of an option to invest bears the uncertainty as it
depends on the gas price and is the function of the expenditure . It is assumed that the
uncertainty over future values can be replicated by existing assets in the economy. Hence,
a risk-free portfolio is built. A company holds a long position in the option to invest and a short
position in units of . During a short time interval dt, the company has to pay dividend
for holding the short position. Note that the option does not have a profit flow. Thus the capital
gain from the portfolio is
, (6.4)
where is the costs for buying the short position. Next, has to be determined.
Value can be obtained by applying Ito’s Lemma:
. (6.5)
After substitution of , equation (6.5) becomes
. (6.6)

34
As ,15 it follows that
. (6.7)
. (6.8)
Note that there is one term exposed to risk in the last equation - . Besides, in
our analysis the values of the options are dependent on the variable and not explicitly on time.
Thus we can eliminate the term from the equations as it is equal to zero.
The return on capital after substitution and terms collection is derived as:
. (6.9)
It can be seen now, that in order to make the portfolio free of risk, has to be chosen
equal to . Then the terms in dz disappear and portfolio becomes riskless. After substituting
into equation (6.9), we get that the capital gain from holding the portfolio is
. (6.10)
Total return from portfolio - which is capital gain minus dividend paid for the short
position - becomes
. (6.11)
As , and total return of portfolio is equal to the riskless return, it follows
that
; (6.12)
. (6.13)
Equation (6.13) is a second order linear differential equation, dependent on the variable
and its first and second order derivatives. For the solution of this homogeneous equation,
15
It was already explained while describing Ito’s Lemma. See subsection “Ito’s Lemma”.

35
function can be tried. After substituting this solution in to equation (6.13) and collecting
the terms, we get the characteristic equation
. (6.14)
Solving this equation, and are obtained:
; (6.15)
. (6.16)
In addition, , . This follows from the properties of the characteristic
equation (6.14).16
Now the general solution of the equation (6.13) can be obtained. It is the sum of two
independent solutions and
:
, (6.17)
where and are the constants to be determined.
Regarding the general solution, some economic considerations have to be taken into
account. When the costs for buying cushion gas are very high, the value of the option to invest is
becoming worthless. Thus when is approaching infinity, should become zero. However,
the term is also going to infinity when increases. Thus the term is set to zero in
equation (6.17). Now the solution is
. (6.18)
To obtain the values of , and , we use the following boundary conditions: 16
The characteristic equation has the shape of an upward-pointing parabola (see Appendix A for the graph of the characteristic equation). Moreover, and . Thus one root is larger than 1, and another one is negative.

36
. (6.19)
. (6.20)
The considerations of optimal investment provide conditions (6.19) and (6.20). can be
called the free boundary at which it is optimal to make an investment. Thus the first condition
(6.19) says that after investment the company gets a net payoff , which is equal to
the value of an option to invest at an optimal . This is called the “value-matching” condition.
The second condition (6.20) is the “smooth-pasting” condition, which means that the slopes of
the two functions (option value and net payoff) have to match the boundary .
It follows that
; (6.21)
. (6.22)
After solving the system of these equations, we get:
; (6.23)
. (6.24)
Here are the costs for buying all cushion gas needed. So the optimal costs for buying
one m3 of gas - which is the price of gas - at which investment should be made are:
(6.25)
where is the amount of cushion gas needed to buy.
It can be seen from equation (6.23) that the price for buying all cushion gas depends on
the parameter and on the difference between the project value and the basic investment costs.
If the value of the project increases (keeping other parameters constant), then the company is
willing to spend more on buying cushion gas. The parameter itself is a function of the risk-

37
free rate, convenience yield and volatility.17 Furthermore, if we express the project value from
equation (6.23), we get that
(6.26)
As , it follows that the value of the project has to exceed the costs ( )
in order to start the investment. This is contrary to the NPV rule which states that investment
should be done when the value is equal to the investment costs. The results imply that, according
to the real options approach, the company would demand higher return from its investment
because of the uncertainty and investments’ irreversibility.
In this section we have determined the optimal investment timing and the trigger gas
price at which investment in gas storage project should be implemented. The estimated optimal
gas price depends on a number of parameters such as the convenience yield, risk-free rate, gas
price volatility, value of the project and investment costs. The impact of the parameters on the
trigger price will be examined in the next chapter, where a numerical example will be provided.
In the next section another case of the investment in a gas storage project is analyzed.
6.2. The timing of two opportunities: gas field depletion and conversion into gas
storage
In this section we analyze the case where a company can make an investment in a
partially depleted gas field in order to convert it into a storage facility. It is assumed that the field
still holds a particular amount of gas that would be sufficient enough for using it as a required
volume of cushion gas. The company can choose between two options:
to convert the field immediately into a storage facility – option 1;
to deplete the field completely and then wait until the price drops sufficiently to
reinvest and start a storage project – option 2.
The choice between those two options depends on the gas price. If the gas price is high
( ), then it is profitable first to deplete the field and to sell the gas; and afterwards, when the
gas price drops to the gas price level (which was already determined in the previous analysis), 17 See equation (6.16).

38
to start storage. The company would convert the gas field immediately into a storage facility if
the gas price is at the low level . In our analysis we assume that the high trigger price
is always higher than the low trigger price . Hence the gap in between the two trigger gas
prices stands for a waiting period.
Assume that the current gas price is between the low and high gas prices. The possible
gas price paths and investment boundaries are illustrated in figure 7. The gas price path
favourable for the investment in option 1 is shown in figure 7(a). If the gas price firstly reaches
the boundary , then the company invests in gas storage. The possible gas price path when
investment in option 2 occurs is illustrated in figure 7(b). Note that we assume that is smaller
than . Thus in 7(b) it can be seen that after depleting the field and selling the gas at ,
the gas price has to drop to the lower level in order to start gas storage.
(a) (b)
Figure 7(a-b). Gas price paths and the trigger gas prices , and .
In the following subsections we will value these options and derive the high gas price –
the trigger price for investment in option 2 -, and the low gas price – the trigger price for
investment in option 1. As before, firstly the values of the projects are determined. Further,
starting with the options’ value expressions and using solving conditions, we obtain the
solutions.
6.2.1. The value and costs of the investment projects
In this case both investment projects require basic investment costs and have the same
profit flow from storing gas. However, the analyzed two investment opportunities differ in their

39
total costs and profits structure. The differences in the values of the projects are discussed in this
subsection.
Firstly, if the company is starting a gas storage project immediately, there is no need to
buy cushion gas as the required amount of it is left in the gas field. Thus, the company faces only
investment costs . Similarly to the previous analysis, these basic investment costs are taken as
fixed. The profit flow from this project is coming from the storage operations and depends on the
gas price spread . The gas price spread is taken as fixed, thus value of the infinitively lived
storage project can be obtained again as a perpetuity:
,18 (6.27)
where is the risk-free rate of return, is the amount of gas stored and sold per year, is the
gas price spread.
On the other hand, if the company firstly depletes the field and afterwards makes use of it
as a storage facility, it has higher investment costs. The company not only has to cover basic
investment costs , but also the costs for buying cushion gas. It was mentioned before, that
expenses for cushion gas depend on the gas price, which follows geometric Brownian motion.19
Furthermore, while implementing this option the company gets a profit from depleting the field
and selling the gas that was still left in the field. In addition, there are fixed production costs
for extracting the rest of the gas from the field. Thus the net payoff of this option is equal to the
profit from selling gas, less production costs and plus the value of the storage project that could
be implemented after gas field depletion, when the gas price drops sufficiently low.
Understanding the costs and profit flows of every investment project is important for
building the right solving conditions and therefore determining the value of the option. These
values of the options and solving conditions are presented and solved in the next subsection.
6.2.2. The value of the options
In this case the company holds an option – either to start gas storage immediately or to
deplete the field first – which has the value described as a function . At two different price 18
Subscript in and later used in indicates that these are the values related to the investment described in the second case. 19
See equation (6.2).

40
levels – the low price and the high price - the value of this option differs. This means that
investing in one of the two projects, the company gives up either the option value (at the
low price ) or (at the high price ).
The values of these options are derived by following the steps of the contingent claims
approach, using the same hedging argument as in the previous analysis. We get the following
expression for the value of the option to convert a gas field into a storage reservoir without
depleting it20:
, (6.28)
where and are the constants to be determined.
Similarly, the value of the option to deplete the field when the gas price is high and
afterwards to switch to gas storage is
. (6.29)
When the company invests in option 1, it gets a net payoff equal to ( ). Thus the
value matching condition for the value of this option becomes
. (6.30)
In addition, the smooth-pasting condition is
(6.31)
The way of solving the system of equations (6.30) and (6.31) is provided in Appendix B.
After solving it we get:
; (6.32)
. (6.33)
20
This is the value of the option that is implemented when the gas price is low, .

41
When the gas price is high, the company depletes the field first and gets the profit
from selling the gas. Besides, while depleting the field, the company also faces production costs
. After producing the gas, the company holds an empty field. The value of the option to invest
in storage when the field is completely depleted was already determined in the previous section
(see equation 6.18). As a reminder, it is equal to
. (6.34)
Hence, regarding option 2, for the value-matching condition we equate the value of the
option (equation 6.29) to the net payoff that the company would get after depleting the field:
. (6.35)
The smooth-pasting condition becomes
(6.36)
The solution of the system of equations (6.35) and (6.36) is given in Appendix C. Solving
it gives that
; (6.37)
. (6.38)
As the value for cannot be estimated directly, we determine the ratio
instead. The
following equations are obtained using equations (6.32), (6.33), (6.37) and (6.38):
–
; (6.39)
. (6.40)

42
It follows that
–
. (6.41)
Even though cannot be derived analytically, we can obtain a numerical solution of .
Then can also be calculated as:
. (6.42)
Similarly to the previous analysis, the trigger high and low gas prices depend on several
parameters. In the following chapter, together with the results from the first case, we will analyze
how the changes in particular parameters affect the values of those trigger prices. As an example,
we will take the Dutch gas market and assign the real values of the parameters. Numerical gas
prices that are necessary for implementing investments in gas storage will be estimated.

43
7. Numerical Case
Even though we use real options methodology to solve a practical investment problem,
the solutions derived in chapter 6 may appear too abstract. In this chapter we will use a
numerical case to illustrate the results of the real option analysis and provide realistic outcomes.
The numerical case will be applied for the Dutch21 gas market. We will firstly provide the actual
values of the parameters and then estimate the trigger gas prices. However, one should be aware
that these numerical values are not certain and change according economic and technical
conditions. Hence, we will perform a sensitivity analysis and examine the effect of particular
parameters on the trigger gas prices and other important outcomes.
7.1. Actual values of the parameters
There were a number of parameters used in the analysis. The main parameters are
associated with the gas price, discount rates, costs and capacity characteristics of the gas field.
In the analysis the main modelled uncertainty is the gas price which follows a geometric
Brownian motion.22 We estimated that the compound annual growth rate of the gas price (taken
as the Henry Hub Index HHUB23) during the period of 1990-2010 is 2.5 percent per year.24 Thus,
= 0.025. Excluding the gas price peaks from the same historical gas price data, it was
calculated that annual gas price volatility is 70 percent, ergo = 0.7. Furthermore, it was already
mentioned in chapter 3 that the historical seasonal gas price spread was 0.015 €/m3 during 1994-
2004. However, in order to make storage projects more financially feasible, we will use the
higher gas price spread ( = 0.03 €/m3) as one of the basic parameters. The value 0.015 €/m3
will be used later in the sensitivity analysis. 21
Although we want to estimate actual values of the investment in gas storage in The Netherlands, some data (such as data on historical gas price) is taken from US markets. This is due to a very limited access to European data. 22
To remind the reader, we express the gas price as , where is the drift coefficient, is the proportional variance coefficient and is the increment of a standard Wiener process. 23
The Source: Bloomberg. 24 The compound annual growth rate is calculated as follows:
.

44
Another important group of the parameters is the discount rates. The risk-free rate is
determined as the average of the last 10 years historical The Netherlands Government bond (10
year) yield and is equal to 4.2 percent. 25 Moreover, the value of convenience yield from gas
storage was already estimated in several articles (Wei and Zhu, 2006; Khan, Khokher, Simin,
2005). The estimates of convenience yield vary from 2.5 percent to 4 percent. In this paper we
take the average of these estimates – which is 3.25 percent – as the value of the convenience
yield. Consequently, we derive the risk-adjusted expected rate of return, which is expressed as
. Hence, = 0.058.
Concerning gas field characteristics, a medium sized gas storage facility is chosen. The
total gas field storage capacity is assumed to be 5 billion m3. Besides, we assume that 60 percent of
the gas field’s storage capacity is cushion gas. This implies that working gas capacity is 2 billion m3
and the rest, 3 billion m3 is cushion gas. In respect to the gas field capacity, we estimated the
average development costs to be €660 million26. The expenses for cushion gas depend on the gas
price and are derived in the analysis. Furthermore, the average gas production costs in the
Netherlands are taken as 0.02 €/m3 (Lochner and Bothe, 2009).
Since we have already assigned the actual values to the parameters, now we can obtain
the values of the investment projects and estimate the trigger gas prices. This follows in the next
section.
7.2. Results
In this section we will present the numerical results obtained while performing a real
options analysis. The values of the input parameters are summarized in Appendix D. The results
of both cases are presented in table 2 and table 3.
Table 2 provides the outcomes from the first case where an investment is made in a
completely depleted gas field. The trigger gas price - at which investment should be done - is
determined to be 0.0341 €/m3. According to the World Bank Commodity Price data, in June
2011 the gas price in US was 0.11 €/m3 whereas in the European gas market it was twice higher
25See: http://www.tradingeconomics.com/Economics/Government-Bond-Yield.aspx?symbol=NLG 26
See table 1 in chapter “Underground gas storage” for investment costs. We took the average costs which are equal to 0.33 € per m3 of working gas volume.

45
– 0.23 €/m3.27 This implies that the gas price has to drop to the lower levels, and especially to
decrease a lot in Europe, in order to make investment in gas storage worthwhile.
Table 2. Results of case 1.
OUTCOMES Value of the storage project, million € 1428.6 Value of the option to invest, million € 666.15 Costs for buying cushion gas, million € 102.42 Gas price for buying cushion gas, €/m3 0.0341
Furthermore, note that the value exceeds the costs – which are equal to
762.42€ million - almost twice. As already emphasized in the analytical part, this outcome is
contrary to the NPV rule. As investment in gas storage is irreversible and bears uncertainties, the
company requires a higher return from it.
The results of the second case – when an investment is made in a partially depleted gas
field which holds a sufficient amount of gas that could be used as cushion gas - are presented in
table 3.
Table 3. Results of case 2.
OUTCOMES , €/m3
0.623
, €/m3
0.046
The trigger gas price , optimizing the investment in the option to deplete the field
first, is estimated to be 0.623 €/m3. Furthermore, the trigger gas price , for investment in the
option to start storage immediately, is equal to 0.046 €/m3. If we look through the perspective of
the current European gas price28, both trigger gas prices imply waiting and postponement of the
investments.
From the described results of both cases it follows that the gas price has to be very low in
order to implement the gas storage project. This means that a company is willing to spend a
27
This World Bank Commodity Price Data on US market is consistent with the Bloomberg data on HHUB index in 2011. 28
It was mentioned above that the current European gas price is 0.23 €/m3.
46
relatively small amount of money on buying cushion gas in order to start the investment and to
gain the value of the storage project. As according to the forecasts by IEA (2009) the gas price
will keep on increasing, the chances the price will drop to such a low level are small. However, if
the actions are taken to alter other factors which affect gas storage investments, the situation
could be changed. In the next section we will perform a sensitivity analysis and capture the
impact of the main parameters on optimal investment timing and the option values.
7.3. Sensitivity analysis
We will start the sensitivity analysis with determining how the parameters alter the
results of the first case, when investment is done in a completely depleted gas field. Afterwards
we will analyze the impact of the parameters in the second case, where the company can invest
in a partially depleted field.
7.3.1. Sensitivity analysis of case 1
There are several important parameters - such as basic investment costs, gas price spread,
and volatility - that are expected to have a significant influence on optimal investment timing and
the option values.
In chapter 2 and chapter 4 high investment costs were already indicated as an important
obstacle for investing in gas storage. In our analysis we used the value of €660 million as the
baseline indicator for the basic investment costs. To see the influence of these costs, we will run
a numerical analysis with two more different values: a lower value - €480 million, and a higher
value - €840 million.29
Table 4 shows that when basic investment costs are lower, the trigger gas price increases
( = 0.042 €/m3), whereas higher investment costs lead to a smaller trigger price ( = 0.026
€/m3). Having in mind current gas price levels, these results imply, unsurprisingly, that higher
investment costs lead to the postponement of the investment, while lower basic investment costs
29
These were the boundary values of the investment costs per m3 of working gas. See table 1 in section “Storage Costs”.

47
encourages the investment in gas storage. These expected results also illustrate that the model is
consistent.
Table 4. Trigger gas price at three different basic investment levels.
BASIC INVESTMENT, million € 480 660 840 , €/m3 0.042 0.034 0.026
Another key parameter is the volatility of the gas price. How volatility alters the trigger
gas prices and the values of the investments is illustrated in figures 8-9. When uncertainty over
the gas price increases, the trigger gas prices drop (figure 8). Furthermore, in figure 9 it is shown
that higher volatility increases the value of the option. Hence, lower volatility encourages the
investment, whereas high volatility leads to the postponement of it.
Figure 8. Impact of volatility on the trigger gas prices.
Figure 9. Impact of volatility on the value of the option.
0
0,05
0,1
0,15
0,2
0,25
5% 15%
25%
35%
45%
55%
65%
75%
85%
95%
€/m
3
Volatility
Trigger Gas Price, €/m3
0100200300400500600700800
5% 15%
25%
35%
45%
55%
65%
75%
85%
95%
mil
lio
n €
Volatility
F(P) (Value of the option)

48
The gas price spread plays an important role in storage investments as it directly affects
the value of the investment project. To illustrate the impact of this parameter, we perform a
numerical analysis at two more gas price spread levels: at the lower level – 0.015 €/m3, and at the
higher level – 0.06 €/m3. The results of the investment at three different gas price spread levels
are provided in table 5. Note that the baseline value of the gas price spread is 0.03 €/m3. The
lower gas price spread leads to a very low trigger gas price (0.0024 €/m3), while the higher
spread results in the higher trigger price (0.0976 €/m3).
Table 5. Different gas price spreads and the results of case 1.
GAS PRICE SPREAD, €/m3 0.015 0.03 0.06 , gas price for buying cushion gas, €/m3 0.0024 0.0341 0.0976
Summing up the effects of the parameters analyzed in this section, it should be said that
changes in these parameters alter the optimal investment timing and the values of the options
significantly. Higher revenues from the storage project, smaller investment costs and decreasing
uncertainty enhance the investments in gas storage. Next, we will analyze the impact of the main
parameters in the second case.
7.3.2. Sensitivity analysis of case 2
In this subsection we will examine the effects of the main parameters on the results of the
second case, when investment is implemented in a partially depleted field giving two investment
options to the company30. Where applicable, we will use the same lower and higher values of the
parameters as in the previous subsection.
Firstly, we will analyze the impact of the basic investment costs on the outcomes of the
second case. As in the previous case, we take two more values: the lower value - €480 million,
and the higher value - €840 million. In table 6 it is shown how different basic investment levels
affect the results. At the baseline level - €660 million – it is optimal to deplete the field at
= 0.623 €/m3, or to start immediate storage at = 0.046 €/m3. When the basic investment
30
To remind, the company can either invest in gas storage immediately without depleting the field or can firstly deplete the field and afterwards invest in gas storage.

49
costs drop to the lower level - €480 million – the trigger gas price (compared to the baseline
results) for the investment in the gas field depletion increases to 0.727 €/m3. At the same time the
trigger gas price for the investment in immediate gas storage also increases ( = 0.057 €/m3).
Hence when the basic investment costs are lower, the investment in depletion is postponed more,
whereas waiting time for the investment in gas storage is shortened in comparison to the baseline
results. This implies that, because of the lower expenditures, the company is willing to invest in
gas storage at the higher price. With the lower investment costs the storage project becomes
more favourable than the gas field depletion.
Table 6. Trigger gas prices at three different basic investment levels.
BASIC INVESTMENT, million € 480 660 840 , €/m3 0.727 0.623 0.521
, €/m3 0.057 0.046 0.036
Furthermore, when the basic investment costs increase to €840 million, the trigger gas
price for the investment in the gas field depletion drops to 0.521 €/m3. Meanwhile, the trigger
price for the storage option decreases to 0.036 €/m3. In comparison to the baseline results, these
outcomes suggest that higher investment costs lead to delay of the investment in gas storage and
at the same time encourages investment in the gas field depletion.
Figure 10. Impact of volatility on the trigger gas prices.
The impact of another parameter – volatility of the gas price – is presented in figure 10.
As expected, the higher uncertainty results in the postponement of investment in both options -
00,10,20,30,40,50,60,70,8
40% 50% 60% 70% 80% 90%
€/m
3
Volatility
Trigger gas price (p_high)
Trigger gas price (p_low)

50
the trigger prices for investing in the gas field depletion increase whereas the trigger prices for
investing in immediate storage decrease. Looking through the current gas price perspective, this
means that the gap between trigger gas prices and current price widens at a higher level of
volatility. In the contrary, this price gap decreases when volatility is smaller. Hence, decreasing
uncertainty fosters the investment in both options. The exact values that were obtained while
simulating the values of volatility are given in table 7.
Table 7. Trigger gas prices at three different volatility levels.
VOLATILITY, % 40 70 90 , €/m3 0.439 0.623 0.759
, €/m3 0.111 0.046 0.028
Another essential parameter in the case of the investment in a partially depleted gas field
is production costs. To determine the effect of production costs we check how lower productions
costs (which are chosen to be 0.008 €/m3) and higher costs (0.05 €/m3) alter the results compared
to the baseline costs parameter - 0.02 €/m3. The values of the trigger gas prices at different
production costs are provided in table 8. When production costs are low, the trigger price
decreases slightly. This indicates that investment in the storage option is postponed more
compared to the baseline results. In addition, the lower production costs also decrease the trigger
gas price . As the company faces lower production costs, it is willing to earn less from
produced and sold units of gas. At the lower production costs the depletion option bears less
waiting than the storage option.
Table 8. Results of case 2 at different production costs.
PRODUCTION COSTS, €/m3 0.008 0.02 0.05 , €/m3 0.515 0.623 0.901
, €/m3 0.045 0.046 0.048
On the contrary, when production costs increase to 0.05 €/m3, the company requires
higher revenues from produced gas; the trigger gas price for the gas field depletion increases
significantly and becomes equal to 0.901 €/m3. Besides, higher production costs lead to a

51
negligible increase in the trigger gas price for the investment in immediate gas storage ( =
0.048 €/m3). Thus the investment in the gas storage option is very slightly fostered.
As in the previous subsection, we will also examine the influence of the gas price spread
on the results of case 2. The lower and the higher gas price spread values are the same as
previously – the lower 0.015 €/m3, the higher – 0.06 €/m3. In respect of the baseline results, the
lower gas price spread decreases both trigger gas prices significantly - drops to 0.220 €/m3,
to 0.004 €/m3 (see table 9). This leads to a huge postponement of investment in immediate
gas storage. Hence, low revenues from the storage project make the investment hardly feasible.
In contrast, the investment possibility in the gas field depletion is enhanced due to a large
decrease in .
Table 9. Impact of the gas price spread on the trigger gas prices.
GAS PRICE SPREAD, €/m3 0.015 0.03 0.06 , €/m3 0.220 0.623 1.445
, €/m3 0.004 0.046 0.129
On the other hand, if the gas price spread increases, the trigger gas price for investing in
gas storage rises. Thus investment in gas storage is encouraged. Meanwhile the trigger gas price
increases drastically ( = 1.445 €/m3) which leads to a very long waiting period for the
investment in field depletion. Thus the higher gas price spread makes the immediate gas storage
project more profitable and earlier implementable.
To sum up, the parameters analyzed in this subsection have an important effect on the
optimal timing of both investment options the company holds. The results, altered by different
values of the parameters, vary greatly. As mentioned at the beginning of this paper, these are the
uncertainty, revenues and costs that have the greatest impact on making investment decision in
underground gas storage projects.

52
8. Conclusions
In this paper we studied the investment opportunities in underground gas storage under
uncertainty. We investigated two different cases: investing in either completely or partially
depleted gas fields. Using real option analysis we modelled these investment opportunities and
determined the optimal timing of every option. Analytical results of both cases have shown that
the trigger gas prices for implementing the investments are influenced by a number of factors,
such as volatility of the gas price, investment costs and the gas price spread.
In a numerical case, which was applied to the gas market in The Netherlands, we
obtained the actual values of the trigger gas prices. Taking a European gas price perspective, the
trigger prices for optimal investment in gas storage in both cases appeared to be very low,
whereas the estimated trigger price for investing in depleting the gas field (in the second case)
was relatively high. Hence the waiting period for investing is supposed to be long in all analyzed
options. However, the length of the postponement depends on the initial gas price and the
upcoming changes in gas supply and demand and the gas prices.
There are several important observations that can be derived from the results of the
sensitivity analysis. Firstly, this analysis has proved that increasing uncertainty leads to a higher
value of the options, as well as to the postponement of investments. Besides, a decrease in the
basic investment costs tends to encourage investment in gas storage, while higher investment
costs lead to longer postponement of this option. Moreover, the gas storage project is becoming
more feasible when the gas price spread increases. A higher value of the storage project gives
incentives to invest earlier at a relatively higher gas price. When the gas price spread is higher,
then the trigger gas price for depleting the field is rising drastically, which leads to an extended
postponement of this option. On the other hand, the lower gas price spread postpones the storage
project a lot and at the same time encourages investing in the depletion of the gas field. The
depletion option is also fostered when production costs drop to lower levels. Higher production
costs lead to a much higher trigger gas price for the depletion option. The fact that some of the
results from the sensitivity analysis are straightforward, proves that the model is consistent and
reliable.
It follows that, in order to enhance investment in gas storage, a less volatile investment
environment is needed. However, one of the main uncertainties - the gas price – is influenced by

53
a number of exogenous factors that a single country or a region cannot affect. Part of the
uncertainty may however originate from uncertainty in regulatory frameworks. Hence, in order
to stimulate investments in gas storage, stable and reliable regulatory regimes of gas storage
markets should be implemented. This would lead to a more secure investment environment.
Furthermore, another part of the investment incentives depends on the costs and revenues. The
revenues from the storage project are subject to market conditions and changes in the gas price
spread, whereas the investment costs may be altered due to technological process.
It is important to note that there are several limitations in this paper. Based on the real
options approach we built a model with only one uncertainty – the gas price. However, there are
other parameters - such as the gas price spread – which change stochastically as well. Thus
incorporating more than one stochastic variable could lead to more precise results of the analysis.
However, with more than one stochastic variable, finding a solution of the model would be very
complicated. Moreover, we did not include the investment lead time of storage projects in our
analysis. As underground gas storage projects have a very long lead time which brings more
uncertainties to investors, optimal investment timing could be affected by taking this into
account. Furthermore, we examined the investment opportunities through the perspective of a
single company. Once a competitive storage market environment is introduced, behaviour of
investors is supposed to change. For example, suppose that the gas price is expected to drop to
very low levels, thus attracting more investors to invest in gas storage. This higher competition
in the future is expected to decrease the profit of the project as well as the value of investing.
Hence waiting loses its value and it may become desirable for the investor to make a first move
before other competitors do.
Undoubtedly, there is a lot of room left for future research on underground gas storage.
However, modelling investment in gas storage is a very complicated process and an accurate
analysis of it requires incorporation of a number of changing variables. For example, the
incorporation of market conditions such as liberalization and increasing competition. In addition,
as it was shown in our paper, flexibility in investment timing and optionally are of great
importance and should not be left out of the equation.

54
Appendix A
The characteristic equation is described as:
. (A.1)
The coefficient next to is positive, thus the graph of this equation is an upward-pointing
parabola. In addition, and . This means that one root, namely , is larger
than one, while another one, , is negative.
The graph of characteristic equation.
Appendix B
Solving the value of the option to switch immediately into storage when the gas price is low.
Value matching condition:
. (B.1)
Smooth-pasting condition:
. (B.2)
Solving steps:
Multiply equation (B.1) by and equation (B.2) by :
; (B.3)
; (B.4)
. (B.5)
-
2 1 1
Q

55
Multiply equation (B.1) by and equation (B.2) by :
; (B.6)
; (B.7)
. (B.8)
Appendix C
Solving the value of the option do deplete the field when the gas price is high and to convert to
storage afterwards.
Value matching condition:
. (C.1)
Smooth-pasting condition:
. (C.2)
Solving steps:
Multiply equation (C.1) by and equation (C.2) by :
; (C.3)
(C.4)
. (C.5)
Multiply equation (C.1) by and equation (C.2) by :
; (C.6)
(C.7)
. (C.8)

56
Appendix D
Values of the parameters
INPUTS Investment in a gas storage facility, million € 660 The growth rate of the gas price, annual 0.025 Risk-adjusted return, annual 0.058 Standard deviation (of the gas price), annual 0.70 Variance 0.49 Convenience yield 0.033 Risk-free rate, annual 0.042 Gas price spread, €/m3 0.03 Production costs, €/m3 0.02
Gas field’s characteristics
All storage capacity, billion m3 5.0 Ratio cushion gas/total gas volume 60% Working gas capacity, billion m3 2.0 Required cushion gas, billion m3 3.0

57
References
Books
Dixit, A.K. and Pindyck, R.S., 1994. Investment under uncertainty. Princeton, New Jersey: Princeton University Press.
Articles
Boogert, A. and Jong, C., 2006. Gas Storage Valuation using a Monte Carlo Method. Birkbeck
Working Papers in Economics & Finance. Caton, H.G., 1984. Gas Supply and Storage Planning: A Simulation Approach. The Journal of
the Operational Research Society. 35 (7), pp. 593-596. Clingendael International Energy Programme (CIEP), 2006. The European Market for Seasonal
Storage. (CIEP 01/2006) The Hague: The Clindendael Institue. Codognet, M-K. and Glachant, J-M., 2006. Weak Investment Incentives in New Gas Storage in The United Kingdom?, Not published. Cortazar, G. and Schwartz, E.S., 1997. Implementing a Real Option Model for Valuing an Undeveloped Oil Field. International Transactions in Operational Research, 4 (2), pp. 125-137. Fan, Y. and Zhu, L., 2010. A real options based model and its application to China’s overseas oil investment decisions. Energy Economics, 32, pp. 627-637. Federal Energy Regulatory Commission (FERC) report, 2004. Current State of and Issues
concerning Underground Natural Gas Storage.(AD04-11-000). Felix, B., Woll, O., Weber, C., 2009. Gas Storage Valuation under Limited Market Liquidity: An Application in Germany. EWL Working Paper 5.

58
Foreest, F., 2010. The Role of Natural Gas in the Dutch Energy Transition: Towards low-carbon electricity supply. Oxford Institute for Energy Studies. Höffler, F. and Kübler, M., 2007. Demand for storage of natural gas in northwestern Europe. Trends 2005-2030. Max Planck Institute.
Holland, A., 2007. Injection/Withdrawal Scheduling for Natural gas Storage Facilities. ACM. IBM, IBM Institute for Business Value, 2002. Calculating value during uncertainty: getting real
with “real options”. [G510-3248-00]. New York.
Joode, J. and Özdemir, Ö., 2010. Demand for seasonal gas storage in Northwest Europe until 2030: Simulation results with a dynamic model. Energy Policy, 38, pp. 5817-5829. Khan,S., Khokher, Z., Simin, T., 2005. Inventories, Convenience Yields and Mean Reversion. Not published.
Kjӕrland, F., 2007. A real options analysis of investments in hydropower – The case of Norway. Energy Policy, 35, pp. 5901-5908. Lee, S-C. and Shih, L-H., 2010. Renewable energy policy evaluation using real option model – The case of Taiwan. Energy Economics, 32, pp. 567-578. Levary, R.R. and Dean, B.V., 1980. A Natural Gas flow Model under Uncertainty in Demand. Operations Research, 28 (6), pp. 1360-1374 Lochner, S. and Bothe, D., 2009. The development of natural gas supply costs to Europe, the United States and Japan in a globalizing gas market – Model-based analysis until 2030. Energy
Policy, 37, pp. 1518-1528. Lyness, F.K., 1984. Gas Demand Forecasting. Journal of the Royal Statistical Society. Series D
(The Statistician), 33 (1), pp. 9-21. Martínez-Ceseña, E.A. and Mutale, J., 2011. Application of an advanced real options approach for renewable energy generation projects planning. Renewable and Sustainable Energy Reviews, 15, pp. 2087-2094.

59
McDonald, R. and Siegel, D., 1986. The Value of Waiting to Invest. The Quarterly Journal of
Economics, 101 (4), pp. 707-728. Siddiqui, A. and Fleten, S-E., 2010. How to proceed with competing alternative energy technologies: A real option analysis. Energy Economics, 32, pp. 817-830. Siddiqui, A.S., Marnay, C. and Wiser, R.H., 2007. Real option valuation of US federal renewable energy research, development, demonstration, and development. Energy Policy, 35, pp. 265-279. Smith, J.E. and McCardle, K.F., 1999. Options in the Real World: Lessons Learned in Evaluating Oil and Gas Investments. Operations Research, 47 (1), pp. 1-15. Thompson, M., Davison, M., Rasmussen, H.,2003. Natural Gas Storage Valuation and optimization: A Real Options Application. Not published. Yeo, K.T.and Qiu, F., 2003. The value of management flexibility – a real option approach to investment evaluation. International Journal of Project Management, 21, pp. 243-250. Wei, S.Z.C., and Zhu, Z., 2006. Commodity convenience yield and risk premium determination: The case of the U.S. natural gas market. Energy Economics, 28, pp. 523-534. Welch, T.H., Smith, J.G., Rix, J.P. and Reader, R.D., 1971. Meeting Seasonal Peak Demands for Natural Gas. Operational Research Quarterly (1970-1977), 22, (Special Conference Issue), pp. 93-106. World Energy Outlook 2010. International Energy Agency (IEA). OECD/IEA, 2010. World Energy Outlook 2009. International Energy Agency (IEA). OECD/IEA, 2009. Natural Gas Market Review 2009. International Energy Agency (IEA). OECD/IEA, 2009.

60
Electronic sources
Gasunie, 2007. Perspectives of Natural Gas Storage in Europe. (Presentation). Available at <http://www.cessa.eu.com/sd_papers/berlin/CeSSA_Berlin_104_Groenendijk.pdf> [Accessed on 7 June 2011]. CBS (Centraal Bureau voor de Statistiek), Statline. Available at <http://statline.cbs.nl/StatWeb/default.aspx?LA=EN> [Accessed on 20 May 2011]. Eurostat, Energy Statistical Databases. Available at <http://epp.eurostat.ec.europa.eu/portal/page/portal/eurostat/home> [Accessed on 25 May 2011]. EIA (U.S. Energy Information Administration). Natural Gas. Available at <http://www.eia.gov/dnav/ng/hist/rngc1M.htm> [Accessed on 24 May 2011]. EIA (U.S. Energy Information Administration). The basics of underground gas storage. Available at <http://www.eia.gov/pub/oil_gas/natural_gas/analysis_publications/storagebasics/storagebasics.html> [Accessed on 15 June 2011]. EBN (Energie Beheer Nederland B.V.) Focus on Dutch gas 2010. (Presentation) Available at: <http://www.ebn.nl/presentaties.php> [Accessed on 11 May 2011]. United Nations Economic commission for Europe (UNECE). More underground gas storage for
increased gas consumption. Available at < http://www.unece.org/press/pr2000/00ene1e.htm> [Accessed on 26 June 2011].