Embed Size (px)
Citation preview
INVESTMENT BANKING NEWSLETTERTECHNOLOGY
APRIL 2018
2Apr 2018 – Spark Technology Newsletter
Dear Reader,
Welcome to the eleventh edition of the monthly TechnologyNewsletter from Spark Capital. With this newsletter, we have tried togive you a flavour of various updates across the Software, TechServices, Internet, and FinTech sectors.
India’s consumer internet industry is undergoing tremendousinnovations. Increasing internet penetration and digitization arechanging the paradigm of consumer internet.
Saavn’s sale to JioMusic could be a key step in the evolution ofconsumer internet industry in India. The deal proves that distribution,reach and large user bases aren’t the significant competitive moats (asthey once were). JioMusic has levelled the playing field to such anextent that a new entrant has commanded twice the value of Saavn.
The mobile user base is 15x larger than the PC world, hence the oldercompetitive moats don’t work, the disruption cycles are so fast, that thecompetition in the consumer internet has never been fiercer.
We are starting to see in some established categories with largenumbers of entrants and few barriers to entry, where only price is thedifferentiator, that commodification is inexorable. If you are competingon price, at some point you will bottom out where you can no longerundercut. At that point, the business will begin to compete on servicerather than customer acquisition, technology, category creation etc.
Horizontal e-commerce has seen two clear leaders emerge which areFlipkart and Amazon respectively. We expect further consolidationamong vertical players in grocery, food delivery, furniture.
Recently, we saw two interesting partnerships; Flipkart withMakeMyTrip and MakeMyTrip with OYO Rooms both synergizing thereach to a wider consumer base for their travel and hotels; MakeMyTripwill leverage the large customer base of Flipkart’s platform to driveonline bookings in travel services and OYO’s hotels will be available forbooking on MakeMyTrip.
There will be a litany of cascading effects post these deal/partnerships.Notwithstanding the discussions on valuation, founders will redoubletheir efforts to focus on their business and innovation will accelerate.For incumbents, the race is on to defend their businesses. For startups,the opportunity to disrupt has never been more accessible.
FROM THE DIRECTOR’S DESK
3Apr 2018 – Spark Technology Newsletter
As a part of this newsletter, we also wanted to bring in a direct perspective from leading industry operators in certain select segments. For this edition, we have picked the insur-tech segment and have included an interview of EasyPolicy, an emerging insurance technology company in our ‘Expert Speak’ section. I would like to take this opportunity to thank Mr. Divyanshu Tripathi, Co-founder & CEO of EasyPolicy for being of great help and for providing his thoughts.
Also covered in this edition are the latest trading and transaction updates across the globaltechnology sector. I am sure the section on “From our Equities Desk” would be an interesting read.
I hope that you will find this Newsletter insightful and look forward to your feedback on thismonthly market overview.
Vikash KabraDirector and Head – Technology,Investment Banking
FROM THE DIRECTOR’S DESK
4Apr 2018 – Spark Technology Newsletter
WHAT’S INSIDE?
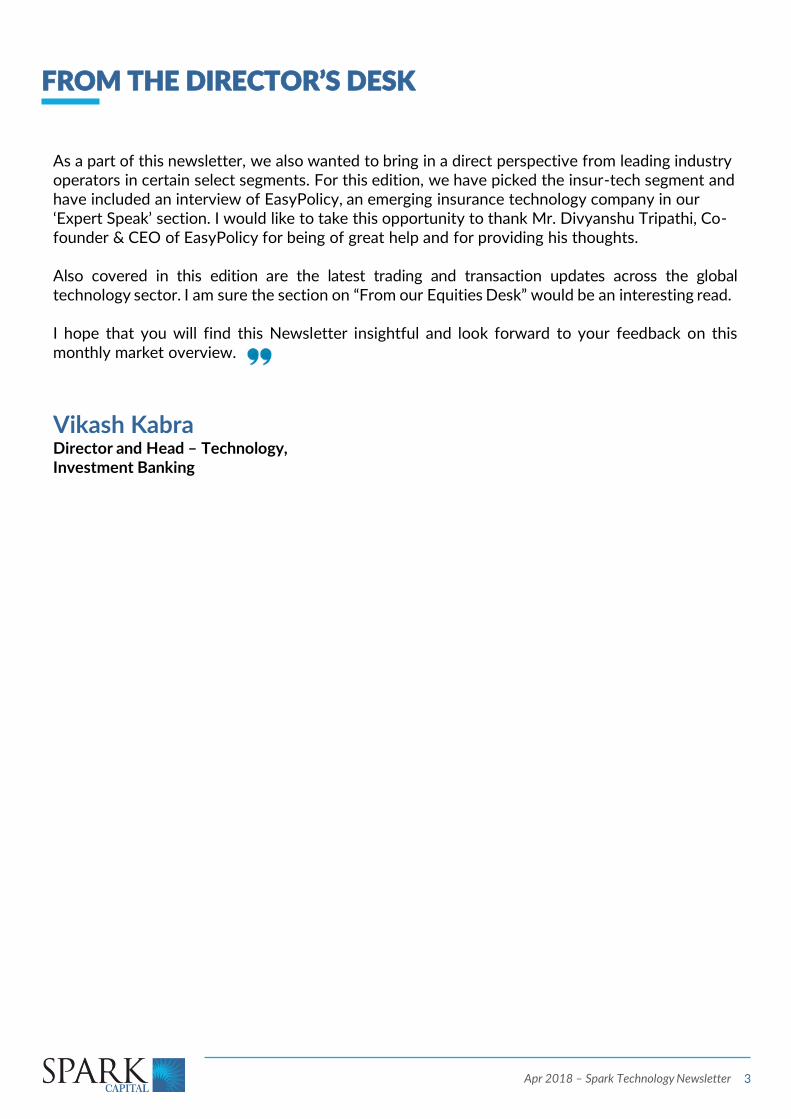
RECENT TECHNOLOGY
DEVELOPMENTS
08
NEWS
Recent activities and developments across the Indian
technology landscape
a
Market Statistics
b
Trading Comps
c
Global Transactions
OVERVIEW
09
TECHNOLOGY
MARKET
SNAPSHOT
Software | Tech Services | Internet | FinTech
17FROM OUR
EQUITIES DESK
Insights from Spark’s Institutional Equities DeskANALYSIS
06
INTERVIEW
IT’S EASY:
COMPARE.
SELECT.
GET INSURED.
Revolutionizing insurance
distribution
05INTO THE
REAL
WORLD
COVER STORY
5Apr 2018 – Spark Technology Newsletter
INTO THE REAL WORLD
Source: Public sources
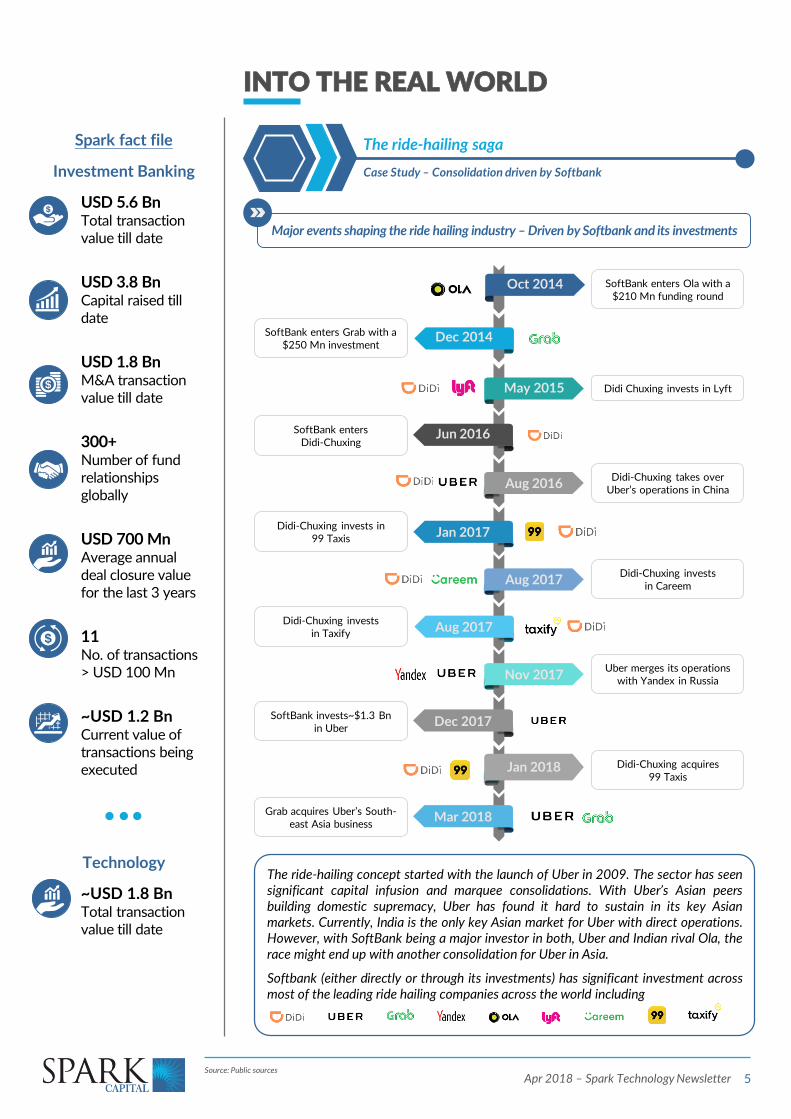
Major events shaping the ride hailing industry – Driven by Softbank and its investments
The ride-hailing saga
Case Study – Consolidation driven by Softbank
Spark fact file
Investment Banking
USD 5.6 BnTotal transaction value till date
USD 3.8 BnCapital raised till date
USD 1.8 Bn M&A transaction value till date
300+ Number of fund relationships globally
USD 700 Mn Average annual deal closure value for the last 3 years
11No. of transactions > USD 100 Mn
~USD 1.2 BnCurrent value of transactions being executed
Technology
~USD 1.8 BnTotal transaction value till date
SoftBank enters Ola with a $210 Mn funding round
SoftBank enters Grab with a $250 Mn investment
SoftBank enters Didi-Chuxing
Didi-Chuxing takes over Uber’s operations in China
Uber merges its operations with Yandex in Russia
SoftBank invests~$1.3 Bn in Uber
Grab acquires Uber’s South-east Asia business
The ride-hailing concept started with the launch of Uber in 2009. The sector has seensignificant capital infusion and marquee consolidations. With Uber’s Asian peersbuilding domestic supremacy, Uber has found it hard to sustain in its key Asianmarkets. Currently, India is the only key Asian market for Uber with direct operations.However, with SoftBank being a major investor in both, Uber and Indian rival Ola, therace might end up with another consolidation for Uber in Asia.
Softbank (either directly or through its investments) has significant investment acrossmost of the leading ride hailing companies across the world including
Didi Chuxing invests in Lyft
Didi-Chuxing invests in 99 Taxis
Didi-Chuxing invests in Careem
Didi-Chuxing invests in Taxify
Didi-Chuxing acquires 99 Taxis
Aug 2016
Jun 2016
May 2015
Dec 2014
Oct 2014
Jan 2017
Aug 2017
Dec 2017
Nov 2017
Aug 2017
Jan 2018
Mar 2018
6Apr 2018 – Spark Technology Newsletter
EXPERT SPEAK
1. Where is EasyPolicy today in itsjourney?
We are an online marketplace forinsurance plans in India. We provide aconsumer-oriented platform thataggregates insurance products frommore than 44+ companies and enablecomparison by price as well as othercriteria. We are currently into health,term, auto, child, investment andpension products. We process over INR70 Mn of premium monthly.
We are significantly differentiated in ourgo-to market strategy as compared tothe other players, we target tier II/IIIcities through a combination of directB2C as well as through our partnernetwork and through setting up our ownbranches across 5 zones in the country.The actual selling is done by us while thepartners handle transaction processing.Our direct B2C business is operationallyprofitable and we are investing indeveloping our partner network now.
2. How has EasyPolicy differentiated itselffrom other players?
The next phase of growth for insurancein this country will come from thesegment that is under-penetrated. Theurban marketplace is crowded and is afocus area for almost all industry players.Our target segment is Tier II/III cities,which we cater through a combinationof direct B2C and B2B2C channelsthrough own branches and transactionprocessing partner’s network.
IT’S EASY: COMPARE. SELECT. GET INSURED.
We are No.1 when it comes to customerservice. We have tie-ups with the topinsurance companies to help users withany query, be it comparisons, helpingusers find the best plan for his/herneeds, making changes to existing policyor even claims. We have a team ofprofessionals dedicated to helping ourusers in the event of a claim. So, if userswant to lodge a claim, we will guidethem through the documentation andhelp liaise with the insurance companyas well. The extensive use of technologyalso makes us different. Our users willsee all their documents on our portal andthe policy details get distributed throughour mobile app.
3. How have the recent regulatorychanges impacted the insurance webaggregators?
The Insurance Web Aggregatorregulation has provided clarity withrespect to remuneration and has alsoallowed for a wider basket of productsto be sold. The regulation allows all kindsof insurance products to be sold on theweb aggregators’ portals including unitlinked insurance plans. The ticket size ofthe policies that can be sold has beenincreased from INR 50,000 to INR 1.5lakh. It also allows remuneration onzero-commission policies (Online termplans for example) through rewards. Inthe non-life space such as healthinsurance, motor insurance and homeinsurance policies, the web aggregatorsare now entitled to renewal commissionsas well. The regulation will go a long wayin boosting the sector.
INSIGHTS FROM AN INDUSTRY EXPERT
We interviewed Divyanshu Tripathi,
Founder & CEO of EasyPolicy – an
emerging insurtech platform. He talks
about his journey, regulations
governing the sector, and the
company’s plans going forward. Divyanshu TripathiFounder & CEO
Full Service,Mid-Market I-Bank
Investment Banking(VC, PE, M&A, IPO, QIP, PIPE)
Institutional Equities
Fixed Income solutions
Investment Advisory
Knowledge Banking
Dedicated sector teams with deep domain expertise
Ability to bring new ideas to the market
– Manappuram (2007)
– iD Fresh Food (2014)
– AasaanJobs (2015)
– Unbxd (2016)
Relationship Banking
Over 24 clients for whom we have closed multiple transactions
Consummated~USD 1.5 Bn of transaction value in repeat business
Deep Distribution
Extensive reach to over 300 funds across
– Private Equity
– Hedge Funds
– Family Offices
– Sovereign Funds
– Corporates
7Apr 2018 – Spark Technology Newsletter
EXPERT SPEAK
4. How do you see the insurance marketevolve in the future?
While regulatory changes andadvancement in technology haveinfluenced the development of the sector,the Insurance penetration in India is stilllow, at ~3.5%, and there is immensepotential as the economy continues on itsgrowth trajectory. The speed of financialaccess and inclusion have picked up wellrecently, the insurance sector’s futuresuccess would depend on factorsincluding availability, awareness andtechnology adoption. Distribution is animportant factor to increase penetration.As more and more people adapt to adigital lifestyle, insurers are keen onoffering solutions through the digitalmedium and existing channels are beingaided with the help of technology.
5. How is technology playing a critical rolein the entire scheme of things? What isEasyPolicy doing on this aspect?
Technology is critical for creating andsupporting scale in this industry. Itenables reaching out to users andoffering insurance services in a costefficient and customized manner. Sinceinsurance is an annuity product, it isimportant to ensure user lock-in toincrease repeat business. Technology iscore to our operations, through ourproprietary technology, we can displayoptions within seconds from multipleinsurers, a process which used to takedays with traditional broking channel. Ourusers get a clear picture of underlyingterms, exclusions etc. We provide claimsadministration as well which ensures amore seamless experience for our users.The system sends renewal reminders andupdates seamlessly. Our app, available onGoogle Play and iOS, makes purchasinginsurance easier, it allows users to viewand renew claims on the go. The app alsoallows claimants to reach us at any time.
6. How do you see the digital channelimpacting the existing insurancedistribution channels?
In India, the existing physical distributionchannel continues to play an important
role in terms of increasing userawareness. With new user additionsbeing a big driver for growth, existingphysical channels will have a significantrole to play. While Indian consumers stillobtain advice from agents as animportant step in purchasing insurance,we have observed that online researchon insurance is increasing. This shift willpotentially be in line with what we haveseen in the international markets, suchas UK, wherein ~50% of users buyinsurance online. It makes sense forinsurance companies to shift from amore expensive agent assisted model toa more profitable online channel.
7. What are your plans going forward?
We plan to grow 4x over the next oneyear with the support of our technology,partner network and mass media spend.Our tech platform has been built forscale keeping in mind the future, anddoes not require significant investmentgoing forward. We might raise anadditional round of funding within thenext 1 year to amplify our growthtrajectory.
Select Technology Transactions
Exclusive Advisor
To
Rights Issue
USD 31 Mn
September 2017
Exclusive Advisor
To
51% Acquisition
of
~USD 24 Mn
November 2017
Exclusive Advisor
To
Majority Stake Acquisition
By
Undisclosed
December 2017
Exclusive Advisor
To
Private Equity Fund Raise
From
USD 10 Mn
August 2016
8Apr 2018 – Spark Technology Newsletter
LATEST NEWS AND ANNOUNCEMENTS
Monetary policy report
RBI in its recent Monetary Policy Report said allpayment system operators will have to ensure thatdata related to payments is stored only in India andfirms would have six months to comply with it.
Ensuring safety and security of payments data byadoption of the global standards and their continuousmonitoring and surveillance is essential to reduce therisks from data breaches while maintaining a healthypace of growth in digital payments.
FinTech
STORE PAYMENTS DATA IN INDIA: RBI
Increasing use cases ofblockchain tech
NITI Aayog is working to put the entire inventory ofdrugs made and consumed in the country onblockchain with an intent to crack down oncounterfeit and spurious drug. The governmentwants to complete a “proof of concept” (PoC)solution by the year-end and begin implementation in2019.
A NITI Aoyog official; said, “The move will help thegovernment and pharma companies to curb the risingproblem of fake drugs in the country.”
Blockchain
GOVT TARGETS BLOCKCHAIN TO BUST FAKE DRUGS
Source: News articles
INTERNET ECONOMY TO SURGE TO $500B BY 2022
India becoming tech-savvy
India was in the 155th position in the world in termsof mobile data consumption until last year. Today, thecountry is in the first position, ahead of US and Chinaput together. Internet mobile applications haveemerged as a key economic driver. The interneteconomy is expected to increase to USD 500 Bn by2022.
Internet
INDIA RANKS THIRD IN GLOBAL TECH INNOVATION
KPMG report
US ranked on the top, followed by China and India asthe leaders of tech innovation, while Shanghai, Tokyo,London, and New York are seen as leading tech hubsoutside Silicon Valley.
Thirteen percent of global technology industry leadersindicated India’s potential for tech breakthroughs.
Macro
Increase in the tax bill…
Global Tech
TECH GIANTS TO FACE 3% TAX ON REVENUE UNDER NEW EU PLAN
Large digital companies operating in the EuropeanUnion, such as Alphabet Inc. or Twitter Inc., could face a3% tax on their gross revenues based on where theirusers are located, according to a draft proposal by theEuropean Commission.
According to the draft, the levy would cover companiesthat have annual worldwide total revenue exceedingEUR 750 Mn (USD 920 Mn) and total taxable annualrevenue from offering digital services in the EU aboveEU 50 million
Select Technology Transactions
Exclusive Advisor
To
Private Equity Fund Raise
From
Undisclosed
March 2016
Exclusive Advisor
To
Private Equity Fund Raise
From
Undisclosed
December 2015
Joint Advisor
To
Majority Stake Acquisition
By
USD 270 Mn
November 2015
Exclusive Advisor
To
Private Equity Fund Raise
From
USD 346 Mn
November 2014
9Apr 2018 – Spark Technology Newsletter
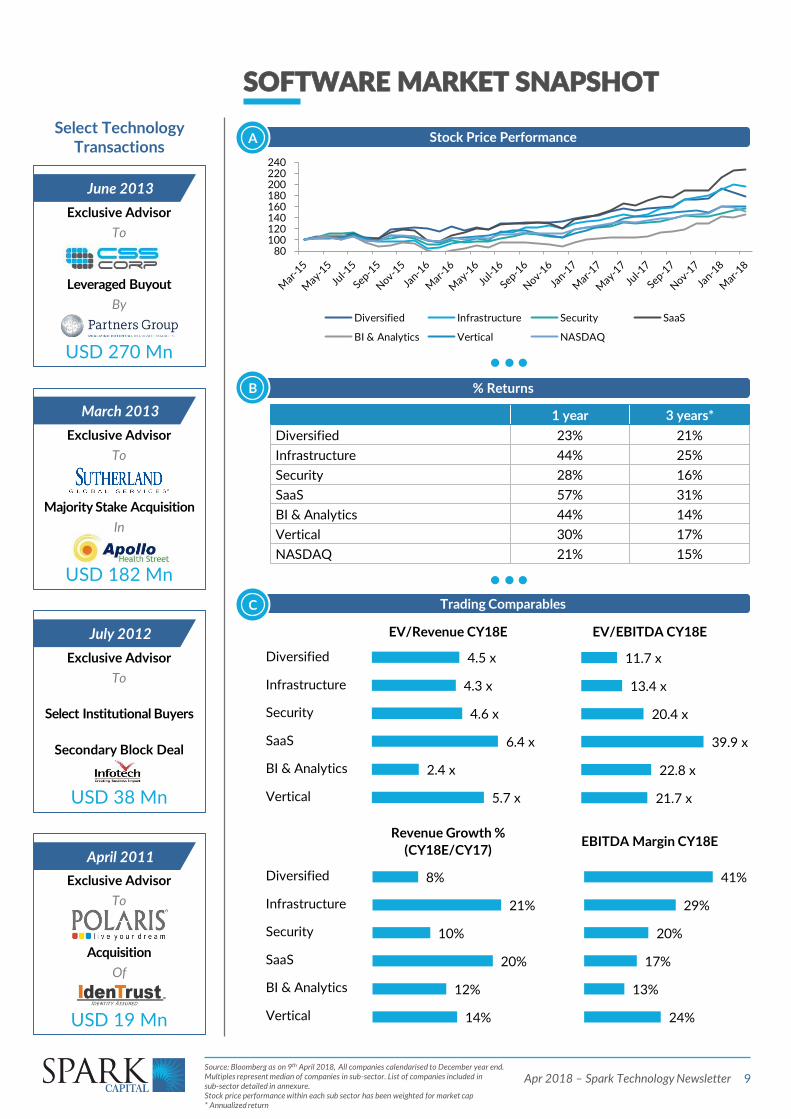
SOFTWARE MARKET SNAPSHOT
1 year 3 years*
Diversified 23% 21%
Infrastructure 44% 25%
Security 28% 16%
SaaS 57% 31%
BI & Analytics 44% 14%
Vertical 30% 17%
NASDAQ 21% 15%
EV/Revenue CY18E EV/EBITDA CY18E
Revenue Growth %
(CY18E/CY17)EBITDA Margin CY18E
Trading ComparablesC
Diversified
Infrastructure
Security
SaaS
BI & Analytics
Vertical
Diversified
Infrastructure
Security
SaaS
BI & Analytics
Vertical
% ReturnsB
Stock Price PerformanceA
Source: Bloomberg as on 9th April 2018, All companies calendarised to December year end. Multiples represent median of companies in sub-sector. List of companies included in sub-sector detailed in annexure. Stock price performance within each sub sector has been weighted for market cap * Annualized return
Select Technology Transactions
Exclusive Advisor
To
Leveraged Buyout
By
USD 270 Mn
June 2013
Exclusive Advisor
To
Majority Stake Acquisition
In
USD 182 Mn
March 2013
Exclusive Advisor
To
Select Institutional Buyers
Secondary Block Deal
USD 38 Mn
July 2012
Exclusive Advisor
To
Acquisition
Of
USD 19 Mn
April 2011
80 100 120 140 160 180 200 220 240
Diversified Infrastructure Security SaaS
BI & Analytics Vertical NASDAQ
5.7 x
2.4 x
6.4 x
4.6 x
4.3 x
4.5 x
21.7 x
22.8 x
39.9 x
20.4 x
13.4 x
11.7 x
24%
13%
17%
20%
29%
41%
14%
12%
20%
10%
21%
8%
10Apr 2018 – Spark Technology Newsletter
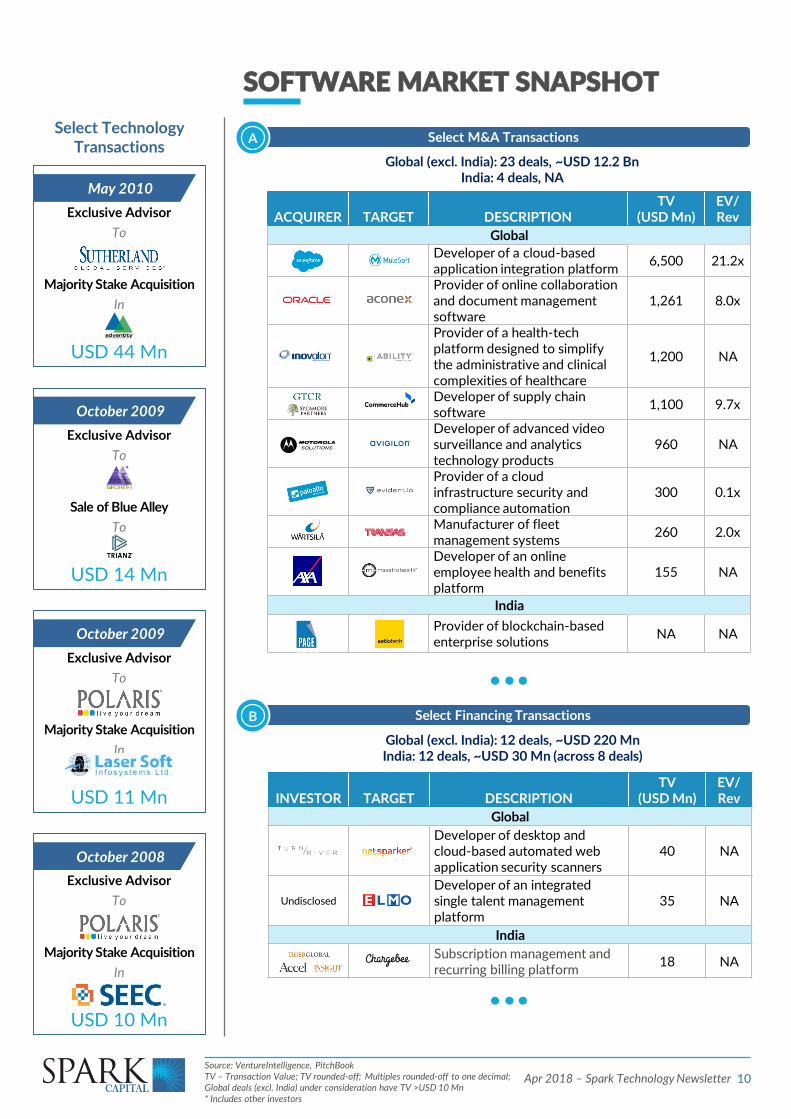
SOFTWARE MARKET SNAPSHOT
ACQUIRER TARGET DESCRIPTIONTV
(USD Mn)EV/Rev
Global
Developer of a cloud-based application integration platform
6,500 21.2x
Provider of online collaboration and document management software
1,261 8.0x
Provider of a health-tech platform designed to simplify the administrative and clinical complexities of healthcare
1,200 NA
Developer of supply chain software
1,100 9.7x
Developer of advanced video surveillance and analytics technology products
960 NA
Provider of a cloud infrastructure security and compliance automation
300 0.1x
Manufacturer of fleet management systems
260 2.0x
Developer of an online employee health and benefits platform
155 NA
India
Provider of blockchain-based enterprise solutions
NA NA
Global (excl. India): 23 deals, ~USD 12.2 BnIndia: 4 deals, NA
Select Financing TransactionsB
INVESTOR TARGET DESCRIPTIONTV
(USD Mn)EV/Rev
Global
Developer of desktop and cloud-based automated web application security scanners
40 NA
Undisclosed
Developer of an integrated single talent management platform
35 NA
India
Subscription management and recurring billing platform
18 NA
Global (excl. India): 12 deals, ~USD 220 MnIndia: 12 deals, ~USD 30 Mn (across 8 deals)
Select M&A TransactionsA
Source: VentureIntelligence, PitchBookTV – Transaction Value; TV rounded-off; Multiples rounded-off to one decimal;Global deals (excl. India) under consideration have TV >USD 10 Mn* Includes other investors
Select Technology Transactions
Exclusive Advisor
To
Majority Stake Acquisition
In
USD 44 Mn
May 2010
Exclusive Advisor
To
Sale of Blue Alley
To
USD 14 Mn
October 2009
Exclusive Advisor
To
Majority Stake Acquisition
In
USD 11 Mn
October 2009
Exclusive Advisor
To
Majority Stake Acquisition
In
USD 10 Mn
October 2008
11Apr 2018 – Spark Technology Newsletter
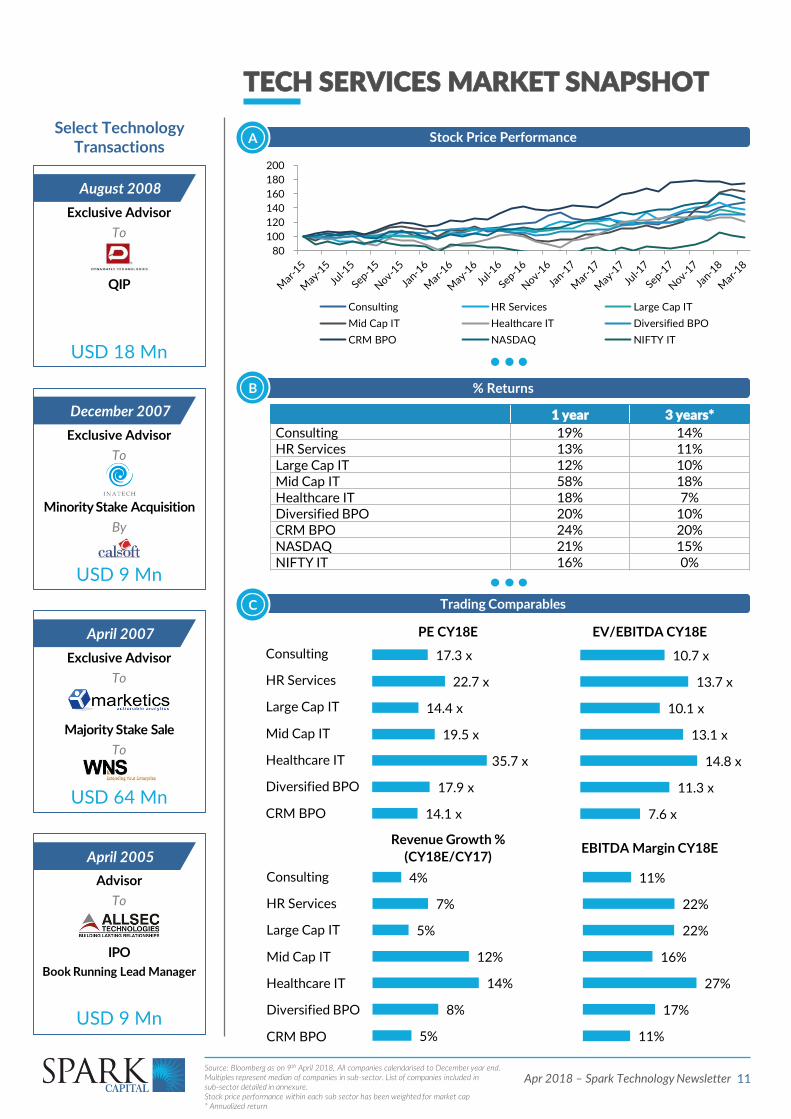
TECH SERVICES MARKET SNAPSHOT
1 year 3 years*
Consulting 19% 14%HR Services 13% 11%Large Cap IT 12% 10%Mid Cap IT 58% 18%Healthcare IT 18% 7%Diversified BPO 20% 10%CRM BPO 24% 20%NASDAQ 21% 15%NIFTY IT 16% 0%
PE CY18E EV/EBITDA CY18E
Revenue Growth %
(CY18E/CY17)EBITDA Margin CY18E
Trading ComparablesC
Consulting
HR Services
Large Cap IT
Mid Cap IT
Healthcare IT
Diversified BPO
CRM BPO
Consulting
HR Services
Large Cap IT
Mid Cap IT
Healthcare IT
Diversified BPO
CRM BPO
% ReturnsB
Stock Price PerformanceASelect Technology
Transactions
Exclusive Advisor
To
QIP
USD 18 Mn
August 2008
Exclusive Advisor
To
Minority Stake Acquisition
By
USD 9 Mn
December 2007
Exclusive Advisor
To
Majority Stake Sale
To
USD 64 Mn
April 2007
Advisor
To
IPO
Book Running Lead Manager
USD 9 Mn
April 2005
80
100
120
140
160
180
200
Consulting HR Services Large Cap IT
Mid Cap IT Healthcare IT Diversified BPO
CRM BPO NASDAQ NIFTY IT
14.1 x
17.9 x
35.7 x
19.5 x
14.4 x
22.7 x
17.3 x
7.6 x
11.3 x
14.8 x
13.1 x
10.1 x
13.7 x
10.7 x
11%
17%
27%
16%
22%
22%
11%
5%
8%
14%
12%
5%
7%
4%
Source: Bloomberg as on 9th April 2018, All companies calendarised to December year end. Multiples represent median of companies in sub-sector. List of companies included in sub-sector detailed in annexure. Stock price performance within each sub sector has been weighted for market cap * Annualized return
12Apr 2018 – Spark Technology Newsletter
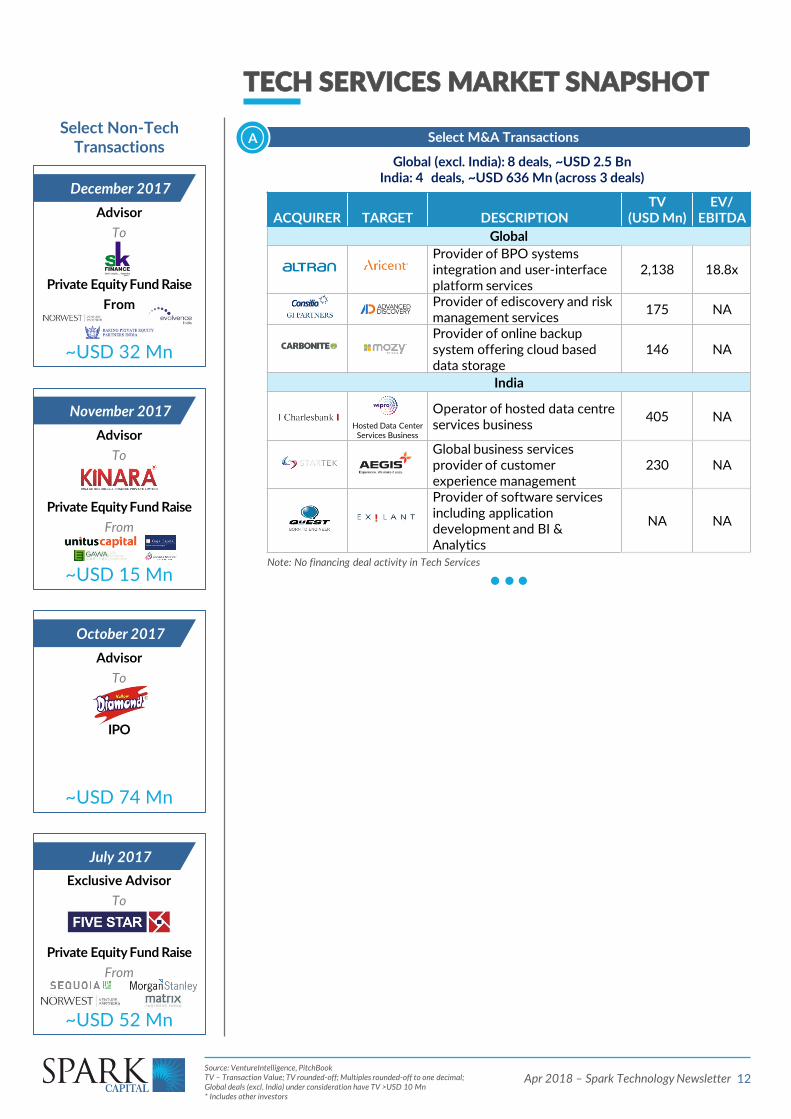
TECH SERVICES MARKET SNAPSHOT
Global (excl. India): 8 deals, ~USD 2.5 BnIndia: 4 deals, ~USD 636 Mn (across 3 deals)
Note: No financing deal activity in Tech Services
Select M&A TransactionsA
Source: VentureIntelligence, PitchBookTV – Transaction Value; TV rounded-off; Multiples rounded-off to one decimal;Global deals (excl. India) under consideration have TV >USD 10 Mn* Includes other investors
ACQUIRER TARGET DESCRIPTIONTV
(USD Mn)EV/
EBITDA
Global
Provider of BPO systems integration and user-interface platform services
2,138 18.8x
Provider of ediscovery and risk management services
175 NA
Provider of online backup system offering cloud based data storage
146 NA
India
Hosted Data Center Services Business
Operator of hosted data centre services business
405 NA
Global business services provider of customer experience management
230 NA
Provider of software services including application development and BI & Analytics
NA NA
Select Non-Tech Transactions
Advisor
To
Private Equity Fund Raise
From
~USD 15 Mn
November 2017
Advisor
To
IPO
~USD 74 Mn
October 2017
Exclusive Advisor
To
Private Equity Fund Raise
From
~USD 52 Mn
July 2017
Advisor
To
Private Equity Fund Raise
From
~USD 32 Mn
December 2017
13Apr 2018 – Spark Technology Newsletter
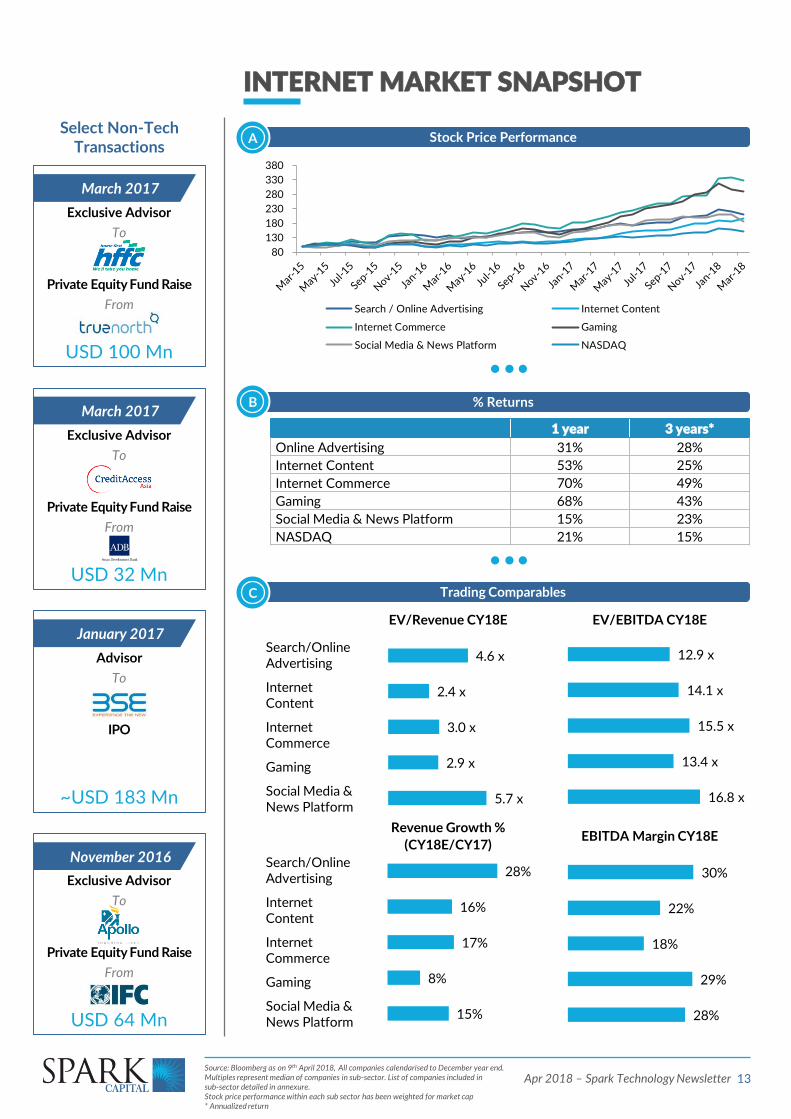
INTERNET MARKET SNAPSHOT
1 year 3 years*
Online Advertising 31% 28%
Internet Content 53% 25%
Internet Commerce 70% 49%
Gaming 68% 43%
Social Media & News Platform 15% 23%
NASDAQ 21% 15%
Revenue Growth %
(CY18E/CY17)EBITDA Margin CY18E
Trading ComparablesC
Search/Online Advertising
Internet Content
Internet Commerce
Gaming
Social Media & News Platform
% ReturnsB
Stock Price PerformanceA
EV/Revenue CY18E EV/EBITDA CY18E
Search/Online Advertising
Internet Content
Internet Commerce
Gaming
Social Media & News Platform
Select Non-Tech Transactions
Exclusive Advisor
To
Private Equity Fund Raise
From
USD 100 Mn
March 2017
Exclusive Advisor
To
Private Equity Fund Raise
From
USD 32 Mn
March 2017
Advisor
To
IPO
~USD 183 Mn
January 2017
Exclusive Advisor
To
Private Equity Fund Raise
From
USD 64 Mn
November 2016
80
130
180
230
280
330
380
Search / Online Advertising Internet Content
Internet Commerce Gaming
Social Media & News Platform NASDAQ
5.7 x
2.9 x
3.0 x
2.4 x
4.6 x
16.8 x
13.4 x
15.5 x
14.1 x
12.9 x
28%
29%
18%
22%
30%
15%
8%
17%
16%
28%
Source: Bloomberg as on 9th April 2018, All companies calendarised to December year end. Multiples represent median of companies in sub-sector. List of companies included in sub-sector detailed in annexure. Stock price performance within each sub sector has been weighted for market cap * Annualized return
14Apr 2018 – Spark Technology Newsletter
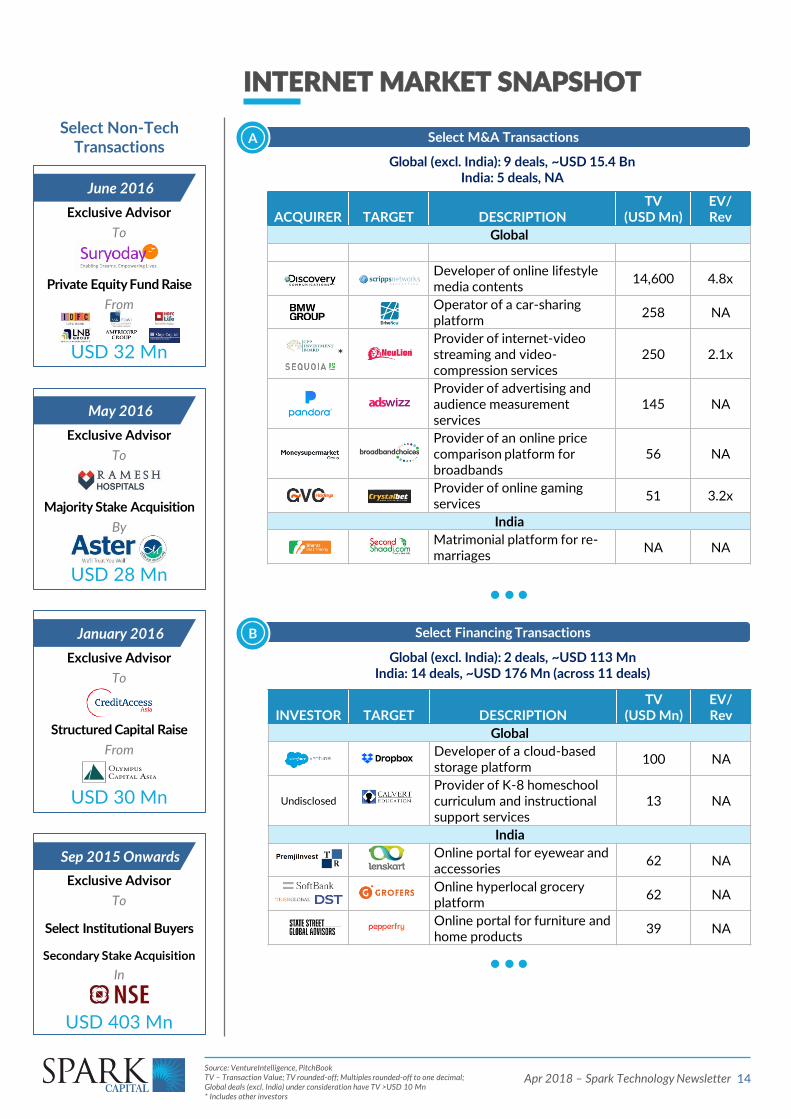
INTERNET MARKET SNAPSHOT
Select Financing TransactionsB
Global (excl. India): 2 deals, ~USD 113 MnIndia: 14 deals, ~USD 176 Mn (across 11 deals)
ACQUIRER TARGET DESCRIPTIONTV
(USD Mn)EV/Rev
Global
Developer of online lifestyle media contents
14,600 4.8x
Operator of a car-sharing platform
258 NA
*Provider of internet-video streaming and video-compression services
250 2.1x
Provider of advertising and audience measurement services
145 NA
Provider of an online price comparison platform for broadbands
56 NA
Provider of online gaming services
51 3.2x
India
Matrimonial platform for re-marriages
NA NA
Global (excl. India): 9 deals, ~USD 15.4 BnIndia: 5 deals, NA
Select M&A TransactionsA
Source: VentureIntelligence, PitchBookTV – Transaction Value; TV rounded-off; Multiples rounded-off to one decimal;Global deals (excl. India) under consideration have TV >USD 10 Mn* Includes other investors
INVESTOR TARGET DESCRIPTIONTV
(USD Mn)EV/Rev
Global
Developer of a cloud-based storage platform
100 NA
Undisclosed
Provider of K-8 homeschool curriculum and instructional support services
13 NA
India
Online portal for eyewear and accessories
62 NA
Online hyperlocal grocery platform
62 NA
Online portal for furniture and home products
39 NA
Select Non-Tech Transactions
Exclusive Advisor
To
Private Equity Fund Raise
From
USD 32 Mn
June 2016
Exclusive Advisor
To
Majority Stake Acquisition
By
USD 28 Mn
May 2016
Exclusive Advisor
To
Structured Capital Raise
From
USD 30 Mn
January 2016
Exclusive Advisor
To
Select Institutional Buyers
Secondary Stake Acquisition
In
USD 403 Mn
Sep 2015 Onwards
15Apr 2018 – Spark Technology Newsletter
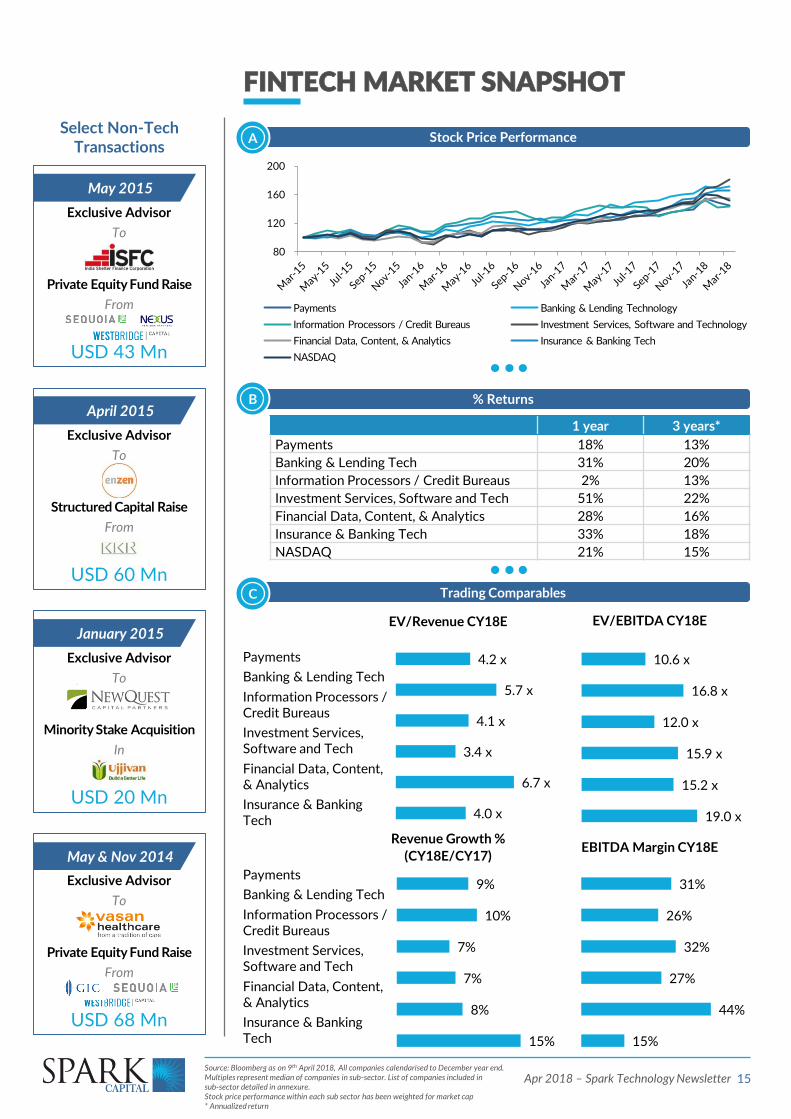
FINTECH MARKET SNAPSHOT
1 year 3 years*
Payments 18% 13%
Banking & Lending Tech 31% 20%
Information Processors / Credit Bureaus 2% 13%
Investment Services, Software and Tech 51% 22%
Financial Data, Content, & Analytics 28% 16%
Insurance & Banking Tech 33% 18%
NASDAQ 21% 15%
EV/Revenue CY18E EV/EBITDA CY18E
Revenue Growth %
(CY18E/CY17)EBITDA Margin CY18E
Trading ComparablesC
Payments
Banking & Lending Tech
Information Processors / Credit Bureaus
Investment Services, Software and Tech
Financial Data, Content, & Analytics
Insurance & Banking Tech
% ReturnsB
Stock Price PerformanceA
Payments
Banking & Lending Tech
Information Processors / Credit Bureaus
Investment Services, Software and Tech
Financial Data, Content, & Analytics
Insurance & Banking Tech
Select Non-Tech Transactions
Exclusive Advisor
To
Private Equity Fund Raise
From
USD 43 Mn
May 2015
Exclusive Advisor
To
Structured Capital Raise
From
USD 60 Mn
April 2015
Exclusive Advisor
To
Minority Stake Acquisition
In
USD 20 Mn
January 2015
Exclusive Advisor
To
Private Equity Fund Raise
From
USD 68 Mn
May & Nov 2014
80
120
160
200
Payments Banking & Lending Technology
Information Processors / Credit Bureaus Investment Services, Software and Technology
Financial Data, Content, & Analytics Insurance & Banking Tech
NASDAQ
Source: Bloomberg as on 9th April 2018, All companies calendarised to December year end. Multiples represent median of companies in sub-sector. List of companies included in sub-sector detailed in annexure. Stock price performance within each sub sector has been weighted for market cap * Annualized return
4.0 x
6.7 x
3.4 x
4.1 x
5.7 x
4.2 x
19.0 x
15.2 x
15.9 x
12.0 x
16.8 x
10.6 x
15%
44%
27%
32%
26%
31%
15%
8%
7%
7%
10%
9%
16Apr 2018 – Spark Technology Newsletter
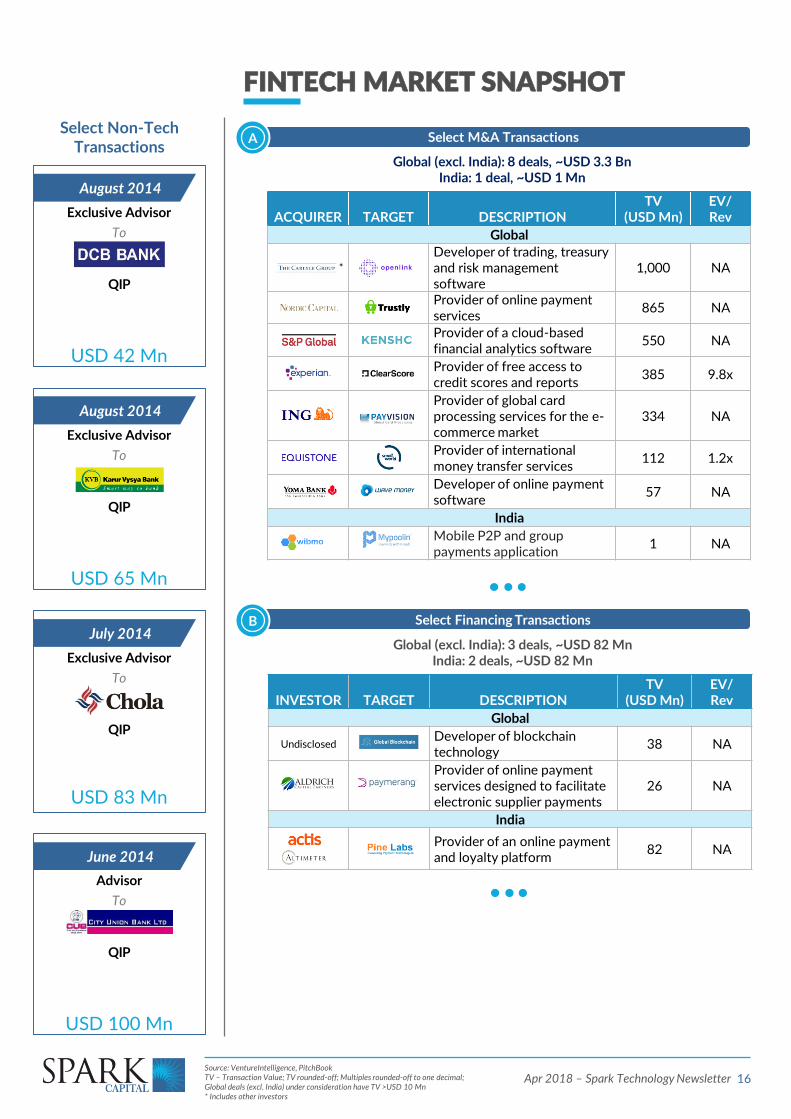
FINTECH MARKET SNAPSHOT
Select Financing TransactionsB
INVESTOR TARGET DESCRIPTIONTV
(USD Mn)EV/Rev
Global
UndisclosedDeveloper of blockchain technology
38 NA
Provider of online payment services designed to facilitate electronic supplier payments
26 NA
India
Provider of an online payment and loyalty platform
82 NA
Global (excl. India): 3 deals, ~USD 82 MnIndia: 2 deals, ~USD 82 Mn
Global (excl. India): 8 deals, ~USD 3.3 BnIndia: 1 deal, ~USD 1 Mn
Select M&A TransactionsA
Source: VentureIntelligence, PitchBookTV – Transaction Value; TV rounded-off; Multiples rounded-off to one decimal;Global deals (excl. India) under consideration have TV >USD 10 Mn* Includes other investors
ACQUIRER TARGET DESCRIPTIONTV
(USD Mn)EV/Rev
Global
*
Developer of trading, treasury and risk management software
1,000 NA
Provider of online payment services
865 NA
Provider of a cloud-based financial analytics software
550 NA
Provider of free access to credit scores and reports
385 9.8x
Provider of global card processing services for the e-commerce market
334 NA
Provider of international money transfer services
112 1.2x
Developer of online payment software
57 NA
India
Mobile P2P and group payments application
1 NA
Select Non-Tech Transactions
Exclusive Advisor
To
QIP
USD 42 Mn
August 2014
Exclusive Advisor
To
QIP
USD 65 Mn
August 2014
Exclusive Advisor
To
QIP
USD 83 Mn
July 2014
Advisor
To
QIP
USD 100 Mn
June 2014
17Apr 2018 – Spark Technology Newsletter
FROM OUR EQUITIES DESK
Key snippets from some interesting notes by Spark’s Equities Team Institutional Equities
Highlights
236Stocks under coverage
USD 1.2 TnTotal market cap of stocks under coverage
INR 260 Bn Total cash market volume in H1FY18
350+Number of fund relationships globally
“Go-to” broker for stocks in the mid-market space
Technology
24Stocks under coverage
~USD 190 BnTotal market cap of Stocks under coverage
5th position in 2017 All India research
team
IT Industry Update – Digitally Neutral
Source: SPARK Research
Our conversations with mid-level management indicate that the outlook for FY19 isdefinitely better than FY18. There is a clear “Feel Good” factor amongst employees,but at the same time, participants do not expect the upper end of the NASSCOMguidance to be beaten. The BFSI vertical is unlikely to report any major growth inFY19 leaving Retail, CPG, Manufacturing and Telecom verticals to drive growth,wherein, sustainability can be questioned. On top of this, consensus estimates arealready factoring a revival in growth and valuation multiples for most companies areat their life time high. The spike in large deal TCV that we witnessed in CY17, cameafter a gap of 3 years of subdued spending and could revert back to its mean, and webelieve this spike in spending is cyclical in nature and not structural. This undesirablescenario could lead to a repeat of FY11 and FY12, wherein, the NIFTY IT Indexoutperformed NIFTY Index by 9% in FY11, but performed inline in FY12, asconsensus revenue estimates for FY12 were not met.
IT Sector could be market performer on relative basis led by no change/downsiderisk to FY20 estimates and supported by currency tailwinds
Record deals awarded in CY17 was a result of subdued spending in the last twoyears: Total deals awarded to vendors during CY17 reached a record high of$116bn, up 52% yoy. This was also a result of subdued spending from CY14 toCY16, wherein, deals awarded fell from $102bn in CY14 to $76bn in CY16 (14%compounded decline over CY14-16.
4.4% and 8.5% average increase in FY19 and FY20 consensus EPS estimates: Theaverage increase in FY19 consensus EPS estimates has been 4.4% and the samefigure for FY20 stands at 8.5%, indicating that consensus has built revival ingrowth for FY19 as well as for FY20. Most of the stocks are now trading at oneyear forward P/E of 15x or above, their life time high multiples, with the exceptionof Cyient, KPIT and Firstsource.
INR depreciation needed to help offset the impact of investments: In line withexpectations, the margins of most IT companies expanded during the period of lowgrowth led by better cost control. However, with resumption in growth, therewould be a need for investments, similar to what is witnessed in TCS’ deal withNeilson, which is purely an outcome based deal with profit share and wouldrequire TCS to make investments. The deals won by players other than TCS couldalso call for investments which may have some impact on margins. The changes insourcing requirement by clients, would also require investment in employees,which according to our conversations with few participants, were held back inperiod of low growth. The INR depreciation again could help companies to makethese investments without compromising on margins.
Digital growth is strong but actual digital practice is led by product companies andrequires investment in R&D: Similar to last year’s conversation, most participantsopined that Digital revenues reported by their companies are existing revenuesbeing reclassified as Digital. We would agree with them, as, in our view, Digital is ledby product companies with solutions to implement. Additionally, as per industrydata, Indian vendors like TCS, Infosys, HCLT, TECHM, MindTree and Hexaware stillfeature in traditional sourcing leaders while AWS, Google, Microsoft, Oracle,Salesforce, Adobe, Ultimate Software, Cyxtera and Mulesoft lead the As-A-Servicemarket. Given the blurring lines between solutions and services companies, theIndian IT vendors need to make investments in R&D to come up with solutions inorder to compete with startups or established digital vendors.
18Apr 2018 – Spark Technology Newsletter
ANNEXURE
Diversified
Alphabet Inc
Microsoft Corp
Oracle Corp
IBM
SAP SE
Infrastructure
VMware Inc
Red Hat Inc
ServiceNow Inc
CA Inc
Citrix Systems Inc
F5 Networks Inc
Splunk Inc
Atlassian Corp PLC
Micro Focus
LogMeIn Inc
NetScout Systems Inc
Software AG
Nutanix Inc
CommVault Systems Inc
Pure Storage Inc
New Relic Inc
Progress Software Corp
A10 Networks Inc
Security
Symantec Corp
Check Point Software
Palo Alto Networks Inc
Splunk Inc
Fortinet Inc
Trend Micro Inc/Japan
Proofpoint Inc
FireEye Inc
CyberArk Software Ltd
Imperva Inc
Qualys Inc
Barracuda Networks Inc
Mimecast Ltd
SecureWorks Corp
Rapid7 Inc
F-Secure OYJ
VASCO Data Security
MobileIron Inc
Zix Corp
Absolute Software Corp
Guidance Software Inc
Quick Heal Technologies Ltd
SaaS
Salesforce.com Inc
Workday Inc
ServiceNow Inc
Veeva Systems Inc
Ultimate Software Group
Shopify Inc
LogMeIn Inc
Aspen Technology Inc
j2 Global Inc
Blackbaud Inc
Paycom Software Inc
RealPage Inc
Zendesk Inc
Cornerstone OnDemand Inc
HubSpot Inc
Box Inc
RingCentral Inc
New Relic Inc
Paylocity Holding Corp
2U Inc
Coupa Software Inc
Qualys Inc
Callidus Software Inc
Mimecast Ltd
SPS Commerce Inc
Five9 Inc
Benefitfocus Inc
Instructure Inc
Workiva Inc
Carbonite Inc
Apptio Inc
LivePerson Inc
Castlight Health Inc
Bazaarvoice Inc
Brightcove Inc
ChannelAdvisor Corp
Amber Road Inc
Marin Software Inc
BI & Analytics
Splunk Inc
Teradata Corp
Fair Isaac Corp
Tableau Software Inc
Verint Systems Inc
MicroStrategy Inc
Hortonworks Inc
Gridsum Holding Inc
Attunity Ltd
Datawatch Corp
Vertical
Cerner Corp
Constellation Software
SS&C Technologies
Veeva Systems Inc
athenahealth Inc
Guidewire Software Inc
Blackbaud Inc
CoreLogic Inc
Ellie Mae Inc
Medidata Solutions Inc
RealPage Inc
Allscripts Healthcare Solutions
Inovalon Holdings Inc
Appfolio Inc
HealthStream Inc
Instructure Inc
Itron Networked Solutions Inc
Castlight Health Inc
Software Tech Services
Consulting
FTI Consulting Inc
Exponent Inc
Navigant Consulting Inc
Huron Consulting Group Inc
ICF International Inc
CBIZ Inc
Hackett Group Inc/The
Resources Connection Inc
GP Strategies Corp
CRA International Inc
Franklin Covey Co
HR Services
Automatic Data Processing Inc
Paychex Inc
TriNet Group Inc
Insperity Inc
Barrett Business Services Inc
Large Cap IT
IBM
Accenture PLC
Tata Consultancy Services Ltd
Cognizant Technology Solutions
Infosys Ltd
HCL Technologies Ltd
Wipro Ltd
Capgemini SE
CGI Group Inc
Nippon Telegraph & Telephone
Atos SE
Nomura Holdings Inc
Tech Mahindra Ltd
Mid Cap IT
EPAM Systems Inc
Luxoft Holding Inc
Mphasis Ltd
Syntel Inc
Globant SA
Mindtree Ltd
Virtusa Corp
Hexaware Technologies Ltd
Persistent Systems Ltd
Perficient Inc
Cyient Ltd
Larsen & Toubro Infotech Ltd
L&T Technology Services Ltd
KPIT Technologies Ltd
Rolta India Ltd
HCIT
IQVIA Holdings Inc
athenahealth Inc
Cerner Corp
Medidata Solutions Inc
Veeva Systems Inc
Inovalon Holdings Inc
Diversified BPO
Genpact Ltd
ExlService Holdings Inc
Capita PLC
Conduent Inc
WNS Holdings Ltd
CRM BPO
Teleperformance
SYNNEX Corp
Convergys Corp
TTEC Holdings Inc
Sykes Enterprises Inc
Transcosmos Inc
Relia Inc
Atento SA
Hinduja Global Solutions Ltd
Firstsource Solutions Ltd
LIST OF COMPANIES
19Apr 2018 – Spark Technology Newsletter
ANNEXURE
Internet FinTech
LIST OF COMPANIES
Search / Online Advertising
Alphabet Inc
Microsoft Corp
Yandex NV
Criteo SA
Trade Desk Inc/The
Rubicon Project Inc/The
Rhythmone PLC
QuinStreet Inc
YuMe Inc
Marchex Inc
Telaria Inc
Marin Software Inc
Internet Content
Zillow Group Inc
IAC/InterActiveCorp
TEGNA Inc
GoDaddy Inc
Shutterfly Inc
comScore Inc
Web.com Group Inc
Renren Inc
XO Group Inc
Care.com Inc
TechTarget Inc
DR Horton Inc
eHealth Inc
Internet Commerce
Amazon.com Inc
Alibaba Group Holding Ltd
Booking Holdings Inc
Netflix Inc
eBay Inc
Expedia Inc
Liberty Interactive Corp QVC Group
Copart Inc
GrubHub Inc
Trivago NV
Cimpress NV
Stamps.com Inc
Shutterstock Inc
Etsy Inc
Quotient Technology Inc
1-800-Flowers.com Inc
Overstock.com Inc
ANGI Homeservices Inc
Travelzoo
CafePress Inc
Gaming
Tencent Holdings Ltd
NetEase Inc
Activision Blizzard Inc
Electronic Arts Inc
NAVER Corp
NCSoft Corp
Ubisoft Entertainment SA
DeNA Co Ltd
Zynga Inc
GungHo Online Entertainment Inc
Changyou.com Ltd
Gree Inc
Glu Mobile Inc
Social Media & New Platform
Facebook Inc
Snap Inc
Twitter Inc
LINE Corp
Pandora Media Inc
Yelp Inc
Payments
Visa Inc
Mastercard Inc
American Express Co
PayPal Holdings Inc
Discover Financial Services
Cielo SA
First Data Corp
Worldpay Inc
Global Payments Inc
Total System Services Inc
Worldpay Group Ltd
Wirecard AG
Square Inc
GMO Payment Gateway Inc
EVERTEC Inc
SafeCharge
Western Union Co/The
Euronet Worldwide Inc
FleetCor Technologies Inc
Alliance Data Systems Corp
Edenred
WEX Inc
Blackhawk Network
Green Dot Corp
Net 1 UEPS Technologies Inc
Cardtronics PLC
Everi Holdings Inc
NCR Corp
Ingenico Group SA
VeriFone Systems Inc
PAR Technology Corp
Banking and Lending Technology
Intuit Inc
Fidelity National IS
Fiserv Inc
Jack Henry & Associates Inc
Temenos Group AG
Ellie Mae Inc
ACI Worldwide Inc
LendingClub Corp
Q2 Holdings Inc
Bottomline Technologies
On Deck Capital Inc
Information Processors / Credit Bureaus
Experian PLC
Equifax Inc
Fair Isaac Corp
Acxiom Corp
Investment Services, Software and Technology
SEI Investments Co
Broadridge Financial Solutions Inc
SS&C Technologies Holdings Inc
DST Systems Inc
Financial Engines Inc
Envestnet Inc
Financial Data, Content, & Analytics
S&P Global Inc
Thomson Reuters Corp
Moody's Corp
IHS Markit Ltd
Verisk Analytics Inc
MSCI Inc
FactSet Research Systems Inc
Dun & Bradstreet Corp/The
Morningstar Inc
Insurance/Banking Technology
Verisk Analytics Inc
Guidewire Software Inc
Ebix Inc
Crawford & Co
Intellect Design Arena Ltd
Symbility Solutions Inc
20Apr 2018 – Spark Technology Newsletter
Information provided in this document with respect to the industry have been compiled from publicly availablesources, including official publications and research reports, and is given as general information and has not beenindependently verified by Spark Capital Advisors (India) Pvt. Ltd. (“Spark Capital”). Spark Capital has not carried outany independent verification of any information contained herein (including statements of opinion and expectation).Accordingly, Recipients should not place undue reliance on such information. The delivery of this document does notconstitute a representation that the information given in this document is correct whether at the date hereof or anytime subsequent to the date hereof. Spark Capital makes no representation or warranty with respect to the accuracyor completeness of any information or idea contained in this document, nor does Spark Capital undertake anyobligation to update this document.
This document does not purport to contain all the information that the Recipient may require. This document isbeing provided to give a general overview on the industry. Please note that all forward looking statements containedin this document have been sourced from multiple databases. No representations are being made about thecorrectness or achievability of these statements or their underlying assumptions.
This document has been prepared solely for the purpose of providing information related to the Technology sectorand is not to be reproduced or used for any other purpose.
Neither Spark Capital nor the Promoters nor any of their respective affiliates, directors, officers, employees,shareholders, agents, representatives and advisors of Spark Capital shall have any liability for any loss or damage(direct or indirect) suffered by Recipients on account of their reliance on any representations (express or implied)contained in, or any omissions from this document or any information transmitted orally, in writing, electronically orin any other form to the Recipients.
All enquiries relating to this document should be directed to Spark Capital personnel mentioned in this document.
DISCLAIMER
BENGALURUUnit Nos. 503 & 504, 5th Floor, Prestige Towers,No. 99/100, Residency Road,Bengaluru – 560 025
CHENNAINo.2 ‘Reflections’, Leith Castle Centre Street,Santhome High Road,Chennai – 600 028
MUMBAIUnit No. 1116-C, 11th Floor, ONE BKC,Bandra Kurla Complex,Mumbai – 400 051
Vikash Kabra
Director and Head – Technology, IB
Vikram Sivaraman
Vice President – Technology, IB
Aravind Ganesan
Assistant Vice President – Technology, IB
TECHNOLOGY TEAM


![Apache Spark Guide - Clouderadrwxr-x--x - spark spark 0 2018-03-09 15:18 /user/spark drwxr-xr-x - hdfs supergroup 0 2018-03-09 15:18 /user/yarn [testuser@myhost root]# su impala](https://img.pdfslide.us/doc/110x75/6148f3b69241b00fbd673ed3/apache-spark-guide-cloudera-drwxr-x-x-spark-spark-0-2018-03-09-1518-userspark.jpg)