Embed Size (px)
Citation preview
INVESTING IN WATER AND SANITATION: INCREASING ACCESS, REDUCING INEQUALITIESGLAAS 2014 findings — Highlights for the South-East Asia Region

WHO/FWC/WSH/15.09
© World Health Organization 2015
All rights reserved. Publications of the World Health Organization are available on the WHO website (www.who.int) or can be purchased from WHO Press, World Health Organization, 20 Avenue Appia, 1211 Geneva 27, Switzerland (tel.: +41 22 791 3264; fax: +41 22 791 4857; e-mail: [email protected]).
Requests for permission to reproduce or translate WHO publications –whether for sale or for non-commercial distribution– should be addressed to WHO Press through the WHO website (www.who.int/about/licensing/copyright_form/en/index.html).
The designations employed and the presentation of the material in this publication do not imply the expression of any opinion whatsoever on the part of the World Health Organization concerning the legal status of any country, territory, city or area or of its authorities, or concerning the delimitation of its frontiers or boundaries. Dotted and dashed lines on maps represent approximate border lines for which there may not yet be full agreement.
The mention of specific companies or of certain manufacturers’ products does not imply that they are endorsed or recommended by the World Health Organization in preference to others of a similar nature that are not mentioned. Errors and omissions excepted, the names of proprietary products are distinguished by initial capital letters.
All reasonable precautions have been taken by the World Health Organization to verify the information contained in this publication. However, the published material is being distributed without warranty of any kind, either expressed or implied. The responsibility for the interpretation and use of the material lies with the reader. In no event shall the World Health Organization be liable for damages arising from its use.
Design and layout by L’IV Com Sàrl, Villars-sous-Yens, Switzerland.
GLAAS visual identifier design by Ledgard Jepson Ltd, Barnsley, South Yorkshire, England.
Printed by the WHO Document Production Services, Geneva, Switzerland.

1
GLA
AS 2
014
FIN
DIN
GS
– H
IGH
LIG
HTS
FO
R T
HE
SOU
TH-E
AST
ASIA
REG
ION
UN-Water and WHO gratefully acknowledge the financial support provided by the Department for International Development, United Kingdom; the Swiss Agency for Development and Cooperation; the Directorate-General for International Cooperation, the Netherlands; and the Government of Kuwait.
UN-Water and WHO would like to extend their gratitude to all those individuals and organizations that contributed to the development of the GLAAS 2014 results and report – especially those individuals who coordinated efforts and submitted information from 94 countries and 23 external support and partner agencies, acknowledged in Annex F of the GLAAS 2014 report (http://www.who.int/water_sanitation_health/glaas/2014/en/).
The preparation of this special report for the South-East Asia Region involved contributions from the GLAAS team at WHO Headquarters: Nathalie André, Betsy Engebretson, Mark Hoeke, Cathy Jung, Francesco Mitis, Tara Neville, Peregrine Swann, Marina Takane, Bruce Gordon, Maria Neira and Fiona Gore; WHO Regional Office for South-East Asia: Payden.
Acknowledgements

2
UN
-WAT
ER G
LOB
AL A
NAL
YSIS
AN
D A
SSES
SMEN
T O
F SA
NIT
ATIO
N A
ND
DR
INK
ING
-WAT
ER (G
LAAS
) 201
4
The UN-Water Global Analysis and Assessment of Sanitation and Drinking-Water (GLAAS), implemented by WHO, monitors the efforts and approaches to extend and sustain water, sanitation and hygiene (WASH) systems and services. It provides a global update on four key areas: policy framework, monitoring, human resources base, and international and national finance streams in support of drinking-water and sanitation.
Ten countries1 out of 11 in the WHO South-East Asia Region, with a total population of 1.8 billion, participated in the GLAAS 2013/2014 reporting cycle. Overall, access to improved drinking-water and sanitation services in the South-East Asia Region are 92 and 49 per cent (in 2015), respectively. More than 330 million people gained access to an improved drinking-water source and nearly 250 million people gained access to improved sanitation in the 2005 to 2015 time period.2 However, in 2015, there are still nearly one billion people without improved sanitation, and over 140 million without access to an improved drinking-water source in the South-East Asia Region.
Despite all countries in the region making service improvements, there is a substantial need to further strengthen government actions to implement the national policies and plans for provision of safe and sustainable water and sanitation services, with particular focus on rural areas. As shown by Figure 1 and Figure 2, there are a number of challenges that need to be addressed, including:
• Geographicandeconomicinequalitiesinaccesstowaterandsanitation,
• Buildingcapacityforsurveillanceofwatersupplies,
• Participationofusersinplanningprocesses,
• AneedtoestablishacomprehensivenationalsystemforplanningandimplementingWASHsectorfinancing,and
• ReducingopendefecationinseveralSouth-EastAsiacountrieswhereopendefectionratesarehigh.
1 Bangladesh, Bhutan, India (rural areas only), Indonesia, Maldives, Myanmar, Nepal, Sri Lanka, Thailand, and Timor-Leste.
2 WHO/UNICEF (2015) Progress on sanitation and drinking-water – 2015 update and MDG assessment. Geneva, World Health Organization.
Drinking-water, sanitation and hygiene overview
Overview of policy, monitoring, human resources and financing in drinking-water (percentage of countries with the given indicator in place for both urban and rural areas)
Figure1
finance
Affordability schemes exist and are widely used ●
Finance budget/plan approved and consistently followed ●
Over 80% of operating and maintenance costs are covered by tariffs ●
Financing allocated to drinking-water is sufficient to cover over 75% ● of what is needed to meet targets
Funds available for financing staff ●
Availability of skilled workers ●
human resources
Human resource strategy exists ●
Action plan to fill human resource gaps is defined ●
national planning and coordination
● Measures to ensure drinking-water meets national standards
● National policy approved and plan being fully implemented
● Coverage targets in place
● High participation of users in planning
monitoring
● Data available and used for majority of decisions regarding resource allocation
● Perform independent audits of drinking-water quality / informs remedial action
● Data available and used for majority of decisions regarding policy and strategy
● Reporting of internal monitoring to regulators and results trigger corrective action
Source: GLAAS 2013/2014 country survey.

3
GLA
AS 2
014
FIN
DIN
GS
– H
IGH
LIG
HTS
FO
R T
HE
SOU
TH-E
AST
ASIA
REG
ION
Overview of policy, monitoring, human resources and financing results in sanitation (percentage of countries with the given indicator in place both for urban and rural areas)
Figure2
finance
Affordability schemes exist and are widely used ●
Finance budget/plan approved and consistently followed ●
Over 80% of operating and maintenance costs are covered by tariffs ●
Financing allocated to sanitation is sufficient to cover over 75% ● of what is needed to meet targets
Funds available for financing staff ●
Availability of skilled workers ●
human resources
Human resource strategy exists ●
Action plan to fill human resource gaps is defined ●
national planning and coordination
● High implementation of measures to reuse wastewater and/or septage
● National policy approved and plan being fully implemented
● Coverage targets in place
● High participation of users in planning
monitoring
● Reporting of internal monitoring to regulators and results trigger corrective action
● Data available and used for majority of decisions regarding policy and strategy
● Data available and used for majority of decisions regarding resource allocation
Source: GLAAS 2013/2014 country survey.

4
UN
-WAT
ER G
LOB
AL A
NAL
YSIS
AN
D A
SSES
SMEN
T O
F SA
NIT
ATIO
N A
ND
DR
INK
ING
-WAT
ER (G
LAAS
) 201
4
Seven countries out of ten (70%) in the WHO South-East Asia Region reported that national policies for sanitation and drinking-water are in place. Within countries that have national policies/plans, rural drinking-water plans are reported to be fully implemented with funding and regular review in five countries – a higher rate of policy/plan implementation than urban drinking-water and urban/rural sanitation within the region.
National policy and implementation
National policy implementation in drinking-water (10 country respondents)1Figure3
One-half of countries in the South-East Asia Region report having fully implemented rural drinking-water policies/plans with funding, which are regularly reviewed (Figure 3).
National policy implementationin drinking-water
Fully implemented, urban only
Partially implemented, urban and ruralFully implemented, rural only
Not a participating country in the WHO South-East Asia Region
No policy or under development
Not applicable
Country not within SEARO region
Fully implemented, urban and rural
Source: GLAAS 2013/2014 country survey.
1 India only responded for rural areas, thus data are not available for urban areas in India. Maldives indicates no formal policy exists for urban and rural drinking-water, but has informal policy or policy under development for health care facilities and schools.

5
GLA
AS 2
014
FIN
DIN
GS
– H
IGH
LIG
HTS
FO
R T
HE
SOU
TH-E
AST
ASIA
REG
ION
Sustainable Development Goal 6 aims to “Ensure availability and sustainable management of water and sanitation for all” and places new emphasis on countries to improve services beyond basic access, which includes measures to improve quality and availability of drinking-water and to ensure safe management of faecal waste.
Improving water quality, reliability, and reuse
Countries in the South-East Asia Region report a moderate to high level of oversight to ensure drinking-water quality and sustainability of services (Figure 4).
DRINKING-WATER QUALITY – A moderate to high level of monitoring and enforcement measures to ensure drinking-water quality are reported to be in place in 9 out of 10 countries (Figure 4).
SUSTAINABILITY – Eight out of 10 countries report implementing measures to improve the reliability and continuity of urban water supplies. Measures to ensure the functioning of rural water supplies appear to be more robust. Nine out of 10 countries indicate a moderate to high level of implementation to ensure the sustainability of rural water services over the long-term (Figure 4).
WASTEWATER REUSE – One-half of countries reported low or moderate reuse of wastewater or septage waste.
Number of countries with specific measures to improve and sustain services and the level of implementation of these measures (10 countries)
Figure4
|0
|8
Source: GLAAS 2013/2014 country survey.
number of countries
|4
Ensure drinking-water quality meets national standards
Reuse wastewater and/or septage
Improve the reliability and continuity of urban water supplies
Keep rural water supplies functioning over the long-term
● Low level of implementation
● High level of implementation
● Some level of implementation
|6
|2
|10
TypES OF SERVICE pROVIDERS
Three of the four countries responding to this section report that a majority of the urban population is served by a formal drinking-water service provider. However, there are still a considerable number of people obtaining drinking-water through household self-supply (i.e. sources funded and managed by households, including wells, collection from protected springs, rainwater harvesting, etc.). Wells were the most common example of self-supply sources provided by Myanmar and Bangladesh. There is also a small proportion of the population served by community-based service providers, which can include point sources such as pumps, water kiosks and protected springs or wells owned or operated by communities (Figure 5).

6
UN
-WAT
ER G
LOB
AL A
NAL
YSIS
AN
D A
SSES
SMEN
T O
F SA
NIT
ATIO
N A
ND
DR
INK
ING
-WAT
ER (G
LAAS
) 201
4
Percentage of population in urban areas being served by service providers (four countries)Figure5
Source: GLAAS 2013/2014 country survey.
% O
F U
RBA
N P
OPU
LATI
ON
SER
vED
100 —
80 —
60 —
40 —
20 —
0 —
Informal urban water
Self-supply urban water
Formal urban water
Community urban water
bANGlADESh bhuTAN myANmAR NEpAl
humAN RIGhTS AND EquITy mEASuRES
Although three quarters of respondent countries recognize the human right to water and sanitation, gaps remain in establishing equity measures to reach disadvantaged populations, especially in informal settlements.
A majority of respondent countries have a legislation in place that outlines user participation in WASH planning. The extent of participation of users remains limited, although a minority of countries report having a high level of user-involvement in WASH planning (Table 1).
Indicators of policies and measures to ensure equity in WASH services by countryTable1
COuNTRy
Human right recognized in law
Specific measures are included in
national plan to reach disadvantaged groups
Participation procedures are defined
in law or policy*Extent to which service users participate
in planning
Existence of a public complaint mechanism for population
served
Drinking-water Sanitation
Drinking-water and sanitation
Drinking-water and sanitation
Drinking-water Sanitation Drinking-water Sanitation Drinking-water Sanitation
National National National National National National Urban Rural Urban Rural Urban Rural Urban Rural
Populations living in slums or informal
settlements
Populations living in
remote or hard to reach
areas
Bangladesh Yes Yes Yes Yes Yes Yes Low High Low High
Bhutan Yes Yes No Yes Yes Yes Moderate High Moderate High
India No No No Yes No Yes — Low — Moderate — —
Indonesia Yes Yes Yes Yes Yes Yes High High Low High
Maldives Yes Yes No No No No Low Low Low Low — —
Myanmar No No Yes Yes No No High Moderate High High
Nepal Yes Yes No No Yes Yes Moderate Moderate Moderate Moderate
Sri Lanka Yes Yes Yes Yes No/Yes* Yes Low High Moderate High
Thailand Yes Yes No No Yes Yes Moderate Moderate Moderate Moderate
Timor-Leste No Yes No No Yes Yes Low Moderate Low Low
* No difference between urban and rural, except as noted with asterisk (*) where response is for urban/rural. Effective complaint mechanisms exist for most (more than 50% of population served). Effective complaint mechanisms exist for some (between 25–50% of population served). Effective complaint mechanisms exist for few (less than 25% of population served).
Source: GLAAS 2013/2014 country survey.

7
GLA
AS 2
014
FIN
DIN
GS
– H
IGH
LIG
HTS
FO
R T
HE
SOU
TH-E
AST
ASIA
REG
ION
Oversight and operational monitoring of drinking-water and sanitation services (e.g. quality, cost recovery, line breaks, affordability, costs) are conducted to ensure continuity of service, inform decision-making for implementing improvements, provide accountability to the public, and ensure services meet expected standards.
In 60% of responding countries in the South-East Asia Region (6 out of 10), formal drinking-water service providers in urban areas provide the results of their internal (operational) monitoring to regulatory authorities for comparison against required service standards and are subject to corrective action as needed. However, there is no well-established mechanism of reporting by informal service providers (Figure 6).
Service standards for drinking-water monitored by service providers in the South–East Asia Region include availability and quality (e.g. conforming to National Drinking-Water Quality Standards); however, the exact requirements can vary between countries. For sanitation, service quality indicators include treated effluent quality and indicators to measure per cent access.
Overall, more countries in the South-East Asia Region have developed a full cycle of monitoring, reporting and corrective action for drinking-water than for sanitation (Figure 6).
Monitoring of drinking-water and sanitation
1 Examples of service provision types can be found in the country survey guidance note at the following link http://www.who.int/water_sanitation_health/glaas/2014/en/.
Monitoring of service standards by type of service provision.1 The percentage of countries in which monitoring results are reported to regulatory authorities and used to trigger corrective action is indicated (10 countries)
Figure6
Source: GLAAS 2013/2014 country survey.
% C
OU
NTR
IES
WIT
H R
ESU
LTS
REPO
RTED
AN
D U
SED
FO
R C
ORR
ECTI
vE A
CTI
ON
S
70 —
10 —
30 —
50 —
60 —● Community service providers
● Urban formal service providers
● Rural formal service providers
● Informal service providers
20 —
40 —
SANITATION DRINkING-WATER
0 —

8
UN
-WAT
ER G
LOB
AL A
NAL
YSIS
AN
D A
SSES
SMEN
T O
F SA
NIT
ATIO
N A
ND
DR
INK
ING
-WAT
ER (G
LAAS
) 201
4
uSE OF mONITORING DATA FOR RESOuRCE AllOCATION
Only two respondent countries (India and Thailand) reported that they collect and analyse data through a management information system and regularly use the results for resource allocation in both sanitation and drinking-water (Figure 7).
Data availability for decision making in resource allocation (10 countries)Figure7
Source: GLAAS 2013/2014 country survey.
BANGLADESH Drinking-waterSanitation
BHUTAN Drinking-waterSanitation
INDIA Drinking-waterSanitation
INDONESIA Drinking-waterSanitation
MALDIvES Drinking-waterSanitation
MyANMAR Drinking-waterSanitation
NEPAL Drinking-waterSanitation
SRI LANKA Drinking-waterSanitation
THAILAND Drinking-waterSanitation
TIMOR-LESTE Drinking-waterSanitation
Limited
Data analysed and used for majority of decisions
COmmuNICATING pERFORmANCE DATA TO ThE publIC
Respondent countries report that performance and customer satisfaction reviews are rarely publicly available for most formal service providers of urban and rural areas for both sanitation and drinking water.
most countries in the South-East Asia Region have established some performance indicators for water and sanitation.
Though 60% of countries reporting from the South-East Asia Region have established performance indicators for water and sanitation, less than one-third report to be using a comprehensive set of performance indicators for either drinking-water supply or sanitation services (Table 2).

9
GLA
AS 2
014
FIN
DIN
GS
– H
IGH
LIG
HTS
FO
R T
HE
SOU
TH-E
AST
ASIA
REG
ION
Performance indicators used to track progress – main indicators and extent of usage (10 countries)
Table2
Source: GLAAS 2013/2014 country survey.
CATEGORy TypE
pERCENTAGE OF COuNTRIES
REpORTING uSE OF STANDARD
INDICATORS FOR DRINkING-WATER TWO mOST COmmONly CITED INDICATORS FOR DRINkING-WATER
FINANCIAl Expenditure 60% % or ratio spent/allocated
Cost-recovery 20% Coverage of costs, collection of costs (recovery of billing)
Cost-effectiveness 30% Cost/unit volume produced
EquITy Equitable service coverage 30% —
Affordability 10% Ability to pay by the poor
SERVICE pROVIDERINDICATORS
Service quality 20% Service time
Functionality of systems 20% —
Institutional effectiveness 30% Non-revenue water

10
UN
-WAT
ER G
LOB
AL A
NAL
YSIS
AN
D A
SSES
SMEN
T O
F SA
NIT
ATIO
N A
ND
DR
INK
ING
-WAT
ER (G
LAAS
) 201
4
Even where national strategies are well developed, government institutions are well-coordinated and sufficient financing is available, progress on sanitation and drinking-water relies on adequately trained, capable staff and a work environment conducive to effective outputs.
Several countries in the South-East Asia Region report a shortage of skilled workers (e.g. engineers, chemists, mechanics, hygienists, etc.) impacting a range of WASH activities from planning, design, quality of construction, operations, and maintenance. Countries surveyed cited several problem areas in human resource development, including:
1) Difficulty retaining HR within the sector due to short-term nature of work,
2) Insufficient number of educational institutions,
3) HR development not prioritized and budget/financing inadequate for HR,
4) Lack of capacity building/professional development, and
5) Lack of modern equipment/instrumentation.
As a result of these constraints, the sector’s ability to recruit and retain skilled workers is limited.
Human resources
most surveyed countries in the South-East Asia Region cited moderate WASh human resource constraints, especially due to insufficient educational institutions and recruitment practices (Figure 8).
Despite staff shortages, one-half of countries surveyed in the South-East Asia Region have an overall strategy to develop and manage human resources for drinking-water and sanitation, and one-half of countries have a human resources strategy for hygiene promotion.
Constraints to WASH human resources for sanitationFigure8
|0
|40
Source: GLAAS 2013/2014 country survey.
percent of countries (out of 10)
|20
Insufficient educational organizations to meet demand
Recruitment practices
Emigration of skilled workers
Preference to work in other sectors
● Severe constraint
● Moderate constraint
|30
|10
|50
Preference to not live/work in rural areas
Lack of skilled graduates
Salaries and benefits
|70
|60
|80

11
GLA
AS 2
014
FIN
DIN
GS
– H
IGH
LIG
HTS
FO
R T
HE
SOU
TH-E
AST
ASIA
REG
ION
Extending and sustaining water and sanitation programmes, and infrastructure, especially in the context of reducing inequalities, requires adequate funds and effective financial management.
Nearly all respondent countries indicate they have an approved financing plan/budget for the WASH sector. However, only 40% of countries reported that it is consistently followed for drinking water and 30% for sanitation. very limited data was available from the region on WASH budget and expenditure, with only four countries providing data on national WASH budgets and three countries providing data on WASH expenditure (Table 3).
Financing
Annual WASH budget and expenditure data (five countries)Table3
Source: GLAAS 2013/2014 country survey.
COuNTRy
REpORTED NATIONAl WASh
buDGET(uS$ mIllION)
REpORTED TOTAl WASh
ExpENDITuRE(uS$ mIllION)
pARTIAlly-REpORTED WASh
ExpENDITuRE (uS$ mIllION)
Bangladesh 266 473 —
Bhutan 10 — 9
Nepal — 134 —
Myanmar 7 — —
Viet Nam 49 — —
Source: GLAAS 2013/2014 country survey.
Proportion of government-coordinated expenditure on WASH as a percentage of GDP for three respondent countries
Figure9
The proportion of WASH expenditure as a percentage of GDP could be estimated for the three countries providing total WASH expenditure. Total expenditure, however, may not be complete in the case of Bhutan, where most of the expenditures in sanitation and hygiene were not reported (Figure 9).
|0
|0.4
government-coordinated expenditure on wash as a % of gdp
|0.1
|0.5
|0.6
NEPAL 0.57
BHUTAN 0.52
BANGLADESH 0.26
|0.3
|0.2

12
UN
-WAT
ER G
LOB
AL A
NAL
YSIS
AN
D A
SSES
SMEN
T O
F SA
NIT
ATIO
N A
ND
DR
INK
ING
-WAT
ER (G
LAAS
) 201
4
A review of expenditure breakdowns can indicate potential issues with targeting of financial resources. However, only limited data were available for countries in the South-East Asia Region.
WATER VERSUS SANITATION – The disaggregation of expenditure data for water and sanitation was available for two countries. The percentage of expenditure for sanitation of the total WASH expenditure was obtained for Bangladesh (24%) and Nepal (13%).
URBAN VERSUS RURAL – The disaggregation of expenditure data for urban and rural areas was available for two countries. The percentage of expenditure for rural areas of the total WASH expenditure was obtained for Bangladesh (24%) and Nepal (49%).
The lack of data on financing highlights the substantial need in many countries to establish a comprehensive system for planning, fund allocation and tracking WASH sector financing.
Data on expenditure allocations are largely unavailable.
Overall financing is reported to be insufficient to meet targets.
From the information available, only three countries (India, Thailand, and Bhutan) out of 10 respondents indicated that sufficient financing is available to meet water/sanitation and hygiene targets.
There is also an indication that basic costs for sustaining and maintaining services are not being met by tariffs. Only Indonesia reported that tariffs cover over 80% of operation and maintenance costs in both drinking-water and sanitation. Government subsidies are most often cited as the means for covering the operational finance gap, though Myanmar aims to reduce non-revenue water to improve cost recovery.
13
GLA
AS 2
014
FIN
DIN
GS
– H
IGH
LIG
HTS
FO
R T
HE
SOU
TH-E
AST
ASIA
REG
ION
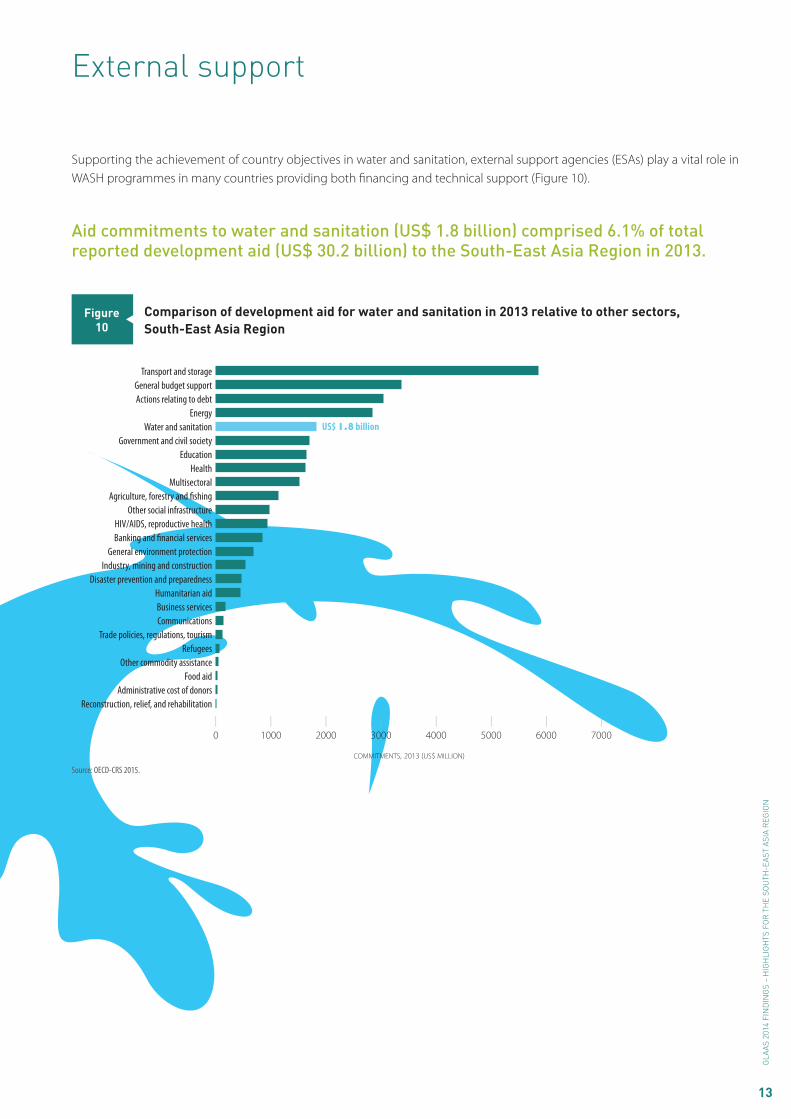
Supporting the achievement of country objectives in water and sanitation, external support agencies (ESAs) play a vital role in WASH programmes in many countries providing both financing and technical support (Figure 10).
External support
Aid commitments to water and sanitation (uS$ 1.8 billion) comprised 6.1% of total reported development aid (uS$ 30.2 billion) to the South-East Asia Region in 2013.
Comparison of development aid for water and sanitation in 2013 relative to other sectors, South-East Asia Region
Figure10
Source: OECD-CRS 2015.
Transport and storageGeneral budget supportActions relating to debt
EnergyWater and sanitation
Government and civil societyEducation
HealthMultisectoral
Agriculture, forestry and fishingOther social infrastructure
HIV/AIDS, reproductive healthBanking and financial services
General environment protectionIndustry, mining and construction
Disaster prevention and preparednessHumanitarian aidBusiness servicesCommunications
Trade policies, regulations, tourismRefugees
Other commodity assistanceFood aid
Administrative cost of donors
|6000
|0
|3000
commitments, 2013 (us$ million)
|4000
|1000
|2000
|5000
US$ 1.8 billion
Reconstruction, relief, and rehabilitation
|7000
14
UN
-WAT
ER G
LOB
AL A
NAL
YSIS
AN
D A
SSES
SMEN
T O
F SA
NIT
ATIO
N A
ND
DR
INK
ING
-WAT
ER (G
LAAS
) 201
4
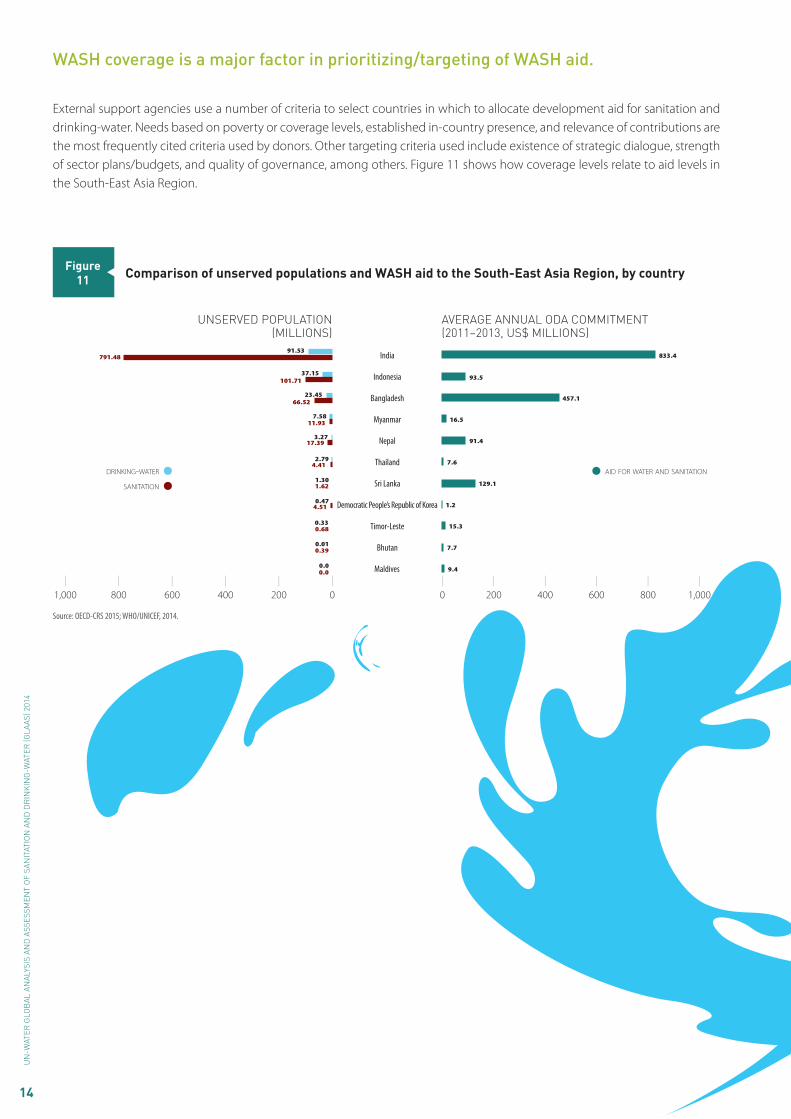
External support agencies use a number of criteria to select countries in which to allocate development aid for sanitation and drinking-water. Needs based on poverty or coverage levels, established in-country presence, and relevance of contributions are the most frequently cited criteria used by donors. Other targeting criteria used include existence of strategic dialogue, strength of sector plans/budgets, and quality of governance, among others. Figure 11 shows how coverage levels relate to aid levels in the South-East Asia Region.
WASh coverage is a major factor in prioritizing/targeting of WASh aid.
Comparison of unserved populations and WASH aid to the South-East Asia Region, by countryFigure11
Source: OECD-CRS 2015; WHO/UNICEF, 2014.
drinking-water
sanitation
UNSERvED popULATIoN(MILLIoNS)
AvERAGE ANNUAL oDA CoMMITMENT(2011–2013, US$ MILLIoNS)
|0
|1,000
|600
|400
|200
|1,000
|0
|200
|800
|400
|600
91.53791.48
37.15101.71
23.4566.52
7.5811.93
3.2717.39
2.794.41
1.301.62
0.474.51
0.330.68
0.010.39
0.00.0
833.4
93.5
457.1
16.5
91.4
7.6
129.1
1.2
15.3
7.7
aid for water and sanitation
|800
9.4
India
Indonesia
Bangladesh
Nepal
Thailand
Sri Lanka
Democratic People’s Republic of Korea
Maldives
Bhutan
Myanmar
Timor-Leste

15
GLA
AS 2
014
FIN
DIN
GS
– H
IGH
LIG
HTS
FO
R T
HE
SOU
TH-E
AST
ASIA
REG
ION
Important contributors to the South-East Asia Region in terms of aid amounts include Japan, the World bank, and the Asian Development bank.
Twelve ESAs contributed more than US$ 10 million per year on average to the South-East Asia Region from 2011 to 2013. The majority of aid for water and sanitation (77%) is targeted towards large systems, while 23% of development aid is targeted towards basic systems. Eighty-three per cent (83%) of aid is in the form of concessional loans1 and 17% of aid is in the form of grants (Figure 12).
1 For a loan to qualify as ODA, it must among other things, be concessional in character and must convey a grant element of at least 25 per cent. The grant element test is a mathematical calculation based on the terms of repayment of a loan (e.g. grace period, maturity and interest) and a discount rate of 10 per cent.
Breakdown in aid commitments to sanitation and drinking-water to the South-East Asia Region by ESA, among grants and loans, and purpose types, 2011–2013 annual average
Figure12
Source: OECD-CRS, 2015.
average annual commitments to sanitation and drinking-water, 2011–2013 (us$ millions, constant 2011 $us)
|0
|800
|200
|500
Note: Chart represents ESAs with annual contributions averaging over US$ 100,000.
bASIC vS LARGE SySTEMSGRANTS vS LoANS
|0
|200
|800
|400
average annual commitments to sanitation and drinking-water, 2011–2013 (us$ millions, constant 2011 $us)
oda grants
oda loans
equity investment
|600
|300
basic systems
large systems
other
|300
|500
|700
|400
|700
|600
|100
|100
IDAAsDB Special Funds
AustraliaRepublic of Korea
GermanyNetherlands
FranceBill & Melinda Gates Foundation
SwitzerlandOFID
United StatesFinland
DenmarkUNICEF
Isl.Dev BankAustriaCanada
United KingdomNordic Dev. Fund
BelgiumIFAD
New ZealandSwedenIrelandSpain
Norway
Japan

Notes
. . . . . . . . . . . . . . . . . . . . . . . . . . . . . . . . . . . . . . . . . . . . . . . . . . . . . . . . . . . . . . . . . . . . . . . . . . . . . . . . . . . . . . . . . .
. . . . . . . . . . . . . . . . . . . . . . . . . . . . . . . . . . . . . . . . . . . . . . . . . . . . . . . . . . . . . . . . . . . . . . . . . . . . . . . . . . . . . . . . . .
. . . . . . . . . . . . . . . . . . . . . . . . . . . . . . . . . . . . . . . . . . . . . . . . . . . . . . . . . . . . . . . . . . . . . . . . . . . . . . . . . . . . . . . . . .
. . . . . . . . . . . . . . . . . . . . . . . . . . . . . . . . . . . . . . . . . . . . . . . . . . . . . . . . . . . . . . . . . . . . . . . . . . . . . . . . . . . . . . . . . .
. . . . . . . . . . . . . . . . . . . . . . . . . . . . . . . . . . . . . . . . . . . . . . . . . . . . . . . . . . . . . . . . . . . . . . . . . . . . . . . . . . . . . . . . . .
. . . . . . . . . . . . . . . . . . . . . . . . . . . . . . . . . . . . . . . . . . . . . . . . . . . . . . . . . . . . . . . . . . . . . . . . . . . . . . . . . . . . . . . . . .
. . . . . . . . . . . . . . . . . . . . . . . . . . . . . . . . . . . . . . . . . . . . . . . . . . . . . . . . . . . . . . . . . . . . . . . . . . . . . . . . . . . . . . . . . .
. . . . . . . . . . . . . . . . . . . . . . . . . . . . . . . . . . . . . . . . . . . . . . . . . . . . . . . . . . . . . . . . . . . . . . . . . . . . . . . . . . . . . . . . . .
. . . . . . . . . . . . . . . . . . . . . . . . . . . . . . . . . . . . . . . . . . . . . . . . . . . . . . . . . . . . . . . . . . . . . . . . . . . . . . . . . . . . . . . . . .
. . . . . . . . . . . . . . . . . . . . . . . . . . . . . . . . . . . . . . . . . . . . . . . . . . . . . . . . . . . . . . . . . . . . . . . . . . . . . . . . . . . . . . . . . .
. . . . . . . . . . . . . . . . . . . . . . . . . . . . . . . . . . . . . . . . . . . . . . . . . . . . . . . . . . . . . . . . . . . . . . . . . . . . . . . . . . . . . . . . . .
. . . . . . . . . . . . . . . . . . . . . . . . . . . . . . . . . . . . . . . . . . . . . . . . . . . . . . . . . . . . . . . . . . . . . . . . . . . . . . . . . . . . . . . . . .
. . . . . . . . . . . . . . . . . . . . . . . . . . . . . . . . . . . . . . . . . . . . . . . . . . . . . . . . . . . . . . . . . . . . . . . . . . . . . . . . . . . . . . . . . .
. . . . . . . . . . . . . . . . . . . . . . . . . . . . . . . . . . . . . . . . . . . . . . . . . . . . . . . . . . . . . . . . . . . . . . . . . . . . . . . . . . . . . . . . . .
. . . . . . . . . . . . . . . . . . . . . . . . . . . . . . . . . . . . . . . . . . . . . . . . . . . . . . . . . . . . . . . . . . . . . . . . . . . . . . . . . . . . . . . . . .
. . . . . . . . . . . . . . . . . . . . . . . . . . . . . . . . . . . . . . . . . . . . . . . . . . . . . . . . . . . . . . . . . . . . . . . . . . . . . . . . . . . . . . . . . .
. . . . . . . . . . . . . . . . . . . . . . . . . . . . . . . . . . . . . . . . . . . . . . . . . . . . . . . . . . . . . . . . . . . . . . . . . . . . . . . . . . . . . . . . . .
. . . . . . . . . . . . . . . . . . . . . . . . . . . . . . . . . . . . . . . . . . . . . . . . . . . . . . . . . . . . . . . . . . . . . . . . . . . . . . . . . . . . . . . . . .
. . . . . . . . . . . . . . . . . . . . . . . . . . . . . . . . . . . . . . . . . . . . . . . . . . . . . . . . . . . . . . . . . . . . . . . . . . . . . . . . . . . . . . . . . .
. . . . . . . . . . . . . . . . . . . . . . . . . . . . . . . . . . . . . . . . . . . . . . . . . . . . . . . . . . . . . . . . . . . . . . . . . . . . . . . . . . . . . . . . . .
. . . . . . . . . . . . . . . . . . . . . . . . . . . . . . . . . . . . . . . . . . . . . . . . . . . . . . . . . . . . . . . . . . . . . . . . . . . . . . . . . . . . . . . . . .
. . . . . . . . . . . . . . . . . . . . . . . . . . . . . . . . . . . . . . . . . . . . . . . . . . . . . . . . . . . . . . . . . . . . . . . . . . . . . . . . . . . . . . . . . .
. . . . . . . . . . . . . . . . . . . . . . . . . . . . . . . . . . . . . . . . . . . . . . . . . . . . . . . . . . . . . . . . . . . . . . . . . . . . . . . . . . . . . . . . . .
. . . . . . . . . . . . . . . . . . . . . . . . . . . . . . . . . . . . . . . . . . . . . . . . . . . . . . . . . . . . . . . . . . . . . . . . . . . . . . . . . . . . . . . . . .
. . . . . . . . . . . . . . . . . . . . . . . . . . . . . . . . . . . . . . . . . . . . . . . . . . . . . . . . . . . . . . . . . . . . . . . . . . . . . . . . . . . . . . . . . .
. . . . . . . . . . . . . . . . . . . . . . . . . . . . . . . . . . . . . . . . . . . . . . . . . . . . . . . . . . . . . . . . . . . . . . . . . . . . . . . . . . . . . . . . . .
. . . . . . . . . . . . . . . . . . . . . . . . . . . . . . . . . . . . . . . . . . . . . . . . . . . . . . . . . . . . . . . . . . . . . . . . . . . . . . . . . . . . . . . . . .
. . . . . . . . . . . . . . . . . . . . . . . . . . . . . . . . . . . . . . . . . . . . . . . . . . . . . . . . . . . . . . . . . . . . . . . . . . . . . . . . . . . . . . . . . .
. . . . . . . . . . . . . . . . . . . . . . . . . . . . . . . . . . . . . . . . . . . . . . . . . . . . . . . . . . . . . . . . . . . . . . . . . . . . . . . . . . . . . . . . . .
. . . . . . . . . . . . . . . . . . . . . . . . . . . . . . . . . . . . . . . . . . . . . . . . . . . . . . . . . . . . . . . . . . . . . . . . . . . . . . . . . . . . . . . . . .
. . . . . . . . . . . . . . . . . . . . . . . . . . . . . . . . . . . . . . . . . . . . . . . . . . . . . . . . . . . . . . . . . . . . . . . . . . . . . . . . . . . . . . . . . .
. . . . . . . . . . . . . . . . . . . . . . . . . . . . . . . . . . . . . . . . . . . . . . . . . . . . . . . . . . . . . . . . . . . . . . . . . . . . . . . . . . . . . . . . . .
. . . . . . . . . . . . . . . . . . . . . . . . . . . . . . . . . . . . . . . . . . . . . . . . . . . . . . . . . . . . . . . . . . . . . . . . . . . . . . . . . . . . . . . . . .
. . . . . . . . . . . . . . . . . . . . . . . . . . . . . . . . . . . . . . . . . . . . . . . . . . . . . . . . . . . . . . . . . . . . . . . . . . . . . . . . . . . . . . . . . .
. . . . . . . . . . . . . . . . . . . . . . . . . . . . . . . . . . . . . . . . . . . . . . . . . . . . . . . . . . . . . . . . . . . . . . . . . . . . . . . . . . . . . . . . . .


http://www.who.int/water_sanitation_health/glaas/en/contact email: [email protected]
WHO/FWC/WSH/15.09