Embed Size (px)
Citation preview
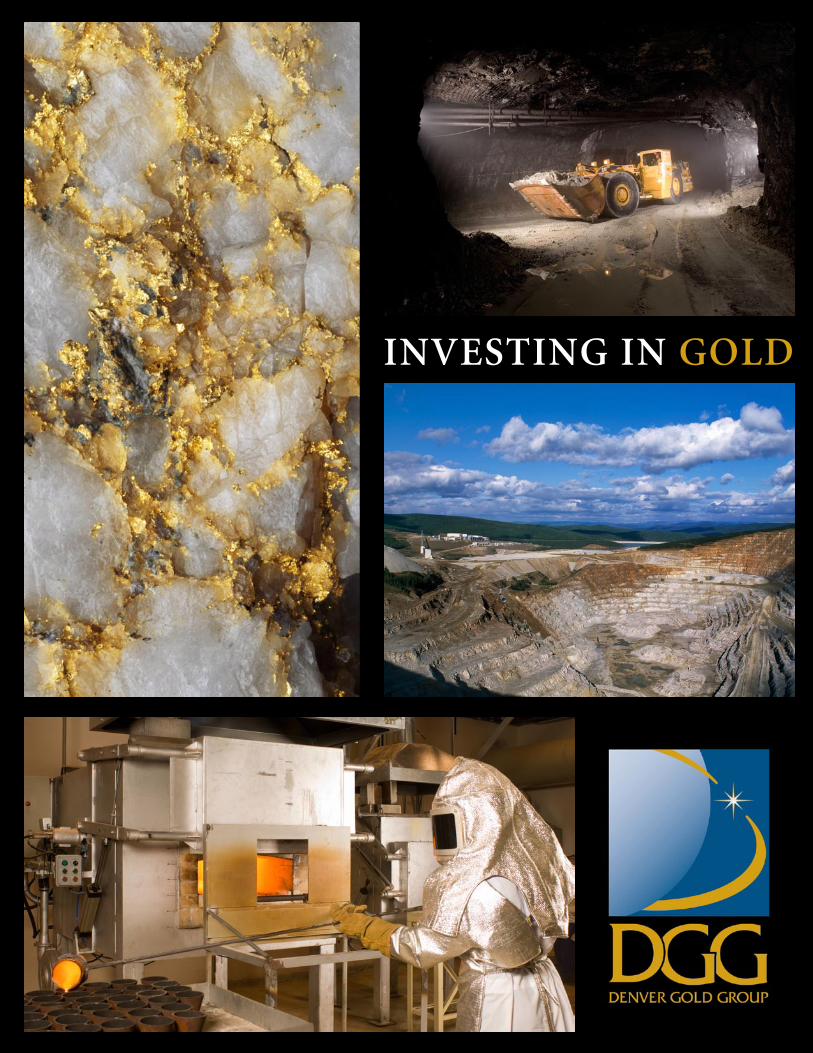
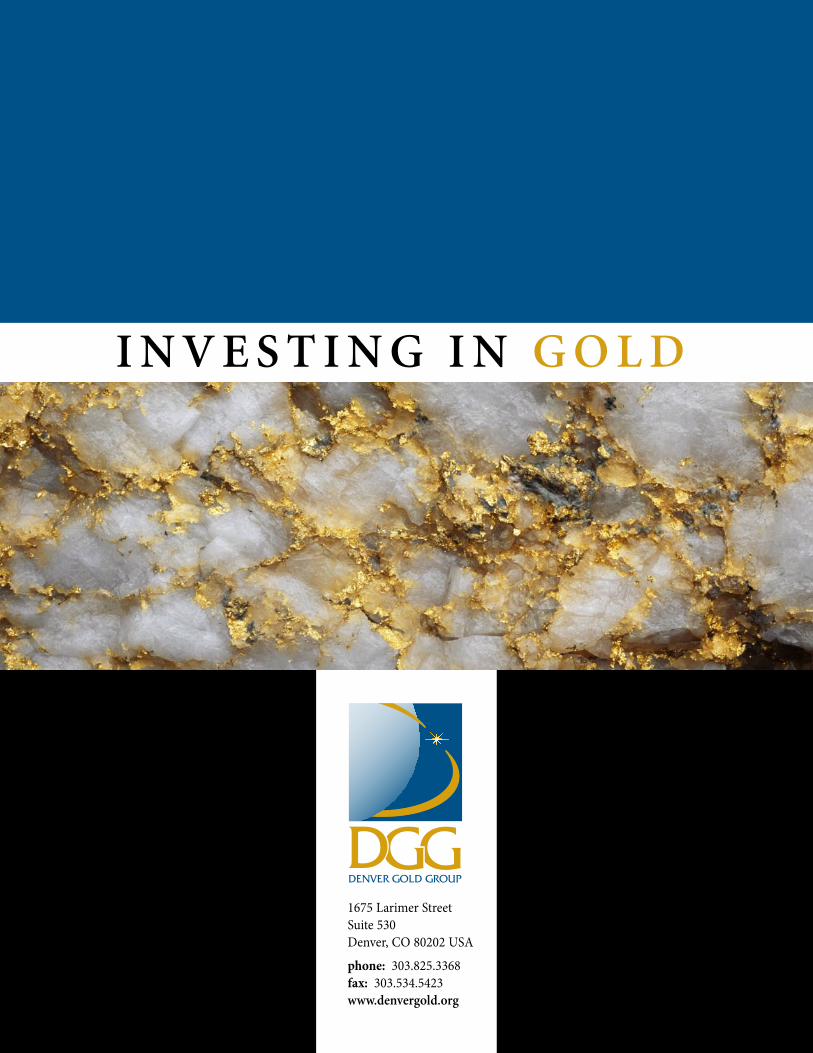
INVESTING IN GOLD

�
Celebrating the Denver Gold Group’s 20th Anniversary 20 years of excellence, 1989 to 2009
The Denver Gold Group is a not-for-profit industry association of publicly-traded precious metals companies. We are dedicated to marketing and promoting the precious metals sector to the global investment community.
The Denver Gold Group presents the world’s most prestigious precious metals investment Forums, sponsored by a diverse group of international precious metals mining, development and exploration companies. DGG’s headline events are the European Gold Forum in Zurich, Switzerland in April, and the Denver Gold Forum in Colorado in September.
DGG’s Forums are by-invitation-only events designed to provide qualified institutional investors and analysts access to a broad range of international institutional-quality precious metals companies and their executives. The Forums feature comprehensive corporate presentations, keynote speeches by leading precious metals experts and one-on-one meetings with senior management.
For more information, please visit our website at www.denvergold.org.
DENVER GOLD GROUP
1989-200920 years ofexcellence
0
100
200
300
400
500
600
700
800
900
1000
0
100
200
300
400
500
600
700
800
900
1000
68 70 72 74 76 78 80 82 84 86 88 90 92 94 96 98 00 02 04 06 08
$/Ounce $/Ounce
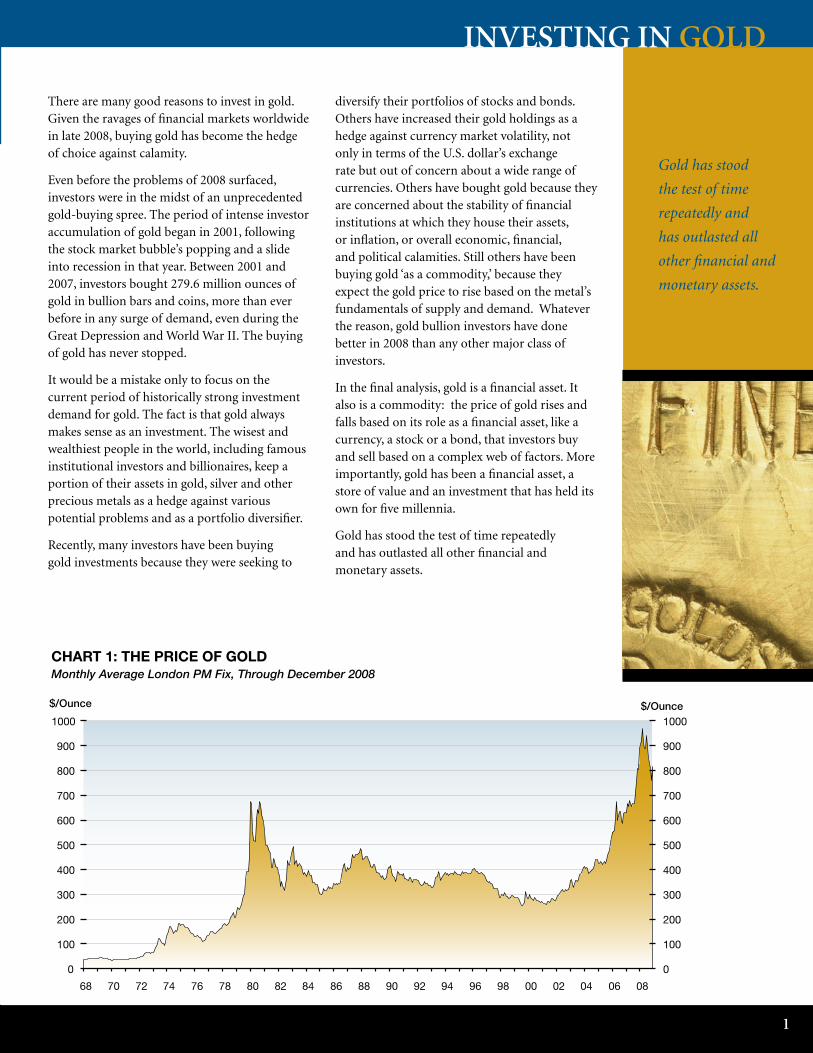
CHART 1: THE PRICE OF GOLD Monthly Average London PM Fix, Through December 2008
JANUARY �009
�
There are many good reasons to invest in gold. Given the ravages of financial markets worldwide in late 2008, buying gold has become the hedge of choice against calamity.
Even before the problems of 2008 surfaced, investors were in the midst of an unprecedented gold-buying spree. The period of intense investor accumulation of gold began in 2001, following the stock market bubble’s popping and a slide into recession in that year. Between 2001 and 2007, investors bought 279.6 million ounces of gold in bullion bars and coins, more than ever before in any surge of demand, even during the Great Depression and World War II. The buying of gold has never stopped.
It would be a mistake only to focus on the current period of historically strong investment demand for gold. The fact is that gold always makes sense as an investment. The wisest and wealthiest people in the world, including famous institutional investors and billionaires, keep a portion of their assets in gold, silver and other precious metals as a hedge against various potential problems and as a portfolio diversifier.
Recently, many investors have been buying gold investments because they were seeking to
diversify their portfolios of stocks and bonds. Others have increased their gold holdings as a hedge against currency market volatility, not only in terms of the U.S. dollar’s exchange rate but out of concern about a wide range of currencies. Others have bought gold because they are concerned about the stability of financial institutions at which they house their assets, or inflation, or overall economic, financial, and political calamities. Still others have been buying gold ‘as a commodity,’ because they expect the gold price to rise based on the metal’s fundamentals of supply and demand. Whatever the reason, gold bullion investors have done better in 2008 than any other major class of investors.
In the final analysis, gold is a financial asset. It also is a commodity: the price of gold rises and falls based on its role as a financial asset, like a currency, a stock or a bond, that investors buy and sell based on a complex web of factors. More importantly, gold has been a financial asset, a store of value and an investment that has held its own for five millennia.
Gold has stood the test of time repeatedly and has outlasted all other financial and monetary assets.
INVESTING IN GOLD
Gold has stood
the test of time
repeatedly and
has outlasted all
other financial and
monetary assets.
0
100
200
300
400
500
600
700
800
900
1000
0
100
200
300
400
500
600
700
800
900
1000
68 70 72 74 76 78 80 82 84 86 88 90 92 94 96 98 00 02 04 06 08
$/Ounce $/Ounce
CHART 1: THE PRICE OF GOLD Monthly Average London PM Fix, Through December 2008

�
Throughout history, gold has served three functions. It has been a financial asset, held by individual investors as a store of wealth and a portfolio diversifier. It has been a commodity, used primarily in jewelry but also in electronics, dentistry, and many other applications. Finally, it has been a monetary asset, used by governments as a reserve asset, as a form of money, and as a backing for their own currencies. Central banks have moved away from using gold as money or as backing their own currencies, but they still own nearly one billion ounces of gold as a reserve asset. Interestingly, as Chart 2 above shows, while central banks were selling a few hundred million ounces over the past four decades, private investors have increased their ownership of gold as a financial asset. In 2005, the amount of gold held by private sector and institutional investors exceeded the amount of gold held by central banks for the first time ever.
Who Invests In Gold
Time and again, mainstream brokers are surprised to find that their best investor clients are invested in gold and gold shares. The typical gold investor is a college graduate, upper income professional, between 40 and 65 years old, and could be either male or female. About 90% of people buying gold coins and bars fall into this demographic. The vision of a survivalist hoarding gold along with guns, ammunition, and dehydrated food is a gross mischaracterization of gold investors. The ‘guns and bunkers’ investors represent only a small percentage of gold buyers.
It also is important to realize the almost universal nature of gold investment buying. Investors throughout the United States, Europe, Japan, Canada, and other industrialized economies buy gold bullion and shares. So, too, do investors throughout the rest of the world, from China to other Asian nations, India, and throughout the Middle East. Gold also is seen as an attractive part of a portfolio throughout Latin America.
While gold is used almost universally as a financial asset, a hedge against economic and political uncertainties, and a form of savings, Charts 3 and 4 highlight that gold is a rare metal and that the amount of wealth stored in gold is small compared to the global mountain of paper assets held in currencies, stocks, bonds, and other investments.
Even in regions such as the Middle East, where there is a long and strong tradition of investing in gold and using gold as a store of value, gold holdings represent only around 1% of annual gross domestic product. This suggests that even small changes in investor attitudes toward gold can have a high-powered impact in driving gold prices higher, as was the case in 1979-1980, and again in the 2000s.
Gold mining equities often are used as a form of gold investment. These equities can offer a range of benefits in addition to simple exposure to the gold price. Gold mining stocks will be covered in greater detail toward the end of this pamphlet. Investors in gold mining shares typically match the demographics of gold bullion buyers – higher education, above average income, and
10
100
1000
68 72 76 80 84 88 92 96 00 04 08
75
100
125
150
175
10
100
1000
68 72 76 80 84 88 92 96 00 04 08
02468101214161820
0.00%
0.25%
0.50%
0.75%
1.00%
1.25%
1.50%
1.75%
2.00%
1980 1984 1988 1992 1996 2000 2004 2008
0.00%
0.25%
0.50%
0.75%
1.00%
1.25%
1.50%
1.75%
2.00%Middle East
United States
Western Europe
0
20
40
60
80
100
120
140
160
180
1980 1990 1995 2000 2001 2002 2003 2004 2005 2006
0
20
40
60
80
100
120
140
160
180Equity Securities
Private Debt Securities
Government Debt Securities
Bank Deposits
Investor Gold Holdings
200300400500600700800900
1,0001,1001,2001,300
50 54 58 62 66 70 74 78 82 86 90 94 98 02 06 08
2003004005006007008009001,0001,1001,2001,300
-8-6-4-202468
101214161820
68 72 76 80 84 88 92 96 00 04 08
1
10
100
1000
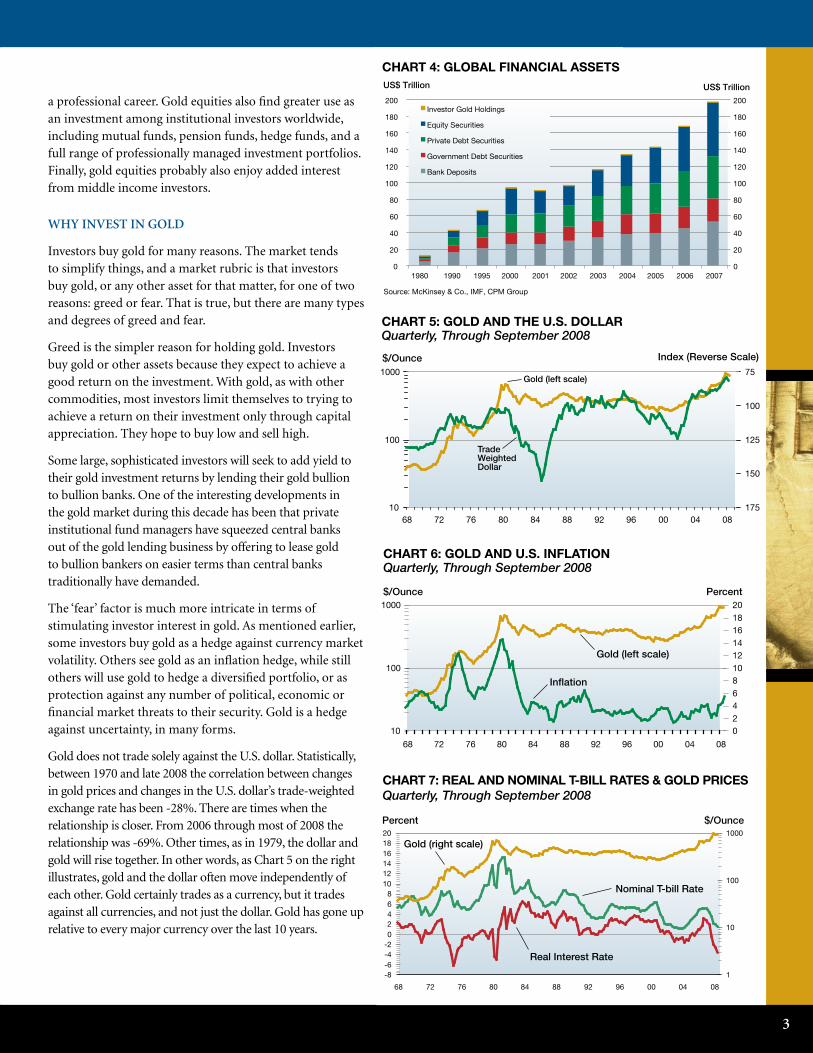
CHART 3: GOLD DEMAND AS A PERCENTAGE OF GDPCHART 5: GOLD AND THE U.S. DOLLAR Quarterly, Through September 2008
CHART 4: GLOBAL FINANCIAL ASSETS
CHART 6: GOLD AND U.S. INFLATIONQuarterly, Through September 2008
CHART 7: REAL AND NOMINAL T-BILL RATES & GOLD PRICESQuarterly, Through September 2008CHART 2: CENTRAL BANK GOLD HOLDINGS AND
INVESTOR GOLD HOLDINGS
Gold (left scale)
Trade Weighted Dollar
Inflation
Gold (left scale)
$/Ounce Percent
Million Ounces Million Ounces
$/Ounce Index (Reverse Scale)
$/OuncePercent
Gold (right scale)
Nominal T-bill Rate
Real Interest Rate
Source: McKinsey & Co., IMF, CPM Group
US$ Trillion US$ Trillion
Central Bank Holdings
Investor Gold Holdings
10
100
1000
68 72 76 80 84 88 92 96 00 04 08
75
100
125
150
175
10
100
1000
68 72 76 80 84 88 92 96 00 04 08
02468101214161820
0.00%
0.25%
0.50%
0.75%
1.00%
1.25%
1.50%
1.75%
2.00%
1980 1984 1988 1992 1996 2000 2004 2008
0.00%
0.25%
0.50%
0.75%
1.00%
1.25%
1.50%
1.75%
2.00%Middle East
United States
Western Europe
0
20
40
60
80
100
120
140
160
180
1980 1990 1995 2000 2001 2002 2003 2004 2005 2006
0
20
40
60
80
100
120
140
160
180Equity Securities
Private Debt Securities
Government Debt Securities
Bank Deposits
Investor Gold Holdings
200300400500600700800900
1,0001,1001,2001,300
50 54 58 62 66 70 74 78 82 86 90 94 98 02 06 08
2003004005006007008009001,0001,1001,2001,300
-8-6-4-202468
101214161820
68 72 76 80 84 88 92 96 00 04 08
1
10
100
1000
CHART 3: GOLD DEMAND AS A PERCENTAGE OF GDPCHART 5: GOLD AND THE U.S. DOLLAR Quarterly, Through September 2008
CHART 4: GLOBAL FINANCIAL ASSETS
CHART 6: GOLD AND U.S. INFLATIONQuarterly, Through September 2008
CHART 7: REAL AND NOMINAL T-BILL RATES & GOLD PRICESQuarterly, Through September 2008CHART 2: CENTRAL BANK GOLD HOLDINGS AND
INVESTOR GOLD HOLDINGS
Gold (left scale)
Trade Weighted Dollar
Inflation
Gold (left scale)
$/Ounce Percent
Million Ounces Million Ounces
$/Ounce Index (Reverse Scale)
$/OuncePercent
Gold (right scale)
Nominal T-bill Rate
Real Interest Rate
Source: McKinsey & Co., IMF, CPM Group
US$ Trillion US$ Trillion
Central Bank Holdings
Investor Gold Holdings
�
a professional career. Gold equities also find greater use as an investment among institutional investors worldwide, including mutual funds, pension funds, hedge funds, and a full range of professionally managed investment portfolios. Finally, gold equities probably also enjoy added interest from middle income investors.
WhY INVEST IN GOLD
Investors buy gold for many reasons. The market tends to simplify things, and a market rubric is that investors buy gold, or any other asset for that matter, for one of two reasons: greed or fear. That is true, but there are many types and degrees of greed and fear.
Greed is the simpler reason for holding gold. Investors buy gold or other assets because they expect to achieve a good return on the investment. With gold, as with other commodities, most investors limit themselves to trying to achieve a return on their investment only through capital appreciation. They hope to buy low and sell high.
Some large, sophisticated investors will seek to add yield to their gold investment returns by lending their gold bullion to bullion banks. One of the interesting developments in the gold market during this decade has been that private institutional fund managers have squeezed central banks out of the gold lending business by offering to lease gold to bullion bankers on easier terms than central banks traditionally have demanded.
The ‘fear’ factor is much more intricate in terms of stimulating investor interest in gold. As mentioned earlier, some investors buy gold as a hedge against currency market volatility. Others see gold as an inflation hedge, while still others will use gold to hedge a diversified portfolio, or as protection against any number of political, economic or financial market threats to their security. Gold is a hedge against uncertainty, in many forms.
Gold does not trade solely against the U.S. dollar. Statistically, between 1970 and late 2008 the correlation between changes in gold prices and changes in the U.S. dollar’s trade-weighted exchange rate has been -28%. There are times when the relationship is closer. From 2006 through most of 2008 the relationship was -69%. Other times, as in 1979, the dollar and gold will rise together. In other words, as Chart 5 on the right illustrates, gold and the dollar often move independently of each other. Gold certainly trades as a currency, but it trades against all currencies, and not just the dollar. Gold has gone up relative to every major currency over the last 10 years.
0
20
40
60
80
100
120
140
160
180
200
0
20
40
60
80
100
120
140
160
180
200
1980 1990 1995 2000 2001 2002 2003 2004 2005 2006 2007
Investor Gold Holdings
Equity Securities
Private Debt Securities
Government Debt Securities
Bank Deposits
US$ Trillion US$ Trillion
Source: McKinsey & Co., IMF, CPM Group
CHART 4: GLOBAL FINANCIAL ASSETS
10
100
1000
68 72 76 80 84 88 92 96 00 04 08
75
100
125
150
175
10
100
1000
68 72 76 80 84 88 92 96 00 04 08
02468101214161820
0.00%
0.25%
0.50%
0.75%
1.00%
1.25%
1.50%
1.75%
2.00%
1980 1984 1988 1992 1996 2000 2004 2008
0.00%
0.25%
0.50%
0.75%
1.00%
1.25%
1.50%
1.75%
2.00%Middle East
United States
Western Europe
0
20
40
60
80
100
120
140
160
180
1980 1990 1995 2000 2001 2002 2003 2004 2005 2006
0
20
40
60
80
100
120
140
160
180Equity Securities
Private Debt Securities
Government Debt Securities
Bank Deposits
Investor Gold Holdings
200300400500600700800900
1,0001,1001,2001,300
50 54 58 62 66 70 74 78 82 86 90 94 98 02 06 08
2003004005006007008009001,0001,1001,2001,300
-8-6-4-202468
101214161820
68 72 76 80 84 88 92 96 00 04 08
1
10
100
1000
CHART 3: GOLD DEMAND AS A PERCENTAGE OF GDPCHART 5: GOLD AND THE U.S. DOLLAR Quarterly, Through September 2008
CHART 4: GLOBAL FINANCIAL ASSETS
CHART 6: GOLD AND U.S. INFLATIONQuarterly, Through September 2008
CHART 7: REAL AND NOMINAL T-BILL RATES & GOLD PRICESQuarterly, Through September 2008CHART 2: CENTRAL BANK GOLD HOLDINGS AND
INVESTOR GOLD HOLDINGS
Gold (left scale)
Trade Weighted Dollar
Inflation
Gold (left scale)
$/Ounce Percent
Million Ounces Million Ounces
$/Ounce Index (Reverse Scale)
$/OuncePercent
Gold (right scale)
Nominal T-bill Rate
Real Interest Rate
Source: McKinsey & Co., IMF, CPM Group
US$ Trillion US$ Trillion
Central Bank Holdings
Investor Gold Holdings
10
100
1000
68 72 76 80 84 88 92 96 00 04 08
75
100
125
150
175
10
100
1000
68 72 76 80 84 88 92 96 00 04 08
02468101214161820
0.00%
0.25%
0.50%
0.75%
1.00%
1.25%
1.50%
1.75%
2.00%
1980 1984 1988 1992 1996 2000 2004 2008
0.00%
0.25%
0.50%
0.75%
1.00%
1.25%
1.50%
1.75%
2.00%Middle East
United States
Western Europe
0
20
40
60
80
100
120
140
160
180
1980 1990 1995 2000 2001 2002 2003 2004 2005 2006
0
20
40
60
80
100
120
140
160
180Equity Securities
Private Debt Securities
Government Debt Securities
Bank Deposits
Investor Gold Holdings
200300400500600700800900
1,0001,1001,2001,300
50 54 58 62 66 70 74 78 82 86 90 94 98 02 06 08
2003004005006007008009001,0001,1001,2001,300
-8-6-4-202468
101214161820
68 72 76 80 84 88 92 96 00 04 08
1
10
100
1000
CHART 3: GOLD DEMAND AS A PERCENTAGE OF GDPCHART 5: GOLD AND THE U.S. DOLLAR Quarterly, Through September 2008
CHART 4: GLOBAL FINANCIAL ASSETS
CHART 6: GOLD AND U.S. INFLATIONQuarterly, Through September 2008
CHART 7: REAL AND NOMINAL T-BILL RATES & GOLD PRICESQuarterly, Through September 2008CHART 2: CENTRAL BANK GOLD HOLDINGS AND
INVESTOR GOLD HOLDINGS
Gold (left scale)
Trade Weighted Dollar
Inflation
Gold (left scale)
$/Ounce Percent
Million Ounces Million Ounces
$/Ounce Index (Reverse Scale)
$/OuncePercent
Gold (right scale)
Nominal T-bill Rate
Real Interest Rate
Source: McKinsey & Co., IMF, CPM Group
US$ Trillion US$ Trillion
Central Bank Holdings
Investor Gold Holdings
�
Gold prices tend to respond to inflation, oil prices, interest rates, and other economic trends. Again, gold’s relationship with each of these factors is not one that is easily quantified. For example, the statistical relationship between inflation and gold prices over the past 38 years has only been around 10%. Gold preserves investors’ wealth in the long run against catastrophic bouts of inflation or other economic problems. On an ongoing basis, however, gold’s purchasing power varies sharply.
hOW TO INVEST IN GOLD
There are many ways to invest in gold. Investors buy and hold gold bullion and bullion coins in their own possession. Others will arrange for their gold holdings to be stored in secured depositories. Still others will invest in futures or options. Since 2005, exchange traded funds (ETFs) have become a common way for investors to buy gold, accounting for perhaps 20% of investment demand in 2006 and 2007. As mentioned earlier, many investors build exposure to gold prices by investing in gold company equities. The next section discusses gold equity investing in greater detail. Finally, many investors build portfolios that include a variety of these investment instruments.
Investors do not limit their precious metals focus to gold, of course. Silver, like gold, has served as a form of money, a store of value, and an investment asset for 5,000 years.
SILVER AS A COmpLEmENT TO GOLD
Silver is an interesting counterparty for gold. Around 800 million ounces of silver change hands in the physical market each year, far more than the 120 million ounces of gold each year. Because gold’s price is much higher than silver prices, however, the dollar value of annual silver market supply and demand is less than one-fifth the size of the gold market. This is one factor cited as a reason why silver prices tend to be much more volatile than gold prices. The fact that silver prices are more volatile than those of gold has attracted many investors to silver and silver mining shares.
hOW SILVER COmpARES TO GOLD
Gold and silver share some similarities. They also have some very important differences. The single most important similarity is that both metals share 5,000 years of use as a form of money and a store of value and savings.
The single most important difference is that while gold’s role as a monetary and financial asset has
been the dominant factor determining gold price trends, the price of silver is determined both by its role as a financial asset as well as industrial demand trends.
The vast majority of annual gold demand is for use in jewelry, followed by demand from investors. Relatively little gold is used in non-jewelry fabricated products, primarily in electronic connectors and microchips, and in dental and medical applications. Silver, in contrast, enjoys a wide range of uses, from jewelry and silverware to electronics, batteries, photography, mirrors, brazing alloys and solders, chemical calatysts, biocides, reflective glass, and many other applications. The use of silver in conventional photography has fallen sharply since the late 1990s, but still represents a significant use of silver. Silver use in electronics and batteries meanwhile is rising sharply.
The gold/silver price ratio has ranged between 16:1 and 100:1 since gold and silver prices were freed from government controls in the 1960s. Some writers will attribute important powers to various gold/silver ratios. In reality, there are no physical, chemical, geological, financial, or economic reasons why gold and silver prices should trade in a given relationship to each other. The range in the ratio since the 1960s
INVESTING IN SILVER
Silver, like gold, has
served as a form of
money, a store of value,
and an investment
asset for 5,000 years.
�
INVESTING IN GOLD mINING COmpANIES
Investing in the shares of gold mining companies is one of the most interesting and exciting areas of stock market investing. It is a broadly observed phenomenon that investors pay much more attention to their gold mining investments than they do to most of their other equity investments. Brokers and others tell stories about how their investor clients will know all about the operations and history of the gold mining companies in which they own shares, but comparatively little about other types of companies they hold.
The history of stock markets is filled with stories of the creation and development of major gold mining companies. When the Financial Times of London republished its first edition for its centennial on January 9, 1988, the vast majority of the articles were about gold mining companies then being developed around the world.
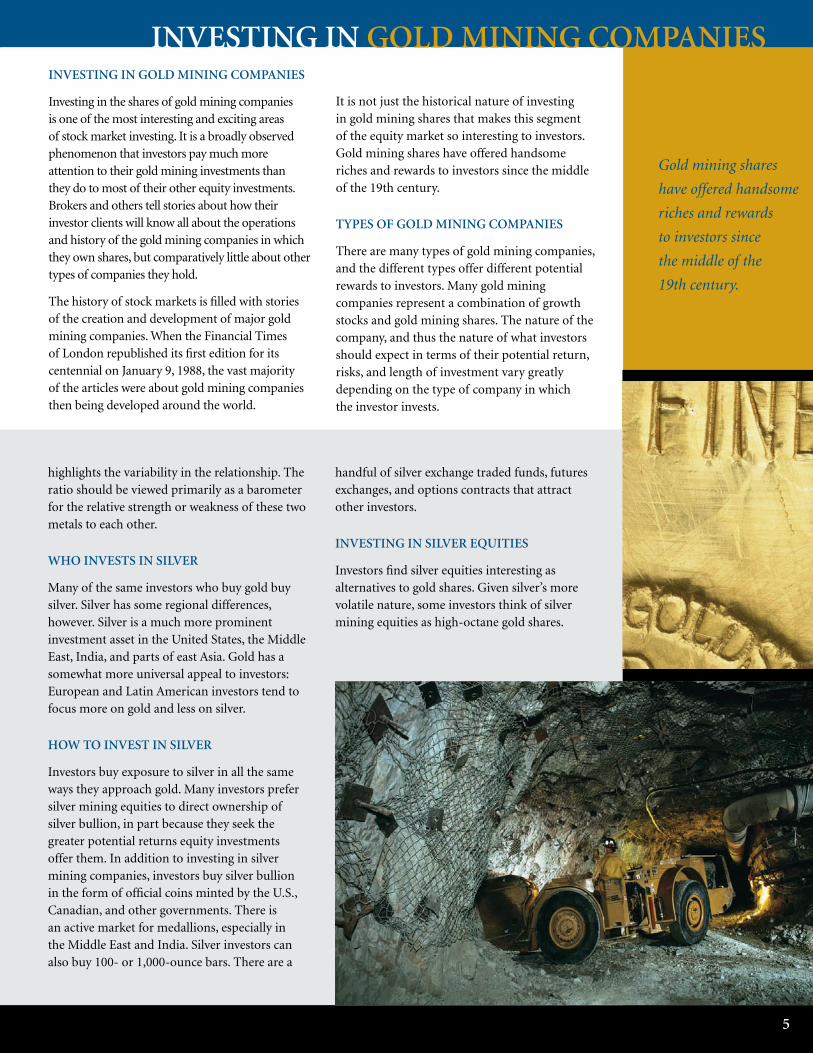
It is not just the historical nature of investing in gold mining shares that makes this segment of the equity market so interesting to investors. Gold mining shares have offered handsome riches and rewards to investors since the middle of the 19th century.
TYpES Of GOLD mINING COmpANIES
There are many types of gold mining companies, and the different types offer different potential rewards to investors. Many gold mining companies represent a combination of growth stocks and gold mining shares. The nature of the company, and thus the nature of what investors should expect in terms of their potential return, risks, and length of investment vary greatly depending on the type of company in which the investor invests.
INVESTING IN GOLD mINING COmpANIES
highlights the variability in the relationship. The ratio should be viewed primarily as a barometer for the relative strength or weakness of these two metals to each other.
WhO INVESTS IN SILVER
Many of the same investors who buy gold buy silver. Silver has some regional differences, however. Silver is a much more prominent investment asset in the United States, the Middle East, India, and parts of east Asia. Gold has a somewhat more universal appeal to investors: European and Latin American investors tend to focus more on gold and less on silver.
hOW TO INVEST IN SILVER
Investors buy exposure to silver in all the same ways they approach gold. Many investors prefer silver mining equities to direct ownership of silver bullion, in part because they seek the greater potential returns equity investments offer them. In addition to investing in silver mining companies, investors buy silver bullion in the form of official coins minted by the U.S., Canadian, and other governments. There is an active market for medallions, especially in the Middle East and India. Silver investors can also buy 100- or 1,000-ounce bars. There are a
handful of silver exchange traded funds, futures exchanges, and options contracts that attract other investors.
INVESTING IN SILVER EqUITIES
Investors find silver equities interesting as alternatives to gold shares. Given silver’s more volatile nature, some investors think of silver mining equities as high-octane gold shares.
Gold mining shares
have offered handsome
riches and rewards
to investors since
the middle of the
19th century.
�
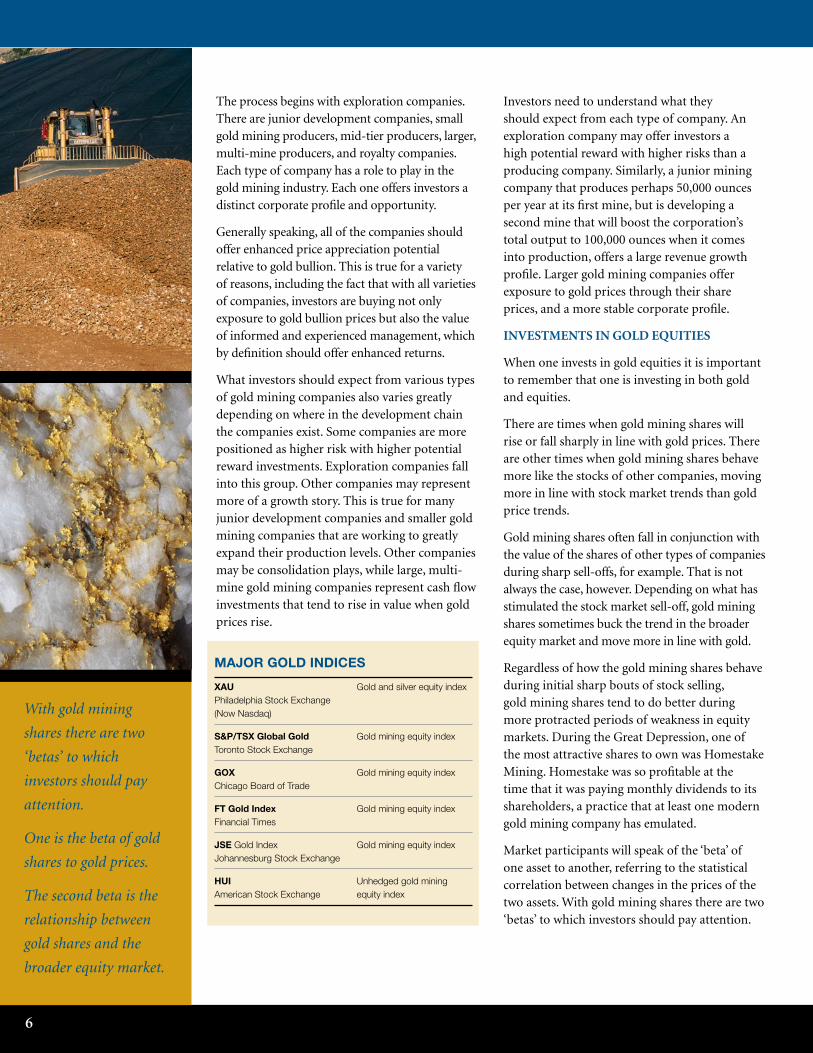
The process begins with exploration companies. There are junior development companies, small gold mining producers, mid-tier producers, larger, multi-mine producers, and royalty companies. Each type of company has a role to play in the gold mining industry. Each one offers investors a distinct corporate profile and opportunity.
Generally speaking, all of the companies should offer enhanced price appreciation potential relative to gold bullion. This is true for a variety of reasons, including the fact that with all varieties of companies, investors are buying not only exposure to gold bullion prices but also the value of informed and experienced management, which by definition should offer enhanced returns.
What investors should expect from various types of gold mining companies also varies greatly depending on where in the development chain the companies exist. Some companies are more positioned as higher risk with higher potential reward investments. Exploration companies fall into this group. Other companies may represent more of a growth story. This is true for many junior development companies and smaller gold mining companies that are working to greatly expand their production levels. Other companies may be consolidation plays, while large, multi-mine gold mining companies represent cash flow investments that tend to rise in value when gold prices rise.
Investors need to understand what they should expect from each type of company. An exploration company may offer investors a high potential reward with higher risks than a producing company. Similarly, a junior mining company that produces perhaps 50,000 ounces per year at its first mine, but is developing a second mine that will boost the corporation’s total output to 100,000 ounces when it comes into production, offers a large revenue growth profile. Larger gold mining companies offer exposure to gold prices through their share prices, and a more stable corporate profile.
Investments In Gold equItIes
When one invests in gold equities it is important to remember that one is investing in both gold and equities.
There are times when gold mining shares will rise or fall sharply in line with gold prices. There are other times when gold mining shares behave more like the stocks of other companies, moving more in line with stock market trends than gold price trends.
Gold mining shares often fall in conjunction with the value of the shares of other types of companies during sharp sell-offs, for example. That is not always the case, however. Depending on what has stimulated the stock market sell-off, gold mining shares sometimes buck the trend in the broader equity market and move more in line with gold.
Regardless of how the gold mining shares behave during initial sharp bouts of stock selling, gold mining shares tend to do better during more protracted periods of weakness in equity markets. During the Great Depression, one of the most attractive shares to own was Homestake Mining. Homestake was so profitable at the time that it was paying monthly dividends to its shareholders, a practice that at least one modern gold mining company has emulated.
Market participants will speak of the ‘beta’ of one asset to another, referring to the statistical correlation between changes in the prices of the two assets. With gold mining shares there are two ‘betas’ to which investors should pay attention.
Major Gold IndIces
XaU GoldandsilverequityindexPhiladelphiaStockExchange(NowNasdaq)
s&P/TsXGlobal Gold GoldminingequityindexTorontoStockExchange
GoX GoldminingequityindexChicagoBoardofTrade
FT Gold Index GoldminingequityindexFinancialTimes
jse GoldIndex GoldminingequityindexJohannesburgStockExchange
HUI UnhedgedgoldminingAmericanStockExchange equityindex
With gold mining
shares there are two
‘betas’ to which
investors should pay
attention.
One is the beta of gold
shares to gold prices.
The second beta is the
relationship between
gold shares and the
broader equity market.
�
One is the beta of gold shares to gold prices. This relationship will vary from company to company, but on average gold mining shares tend to rise and fall in a more volatile fashion than do gold prices themselves. In this way, investors find that owning gold mining shares will increase their potential return, since gold share prices typically will rise more than gold bullion when prices are rising. If a gold mining share has a beta of 3:1 to gold prices, investors would expect that a 10% increase in gold prices should be reflected in a 30% increase in the gold mining share.
The relationship does not always hold, and can diverge from its historical norm by a wide degree, but generally speaking the relationship between gold prices and gold mining shares’ values has come back into alignment. Throughout much of the 1990s, for example, gold mining shares outperformed gold bullion prices. In late 2008 the reverse was true, and it appeared to some observers that the relationship had broken down. Most veterans of the gold share markets expected the divergence to reverse at some point. Some were expecting gold shares to outperform gold over the following several years, both as shares restore their most typical historical relationship to gold prices, and as the dynamics of mine production trends in gold, and the overall gold market could shift in a way in which gold shares outperform gold for a time. Accordingly, some investors were shifting out of gold into gold shares in late 2008.
The second beta is the relationship between gold shares and the broader equity market. As mentioned above, it is important to always remember that gold shares are shares. During periods of sharp movements in stock markets — upward or downward — gold mining shares behave more like the shares of other companies, participating in the moves. At other times, when gold market developments and price trends are exerting greater influence, gold mining shares will perform more in line with gold bullion prices than with broader equity markets.
ThE DEVELOpmENT ChAIN
The differences among the different types of exploration and mining companies are important enough to come back to. Investors must keep in
mind a company’s stage of development. The expectations for returns on one’s investments are radically different depending on this.
For example, exploration companies typically do not have large asset bases. They generally do not have large reserves and resources of ore proven up. They do not generate cash flow from their operations, but fund their operations through a combination of selling equity to investors and selling discoveries that they make to companies that will bring the mines into production.
This is in stark contrast to companies that are in production, which not only have reserves and resources, but are using them on an ongoing basis as they mine. Mining companies offer investors the potential to benefit from rising prices due to their operating leverage.
Meanwhile, royalty companies have developed to help provide financing to exploration and development companies, providing another source of capital early in the development cycle, taking some of the risks of investing in exchange for providing financing, while taking a portion of future revenues as their reward.
Royalty companies allow investors to participate in upward movements of gold prices without the risks of capital, labor, environmental issues, country risks, and managerial issues.
DIVERSIfY
The first section of this report discussed how savvy investors diversify their portfolios by including gold and other precious metals investments as an ongoing part of their portfolio. It discussed the concept of how some investors diversify their precious metals investments even further, by diversifying across gold, silver, platinum, and palladium, and by investing in a range of precious metals investment products, from bullion to options and mining equities.
In the same way, most mining share investors diversify their portfolios by including major companies and mid-tier producers as the core of their mining share portfolio while also holding shares of higher risk/higher reward exploration and junior mining companies.

Concern has been expressed that the world cannot continue to produce gold at the rate that it has been over the past decade, that mine production on a global basis must decline, and that gold mining companies will suffer from shrinking production and reduced growth prospects. These comments appear to be grounded in an incomplete understanding of the nature, dynamics, and mechanics of the gold mining industry.
Gold mine output more than doubled between 1980 and 1999. That is in stark contrast to opinions in 1980. Gold prices were at historically record high prices that year. The general consensus was that gold mine production could not expand dramatically from the 30.5 million ounces per year then being mined worldwide and would decline in the years ahead. Around 71% of world mine production at that time came from 36 mines run by six mining houses in South Africa. There were a handful of Canadian gold mining companies, one U.S. gold mining company, and less than one million ounces of gold produced annually in Australia.
Instead, within a few years gold mining entered into the era of greatest growth in history. South African production continued to decline, as had been expected, but gold mining boomed in Canada, the United States, Australia, and dozens of other countries around the world. Almost all of the growth came from companies that either
did not exist or were not gold mining companies in 1980. The structure of the gold mining industry continues to change with increasing production coming from Asia.
This is the nature of gold mining. Much of the growth starts with exploration and development companies, and smaller and medium sized producers. As they discover large properties, the properties, if not the mining companies themselves, get absorbed into larger gold mining companies that have the managerial, technical, and financial resources to develop and operate large mines. The entrepreneurs that ran the smaller companies create new companies to do what they do best: find new gold deposits.
In the last three decades, there have been periodic episodes in which the gold mining industry was said to be on the precipice of steep declines. Each time, the news of the demise of gold mining was premature, followed by a renaissance in output.
The same should be expected in the years ahead. There are vast tracts of land around the world that have not been explored for gold, on which world class deposits should be expected to be discovered. Additional growth will come from established gold mining districts. The future of gold mining is extremely promising, with a full range of companies likely to participate in the next round of growth.
GOLD mINING IS A GROWTh INDUSTRY
0
100
200
300
400
500
600
700
800
900
1000
68 70 72 74 76 78 80 82 84 86 88 90 92 94 96 98 00 02 04 06 080
100
200
300
400
500
600
700
800
900
1000
0102030405060708090
100110120
73 75 77 79 81 83 85 87 89 91 93 95 97 99 01 03 05 070102030405060708090100110120
1. THE PRICE OF GOLD Monthly Average London PM Fix, Through October 2008
$/Ounce$/Ounce
ANNUAL TOTAL SUPPLYProjected Through 2008
Million OuncesMillion Ounces
Secondary Supply
Transitional Economies
South African Mine Production
Other Mine Production
The future of gold mining is extremely promising, with a full range of companies likely to participate in the next round of growth.
�
9
Denver Gold Group Corporate members: (As of January 2009)
DENVER GOLD GROUp mEmBERS
Agnico-Eagle Mines LimitedAlamos Gold Inc.Anatolia MineralsAngloGold Ashanti LimitedApex Silver Mines LimitedApollo GoldAtna Resources Ltd.Aurizon Mines Ltd.Banro Resource CorporationBarrick Gold CorporationBrazauro Resources, Inc.Capital Gold CorporationCenterra Gold Inc.Cia. de Minas BuenaventuraCoeur d’Alene Mines CorporationCrystallex International CorporationDundee Precious Metals Inc.Eldorado Gold CorporationEndeavour Silver Corp.Esperanza Silver Corp.Franco-Nevada CorporationFreeport-McMoRan Copper & Gold Inc.Gabriel Resources LimitedGammon Gold Inc.Gold Fields LimitedGold Reserve, Inc.Goldcorp, Inc.Golden Star Resources Ltd.Harmony Gold Mining CompanyHecla Mining CompanyIAMGOLD CorporationInternational Minerals CorporationInternational Royalty CorporationIvanhoe Mines LimitedJaguar Mining Inc.
Kingsgate Consolidated LimitedKinross Gold CorporationLihir Gold Ltd.Minefinders CorporationNevsun Resources Ltd.New Gold Inc.Newcrest Mining LimitedNewmont Mining CorporationNorth American Palladium Ltd.Northgate Minerals CorporationNovaGold ResourcesOceanaGoldOsisko Mining Corp.Pacific Northwest Capital Corp.Pacific Rim Mining CorporationPan American Silver Corp.PolymetalPolyus GoldRandgold Resources Ltd.Red Back MiningRomarco MineralsRoyal Gold, Inc.Seabridge Gold, Inc.Semafo Inc.Silver Standard ResourcesSilver WheatonSino GoldSolitario Exploration & Royalty Corp.Stillwater Mining CompanyU.S. Gold CorporationVista Gold CorporationWesdome Gold Mines Ltd.Yamana GoldYukon Nevada Gold
Acknowledgement
The Denver Gold Group would like to thank CPM Group for its contributions in producing this report. CPM Group is an independent precious metals and commodities research and consulting firm that provides a range of services including basic market research and analysis, financial services, investment banking, and commodities management services to producers, users, investors, governments, and others interested in commodities. The company produces the CPM Gold, Silver, and Platinum Group Metals Yearbooks as well as weekly, monthly, and long-term reports on these markets. For additional information, visit www.cpmgroup.com.
Photographs by Graeme Oxby Photography.
DENVER GOLD GROUP
1989-200920 years ofexcellence
I N V E S T I N G I N G O L D
1675 Larimer StreetSuite 530Denver, CO 80202 USA
phone: 303.825.3368fax: 303.534.5423www.denvergold.org