Embed Size (px)
Citation preview
Investing in ArgentinaIndustry Approach
Financial Advisory Services Argentina
November 2017

© 2017 Deloitte & Co. S.A. All rights reserved.
Content
• Argentina – Country’s Overview
• Industry Snapshot
• Consumer Goods & Retail: Food, Beverages & Tobacco
• Financial Services
• Agribusiness
• Telecommunications, Media & Technology
• Energy
ArgentinaCountry’s Overview

Politic Regime
ArgentinaPolitic Regime
Source: National Investment and Trade Promotion Agency information.
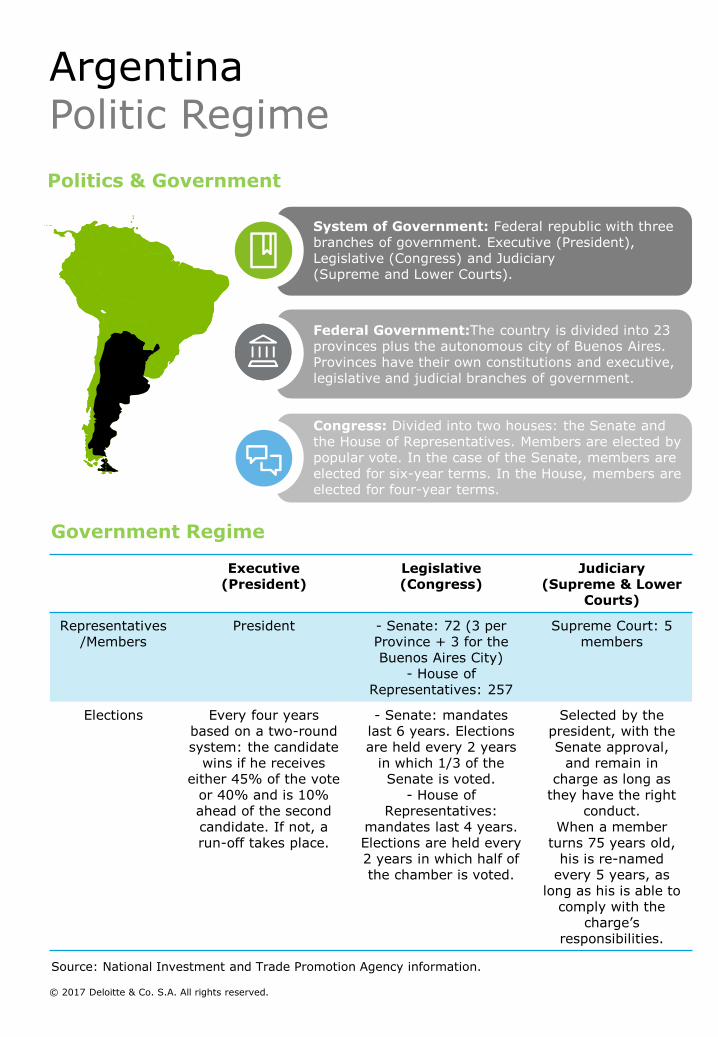
System of Government: Federal republic with three branches of government. Executive (President), Legislative (Congress) and Judiciary(Supreme and Lower Courts).
Congress: Divided into two houses: the Senate and the House of Representatives. Members are elected by popular vote. In the case of the Senate, members are elected for six-year terms. In the House, members are elected for four-year terms.
Federal Government:The country is divided into 23 provinces plus the autonomous city of Buenos Aires. Provinces have their own constitutions and executive, legislative and judicial branches of government.
Politics & Government
Executive (President)
Legislative (Congress)
Judiciary (Supreme & Lower
Courts)
Representatives/Members
President - Senate: 72 (3 per Province + 3 for the Buenos Aires City)
- House of Representatives: 257
Supreme Court: 5 members
Elections Every four years based on a two-round system: the candidate
wins if he receives either 45% of the vote
or 40% and is 10% ahead of the second candidate. If not, a run-off takes place.
- Senate: mandateslast 6 years. Elections are held every 2 years
in which 1/3 of the Senate is voted.
- House of Representatives:
mandates last 4 years. Elections are held every 2 years in which half of the chamber is voted.
Selected by the president, with the Senate approval,
and remain in charge as long as
they have the right conduct.
When a member turns 75 years old,
his is re-named every 5 years, as
long as his is able to comply with the
charge’s responsibilities.
Government Regime
© 2017 Deloitte & Co. S.A. All rights reserved.

Macroeconomic Factors
ArgentinaMacroeconomic Factors (1/2)
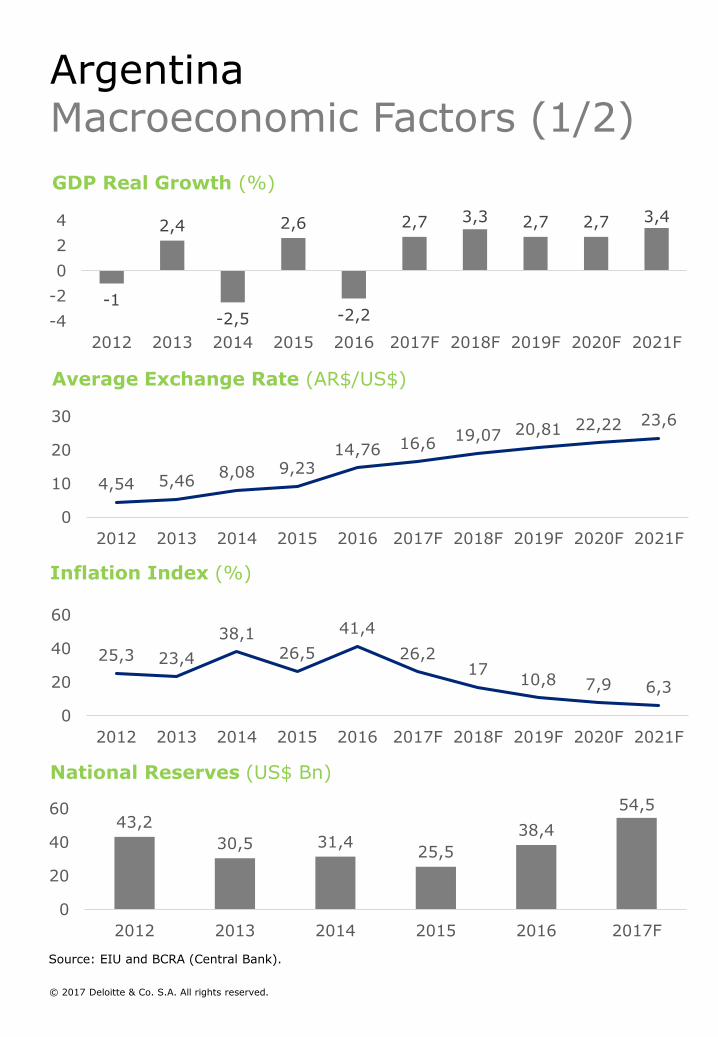
GDP Real Growth (%)
-1
2,4
-2,5
2,6
-2,2
2,7 3,3 2,7 2,7 3,4
-4
-2
0
2
4
2012 2013 2014 2015 2016 2017F 2018F 2019F 2020F 2021F
Average Exchange Rate (AR$/US$)
4,54 5,468,08 9,23
14,76 16,619,07 20,81 22,22 23,6
0
10
20
30
2012 2013 2014 2015 2016 2017F 2018F 2019F 2020F 2021F
Inflation Index (%)
25,3 23,4
38,1
26,5
41,4
26,217
10,8 7,9 6,3
0
20
40
60
2012 2013 2014 2015 2016 2017F 2018F 2019F 2020F 2021F
Source: EIU and BCRA (Central Bank).
National Reserves (US$ Bn)
43,2
30,5 31,425,5
38,4
54,5
0
20
40
60
2012 2013 2014 2015 2016 2017F
© 2017 Deloitte & Co. S.A. All rights reserved.
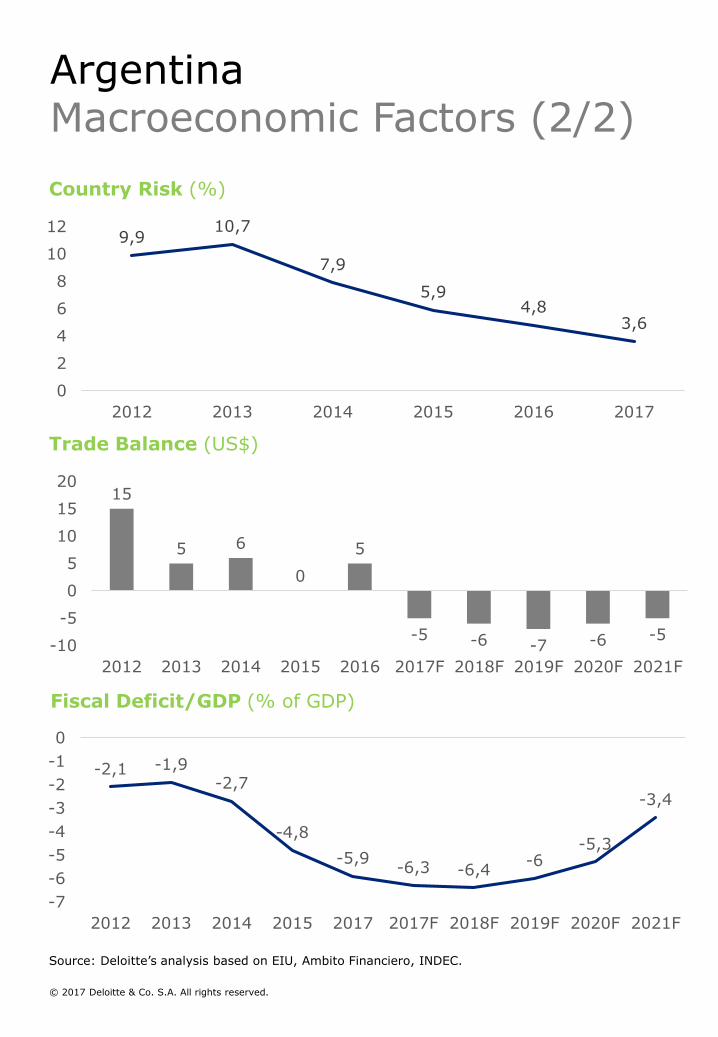
Country Risk (%)
Fiscal Deficit/GDP (% of GDP)
Trade Balance (US$)
9,910,7
7,9
5,94,8
3,6
0
2
4
6
8
10
12
2012 2013 2014 2015 2016 2017
15
5 6
0
5
-5 -6 -7 -6 -5-10
-5
0
5
10
15
20
2012 2013 2014 2015 2016 2017F 2018F 2019F 2020F 2021F
Source: Deloitte’s analysis based on EIU, Ambito Financiero, INDEC.
-2,1 -1,9-2,7
-4,8
-5,9-6,3 -6,4
-6-5,3
-3,4
-7
-6
-5
-4
-3
-2
-1
0
2012 2013 2014 2015 2017 2017F 2018F 2019F 2020F 2021F
© 2017 Deloitte & Co. S.A. All rights reserved.
ArgentinaMacroeconomic Factors (2/2)
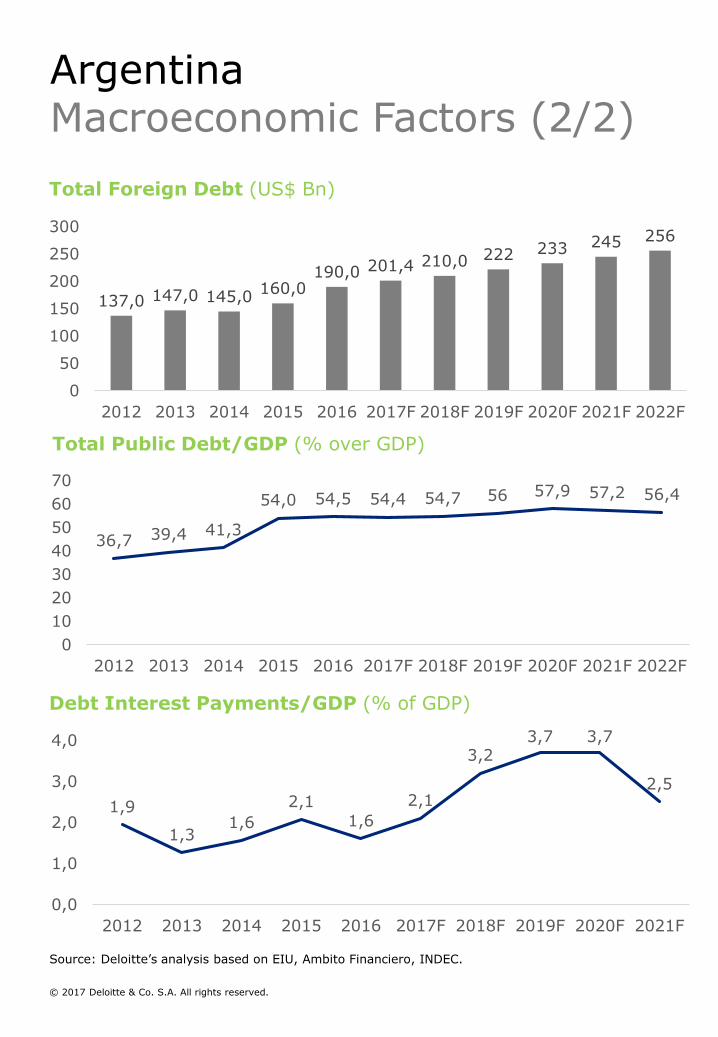
Total Foreign Debt (US$ Bn)
Debt Interest Payments/GDP (% of GDP)
Total Public Debt/GDP (% over GDP)
137,0 147,0 145,0160,0
190,0 201,4 210,0 222 233 245 256
0
50
100
150
200
250
300
2012 2013 2014 2015 2016 2017F 2018F 2019F 2020F 2021F 2022F
36,7 39,4 41,3
54,0 54,5 54,4 54,7 56 57,9 57,2 56,4
0
10
20
30
40
50
60
70
2012 2013 2014 2015 2016 2017F 2018F 2019F 2020F 2021F 2022F
Source: Deloitte’s analysis based on EIU, Ambito Financiero, INDEC.
1,9
1,31,6
2,11,6
2,1
3,23,7 3,7
2,5
0,0
1,0
2,0
3,0
4,0
2012 2013 2014 2015 2016 2017F 2018F 2019F 2020F 2021F
© 2017 Deloitte & Co. S.A. All rights reserved.
ArgentinaMacroeconomic Factors (2/2)

Economic Sectors
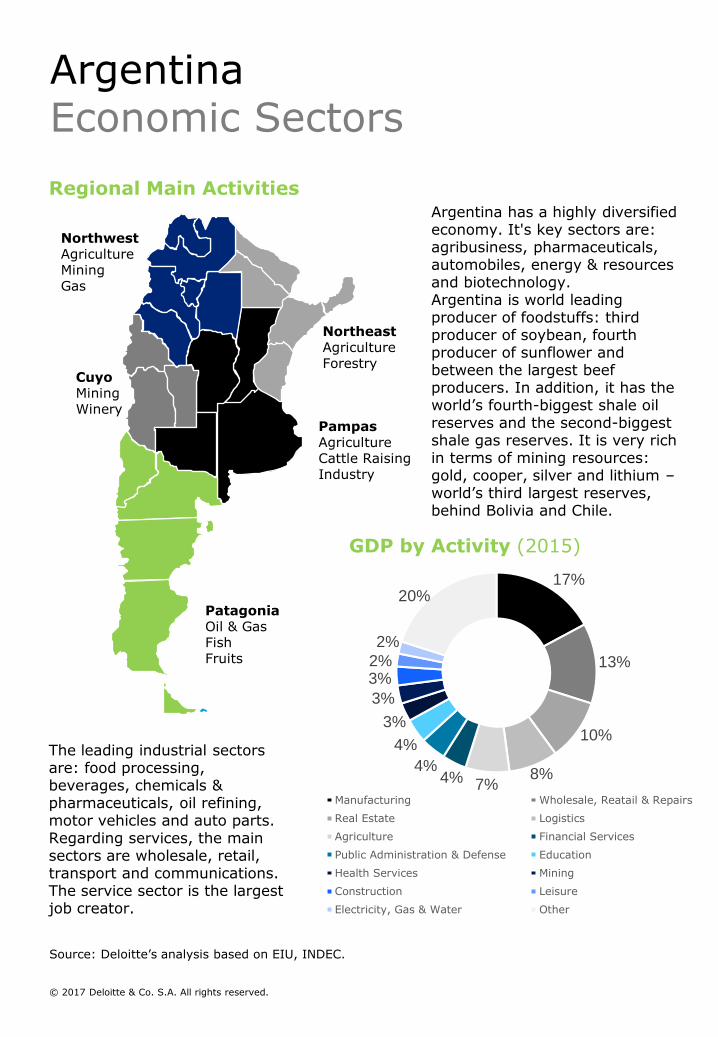
Regional Main Activities
Source: Deloitte’s analysis based on EIU, INDEC.
GDP by Activity (2015)
PatagoniaOil & GasFishFruits
PampasAgricultureCattle RaisingIndustry
NortheastAgricultureForestry
NorthwestAgricultureMiningGas
CuyoMiningWinery
17%
13%
10%
8%7%4%
4%
4%
3%
3%
3%2%
2%
20%
Manufacturing Wholesale, Reatail & Repairs
Real Estate Logistics
Agriculture Financial Services
Public Administration & Defense Education
Health Services Mining
Construction Leisure
Electricity, Gas & Water Other
Argentina has a highly diversified economy. It's key sectors are: agribusiness, pharmaceuticals, automobiles, energy & resources and biotechnology. Argentina is world leading producer of foodstuffs: third producer of soybean, fourth producer of sunflower and between the largest beef producers. In addition, it has the world’s fourth-biggest shale oil reserves and the second-biggest shale gas reserves. It is very rich in terms of mining resources: gold, cooper, silver and lithium –world’s third largest reserves, behind Bolivia and Chile.
The leading industrial sectors are: food processing, beverages, chemicals & pharmaceuticals, oil refining, motor vehicles and auto parts.Regarding services, the main sectors are wholesale, retail, transport and communications. The service sector is the largest job creator.
ArgentinaEconomic Sectors
© 2017 Deloitte & Co. S.A. All rights reserved.

Investment Activity & Foreign Trade
ArgentinaInvestment Activity
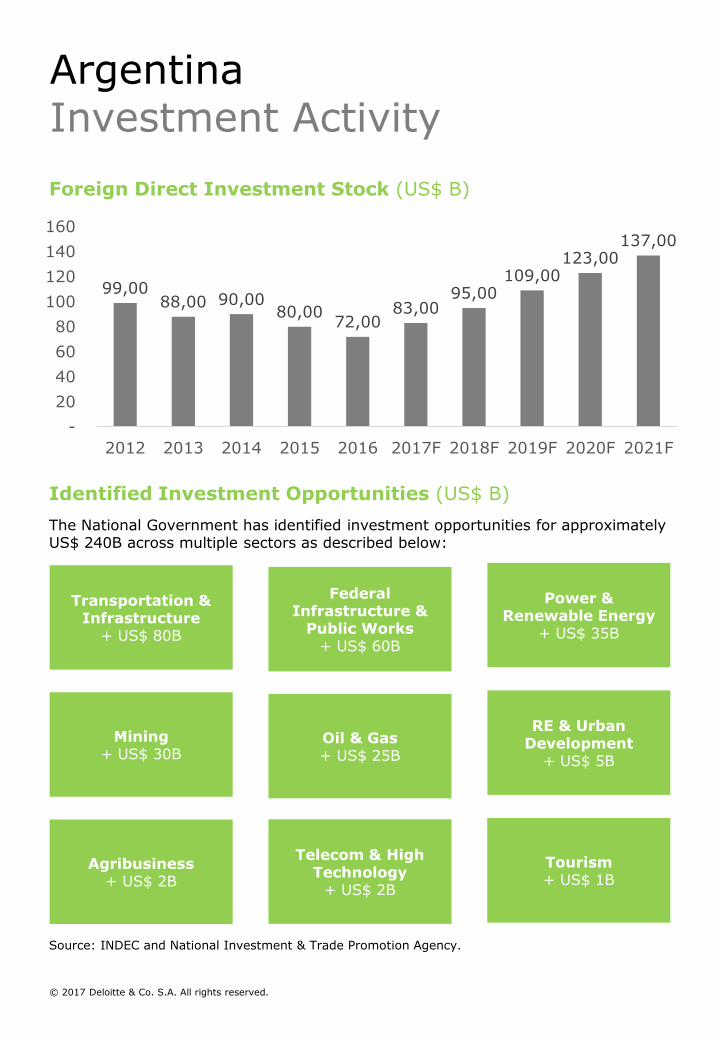
Foreign Direct Investment Stock (US$ B)
Source: INDEC and National Investment & Trade Promotion Agency.
99,0088,00 90,00
80,0072,00
83,0095,00
109,00123,00
137,00
-
20
40
60
80
100
120
140
160
2012 2013 2014 2015 2016 2017F 2018F 2019F 2020F 2021F
Identified Investment Opportunities (US$ B)
The National Government has identified investment opportunities for approximately US$ 240B across multiple sectors as described below:
Transportation & Infrastructure
+ US$ 80B
Federal Infrastructure &
Public Works+ US$ 60B
Power & Renewable Energy
+ US$ 35B
Mining+ US$ 30B
Oil & Gas+ US$ 25B
RE & Urban Development
+ US$ 5B
Agribusiness+ US$ 2B
Telecom & High Technology
+ US$ 2B
Tourism+ US$ 1B
© 2017 Deloitte & Co. S.A. All rights reserved.
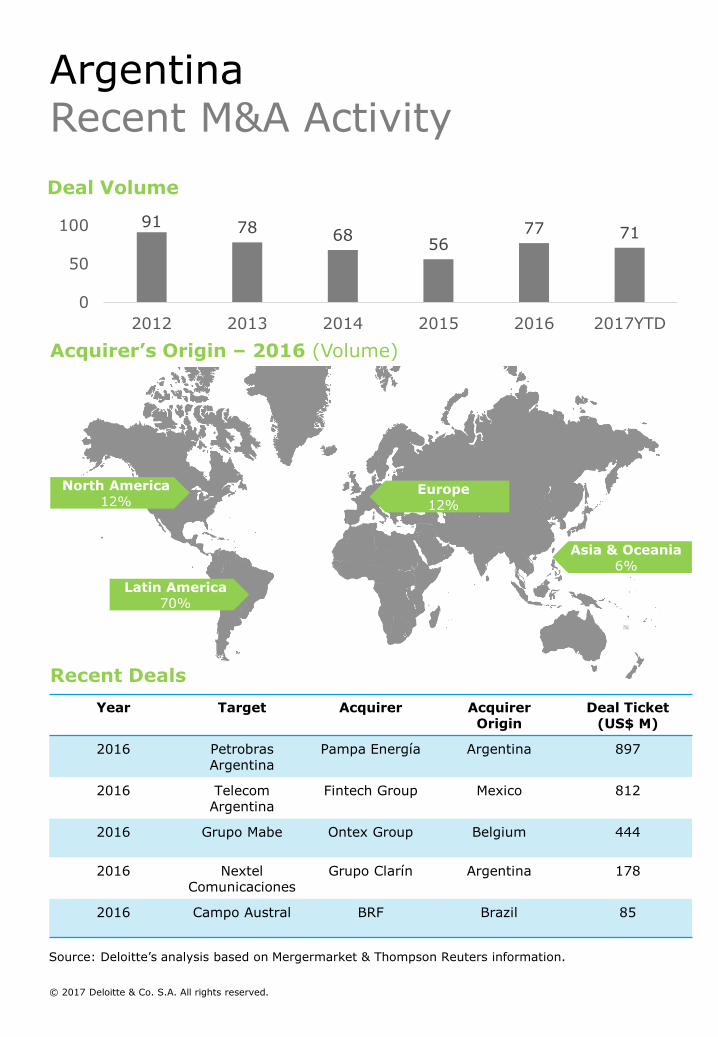
Year Target Acquirer Acquirer Origin
Deal Ticket (US$ M)
2016 Petrobras Argentina
Pampa Energía Argentina 897
2016 Telecom Argentina
Fintech Group Mexico 812
2016 Grupo Mabe Ontex Group Belgium 444
2016 Nextel Comunicaciones
Grupo Clarín Argentina 178
2016 Campo Austral BRF Brazil 85
91 78 6856
77 71
0
50
100
2012 2013 2014 2015 2016 2017YTD
Deal Volume
Acquirer’s Origin – 2016 (Volume)
North America12%
Latin America70%
Asia & Oceania6%
Europe12%
Recent Deals
Source: Deloitte’s analysis based on Mergermarket & Thompson Reuters information.
ArgentinaRecent M&A Activity
© 2017 Deloitte & Co. S.A. All rights reserved.
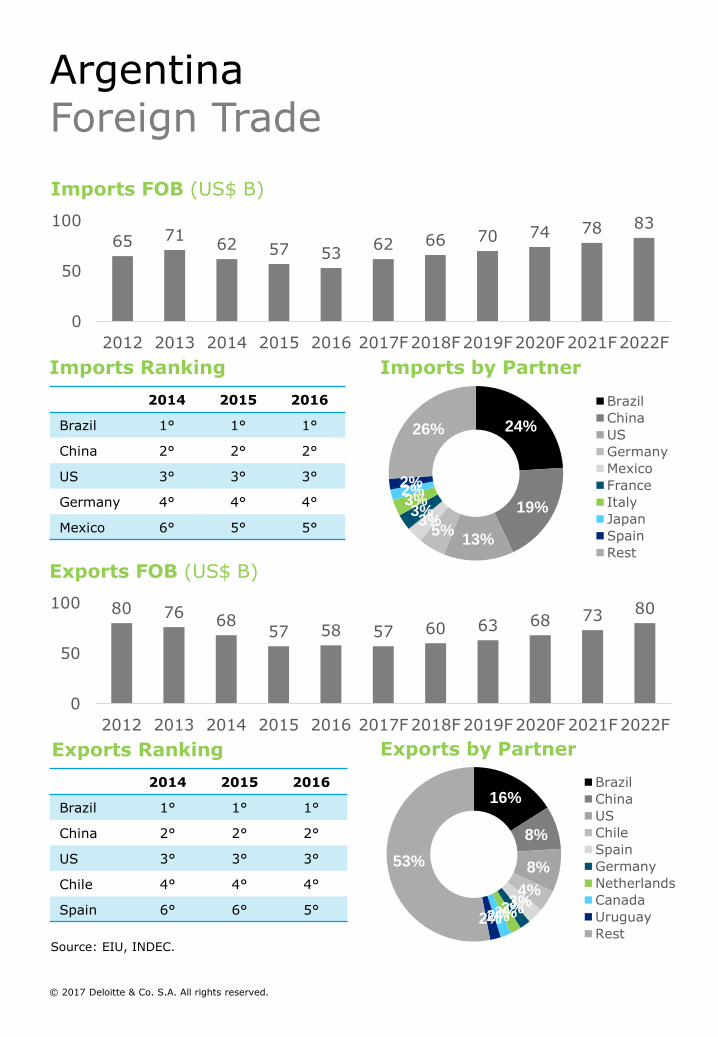
65 7162 57 53
62 66 70 74 78 83
0
50
100
2012 2013 2014 2015 2016 2017F2018F2019F2020F2021F2022F
Imports FOB (US$ B)
2014 2015 2016
Brazil 1° 1° 1°
China 2° 2° 2°
US 3° 3° 3°
Germany 4° 4° 4°
Mexico 6° 5° 5°
Imports Ranking
80 7668
57 58 57 60 63 68 73 80
0
50
100
2012 2013 2014 2015 2016 2017F2018F2019F2020F2021F2022F
Exports FOB (US$ B)
2014 2015 2016
Brazil 1° 1° 1°
China 2° 2° 2°
US 3° 3° 3°
Chile 4° 4° 4°
Spain 6° 6° 5°
Exports Ranking
24%
19%
13%5%
3%3%
3%2%2%
26%
Brazil
China
US
Germany
Mexico
France
Italy
Japan
Spain
Rest
Imports by Partner
Exports by Partner
16%
8%
8%
4%3%2%2%2%2%
53%
Brazil
China
US
Chile
Spain
Germany
Netherlands
Canada
Uruguay
RestSource: EIU, INDEC.
ArgentinaForeign Trade
© 2017 Deloitte & Co. S.A. All rights reserved.

Demographics
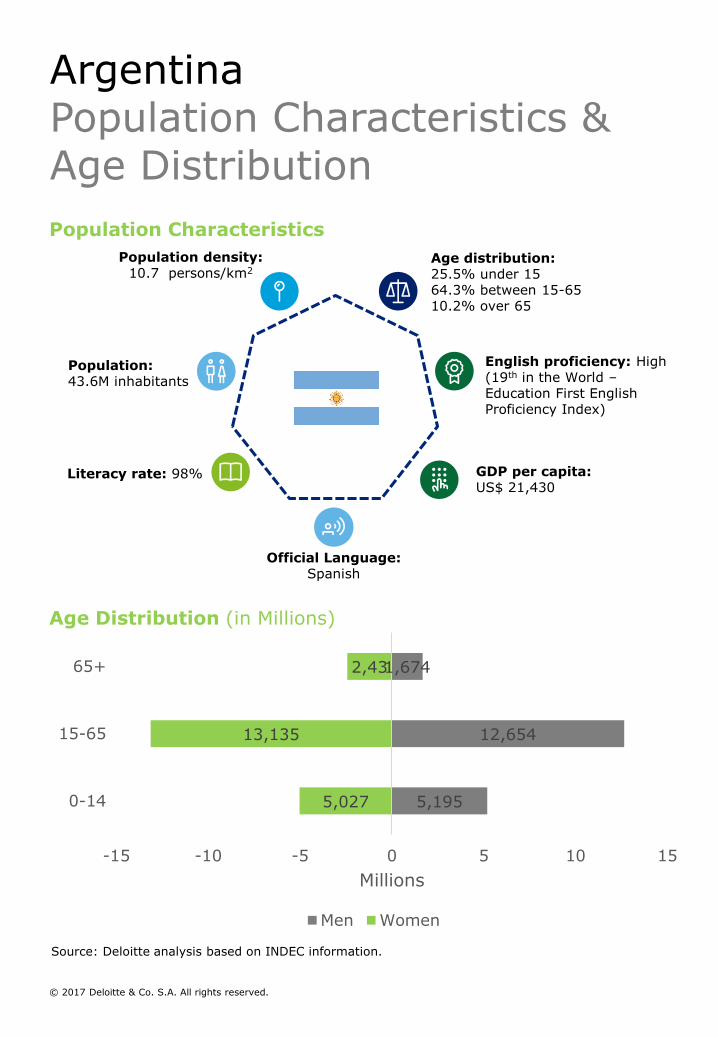
Source: Deloitte analysis based on INDEC information.
Population:43.6M inhabitants
Population density:10.7 persons/km2
Age distribution:25.5% under 1564.3% between 15-6510.2% over 65
Literacy rate: 98%
English proficiency: High (19th in the World –Education First English Proficiency Index)
GDP per capita:US$ 21,430
Official Language:Spanish
Population Characteristics
Age Distribution (in Millions)
5,195
12,654
1,674
5,027
13,135
2,43
-15 -10 -5 0 5 10 15
0-14
15-65
65+
Millions
Men Women
© 2017 Deloitte & Co. S.A. All rights reserved.
ArgentinaPopulation Characteristics & Age Distribution
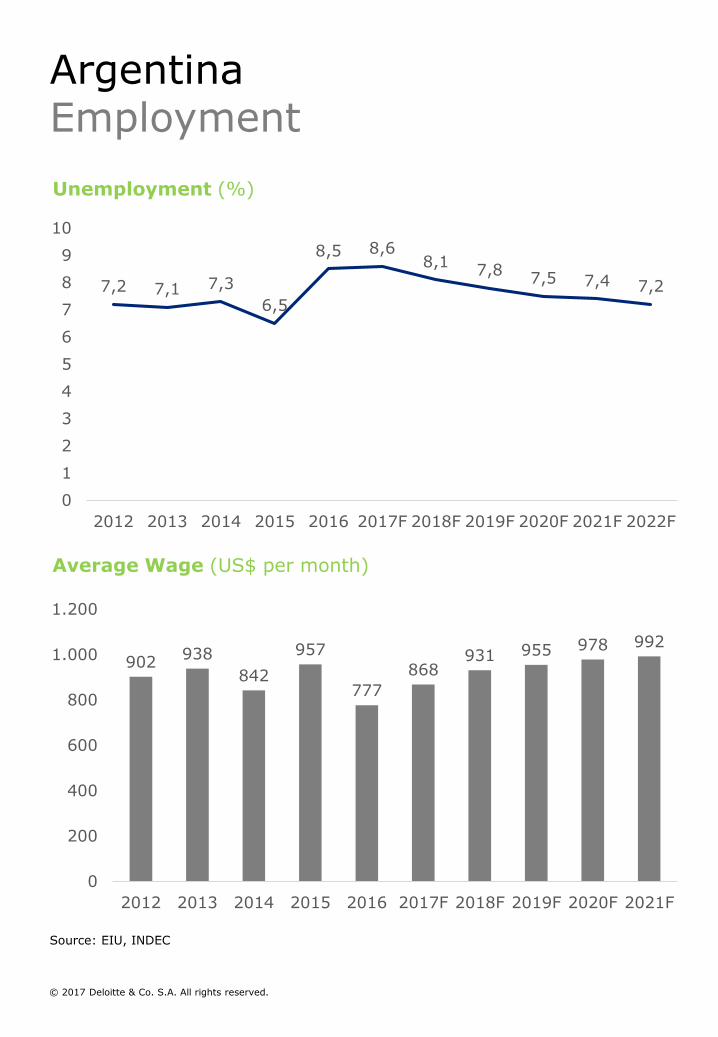
Unemployment (%)
Source: EIU, INDEC
7,2 7,1 7,3
6,5
8,5 8,68,1
7,87,5 7,4 7,2
0
1
2
3
4
5
6
7
8
9
10
2012 2013 2014 2015 2016 2017F 2018F 2019F 2020F 2021F 2022F
Average Wage (US$ per month)
902938
842
957
777
868931 955 978 992
0
200
400
600
800
1.000
1.200
2012 2013 2014 2015 2016 2017F 2018F 2019F 2020F 2021F
ArgentinaEmployment
© 2017 Deloitte & Co. S.A. All rights reserved.
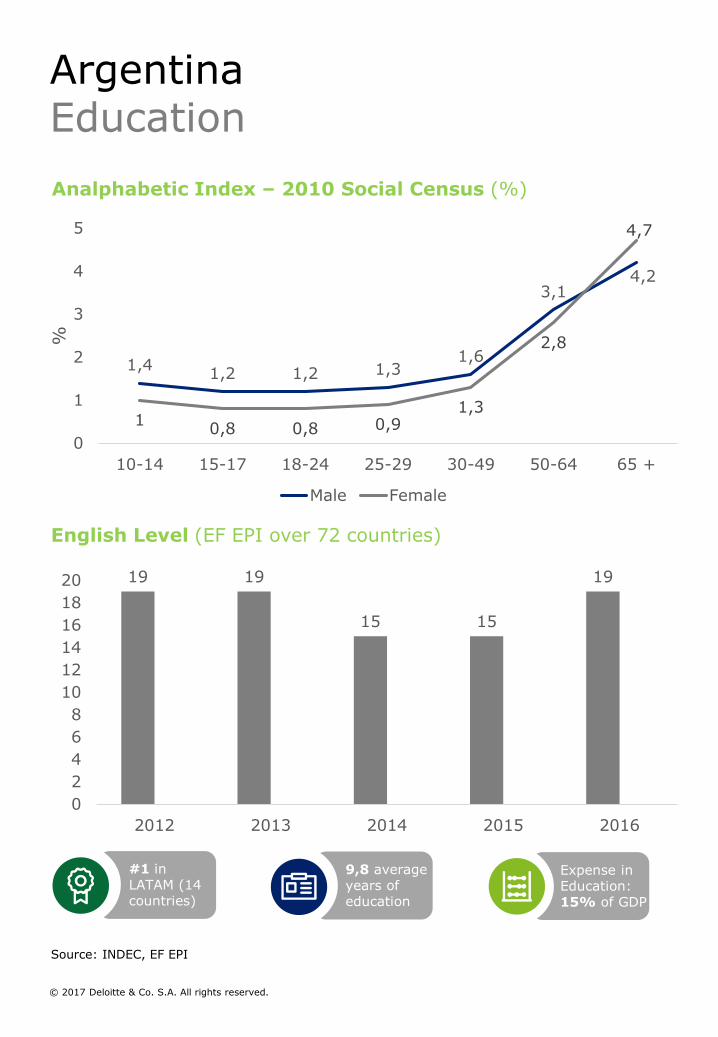
Analphabetic Index – 2010 Social Census (%)
Source: INDEC, EF EPI
English Level (EF EPI over 72 countries)
19 19
15 15
19
0
2
4
6
8
10
12
14
16
18
20
2012 2013 2014 2015 2016
#1 in LATAM (14 countries)
9,8 average years of education
Expense in Education: 15% of GDP
1,41,2 1,2 1,3
1,6
3,14,2
10,8 0,8 0,9
1,3
2,8
4,7
0
1
2
3
4
5
10-14 15-17 18-24 25-29 30-49 50-64 65 +
%
Male Female
ArgentinaEducation
© 2017 Deloitte & Co. S.A. All rights reserved.

Infrastructure
Source: INDEC, IGN.
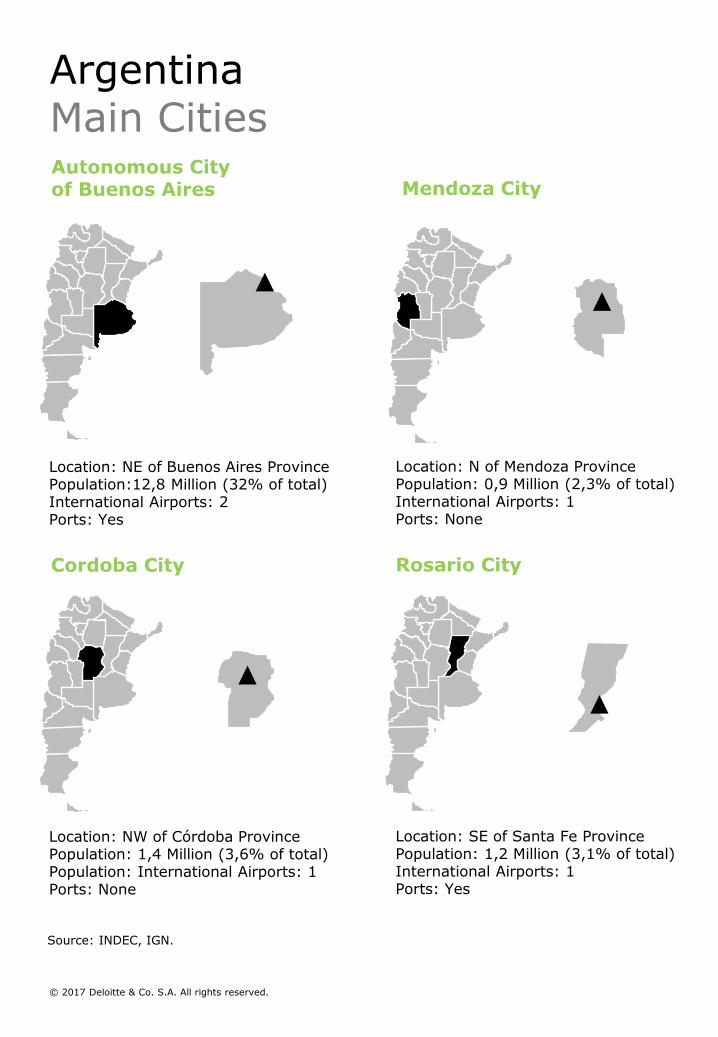
Autonomous City of Buenos Aires Mendoza City
Cordoba City Rosario City
Location: NE of Buenos Aires ProvincePopulation:12,8 Million (32% of total)International Airports: 2Ports: Yes
Location: N of Mendoza ProvincePopulation: 0,9 Million (2,3% of total)International Airports: 1Ports: None
Location: NW of Córdoba ProvincePopulation: 1,4 Million (3,6% of total)Population: International Airports: 1Ports: None
Location: SE of Santa Fe ProvincePopulation: 1,2 Million (3,1% of total)International Airports: 1Ports: Yes
ArgentinaMain Cities
© 2017 Deloitte & Co. S.A. All rights reserved.
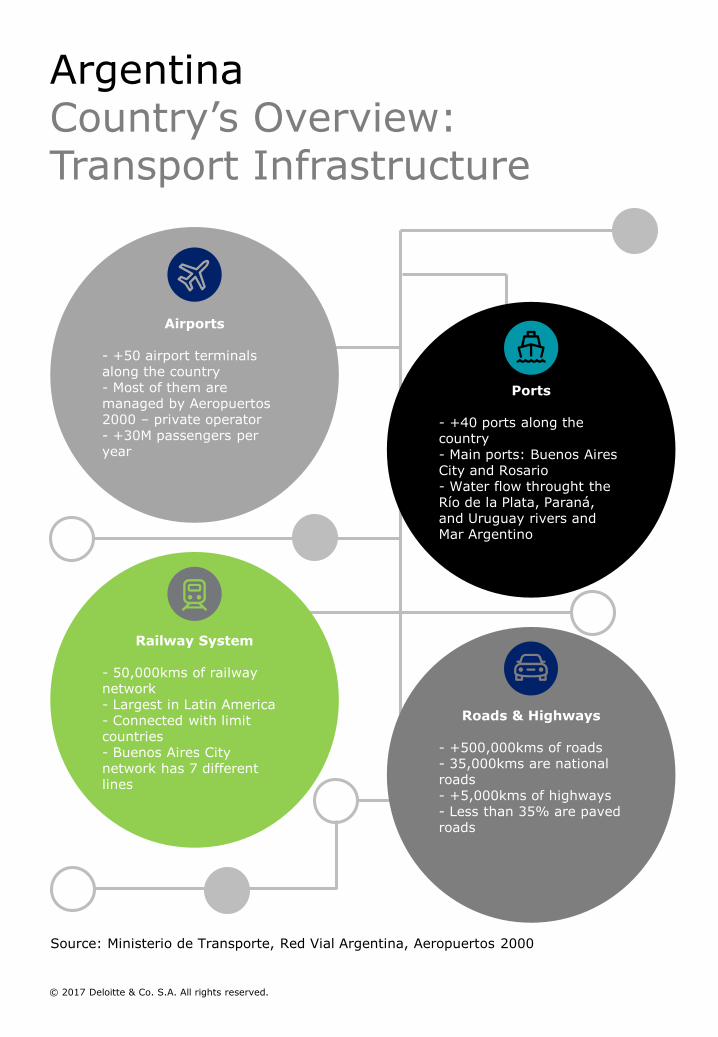
Source: Ministerio de Transporte, Red Vial Argentina, Aeropuertos 2000
Airports
- +50 airport terminals along the country- Most of them are managed by Aeropuertos2000 – private operator- +30M passengers per year
Ports
- +40 ports along the country- Main ports: Buenos Aires City and Rosario- Water flow throught the Río de la Plata, Paraná, and Uruguay rivers and Mar Argentino
Railway System
- 50,000kms of railway network- Largest in Latin America- Connected with limit countries- Buenos Aires City network has 7 different lines
Roads & Highways
- +500,000kms of roads- 35,000kms are national roads- +5,000kms of highways- Less than 35% are paved roads
ArgentinaCountry’s Overview: Transport Infrastructure
© 2017 Deloitte & Co. S.A. All rights reserved.
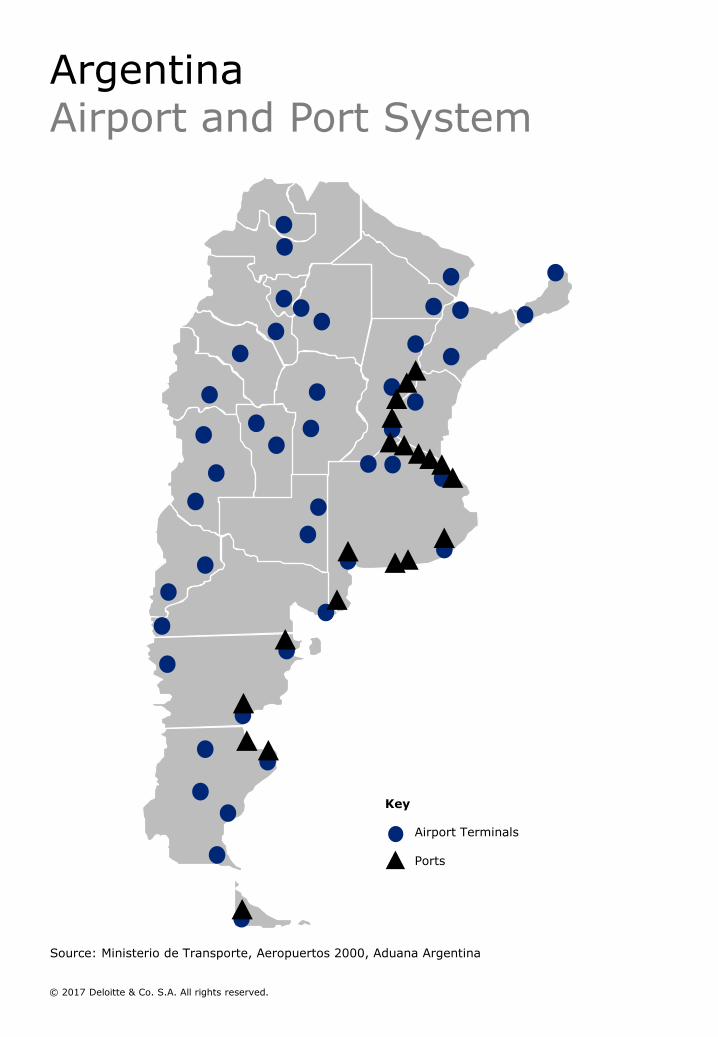
Source: Ministerio de Transporte, Aeropuertos 2000, Aduana Argentina
Airport Terminals
Ports
Key
ArgentinaAirport and Port System
© 2017 Deloitte & Co. S.A. All rights reserved.
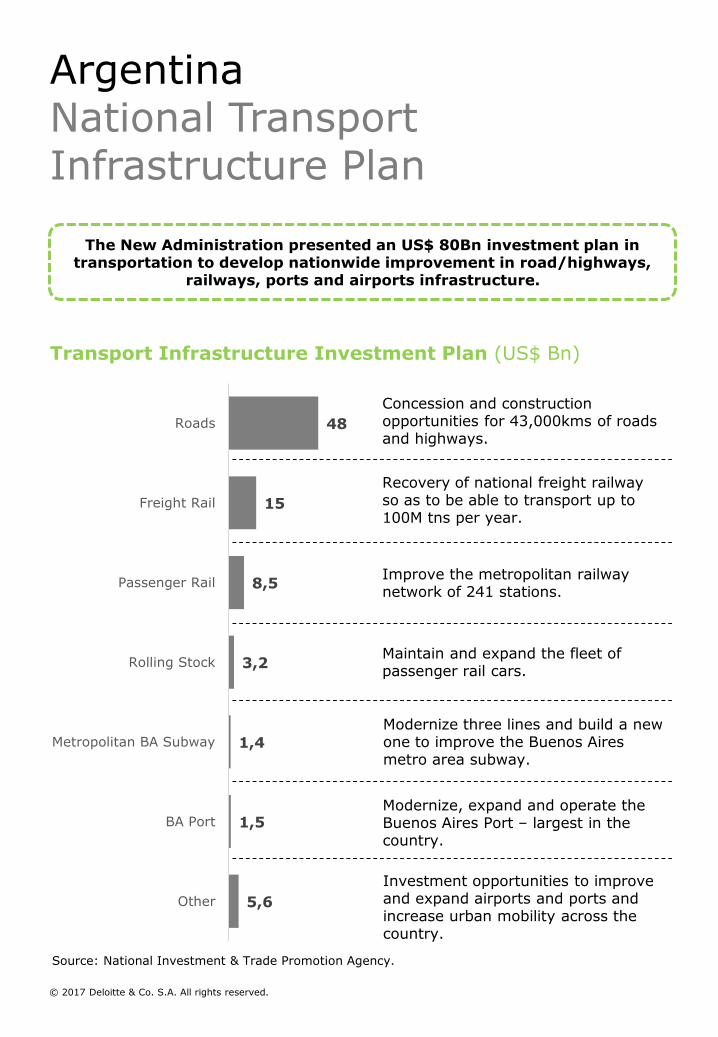
Source: National Investment & Trade Promotion Agency.
The New Administration presented an US$ 80Bn investment plan in transportation to develop nationwide improvement in road/highways,
railways, ports and airports infrastructure.
5,6
1,5
1,4
3,2
8,5
15
48
Other
BA Port
Metropolitan BA Subway
Rolling Stock
Passenger Rail
Freight Rail
Roads
Transport Infrastructure Investment Plan (US$ Bn)
Concession and construction opportunities for 43,000kms of roads and highways.
Recovery of national freight railway so as to be able to transport up to 100M tns per year.
Improve the metropolitan railway network of 241 stations.
Maintain and expand the fleet of passenger rail cars.
Modernize three lines and build a new one to improve the Buenos Aires metro area subway.
Modernize, expand and operate the Buenos Aires Port – largest in the country.
Investment opportunities to improve and expand airports and ports and increase urban mobility across the country.
ArgentinaNational Transport Infrastructure Plan
© 2017 Deloitte & Co. S.A. All rights reserved.

Business Types, Regulatory Framework & Tax System
Source: National Investment & Trade Promotion Agency.
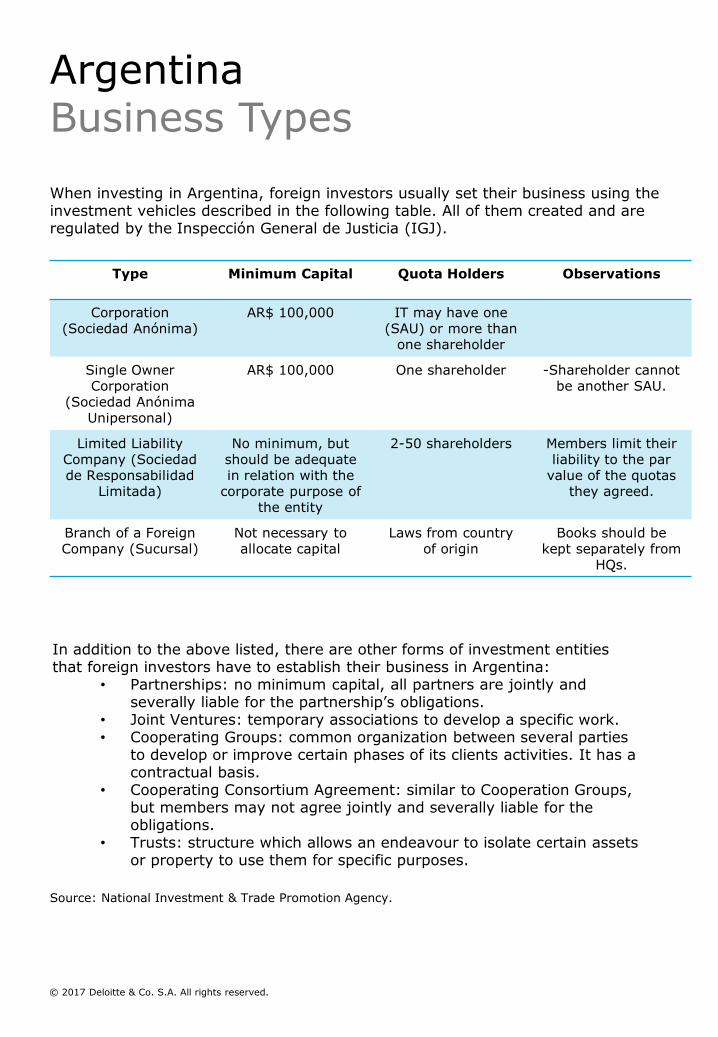
Type Minimum Capital Quota Holders Observations
Corporation (Sociedad Anónima)
AR$ 100,000 IT may have one (SAU) or more than
one shareholder
Single Owner Corporation
(Sociedad AnónimaUnipersonal)
AR$ 100,000 One shareholder -Shareholder cannot be another SAU.
Limited Liability Company (Sociedadde Responsabilidad
Limitada)
No minimum, but should be adequate in relation with the
corporate purpose of the entity
2-50 shareholders Members limit their liability to the par
value of the quotas they agreed.
Branch of a Foreign Company (Sucursal)
Not necessary toallocate capital
Laws from country of origin
Books should be kept separately from
HQs.
When investing in Argentina, foreign investors usually set their business using the investment vehicles described in the following table. All of them created and are regulated by the Inspección General de Justicia (IGJ).
In addition to the above listed, there are other forms of investment entities that foreign investors have to establish their business in Argentina:
• Partnerships: no minimum capital, all partners are jointly and severally liable for the partnership’s obligations.
• Joint Ventures: temporary associations to develop a specific work.• Cooperating Groups: common organization between several parties
to develop or improve certain phases of its clients activities. It has a contractual basis.
• Cooperating Consortium Agreement: similar to Cooperation Groups, but members may not agree jointly and severally liable for the obligations.
• Trusts: structure which allows an endeavour to isolate certain assets or property to use them for specific purposes.
ArgentinaBusiness Types
© 2017 Deloitte & Co. S.A. All rights reserved.
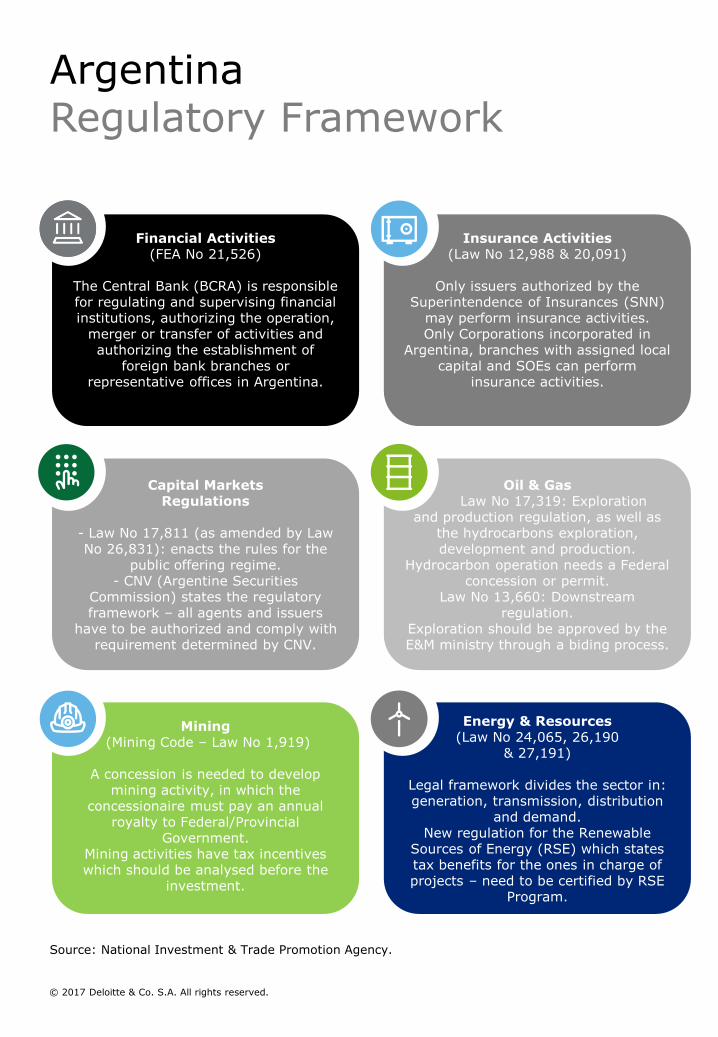
Source: National Investment & Trade Promotion Agency.
Financial Activities(FEA No 21,526)
The Central Bank (BCRA) is responsible for regulating and supervising financial institutions, authorizing the operation,
merger or transfer of activities and authorizing the establishment of
foreign bank branches or representative offices in Argentina.
Insurance Activities(Law No 12,988 & 20,091)
Only issuers authorized by the Superintendence of Insurances (SNN)
may perform insurance activities. Only Corporations incorporated in
Argentina, branches with assigned local capital and SOEs can perform
insurance activities.
Capital Markets Regulations
- Law No 17,811 (as amended by Law No 26,831): enacts the rules for the
public offering regime.- CNV (Argentine Securities
Commission) states the regulatory framework – all agents and issuers
have to be authorized and comply with requirement determined by CNV.
Oil & GasLaw No 17,319: Exploration
and production regulation, as well as the hydrocarbons exploration, development and production.
Hydrocarbon operation needs a Federal concession or permit.
Law No 13,660: Downstream regulation.
Exploration should be approved by the E&M ministry through a biding process.
Mining(Mining Code – Law No 1,919)
A concession is needed to develop mining activity, in which the
concessionaire must pay an annual royalty to Federal/Provincial
Government. Mining activities have tax incentives which should be analysed before the
investment.
Energy & Resources(Law No 24,065, 26,190
& 27,191)
Legal framework divides the sector in: generation, transmission, distribution
and demand.New regulation for the Renewable
Sources of Energy (RSE) which states tax benefits for the ones in charge of projects – need to be certified by RSE
Program.
ArgentinaRegulatory Framework
© 2017 Deloitte & Co. S.A. All rights reserved.
Source: National Investment & Trade Promotion Agency and Deloitte own analysis based on AFIP.
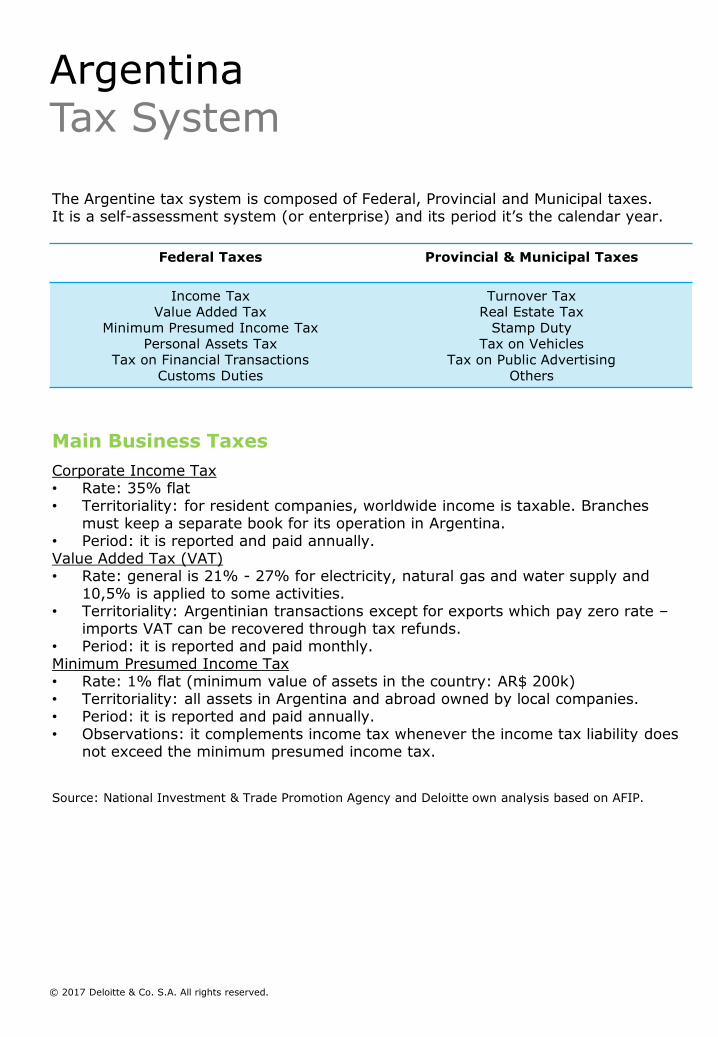
Federal Taxes Provincial & Municipal Taxes
Income TaxValue Added Tax
Minimum Presumed Income TaxPersonal Assets Tax
Tax on Financial TransactionsCustoms Duties
Turnover TaxReal Estate Tax
Stamp DutyTax on Vehicles
Tax on Public AdvertisingOthers
The Argentine tax system is composed of Federal, Provincial and Municipal taxes. It is a self-assessment system (or enterprise) and its period it’s the calendar year.
Main Business Taxes
Corporate Income Tax• Rate: 35% flat• Territoriality: for resident companies, worldwide income is taxable. Branches
must keep a separate book for its operation in Argentina.• Period: it is reported and paid annually.Value Added Tax (VAT)• Rate: general is 21% - 27% for electricity, natural gas and water supply and
10,5% is applied to some activities.• Territoriality: Argentinian transactions except for exports which pay zero rate –
imports VAT can be recovered through tax refunds.• Period: it is reported and paid monthly.Minimum Presumed Income Tax• Rate: 1% flat (minimum value of assets in the country: AR$ 200k)• Territoriality: all assets in Argentina and abroad owned by local companies. • Period: it is reported and paid annually.• Observations: it complements income tax whenever the income tax liability does
not exceed the minimum presumed income tax.
© 2017 Deloitte & Co. S.A. All rights reserved.
ArgentinaTax System

Industry SnapshotConsumer Goods & Retail: Food, Beverage & Tobacco
Industry Highlights
Industry Subsector Main Players
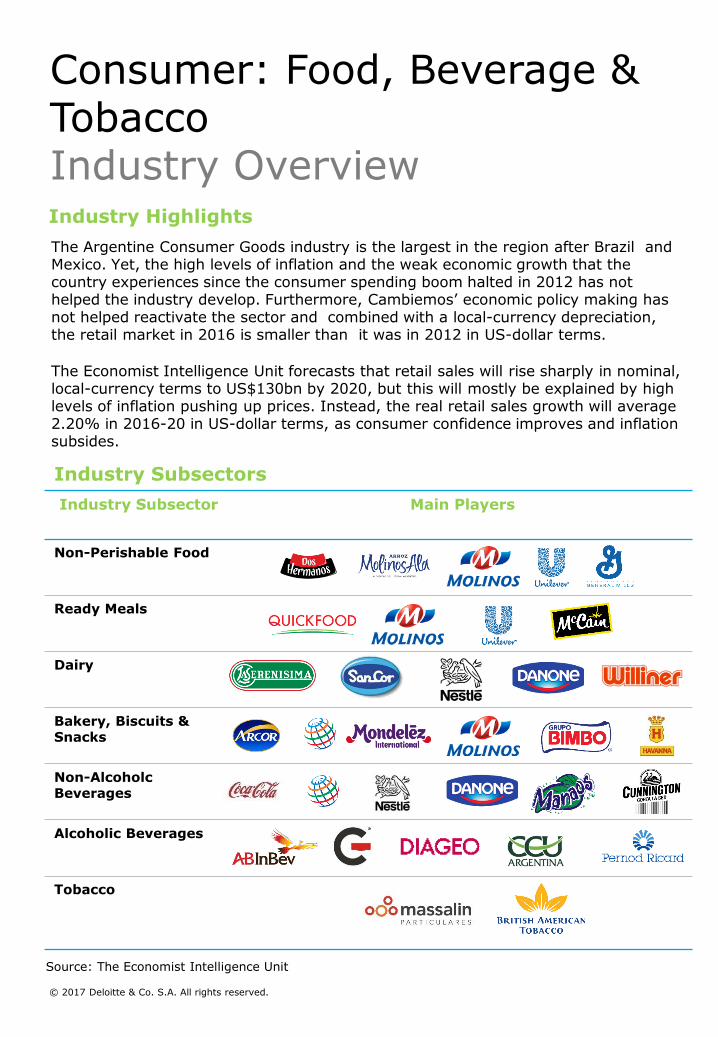
Non-Perishable Food
Ready Meals
Dairy
Bakery, Biscuits & Snacks
Non-AlcoholcBeverages
Alcoholic Beverages
Tobacco
Industry Subsectors
Source: The Economist Intelligence Unit
The Argentine Consumer Goods industry is the largest in the region after Brazil and Mexico. Yet, the high levels of inflation and the weak economic growth that thecountry experiences since the consumer spending boom halted in 2012 has nothelped the industry develop. Furthermore, Cambiemos’ economic policy making has not helped reactivate the sector and combined with a local-currency depreciation, the retail market in 2016 is smaller than it was in 2012 in US-dollar terms.
The Economist Intelligence Unit forecasts that retail sales will rise sharply in nominal, local-currency terms to US$130bn by 2020, but this will mostly be explained by high levels of inflation pushing up prices. Instead, the real retail sales growth will average 2.20% in 2016-20 in US-dollar terms, as consumer confidence improves and inflation subsides.
© 2017 Deloitte & Co. S.A. All rights reserved.
Consumer: Food, Beverage & TobaccoIndustry Overview
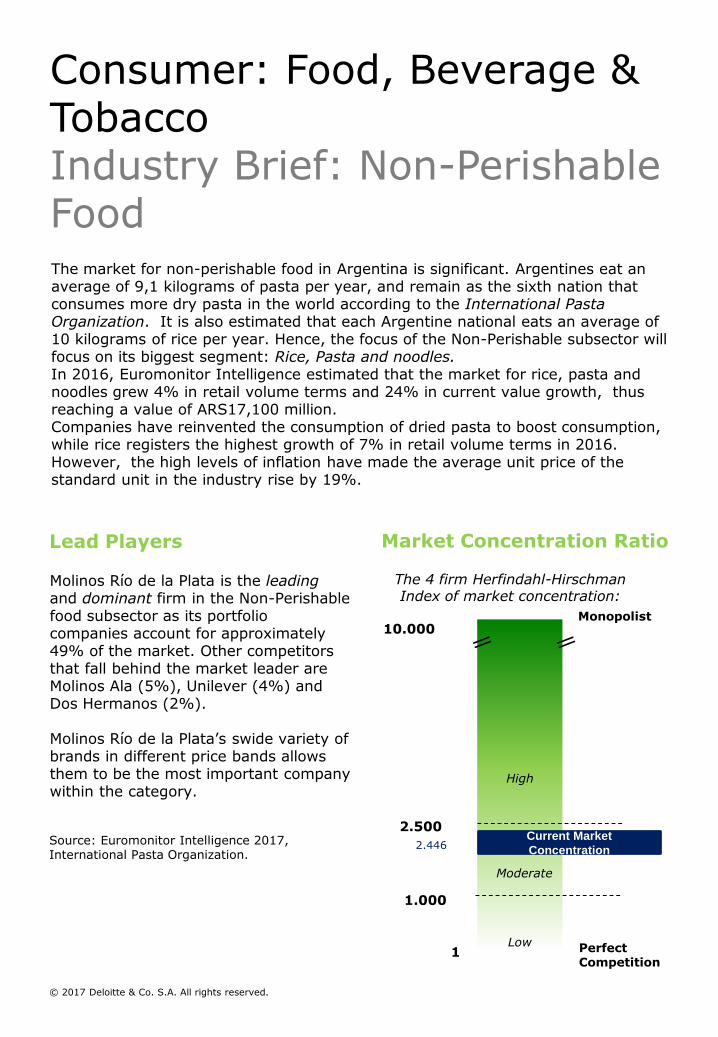
The 4 firm Herfindahl-HirschmanIndex of market concentration:
PerfectCompetition
10.000
1
Monopolist
2.500
1.000
= =
Current Market
Concentration2.446
Moderate
High
Low
Molinos Río de la Plata is the leadingand dominant firm in the Non-Perishable food subsector as its portfolio companies account for approximately 49% of the market. Other competitors that fall behind the market leader are Molinos Ala (5%), Unilever (4%) and Dos Hermanos (2%).
Molinos Río de la Plata’s swide variety of brands in different price bands allows them to be the most important company within the category.
Source: Euromonitor Intelligence 2017, International Pasta Organization.
The market for non-perishable food in Argentina is significant. Argentines eat an average of 9,1 kilograms of pasta per year, and remain as the sixth nation that consumes more dry pasta in the world according to the International Pasta Organization. It is also estimated that each Argentine national eats an average of 10 kilograms of rice per year. Hence, the focus of the Non-Perishable subsector will focus on its biggest segment: Rice, Pasta and noodles.In 2016, Euromonitor Intelligence estimated that the market for rice, pasta and noodles grew 4% in retail volume terms and 24% in current value growth, thus reaching a value of ARS17,100 million. Companies have reinvented the consumption of dried pasta to boost consumption, while rice registers the highest growth of 7% in retail volume terms in 2016. However, the high levels of inflation have made the average unit price of the standard unit in the industry rise by 19%.
Lead Players Market Concentration Ratio
© 2017 Deloitte & Co. S.A. All rights reserved.
Consumer: Food, Beverage & TobaccoIndustry Brief: Non-Perishable Food
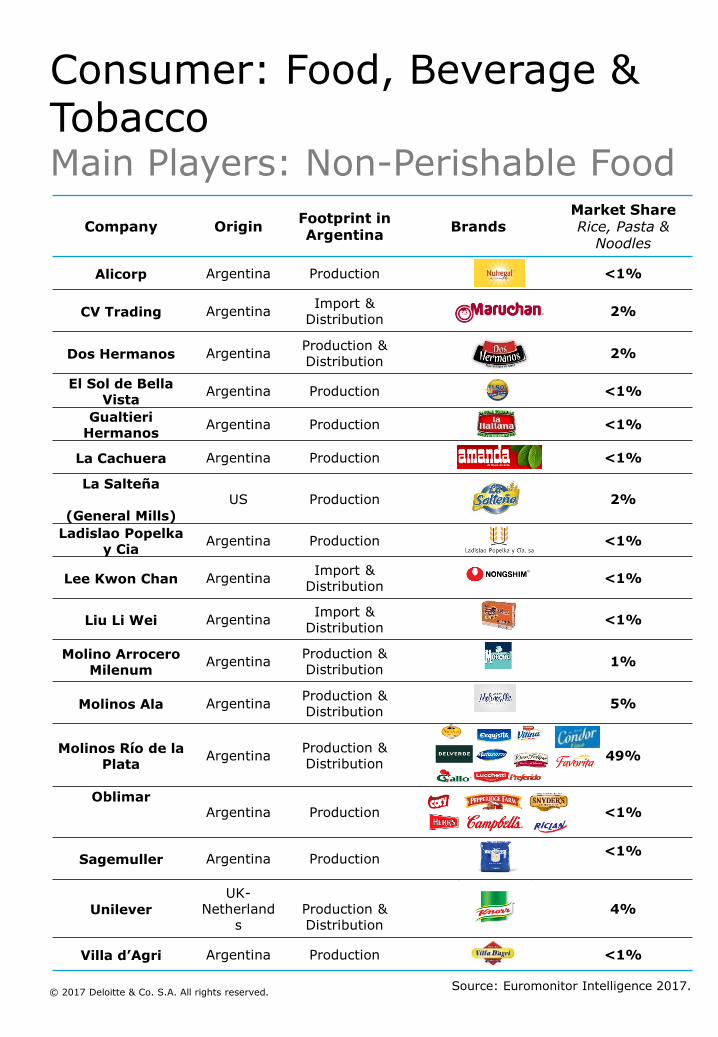
Company OriginFootprint in Argentina
BrandsMarket ShareRice, Pasta &
Noodles
Alicorp Argentina Production <1%
CV Trading ArgentinaImport &
Distribution2%
Dos Hermanos ArgentinaProduction & Distribution
2%
El Sol de BellaVista
Argentina Production <1%
GualtieriHermanos
Argentina Production <1%
La Cachuera Argentina Production <1%
La Salteña
(General Mills)
US Production 2%
Ladislao Popelkay Cia
Argentina Production <1%
Lee Kwon Chan ArgentinaImport &
Distribution<1%
Liu Li Wei ArgentinaImport &
Distribution<1%
Molino Arrocero Milenum
ArgentinaProduction & Distribution
1%
Molinos Ala ArgentinaProduction & Distribution
5%
Molinos Río de la Plata
ArgentinaProduction & Distribution
49%
OblimarArgentina Production <1%
Sagemuller Argentina Production<1%
Unilever
UK-Netherland
sProduction & Distribution
4%
Villa d’Agri Argentina Production <1%
Source: Euromonitor Intelligence 2017.© 2017 Deloitte & Co. S.A. All rights reserved.
Consumer: Food, Beverage & TobaccoMain Players: Non-Perishable Food
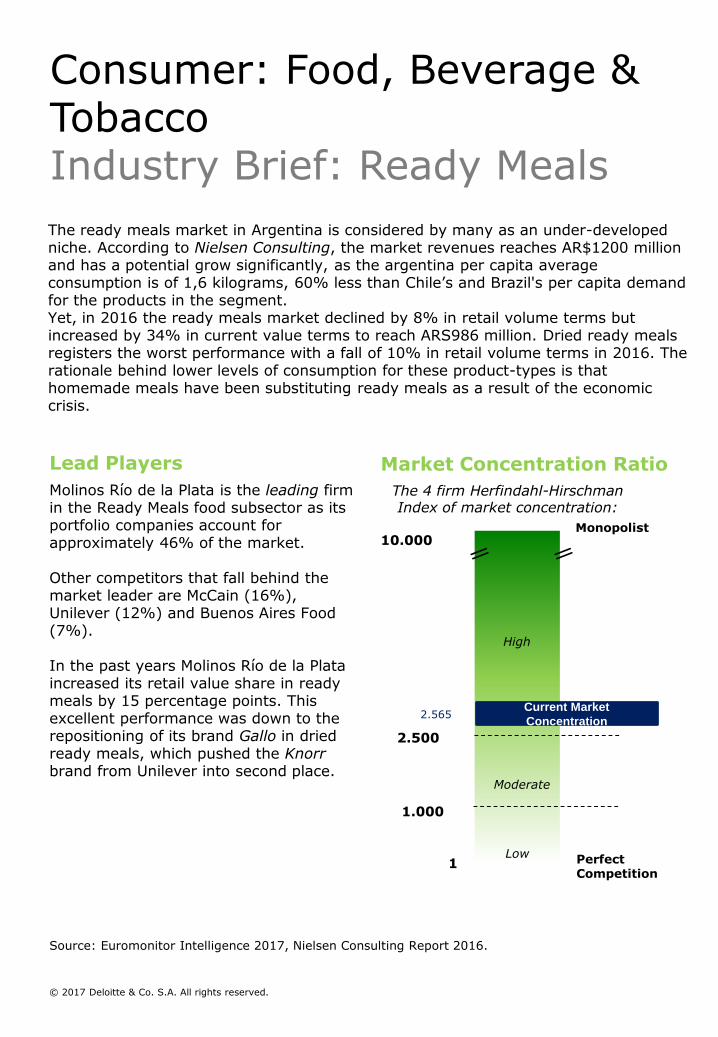
The ready meals market in Argentina is considered by many as an under-developed niche. According to Nielsen Consulting, the market revenues reaches AR$1200 million and has a potential grow significantly, as the argentina per capita average consumption is of 1,6 kilograms, 60% less than Chile’s and Brazil's per capita demand for the products in the segment.Yet, in 2016 the ready meals market declined by 8% in retail volume terms but increased by 34% in current value terms to reach ARS986 million. Dried ready meals registers the worst performance with a fall of 10% in retail volume terms in 2016. The rationale behind lower levels of consumption for these product-types is that homemade meals have been substituting ready meals as a result of the economic crisis.
The 4 firm Herfindahl-HirschmanIndex of market concentration:
PerfectCompetition
10.000
1
Monopolist
2.500
1.000
= =
Current Market
Concentration2.565
Moderate
High
Low
Molinos Río de la Plata is the leading firm in the Ready Meals food subsector as its portfolio companies account for approximately 46% of the market.
Other competitors that fall behind the market leader are McCain (16%), Unilever (12%) and Buenos Aires Food (7%).
In the past years Molinos Río de la Plata increased its retail value share in ready meals by 15 percentage points. This excellent performance was down to the repositioning of its brand Gallo in dried ready meals, which pushed the Knorrbrand from Unilever into second place.
Source: Euromonitor Intelligence 2017, Nielsen Consulting Report 2016.
Lead Players Market Concentration Ratio
© 2017 Deloitte & Co. S.A. All rights reserved.
Consumer: Food, Beverage & TobaccoIndustry Brief: Ready Meals
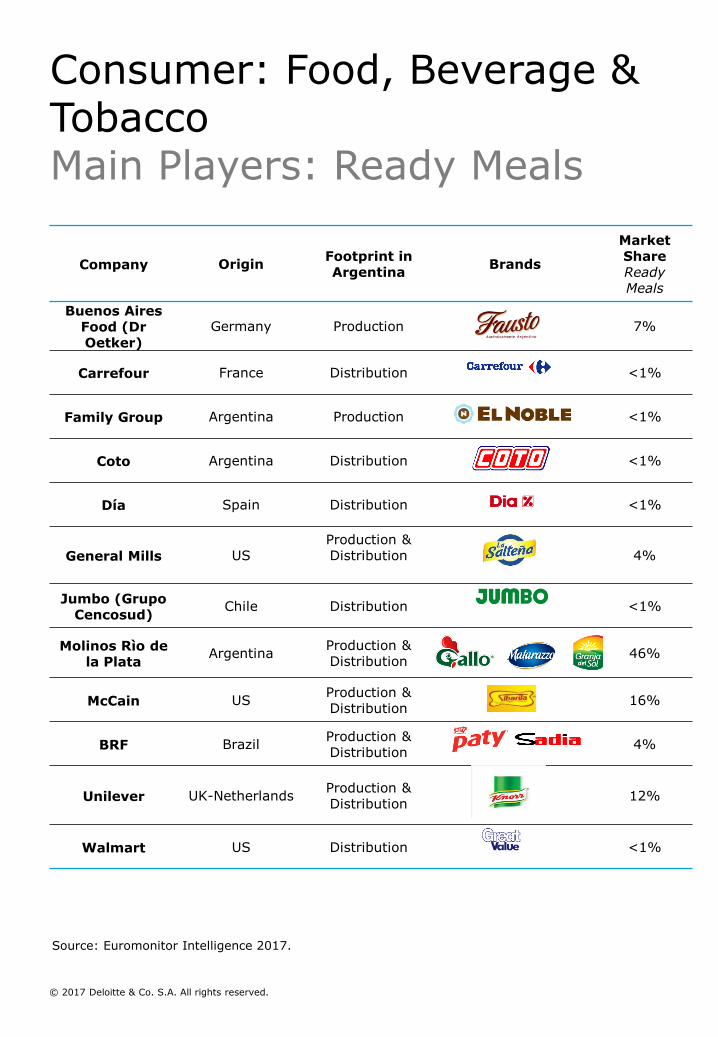
Company OriginFootprint in Argentina
Brands
MarketShareReady Meals
Buenos Aires Food (Dr Oetker)
Germany Production 7%
Carrefour France Distribution <1%
Family Group Argentina Production <1%
Coto Argentina Distribution <1%
Día Spain Distribution <1%
General Mills USProduction & Distribution 4%
Jumbo (Grupo Cencosud)
Chile Distribution <1%
Molinos Rìo de la Plata
ArgentinaProduction & Distribution
46%
McCain USProduction & Distribution
16%
BRF BrazilProduction & Distribution
4%
Unilever UK-NetherlandsProduction & Distribution
12%
Walmart US Distribution <1%
Source: Euromonitor Intelligence 2017.
© 2017 Deloitte & Co. S.A. All rights reserved.
Consumer: Food, Beverage & TobaccoMain Players: Ready Meals
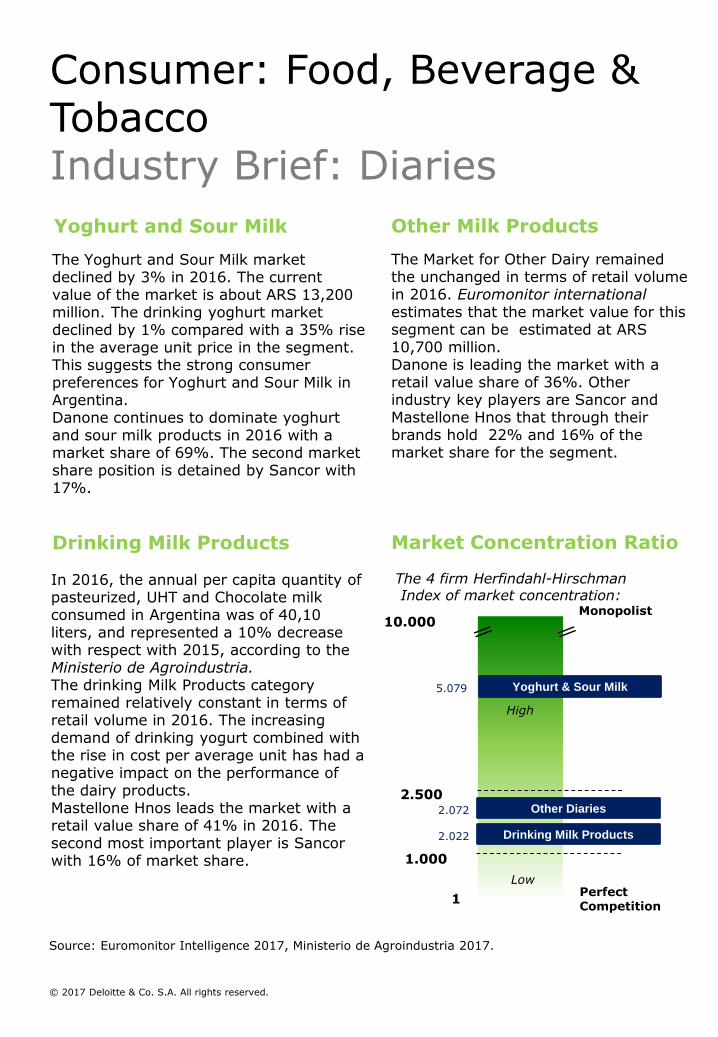
In 2016, the annual per capita quantity of pasteurized, UHT and Chocolate milk consumed in Argentina was of 40,10 liters, and represented a 10% decrease with respect with 2015, according to the Ministerio de Agroindustria.The drinking Milk Products category remained relatively constant in terms of retail volume in 2016. The increasing demand of drinking yogurt combined with the rise in cost per average unit has had a negative impact on the performance of the dairy products.Mastellone Hnos leads the market with a retail value share of 41% in 2016. The second most important player is Sancorwith 16% of market share.
The 4 firm Herfindahl-HirschmanIndex of market concentration:
PerfectCompetition
10.000
1
Monopolist
2.500
1.000
= =
Yoghurt & Sour Milk5.079
High
Low
Other Diaries2.072
Drinking Milk Products2.022
The Market for Other Dairy remained the unchanged in terms of retail volume in 2016. Euromonitor international estimates that the market value for this segment can be estimated at ARS 10,700 million. Danone is leading the market with a retail value share of 36%. Other industry key players are Sancor and Mastellone Hnos that through their brands hold 22% and 16% of the market share for the segment.
The Yoghurt and Sour Milk market declined by 3% in 2016. The current value of the market is about ARS 13,200 million. The drinking yoghurt market declined by 1% compared with a 35% rise in the average unit price in the segment. This suggests the strong consumer preferences for Yoghurt and Sour Milk in Argentina.Danone continues to dominate yoghurt and sour milk products in 2016 with a market share of 69%. The second market share position is detained by Sancor with 17%.
Source: Euromonitor Intelligence 2017, Ministerio de Agroindustria 2017.
Drinking Milk Products
Yoghurt and Sour Milk Other Milk Products
Market Concentration Ratio
© 2017 Deloitte & Co. S.A. All rights reserved.
Consumer: Food, Beverage & TobaccoIndustry Brief: Diaries
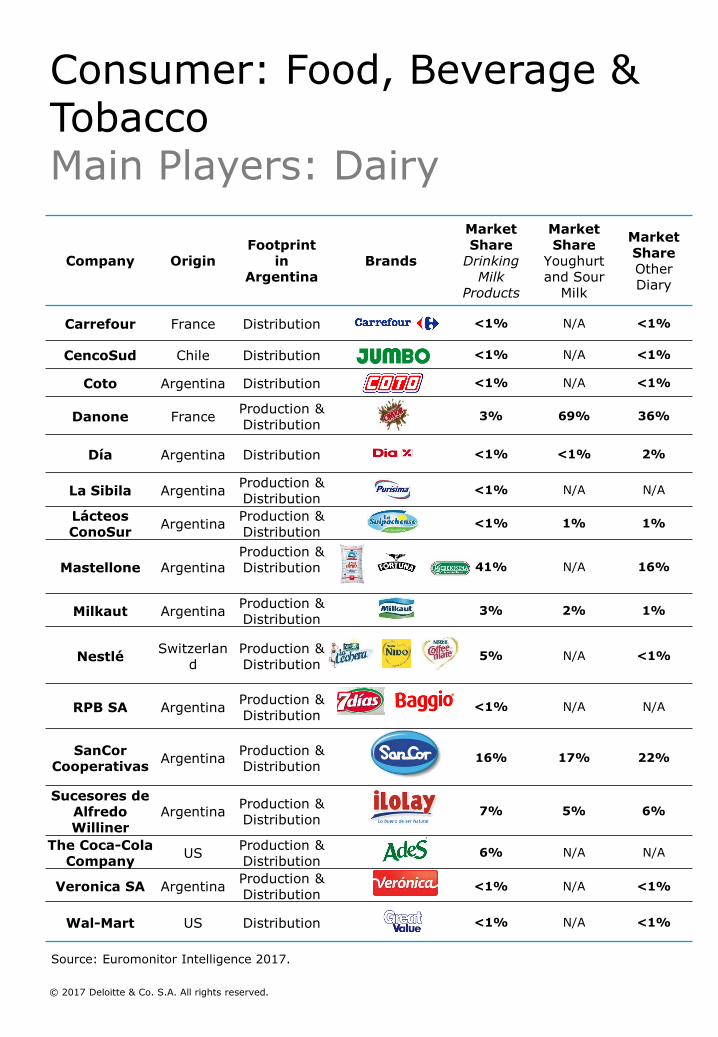
Company OriginFootprint
in Argentina
Brands
MarketShare
Drinking Milk
Products
MarketShare
Youghurtand Sour
Milk
MarketShareOther Diary
Carrefour France Distribution <1% N/A <1%
CencoSud Chile Distribution <1% N/A <1%
Coto Argentina Distribution <1% N/A <1%
Danone FranceProduction & Distribution
3% 69% 36%
Día Argentina Distribution <1% <1% 2%
La Sibila ArgentinaProduction & Distribution
<1% N/A N/A
LácteosConoSur
ArgentinaProduction & Distribution
<1% 1% 1%
Mastellone ArgentinaProduction & Distribution 41% N/A 16%
Milkaut ArgentinaProduction & Distribution
3% 2% 1%
NestléSwitzerlan
dProduction & Distribution
5% N/A <1%
RPB SA ArgentinaProduction & Distribution
<1% N/A N/A
SanCorCooperativas
ArgentinaProduction & Distribution
16% 17% 22%
Sucesores de Alfredo Williner
ArgentinaProduction & Distribution
7% 5% 6%
The Coca-Cola Company
USProduction & Distribution
6% N/A N/A
Veronica SA ArgentinaProduction & Distribution
<1% N/A <1%
Wal-Mart US Distribution <1% N/A <1%
Source: Euromonitor Intelligence 2017.
© 2017 Deloitte & Co. S.A. All rights reserved.
Consumer: Food, Beverage & TobaccoMain Players: Dairy
The 4 Firm Herfindahl-HirschmanIndex of market concentration:
PerfectCompetition
10.000
1
Monopolist
2.500
1.000
= =
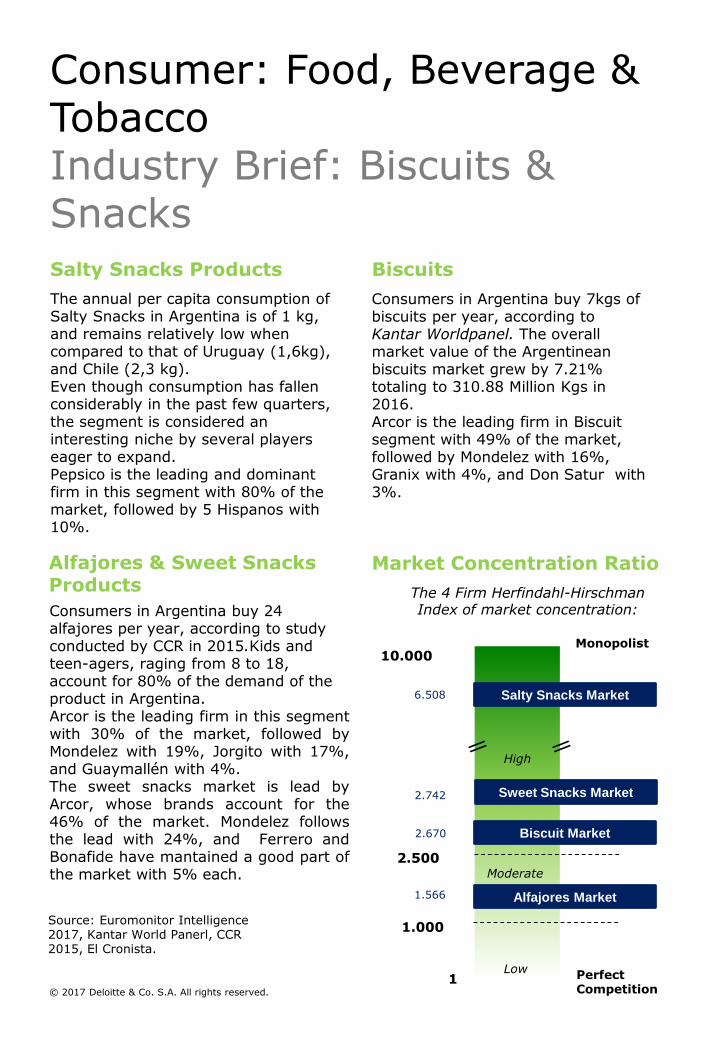
Salty Snacks Market6.508
Biscuit Market2.670
Sweet Snacks Market2.742
Moderate
High
Low
Alfajores Market1.566
Consumers in Argentina buy 7kgs of biscuits per year, according to Kantar Worldpanel. The overall market value of the Argentinean biscuits market grew by 7.21% totaling to 310.88 Million Kgs in 2016. Arcor is the leading firm in Biscuit segment with 49% of the market, followed by Mondelez with 16%, Granix with 4%, and Don Satur with 3%.
The annual per capita consumption of Salty Snacks in Argentina is of 1 kg, and remains relatively low when compared to that of Uruguay (1,6kg), and Chile (2,3 kg). Even though consumption has fallen considerably in the past few quarters, the segment is considered an interesting niche by several players eager to expand.Pepsico is the leading and dominant firm in this segment with 80% of the market, followed by 5 Hispanos with 10%.
Consumers in Argentina buy 24 alfajores per year, according to study conducted by CCR in 2015.Kids and teen-agers, raging from 8 to 18, account for 80% of the demand of the product in Argentina. Arcor is the leading firm in this segmentwith 30% of the market, followed byMondelez with 19%, Jorgito with 17%,and Guaymallén with 4%.The sweet snacks market is lead byArcor, whose brands account for the46% of the market. Mondelez followsthe lead with 24%, and Ferrero andBonafide have mantained a good part ofthe market with 5% each.
Market Concentration RatioAlfajores & Sweet Snacks Products
BiscuitsSalty Snacks Products
Source: Euromonitor Intelligence 2017, Kantar World Panerl, CCR 2015, El Cronista.
© 2017 Deloitte & Co. S.A. All rights reserved.
Consumer: Food, Beverage & TobaccoIndustry Brief: Biscuits & Snacks
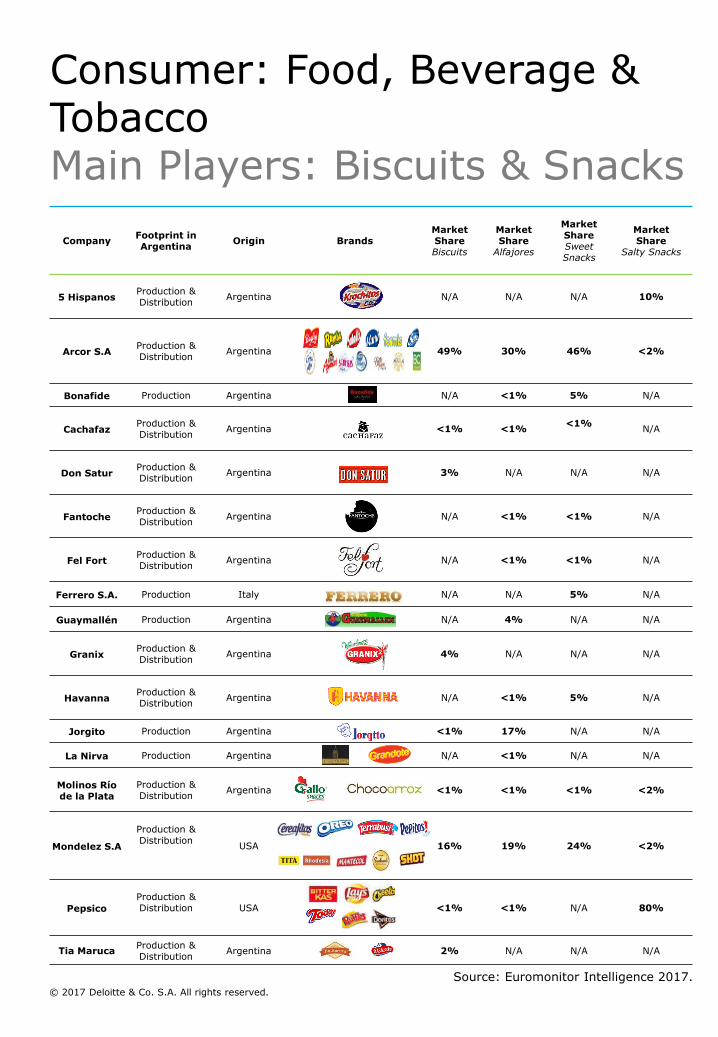
CompanyFootprint in Argentina
Origin BrandsMarket ShareBiscuits
Market Share
Alfajores
MarketShareSweet Snacks
MarketShare
Salty Snacks
5 HispanosProduction & Distribution
Argentina N/A N/A N/A 10%
Arcor S.AProduction & Distribution
Argentina 49% 30% 46% <2%
Bonafide Production Argentina N/A <1% 5% N/A
CachafazProduction & Distribution
Argentina <1% <1%<1%
N/A
Don SaturProduction & Distribution
Argentina 3% N/A N/A N/A
FantocheProduction & Distribution
Argentina N/A <1% <1% N/A
Fel FortProduction & Distribution
Argentina N/A <1% <1% N/A
Ferrero S.A. Production Italy N/A N/A 5% N/A
Guaymallén Production Argentina N/A 4% N/A N/A
GranixProduction & Distribution
Argentina 4% N/A N/A N/A
HavannaProduction & Distribution
Argentina N/A <1% 5% N/A
Jorgito Production Argentina <1% 17% N/A N/A
La Nirva Production Argentina N/A <1% N/A N/A
Molinos Río de la Plata
Production & Distribution
Argentina <1% <1% <1% <2%
Mondelez S.A
Production & Distribution
USA 16% 19% 24% <2%
Pepsico
Production & Distribution USA <1% <1% N/A 80%
Tia MarucaProduction & Distribution
Argentina 2% N/A N/A N/A
Source: Euromonitor Intelligence 2017.© 2017 Deloitte & Co. S.A. All rights reserved.
Consumer: Food, Beverage & TobaccoMain Players: Biscuits & Snacks
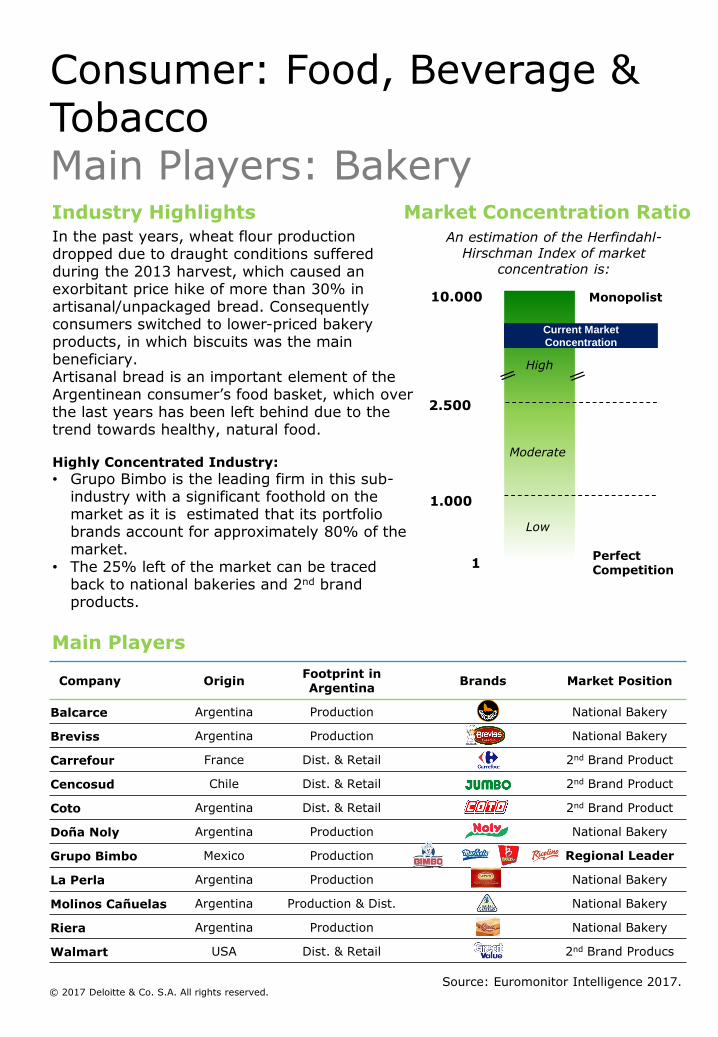
Company OriginFootprint in Argentina
Brands Market Position
Balcarce Argentina Production National Bakery
Breviss Argentina Production National Bakery
Carrefour France Dist. & Retail 2nd Brand Product
Cencosud Chile Dist. & Retail 2nd Brand Product
Coto Argentina Dist. & Retail 2nd Brand Product
Doña Noly Argentina Production National Bakery
Grupo Bimbo Mexico Production Regional Leader
La Perla Argentina Production National Bakery
Molinos Cañuelas Argentina Production & Dist. National Bakery
Riera Argentina Production National Bakery
Walmart USA Dist. & Retail 2nd Brand Producs
In the past years, wheat flour production dropped due to draught conditions suffered during the 2013 harvest, which caused an exorbitant price hike of more than 30% in artisanal/unpackaged bread. Consequently consumers switched to lower-priced bakery products, in which biscuits was the main beneficiary.Artisanal bread is an important element of the Argentinean consumer’s food basket, which over the last years has been left behind due to the trend towards healthy, natural food.
Highly Concentrated Industry:
• Grupo Bimbo is the leading firm in this sub-industry with a significant foothold on the market as it is estimated that its portfolio brands account for approximately 80% of the market.
• The 25% left of the market can be traced back to national bakeries and 2nd brand products.
10.000
1
An estimation of the Herfindahl-Hirschman Index of market
concentration is:
Monopolist
PerfectCompetition
2.500
1.000
= =
Current Market
Concentration
Moderate
High
Low
Source: Euromonitor Intelligence 2017.
Industry Highlights Market Concentration Ratio
Main Players
© 2017 Deloitte & Co. S.A. All rights reserved.
Consumer: Food, Beverage & TobaccoMain Players: Bakery
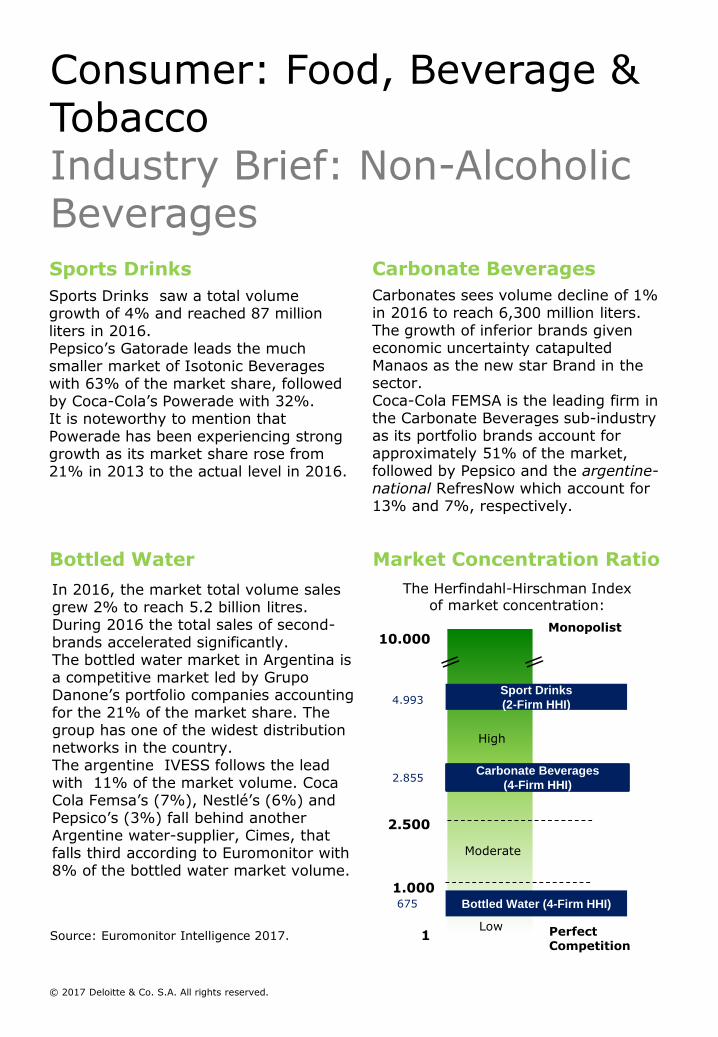
Carbonates sees volume decline of 1% in 2016 to reach 6,300 million liters. The growth of inferior brands given economic uncertainty catapulted Manaos as the new star Brand in the sector. Coca-Cola FEMSA is the leading firm in the Carbonate Beverages sub-industry as its portfolio brands account for approximately 51% of the market, followed by Pepsico and the argentine-national RefresNow which account for 13% and 7%, respectively.
The Herfindahl-Hirschman Indexof market concentration:
PerfectCompetition
10.000
1
Monopolist
2.500
1.000
= =
Bottled Water (4-Firm HHI)675
Carbonate Beverages
(4-Firm HHI)2.855
Sport Drinks
(2-Firm HHI)4.993
Moderate
High
Low
In 2016, the market total volume sales grew 2% to reach 5.2 billion litres. During 2016 the total sales of second-brands accelerated significantly. The bottled water market in Argentina is a competitive market led by Grupo Danone’s portfolio companies accounting for the 21% of the market share. The group has one of the widest distribution networks in the country.The argentine IVESS follows the lead with 11% of the market volume. Coca Cola Femsa’s (7%), Nestlé’s (6%) and Pepsico’s (3%) fall behind another Argentine water-supplier, Cimes, that falls third according to Euromonitor with 8% of the bottled water market volume.
Sports Drinks saw a total volume growth of 4% and reached 87 million liters in 2016. Pepsico’s Gatorade leads the much smaller market of Isotonic Beverages with 63% of the market share, followed by Coca-Cola’s Powerade with 32%. It is noteworthy to mention that Powerade has been experiencing strong growth as its market share rose from 21% in 2013 to the actual level in 2016.
Sports Drinks
Bottled Water Market Concentration Ratio
Carbonate Beverages
Source: Euromonitor Intelligence 2017.
© 2017 Deloitte & Co. S.A. All rights reserved.
Consumer: Food, Beverage & TobaccoIndustry Brief: Non-Alcoholic Beverages
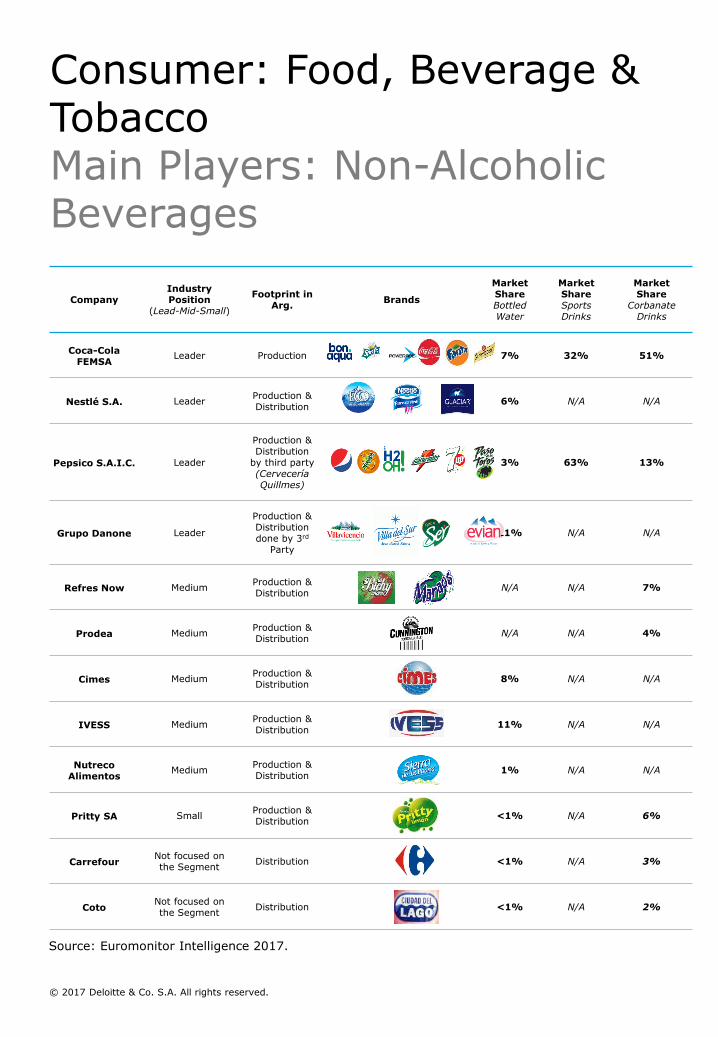
CompanyIndustry Position
(Lead-Mid-Small)
Footprint in Arg.
Brands
Market ShareBottled Water
Market ShareSportsDrinks
Market Share
CorbanateDrinks
Coca-Cola FEMSA
Leader Production 7% 32% 51%
Nestlé S.A. LeaderProduction & Distribution
6% N/A N/A
Pepsico S.A.I.C. Leader
Production & Distribution
by third party (CerveceríaQuillmes)
3% 63% 13%
Grupo Danone Leader
Production & Distribution done by 3rd
Party
21% N/A N/A
Refres Now MediumProduction & Distribution
N/A N/A 7%
Prodea MediumProduction & Distribution
N/A N/A 4%
Cimes MediumProduction & Distribution
8% N/A N/A
IVESS MediumProduction & Distribution
11% N/A N/A
NutrecoAlimentos
MediumProduction & Distribution
1% N/A N/A
Pritty SA SmallProduction & Distribution
<1% N/A 6%
CarrefourNot focused on the Segment
Distribution <1% N/A 3%
CotoNot focused on the Segment
Distribution <1% N/A 2%
Source: Euromonitor Intelligence 2017.
© 2017 Deloitte & Co. S.A. All rights reserved.
Consumer: Food, Beverage & TobaccoMain Players: Non-Alcoholic Beverages
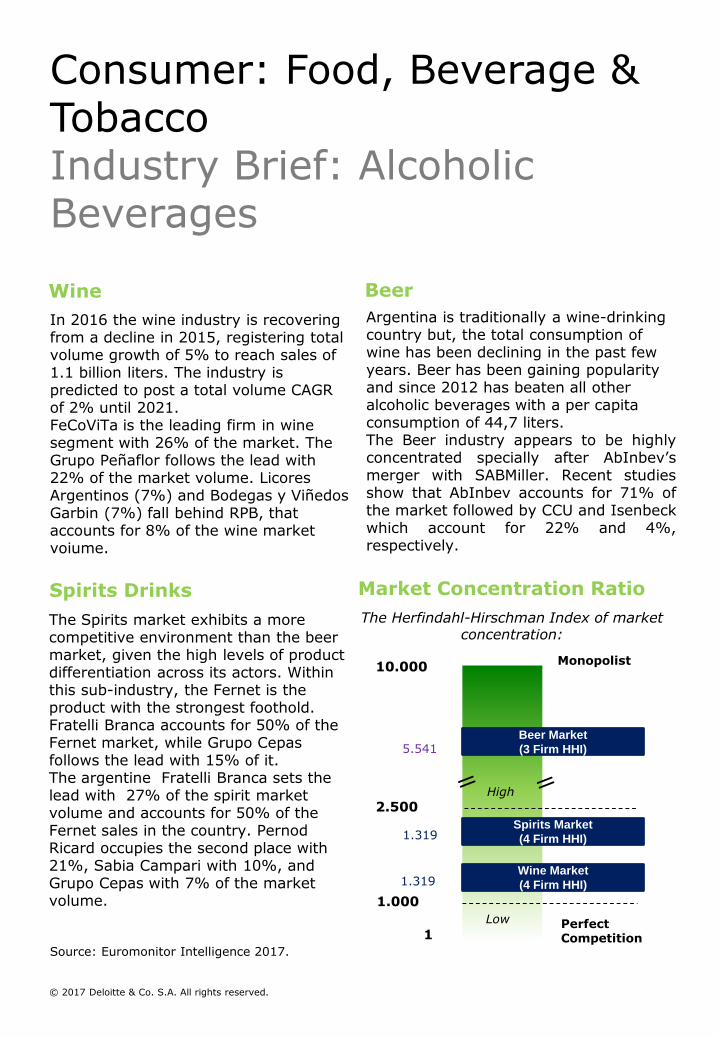
Argentina is traditionally a wine-drinking country but, the total consumption of wine has been declining in the past few years. Beer has been gaining popularity and since 2012 has beaten all other alcoholic beverages with a per capita consumption of 44,7 liters.The Beer industry appears to be highlyconcentrated specially after AbInbev’smerger with SABMiller. Recent studiesshow that AbInbev accounts for 71% ofthe market followed by CCU and Isenbeckwhich account for 22% and 4%,respectively.
10.000
1
The Herfindahl-Hirschman Index of marketconcentration:
Monopolist
PerfectCompetition
2.500
1.000
High= =
Beer Market
(3 Firm HHI)5.541
Low
Spirits Market
(4 Firm HHI)1.319
Wine Market
(4 Firm HHI)1.319
In 2016 the wine industry is recovering from a decline in 2015, registering total volume growth of 5% to reach sales of 1.1 billion liters. The industry is predicted to post a total volume CAGR of 2% until 2021.FeCoViTa is the leading firm in wine segment with 26% of the market. The Grupo Peñaflor follows the lead with 22% of the market volume. LicoresArgentinos (7%) and Bodegas y ViñedosGarbin (7%) fall behind RPB, that accounts for 8% of the wine market voiume.
The Spirits market exhibits a more competitive environment than the beer market, given the high levels of product differentiation across its actors. Within this sub-industry, the Fernet is the product with the strongest foothold. Fratelli Branca accounts for 50% of the Fernet market, while Grupo Cepasfollows the lead with 15% of it. The argentine Fratelli Branca sets the lead with 27% of the spirit market volume and accounts for 50% of the Fernet sales in the country. Pernod Ricard occupies the second place with 21%, Sabia Campari with 10%, and Grupo Cepas with 7% of the market volume.
Source: Euromonitor Intelligence 2017.
Wine
Spirits Drinks
Beer
Market Concentration Ratio
© 2017 Deloitte & Co. S.A. All rights reserved.
Consumer: Food, Beverage & TobaccoIndustry Brief: Alcoholic Beverages
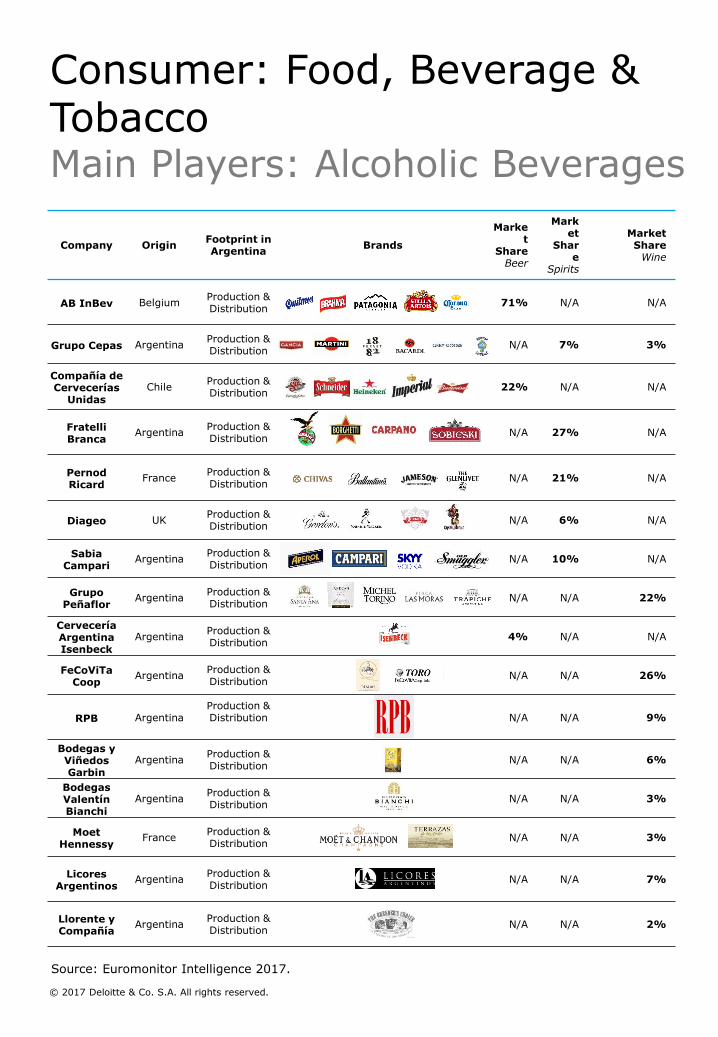
Company OriginFootprint in Argentina
Brands
Market
ShareBeer
Market
Share
Spirits
MarketShare
Wine
AB InBev BelgiumProduction & Distribution
71% N/A N/A
Grupo Cepas ArgentinaProduction & Distribution
N/A 7% 3%
Compañía de Cervecerías
Unidas
ChileProduction & Distribution
22% N/A N/A
FratelliBranca
ArgentinaProduction & Distribution
N/A 27% N/A
PernodRicard
FranceProduction & Distribution
N/A 21% N/A
Diageo UKProduction & Distribution
N/A 6% N/A
Sabia Campari
ArgentinaProduction & Distribution
N/A 10% N/A
Grupo Peñaflor
ArgentinaProduction & Distribution
N/A N/A 22%
Cervecería Argentina Isenbeck
ArgentinaProduction & Distribution
4% N/A N/A
FeCoViTaCoop
ArgentinaProduction & Distribution
N/A N/A 26%
RPB ArgentinaProduction & Distribution N/A N/A 9%
Bodegas y Viñedos Garbin
ArgentinaProduction & Distribution
N/A N/A 6%
Bodegas ValentínBianchi
ArgentinaProduction & Distribution
N/A N/A 3%
MoetHennessy
FranceProduction & Distribution
N/A N/A 3%
Licores Argentinos
ArgentinaProduction & Distribution
N/A N/A 7%
Llorente y Compañía
ArgentinaProduction & Distribution
N/A N/A 2%
Source: Euromonitor Intelligence 2017.
© 2017 Deloitte & Co. S.A. All rights reserved.
Consumer: Food, Beverage & TobaccoMain Players: Alcoholic Beverages
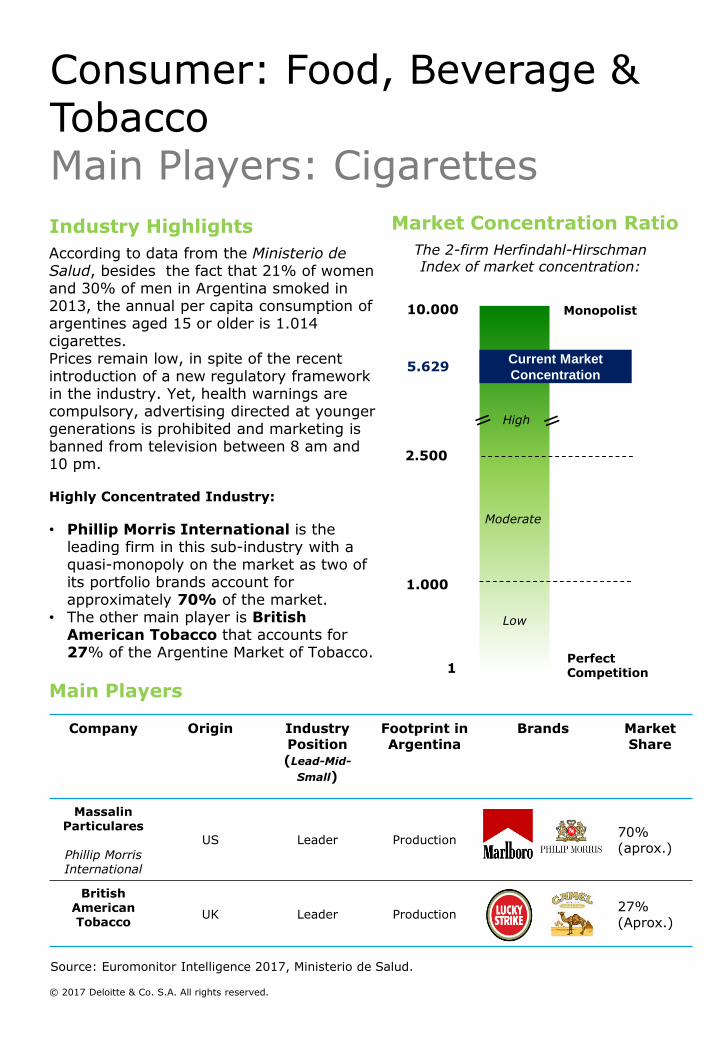
Company Origin Industry Position(Lead-Mid-Small)
Footprint in Argentina
Brands MarketShare
MassalinParticulares
Phillip Morris International
US Leader Production70% (aprox.)
British American Tobacco
UK Leader Production27% (Aprox.)
According to data from the Ministerio de Salud, besides the fact that 21% of women and 30% of men in Argentina smoked in 2013, the annual per capita consumption of argentines aged 15 or older is 1.014 cigarettes.Prices remain low, in spite of the recent introduction of a new regulatory framework in the industry. Yet, health warnings are compulsory, advertising directed at younger generations is prohibited and marketing is banned from television between 8 am and 10 pm.
Highly Concentrated Industry:
• Phillip Morris International is the leading firm in this sub-industry with a quasi-monopoly on the market as two of its portfolio brands account for approximately 70% of the market.
• The other main player is British American Tobacco that accounts for27% of the Argentine Market of Tobacco.
Source: Euromonitor Intelligence 2017, Ministerio de Salud.
Industry Highlights
Main Players
10.000
1
The 2-firm Herfindahl-HirschmanIndex of market concentration:
Monopolist
PerfectCompetition
2.500
1.000
= =
Current Market
Concentration5.629
Moderate
High
Low
Market Concentration Ratio
© 2017 Deloitte & Co. S.A. All rights reserved.
Consumer: Food, Beverage & TobaccoMain Players: Cigarettes
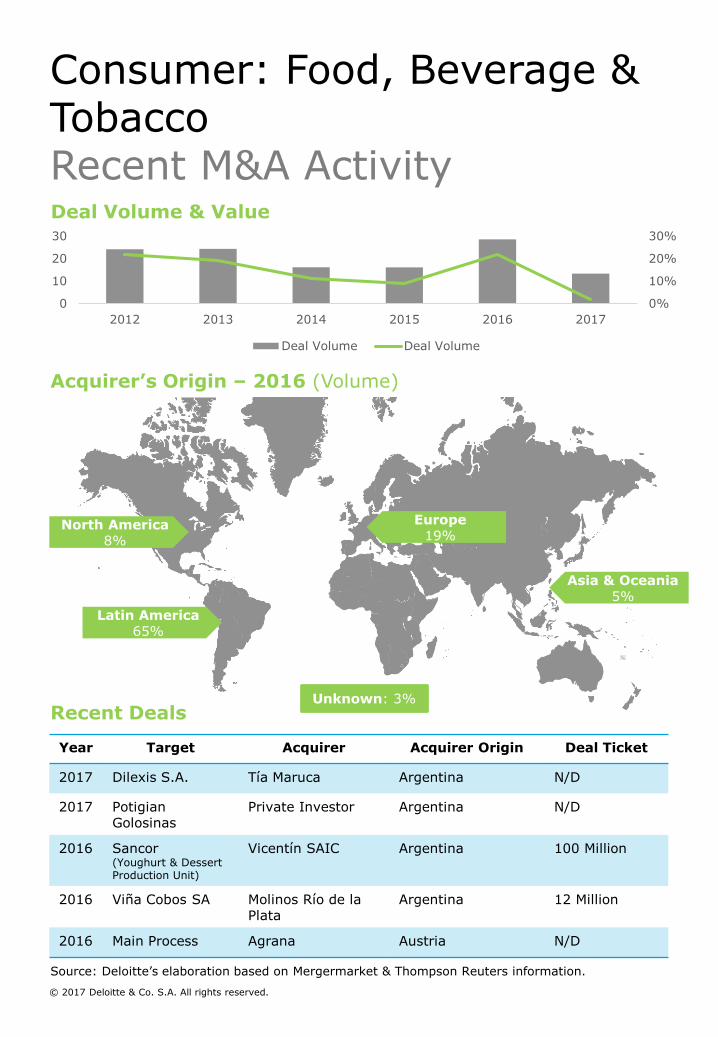
Source: Deloitte’s elaboration based on Mergermarket & Thompson Reuters information.
Year Target Acquirer Acquirer Origin Deal Ticket
2017 Dilexis S.A. Tía Maruca Argentina N/D
2017 PotigianGolosinas
Private Investor Argentina N/D
2016 Sancor(Youghurt & Dessert Production Unit)
Vicentín SAIC Argentina 100 Million
2016 Viña Cobos SA Molinos Río de la Plata
Argentina 12 Million
2016 Main Process Agrana Austria N/D
Deal Volume & Value
Acquirer’s Origin – 2016 (Volume)
North America8%
Latin America65%
Asia & Oceania5%
Europe19%
Recent DealsUnknown: 3%
0%
10%
20%
30%
0
10
20
30
2012 2013 2014 2015 2016 2017
Deal Volume Deal Volume
© 2017 Deloitte & Co. S.A. All rights reserved.
Consumer: Food, Beverage & TobaccoRecent M&A Activity

Industry SnapshotFinancial Services
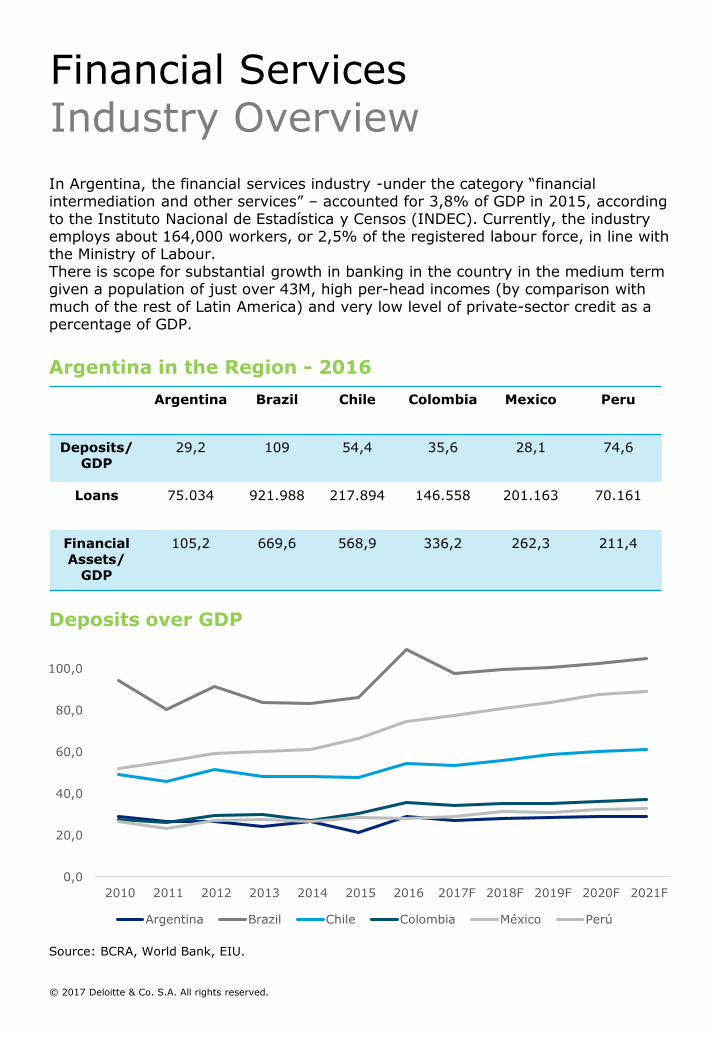
In Argentina, the financial services industry -under the category “financial intermediation and other services” – accounted for 3,8% of GDP in 2015, according to the Instituto Nacional de Estadística y Censos (INDEC). Currently, the industry employs about 164,000 workers, or 2,5% of the registered labour force, in line with the Ministry of Labour.There is scope for substantial growth in banking in the country in the medium term given a population of just over 43M, high per-head incomes (by comparison with much of the rest of Latin America) and very low level of private-sector credit as a percentage of GDP.
Source: BCRA, World Bank, EIU.
Argentina in the Region - 2016
Argentina Brazil Chile Colombia Mexico Peru
Deposits/ GDP
29,2 109 54,4 35,6 28,1 74,6
Loans 75.034 921.988 217.894 146.558 201.163 70.161
Financial Assets/
GDP
105,2 669,6 568,9 336,2 262,3 211,4
Deposits over GDP
0,0
20,0
40,0
60,0
80,0
100,0
2010 2011 2012 2013 2014 2015 2016 2017F 2018F 2019F 2020F 2021F
Argentina Brazil Chile Colombia México Perú
© 2017 Deloitte & Co. S.A. All rights reserved.
Financial ServicesIndustry Overview
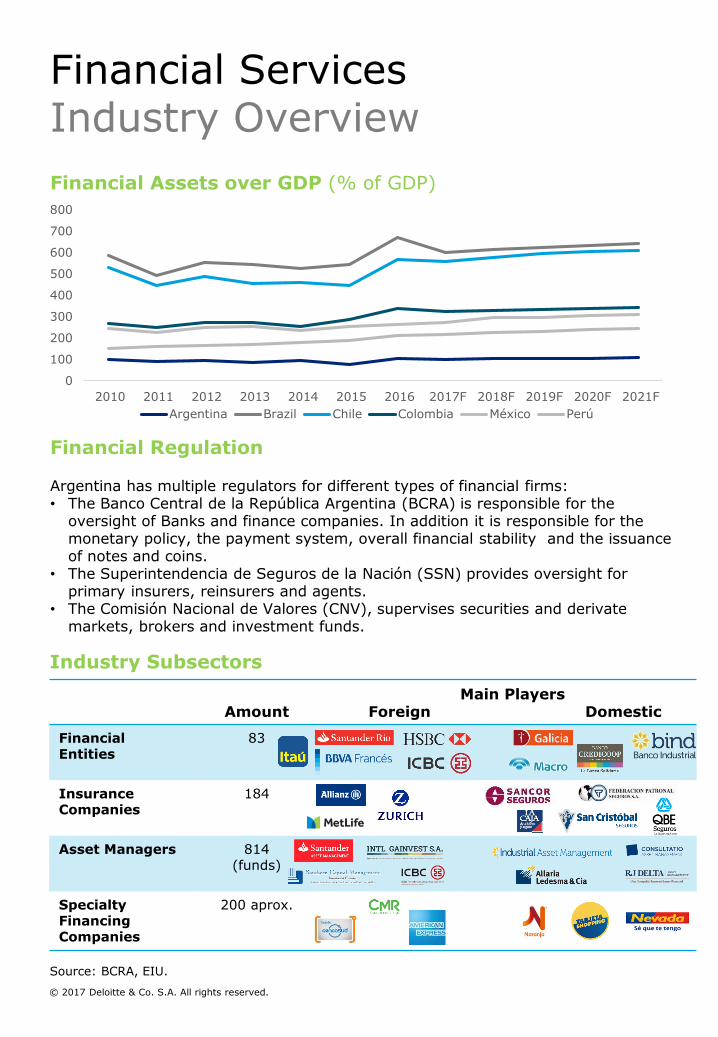
Source: BCRA, EIU.
Financial Assets over GDP (% of GDP)
Industry Subsectors
AmountMain Players
Foreign Domestic
Financial Entities
83
Insurance Companies
184
Asset Managers 814 (funds)
Specialty Financing Companies
200 aprox.
Financial Regulation
Argentina has multiple regulators for different types of financial firms:• The Banco Central de la República Argentina (BCRA) is responsible for the
oversight of Banks and finance companies. In addition it is responsible for the monetary policy, the payment system, overall financial stability and the issuance of notes and coins.
• The Superintendencia de Seguros de la Nación (SSN) provides oversight for primary insurers, reinsurers and agents.
• The Comisión Nacional de Valores (CNV), supervises securities and derivate markets, brokers and investment funds.
0
100
200
300
400
500
600
700
800
2010 2011 2012 2013 2014 2015 2016 2017F 2018F 2019F 2020F 2021F
Argentina Brazil Chile Colombia México Perú
© 2017 Deloitte & Co. S.A. All rights reserved.
Financial ServicesIndustry Overview
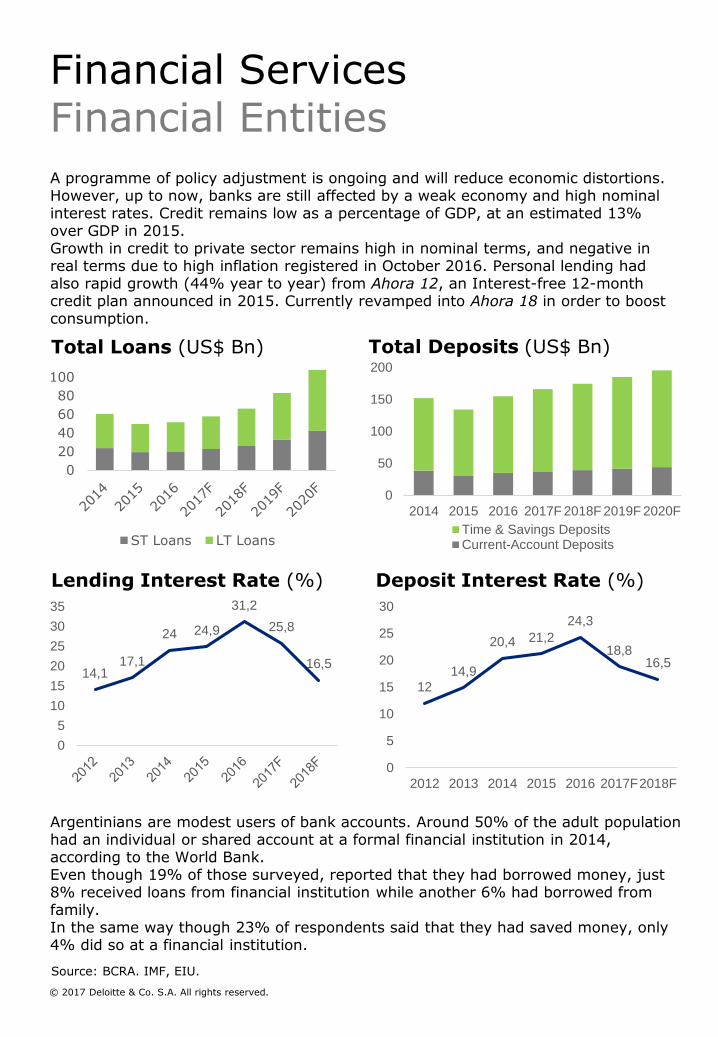
A programme of policy adjustment is ongoing and will reduce economic distortions. However, up to now, banks are still affected by a weak economy and high nominal interest rates. Credit remains low as a percentage of GDP, at an estimated 13% over GDP in 2015.Growth in credit to private sector remains high in nominal terms, and negative in real terms due to high inflation registered in October 2016. Personal lending had also rapid growth (44% year to year) from Ahora 12, an Interest-free 12-month credit plan announced in 2015. Currently revamped into Ahora 18 in order to boost consumption.
Argentinians are modest users of bank accounts. Around 50% of the adult population had an individual or shared account at a formal financial institution in 2014, according to the World Bank.Even though 19% of those surveyed, reported that they had borrowed money, just 8% received loans from financial institution while another 6% had borrowed from family. In the same way though 23% of respondents said that they had saved money, only 4% did so at a financial institution.
Total Loans (US$ Bn) Total Deposits (US$ Bn)
Source: BCRA. IMF, EIU.
14,117,1
24 24,9
31,2
25,8
16,5
0
5
10
15
20
25
30
35
Lending Interest Rate (%)
12
14,9
20,4 21,2
24,3
18,816,5
0
5
10
15
20
25
30
2012 2013 2014 2015 2016 2017F2018F
Deposit Interest Rate (%)
0
20
40
60
80
100
ST Loans LT Loans
0
50
100
150
200
2014 2015 2016 2017F 2018F 2019F 2020F
Time & Savings DepositsCurrent-Account Deposits
© 2017 Deloitte & Co. S.A. All rights reserved.
Financial ServicesFinancial Entities
0 10.000 20.000 30.000 40.000 50.000 60.000 70.000 80.000 90.000100.000
Santander Río
Galicia y Buenos Aires
Francés SA
Macro SA
HSBC Bank
Credicoop Coop.
Patagonia SA
Industrial
Citibank
Hipotecario
Superville SA
Prov. De Córdoba
Nuevo Santa Fe SA
San Juan SA
Itau Argentina
Comafi SA
La Pampa SEM
Nuevo Entre Ríos
Banco Industria
Santiago del Estero SA
Otros
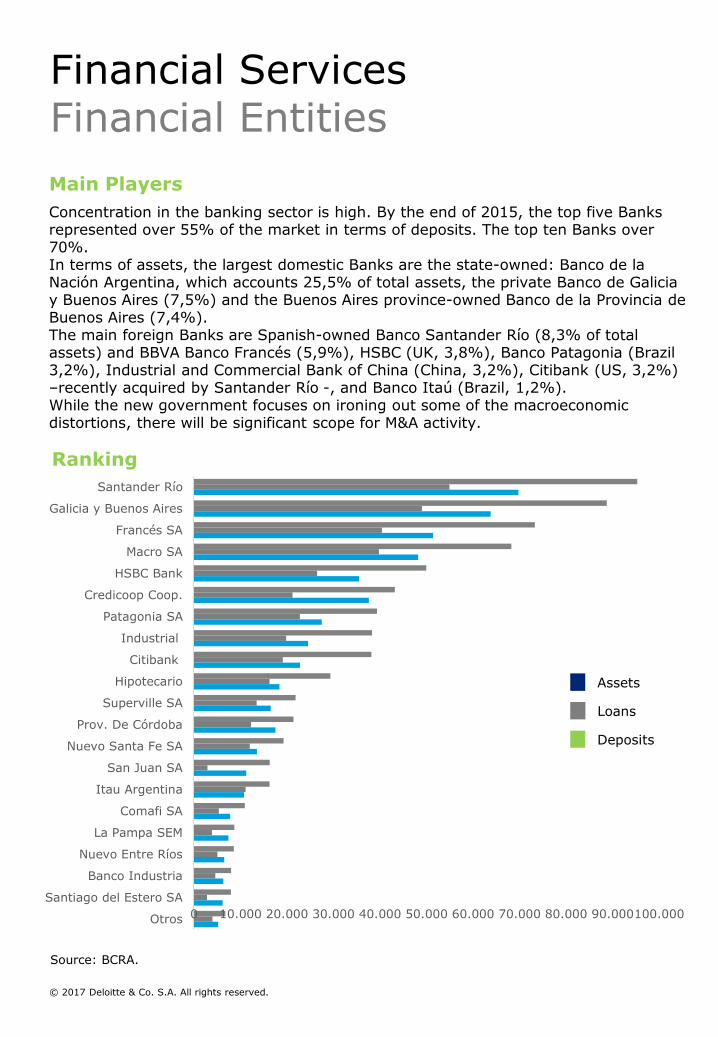
Ranking
Main Players
Concentration in the banking sector is high. By the end of 2015, the top five Banks represented over 55% of the market in terms of deposits. The top ten Banks over 70%.In terms of assets, the largest domestic Banks are the state-owned: Banco de la Nación Argentina, which accounts 25,5% of total assets, the private Banco de Galicia y Buenos Aires (7,5%) and the Buenos Aires province-owned Banco de la Provincia de Buenos Aires (7,4%).The main foreign Banks are Spanish-owned Banco Santander Río (8,3% of total assets) and BBVA Banco Francés (5,9%), HSBC (UK, 3,8%), Banco Patagonia (Brazil 3,2%), Industrial and Commercial Bank of China (China, 3,2%), Citibank (US, 3,2%) –recently acquired by Santander Río -, and Banco Itaú (Brazil, 1,2%).While the new government focuses on ironing out some of the macroeconomic distortions, there will be significant scope for M&A activity.
Source: BCRA.
Assets
Loans
Deposits
© 2017 Deloitte & Co. S.A. All rights reserved.
Financial ServicesFinancial Entities
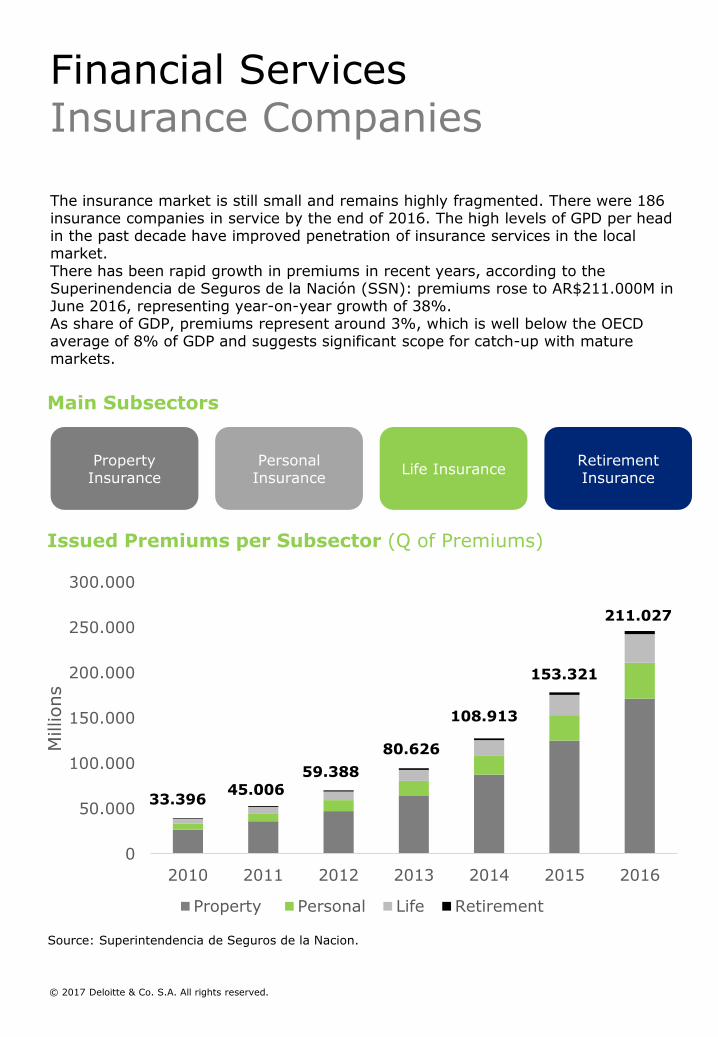
The insurance market is still small and remains highly fragmented. There were 186 insurance companies in service by the end of 2016. The high levels of GPD per head in the past decade have improved penetration of insurance services in the local market.There has been rapid growth in premiums in recent years, according to the Superinendencia de Seguros de la Nación (SSN): premiums rose to AR$211.000M in June 2016, representing year-on-year growth of 38%. As share of GDP, premiums represent around 3%, which is well below the OECD average of 8% of GDP and suggests significant scope for catch-up with mature markets.
Source: Superintendencia de Seguros de la Nacion.
Main Subsectors
Property Insurance
Personal Insurance
Life InsuranceRetirement Insurance
Issued Premiums per Subsector (Q of Premiums)
0
50.000
100.000
150.000
200.000
250.000
300.000
2010 2011 2012 2013 2014 2015 2016
Millions
Property Personal Life Retirement
33.39645.006
59.388
80.626
108.913
153.321
211.027
© 2017 Deloitte & Co. S.A. All rights reserved.
Financial ServicesInsurance Companies
32.613
3.533
3.559
3.588
3.746
3.767
3.960
4.366
4.463
4.841
5.326
6.306
6.628
7.066
9.481
13.946
-5.000 5.000 15.000 25.000 35.000
Others
MAPFRE
Royal & Sun Alliance
Meridional
Nación
Provincia
Mercantil Andina
Zurich
Segunda
QBE Bs As
B. Rivadavia
San Cristobal
Allianz
Sancor
Caja Generales
Fed. Patronal
Millions
Source: Superintendencia de Seguros de la Nacion.
7.788
539
586
628
657
664
752
1.191
1.311
1.473
1.784
1.862
1.964
2.074
2.199
2.224
0 10.000 20.000 30.000
Others
Opción
Fed. Patronal
Caruso
Assurant
ACE
CNP
Zurich Santander
BBVA Consolidar
Provincia
Sancor
Nación
Cardif
Galicia
Caja Generales
MetLife
Millions
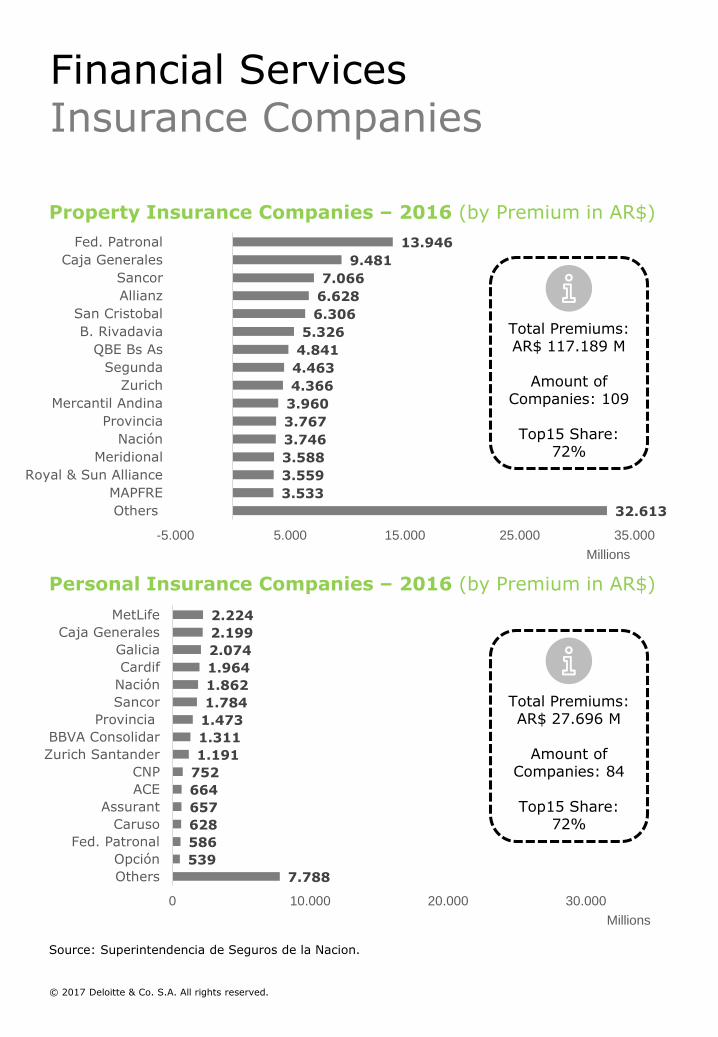
Personal Insurance Companies – 2016 (by Premium in AR$)
Property Insurance Companies – 2016 (by Premium in AR$)
Total Premiums: AR$ 117.189 M
Amount of Companies: 109
Top15 Share: 72%
Total Premiums: AR$ 27.696 M
Amount of Companies: 84
Top15 Share: 72%
© 2017 Deloitte & Co. S.A. All rights reserved.
Financial ServicesInsurance Companies
438
153
157
170
254
294
299
305
357
509
577
660
846
935
977
1.383
-5.000 5.000 15.000 25.000 35.000
Others
Tres Provincias
Mañana
Plenaria
Qualia
Segunda Personas
Instituto Salta
Provincia Vida
Binaria Vida
MAPFRE Vida
SMG Vida
Origenes Vida
Zurich International Life
HSBC Vida
Prudential
BHN Vida
Millions
Source: Superintendencia de Seguros de la Nacion.
0
1
4
5
24
39
52
90
136
144
225
337
2.524
-5.000 5.000 15.000 25.000 35.000
Galicia Retiro
Fed. Patronal Retiro
SMG Retiro
MetLife Retiro
Credicoop Retiro
Inst. Entre Ríos Retiro
Binaria Retiro
San Cristobal Retiro
HSBC Retiro
Segunda Retiro
Orígenes Retiro
Nación Retiro
Estrella Retiro
Millions
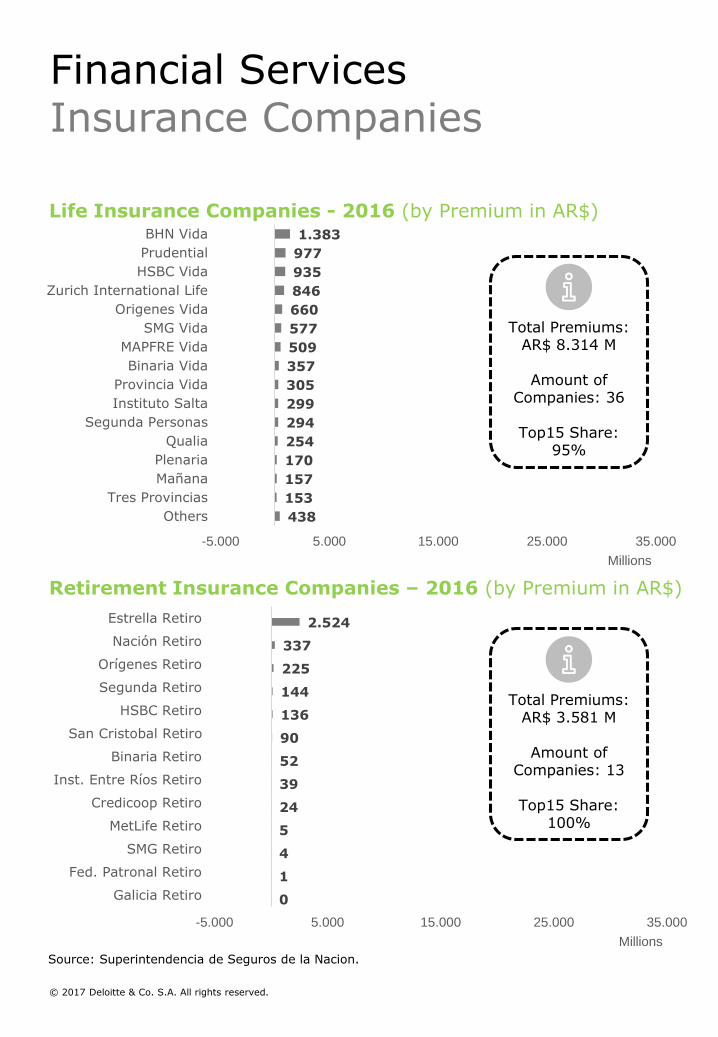
Retirement Insurance Companies – 2016 (by Premium in AR$)
Life Insurance Companies - 2016 (by Premium in AR$)
Total Premiums: AR$ 8.314 M
Amount of Companies: 36
Top15 Share: 95%
Total Premiums: AR$ 3.581 M
Amount of Companies: 13
Top15 Share: 100%
© 2017 Deloitte & Co. S.A. All rights reserved.
Financial ServicesInsurance Companies
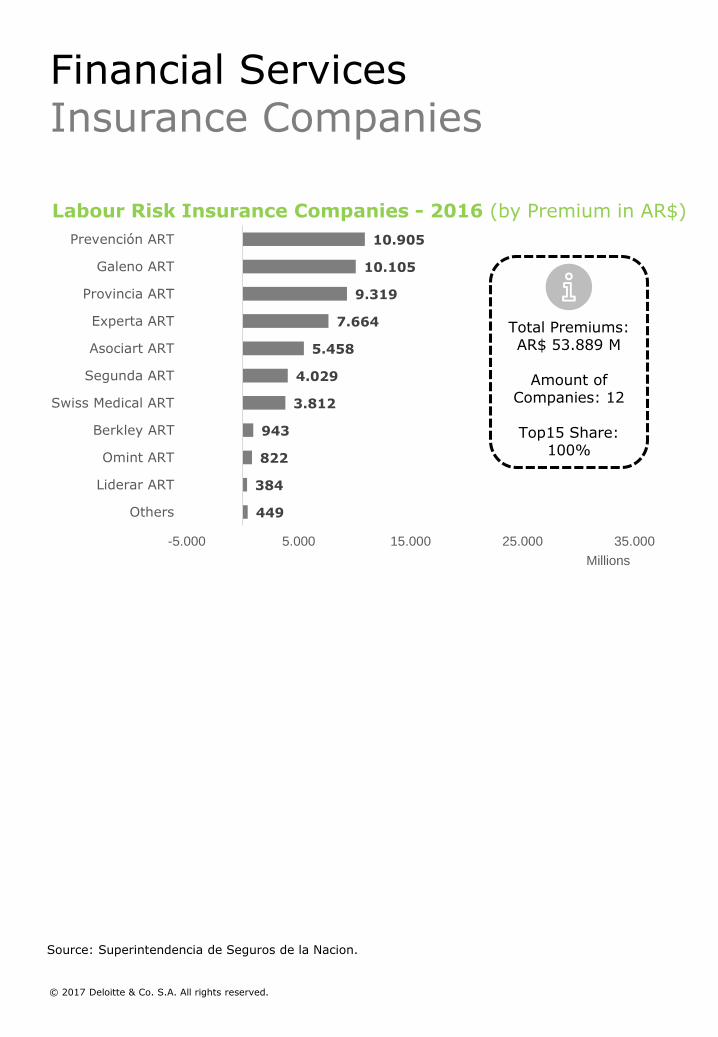
449
384
822
943
3.812
4.029
5.458
7.664
9.319
10.105
10.905
-5.000 5.000 15.000 25.000 35.000
Others
Liderar ART
Omint ART
Berkley ART
Swiss Medical ART
Segunda ART
Asociart ART
Experta ART
Provincia ART
Galeno ART
Prevención ART
Millions
Source: Superintendencia de Seguros de la Nacion.
Labour Risk Insurance Companies - 2016 (by Premium in AR$)
Total Premiums: AR$ 53.889 M
Amount of Companies: 12
Top15 Share: 100%
© 2017 Deloitte & Co. S.A. All rights reserved.
Financial ServicesInsurance Companies
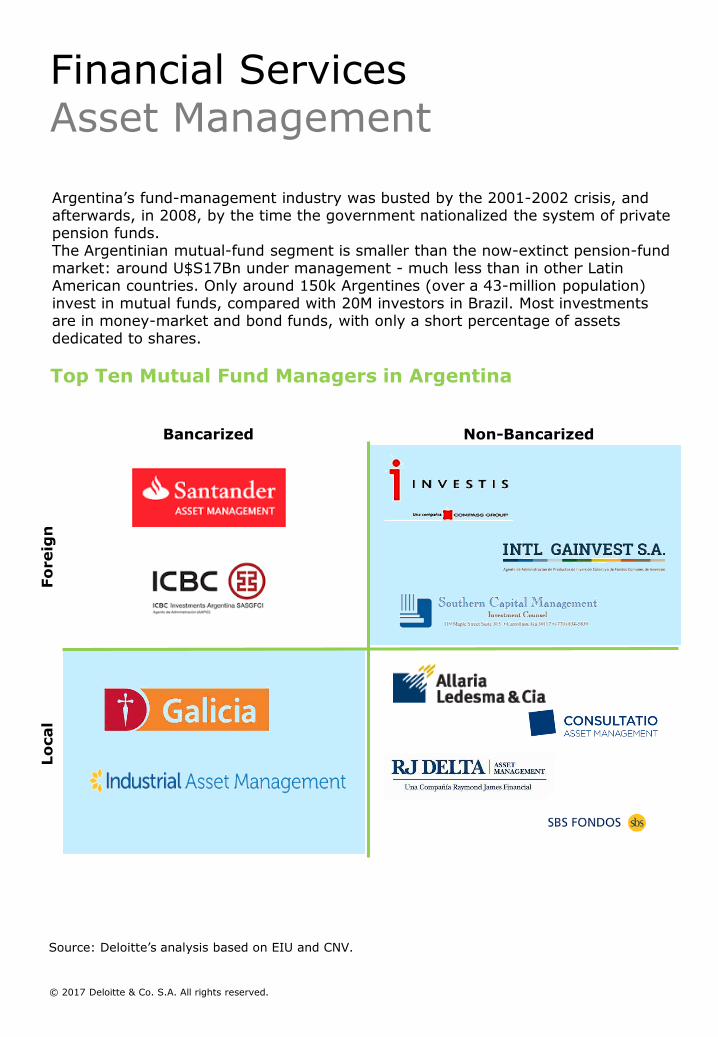
Argentina’s fund-management industry was busted by the 2001-2002 crisis, and afterwards, in 2008, by the time the government nationalized the system of private pension funds.The Argentinian mutual-fund segment is smaller than the now-extinct pension-fund market: around U$S17Bn under management - much less than in other Latin American countries. Only around 150k Argentines (over a 43-million population) invest in mutual funds, compared with 20M investors in Brazil. Most investments are in money-market and bond funds, with only a short percentage of assets dedicated to shares.
Top Ten Mutual Fund Managers in Argentina
Source: Deloitte’s analysis based on EIU and CNV.
Bancarized Non-Bancarized
Lo
cal
Fo
reig
n
© 2017 Deloitte & Co. S.A. All rights reserved.
Financial ServicesAsset Management
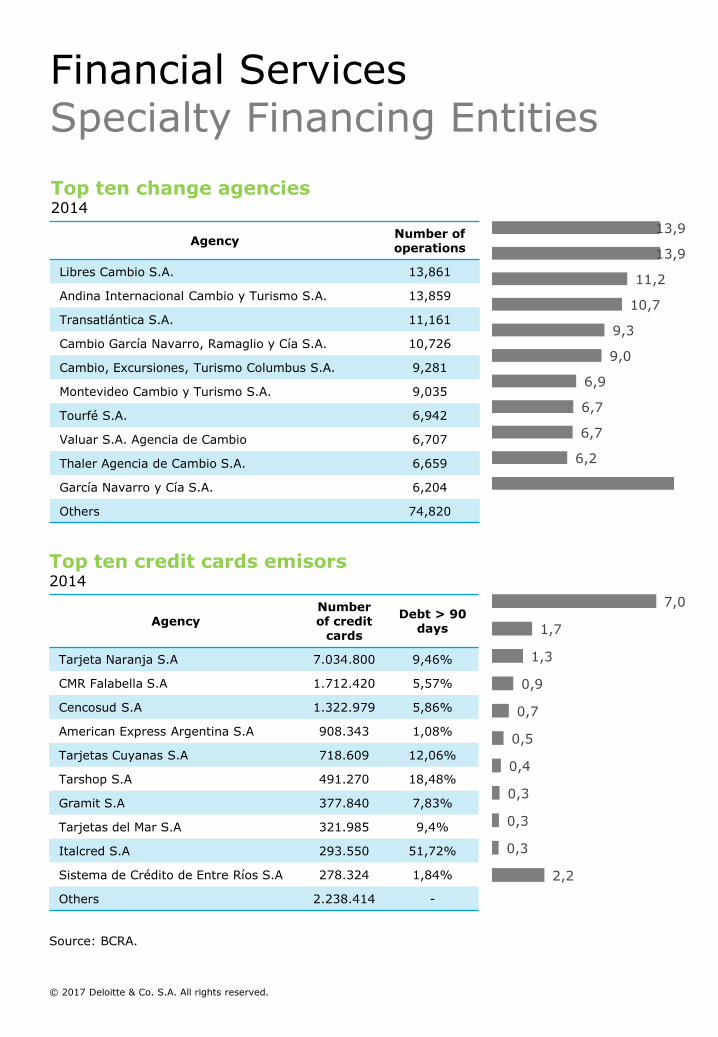
AgencyNumber of operations
Libres Cambio S.A. 13,861
Andina Internacional Cambio y Turismo S.A. 13,859
Transatlántica S.A. 11,161
Cambio García Navarro, Ramaglio y Cía S.A. 10,726
Cambio, Excursiones, Turismo Columbus S.A. 9,281
Montevideo Cambio y Turismo S.A. 9,035
Tourfé S.A. 6,942
Valuar S.A. Agencia de Cambio 6,707
Thaler Agencia de Cambio S.A. 6,659
García Navarro y Cía S.A. 6,204
Others 74,820
Top ten change agencies2014
AgencyNumber of credit
cards
Debt > 90days
Tarjeta Naranja S.A 7.034.800 9,46%
CMR Falabella S.A 1.712.420 5,57%
Cencosud S.A 1.322.979 5,86%
American Express Argentina S.A 908.343 1,08%
Tarjetas Cuyanas S.A 718.609 12,06%
Tarshop S.A 491.270 18,48%
Gramit S.A 377.840 7,83%
Tarjetas del Mar S.A 321.985 9,4%
Italcred S.A 293.550 51,72%
Sistema de Crédito de Entre Ríos S.A 278.324 1,84%
Others 2.238.414 -
Top ten credit cards emisors2014
Source: BCRA.
6,2
6,7
6,7
6,9
9,0
9,3
10,7
11,2
13,9
13,9
2,2
0,3
0,3
0,3
0,4
0,5
0,7
0,9
1,3
1,7
7,0
© 2017 Deloitte & Co. S.A. All rights reserved.
Financial ServicesSpecialty Financing Entities
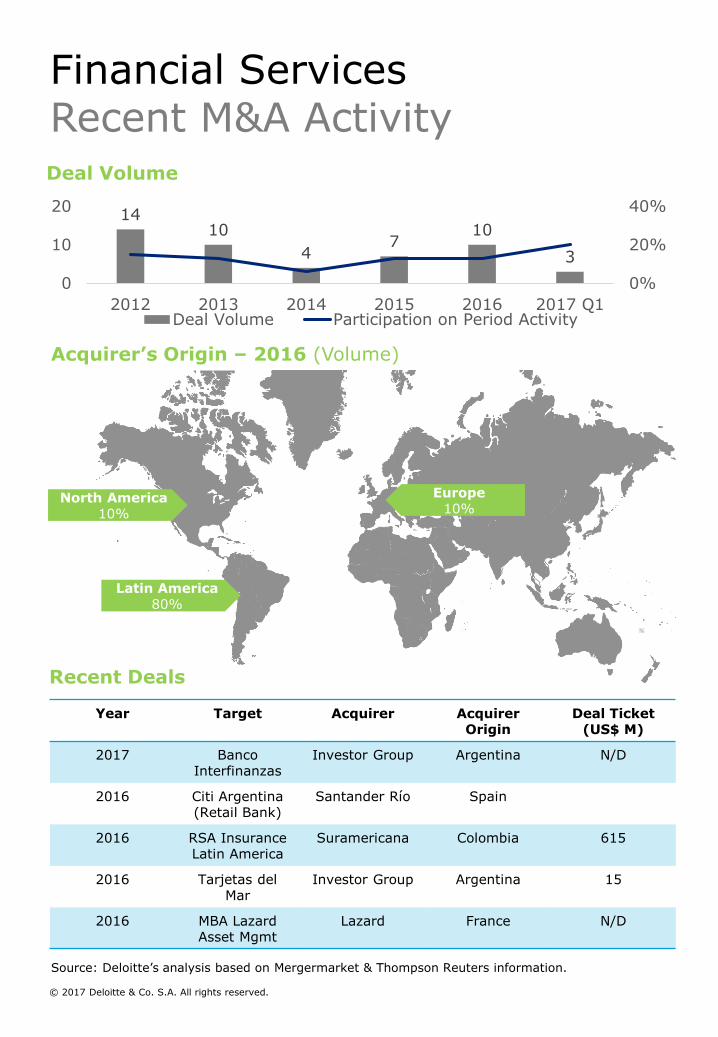
Source: Deloitte’s analysis based on Mergermarket & Thompson Reuters information.
Year Target Acquirer Acquirer Origin
Deal Ticket (US$ M)
2017 Banco Interfinanzas
Investor Group Argentina N/D
2016 Citi Argentina (Retail Bank)
Santander Río Spain
2016 RSA InsuranceLatin America
Suramericana Colombia 615
2016 Tarjetas del Mar
Investor Group Argentina 15
2016 MBA Lazard Asset Mgmt
Lazard France N/D
1410
47
10
3
0%
20%
40%
0
10
20
2012 2013 2014 2015 2016 2017 Q1Deal Volume Participation on Period Activity
Deal Volume
Acquirer’s Origin – 2016 (Volume)
North America10%
Latin America80%
Europe10%
Recent Deals
© 2017 Deloitte & Co. S.A. All rights reserved.
Financial ServicesRecent M&A Activity
Industry SnapshotAgribusiness
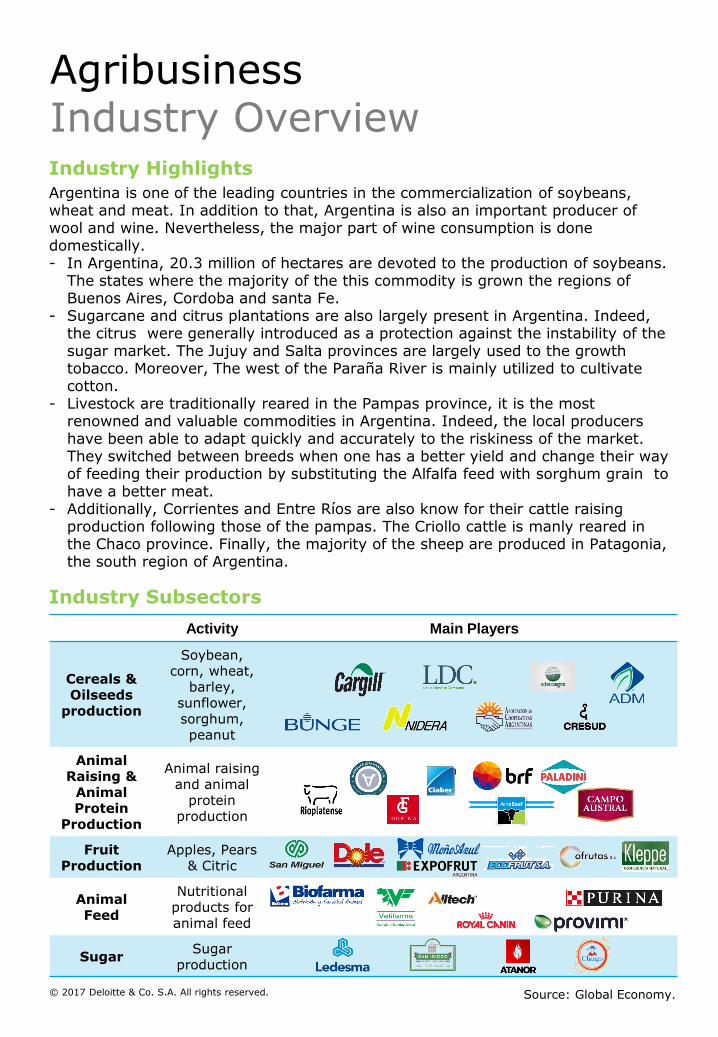
AgribusinessIndustry OverviewIndustry Highlights
Argentina is one of the leading countries in the commercialization of soybeans, wheat and meat. In addition to that, Argentina is also an important producer of wool and wine. Nevertheless, the major part of wine consumption is done domestically.- In Argentina, 20.3 million of hectares are devoted to the production of soybeans.
The states where the majority of the this commodity is grown the regions of Buenos Aires, Cordoba and santa Fe.
- Sugarcane and citrus plantations are also largely present in Argentina. Indeed, the citrus were generally introduced as a protection against the instability of the sugar market. The Jujuy and Salta provinces are largely used to the growth tobacco. Moreover, The west of the Paraña River is mainly utilized to cultivate cotton.
- Livestock are traditionally reared in the Pampas province, it is the most renowned and valuable commodities in Argentina. Indeed, the local producers have been able to adapt quickly and accurately to the riskiness of the market. They switched between breeds when one has a better yield and change their way of feeding their production by substituting the Alfalfa feed with sorghum grain to have a better meat.
- Additionally, Corrientes and Entre Ríos are also know for their cattle raising production following those of the pampas. The Criollo cattle is manly reared in the Chaco province. Finally, the majority of the sheep are produced in Patagonia, the south region of Argentina.
Source: Global Economy.
Activity Main Players
Cereals & Oilseeds
production
Soybean, corn, wheat,
barley, sunflower, sorghum, peanut
Animal Raising &
Animal Protein
Production
Animal raising and animal
protein production
Fruit Production
Apples, Pears & Citric
Animal Feed
Nutritional products for animal feed
SugarSugar
production
Industry Subsectors
© 2017 Deloitte & Co. S.A. All rights reserved.
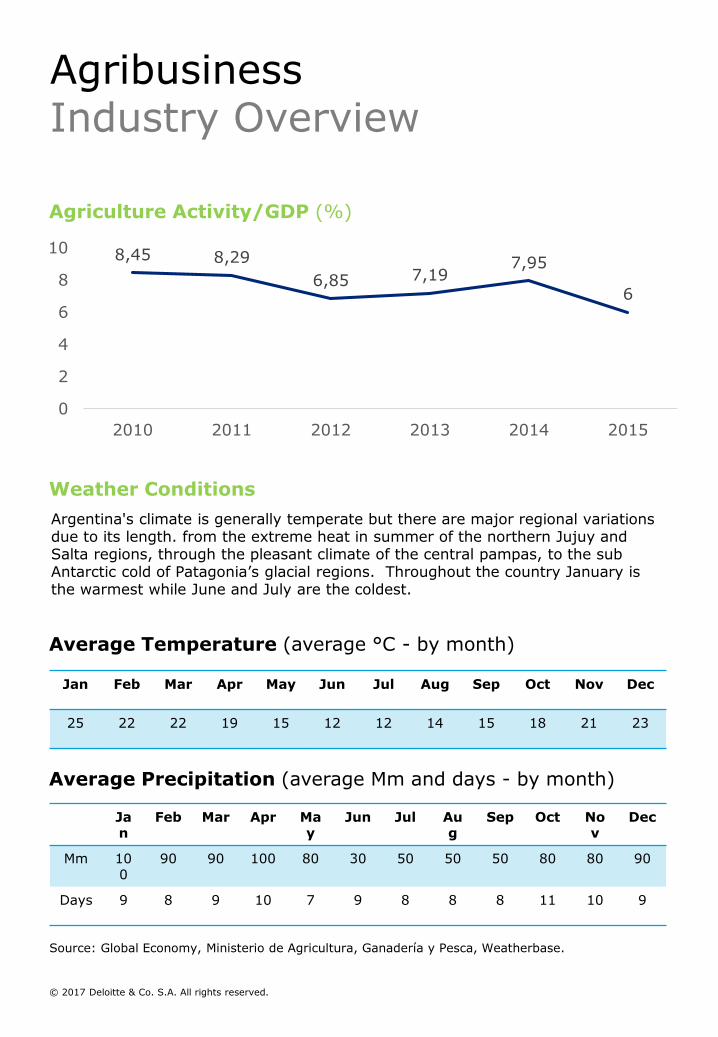
Agriculture Activity/GDP (%)
8,45 8,29
6,85 7,197,95
6
0
2
4
6
8
10
2010 2011 2012 2013 2014 2015
Source: Global Economy, Ministerio de Agricultura, Ganadería y Pesca, Weatherbase.
Weather Conditions
Argentina's climate is generally temperate but there are major regional variations due to its length. from the extreme heat in summer of the northern Jujuy and Salta regions, through the pleasant climate of the central pampas, to the sub Antarctic cold of Patagonia’s glacial regions. Throughout the country January is the warmest while June and July are the coldest.
Average Temperature (average °C - by month)
Jan Feb Mar Apr May Jun Jul Aug Sep Oct Nov Dec
25 22 22 19 15 12 12 14 15 18 21 23
Average Precipitation (average Mm and days - by month)
Jan
Feb Mar Apr May
Jun Jul Aug
Sep Oct Nov
Dec
Mm 100
90 90 100 80 30 50 50 50 80 80 90
Days 9 8 9 10 7 9 8 8 8 11 10 9
© 2017 Deloitte & Co. S.A. All rights reserved.
AgribusinessIndustry Overview

Cereals & Oilseeds Production
Production (M of Tns)
Source: USDA.
Yield (000 Tns/Ha)
0
50
100
Argentina Brazil Paraguay Peru Uruguay
0,0
1,0
2,0
3,0
Argentina Brazil Paraguay Peru Uruguay
0
20
40
60
Argentina Brazil Paraguay Peru Uruguay
Exports (M of Tns)
Growth
AR: 1,2x
BR: 4,0x
PY: 2,5x
PE: -
UY: 212x
2017 Yield
AR: 2,9
BR: 3,3
PY: 2,8
PE: 1,5
UY: 2,5
Growth
AR: 2,0x
BR: 2,8x
PY: 2,9x
PE: 1,0x
UY: 117x
© 2017 Deloitte & Co. S.A. All rights reserved.
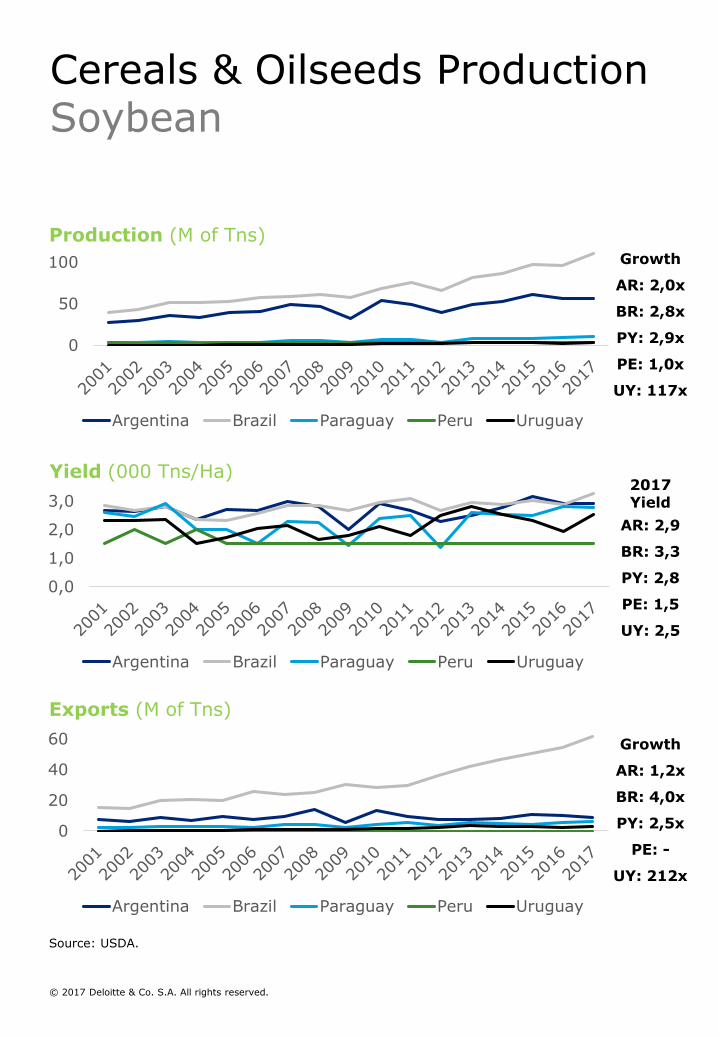
Cereals & Oilseeds ProductionSoybean
Production (M of Tns)
Source: USDA.
Yield (000 Tns/Ha)
0,0
1,0
2,0
3,0
4,0
Argentina Brazil Paraguay Peru Uruguay
0
5
10
Argentina Brazil Paraguay Peru Uruguay
Exports (M of Tns)Growth
AR: 0,9x
BR: 466x
PY: 6,7x
PE: 4,3
UY: 55x
2017 Yield
AR: 3,3
BR: 3,2
PY: 1,9
PE: 1,5
UY: 3,7
0
5
10
15
20
Argentina Brazil Paraguay Peru Uruguay
Growth
AR: 0,9x
BR: 4,1x
PY: 2,9x
PE: 1,0x
UY: 2,5x
© 2017 Deloitte & Co. S.A. All rights reserved.
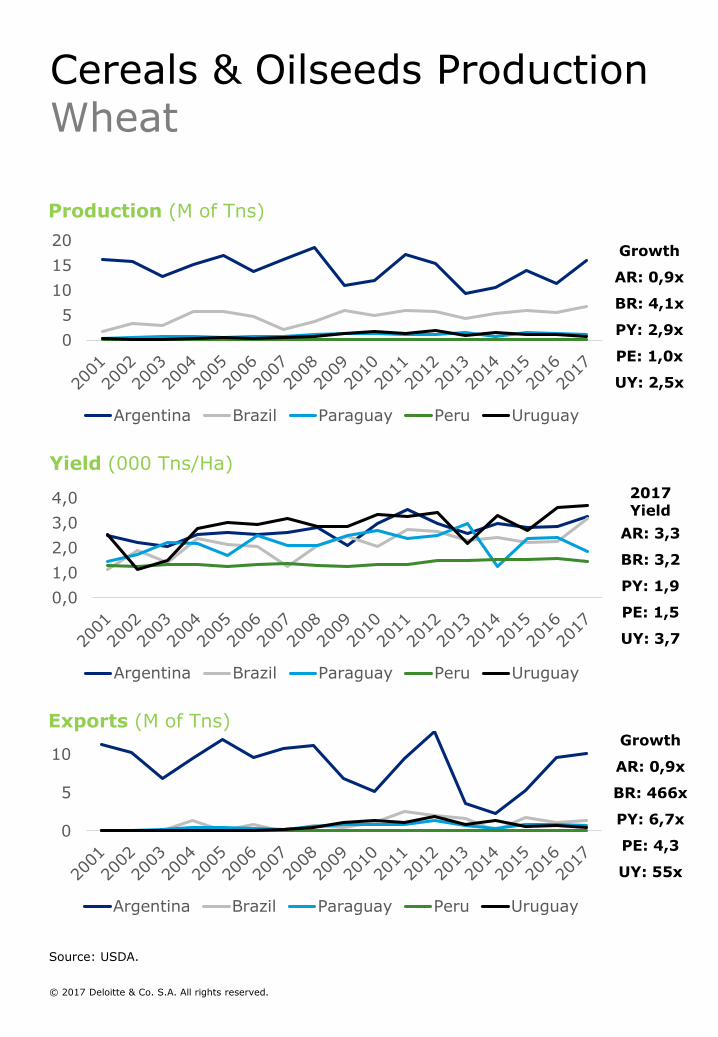
Cereals & Oilseeds ProductionWheat
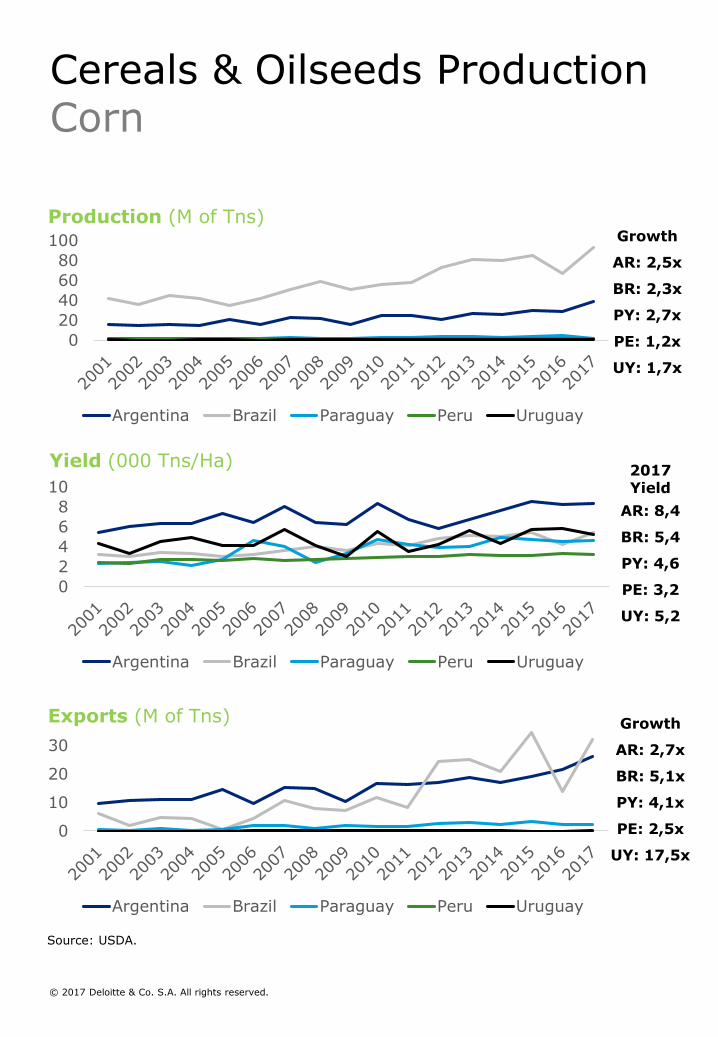
Production (M of Tns)
Source: USDA.
Yield (000 Tns/Ha)
0
2
4
6
8
10
Argentina Brazil Paraguay Peru Uruguay
0
10
20
30
Argentina Brazil Paraguay Peru Uruguay
Exports (M of Tns) Growth
AR: 2,7x
BR: 5,1x
PY: 4,1x
PE: 2,5x
UY: 17,5x
2017 Yield
AR: 8,4
BR: 5,4
PY: 4,6
PE: 3,2
UY: 5,2
0
20
40
60
80
100
Argentina Brazil Paraguay Peru Uruguay
Growth
AR: 2,5x
BR: 2,3x
PY: 2,7x
PE: 1,2x
UY: 1,7x
© 2017 Deloitte & Co. S.A. All rights reserved.
Cereals & Oilseeds ProductionCorn
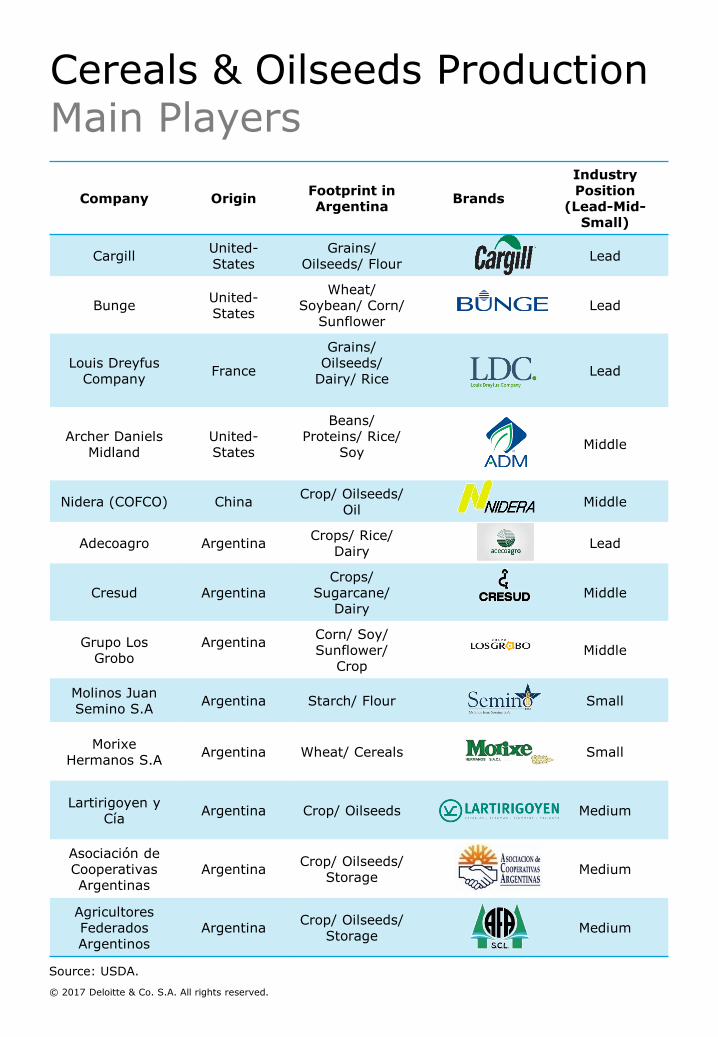
Cereals & Oilseeds ProductionMain Players
Source: USDA.
Company OriginFootprint in Argentina
Brands
Industry Position
(Lead-Mid-Small)
CargillUnited-States
Grains/Oilseeds/ Flour
Lead
BungeUnited-States
Wheat/ Soybean/ Corn/
SunflowerLead
Louis Dreyfus Company
France
Grains/Oilseeds/
Dairy/ RiceLead
Archer Daniels Midland
United-States
Beans/ Proteins/ Rice/
SoyMiddle
Nidera (COFCO) ChinaCrop/ Oilseeds/
OilMiddle
Adecoagro ArgentinaCrops/ Rice/
DairyLead
Cresud ArgentinaCrops/
Sugarcane/ Dairy
Middle
Grupo Los Grobo
ArgentinaCorn/ Soy/ Sunflower/
CropMiddle
Molinos Juan Semino S.A
Argentina Starch/ Flour Small
MorixeHermanos S.A
Argentina Wheat/ Cereals Small
Lartirigoyen y Cía
Argentina Crop/ Oilseeds Medium
Asociación de CooperativasArgentinas
ArgentinaCrop/ Oilseeds/
StorageMedium
AgricultoresFederadosArgentinos
ArgentinaCrop/ Oilseeds/
StorageMedium
© 2017 Deloitte & Co. S.A. All rights reserved.

Animal Raising & Animal Protein Production
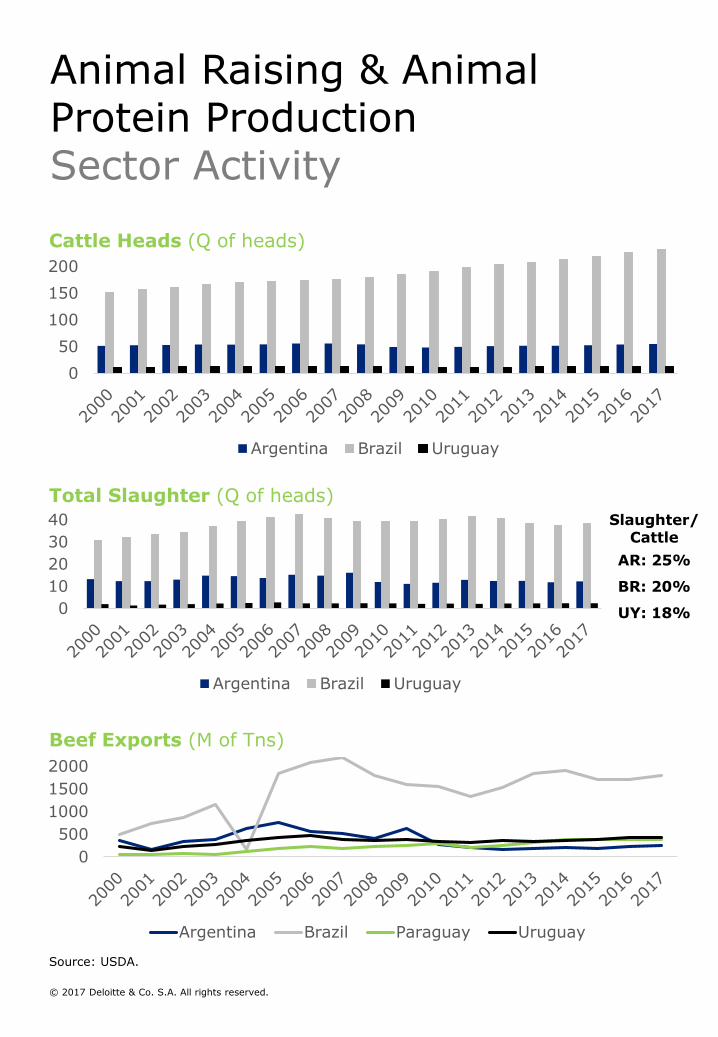
Source: USDA.
Cattle Heads (Q of heads)
0
50
100
150
200
Argentina Brazil Uruguay
Total Slaughter (Q of heads)
0
10
20
30
40
Argentina Brazil Uruguay
Slaughter/ Cattle
AR: 25%
BR: 20%
UY: 18%
0
500
1000
1500
2000
Argentina Brazil Paraguay Uruguay
Beef Exports (M of Tns)
© 2017 Deloitte & Co. S.A. All rights reserved.
Animal Raising & Animal Protein Production Sector Activity
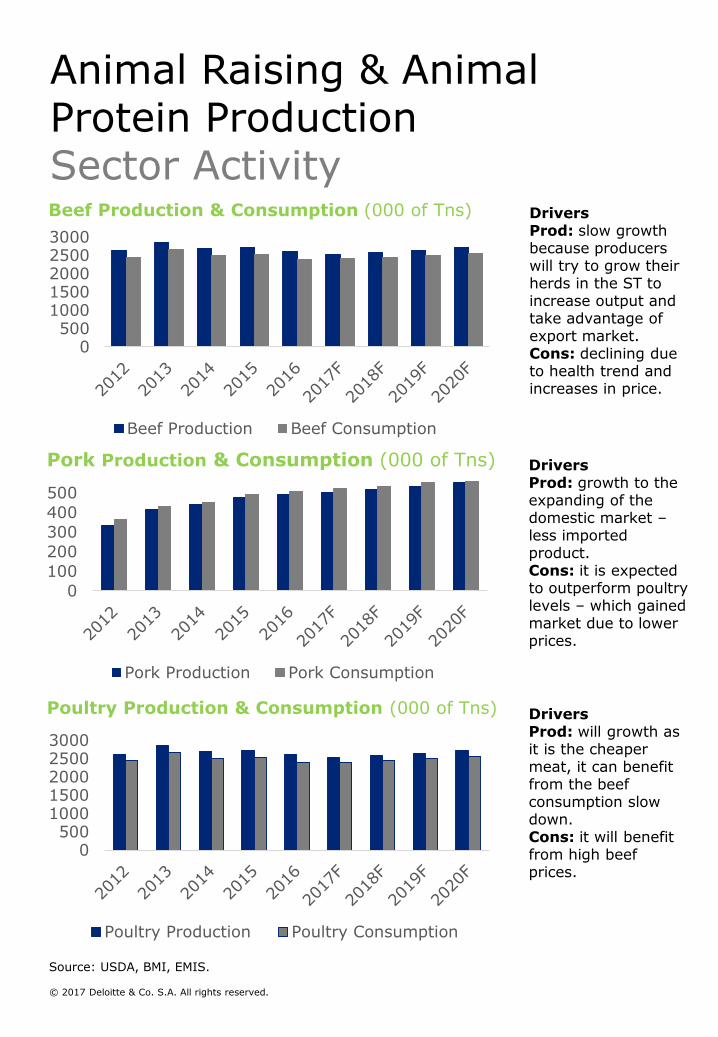
Source: USDA, BMI, EMIS.
Beef Production & Consumption (000 of Tns)
0500
10001500200025003000
Beef Production Beef Consumption
Pork Production & Consumption (000 of Tns)
0
100
200
300
400
500
Pork Production Pork Consumption
Poultry Production & Consumption (000 of Tns)
0500
10001500200025003000
Poultry Production Poultry Consumption
DriversProd: slow growth because producers will try to grow their herds in the ST to increase output and take advantage of export market.Cons: declining due to health trend and increases in price.
DriversProd: growth to the expanding of the domestic market –less imported product.Cons: it is expected to outperform poultry levels – which gained market due to lower prices.
DriversProd: will growth as it is the cheaper meat, it can benefit from the beef consumption slow down.Cons: it will benefit from high beef prices.
© 2017 Deloitte & Co. S.A. All rights reserved.
Animal Raising & Animal Protein Production Sector Activity
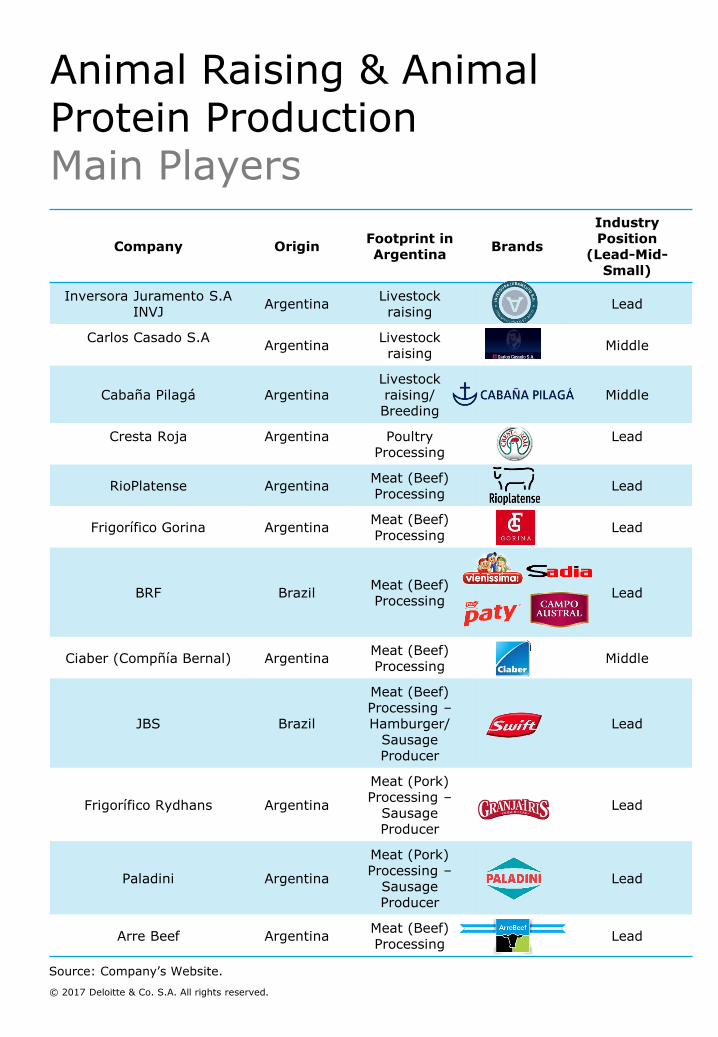
Animal Raising & Animal Protein Production Main Players
Source: Company’s Website.
Company OriginFootprint in Argentina
Brands
Industry Position
(Lead-Mid-Small)
Inversora Juramento S.A INVJ
ArgentinaLivestockraising
Lead
Carlos Casado S.AArgentina
Livestock raising
Middle
Cabaña Pilagá ArgentinaLivestock raising/ Breeding
Middle
Cresta Roja Argentina PoultryProcessing
Lead
RioPlatense ArgentinaMeat (Beef) Processing
Lead
Frigorífico Gorina ArgentinaMeat (Beef) Processing
Lead
BRF BrazilMeat (Beef) Processing
Lead
Ciaber (Compñía Bernal) ArgentinaMeat (Beef) Processing
Middle
JBS Brazil
Meat (Beef) Processing –Hamburger/
Sausage Producer
Lead
Frigorífico Rydhans Argentina
Meat (Pork) Processing –
Sausage Producer
Lead
Paladini Argentina
Meat (Pork) Processing –
Sausage Producer
Lead
Arre Beef ArgentinaMeat (Beef) Processing
Lead
© 2017 Deloitte & Co. S.A. All rights reserved.
Fruits Production
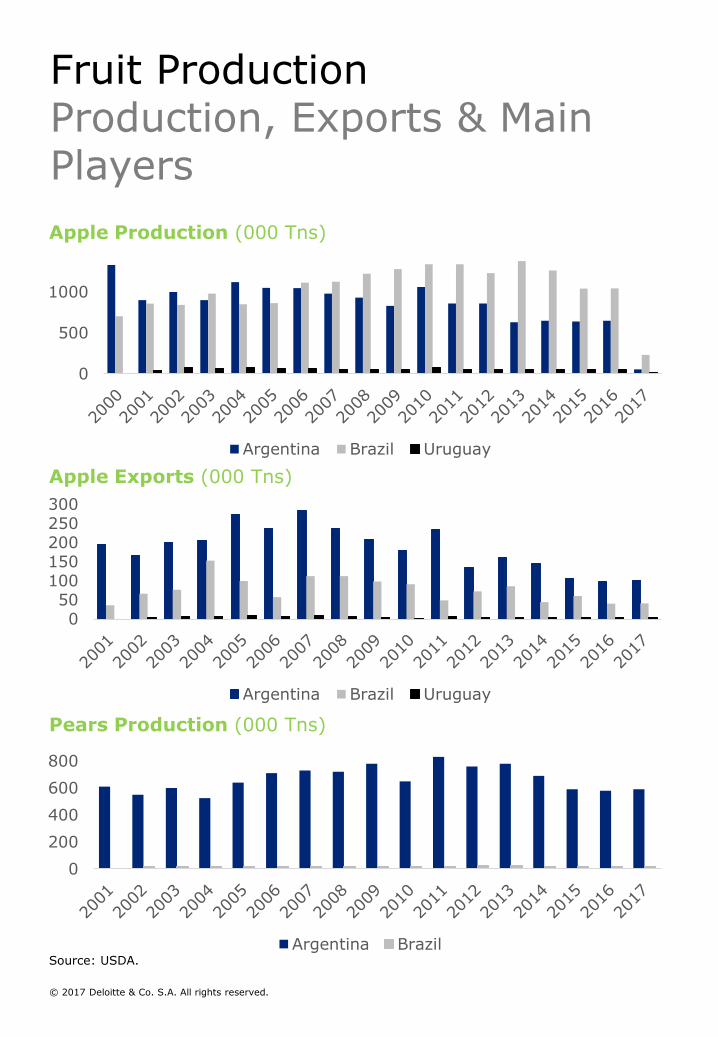
Source: USDA.
Apple Production (000 Tns)
0
500
1000
Argentina Brazil Uruguay
Apple Exports (000 Tns)
050
100150200250300
Argentina Brazil Uruguay
Pears Production (000 Tns)
0
200
400
600
800
Argentina Brazil
© 2017 Deloitte & Co. S.A. All rights reserved.
Fruit ProductionProduction, Exports & Main Players
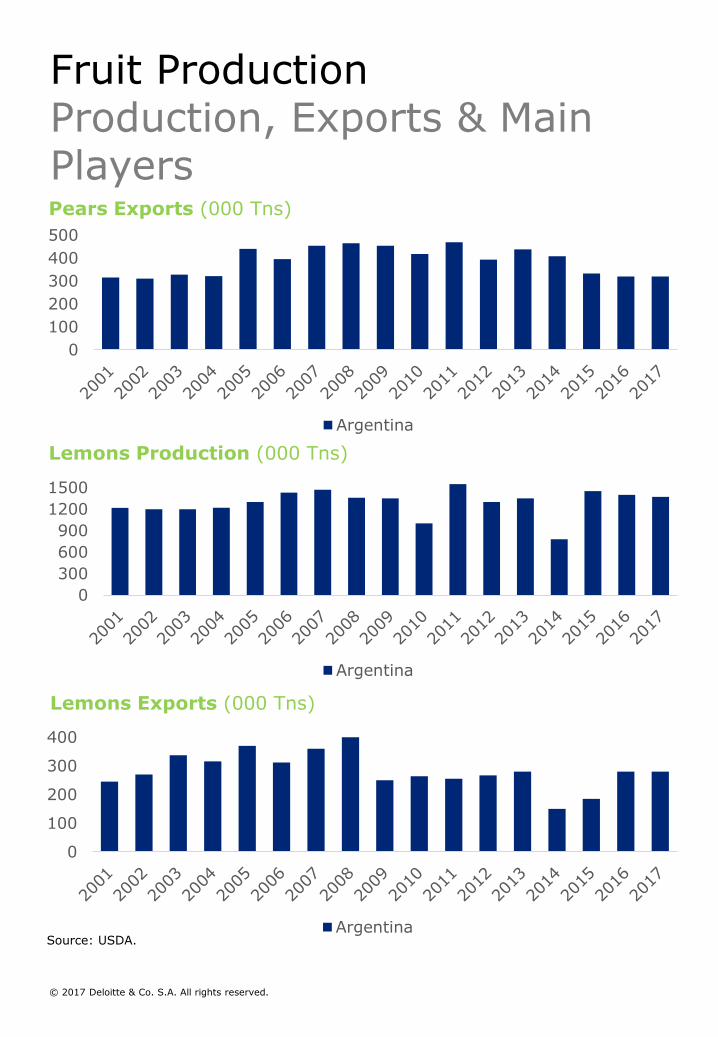
Source: USDA.
Pears Exports (000 Tns)
0
100
200
300
400
500
Argentina
Lemons Production (000 Tns)
Lemons Exports (000 Tns)
0
300
600
900
1200
1500
Argentina
0
100
200
300
400
Argentina
© 2017 Deloitte & Co. S.A. All rights reserved.
Fruit ProductionProduction, Exports & Main Players
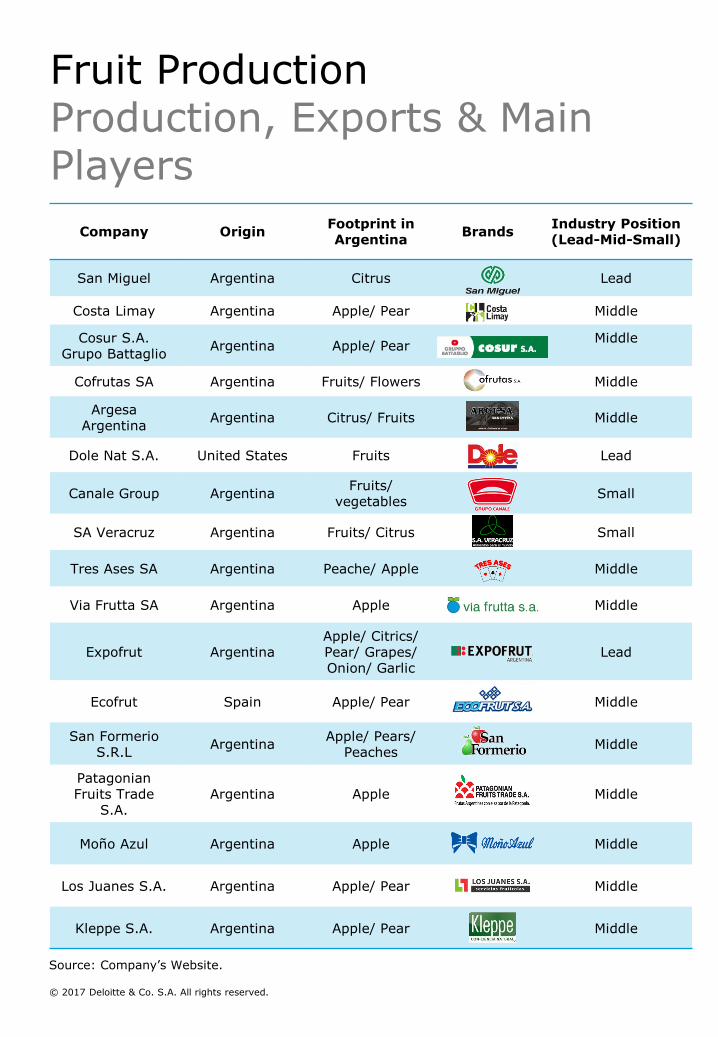
Fruit ProductionProduction, Exports & Main Players
Source: Company’s Website.
Company OriginFootprint in Argentina
BrandsIndustry Position(Lead-Mid-Small)
San Miguel Argentina Citrus Lead
Costa Limay Argentina Apple/ Pear Middle
Cosur S.A.Grupo Battaglio
Argentina Apple/ PearMiddle
Cofrutas SA Argentina Fruits/ Flowers Middle
ArgesaArgentina
Argentina Citrus/ Fruits Middle
Dole Nat S.A. United States Fruits Lead
Canale Group ArgentinaFruits/
vegetablesSmall
SA Veracruz Argentina Fruits/ Citrus Small
Tres Ases SA Argentina Peache/ Apple Middle
Via Frutta SA Argentina Apple Middle
Expofrut ArgentinaApple/ Citrics/Pear/ Grapes/ Onion/ Garlic
Lead
Ecofrut Spain Apple/ Pear Middle
San FormerioS.R.L
ArgentinaApple/ Pears/
PeachesMiddle
Patagonian Fruits Trade
S.A.Argentina Apple Middle
Moño Azul Argentina Apple Middle
Los Juanes S.A. Argentina Apple/ Pear Middle
Kleppe S.A. Argentina Apple/ Pear Middle
© 2017 Deloitte & Co. S.A. All rights reserved.

Animal Feed
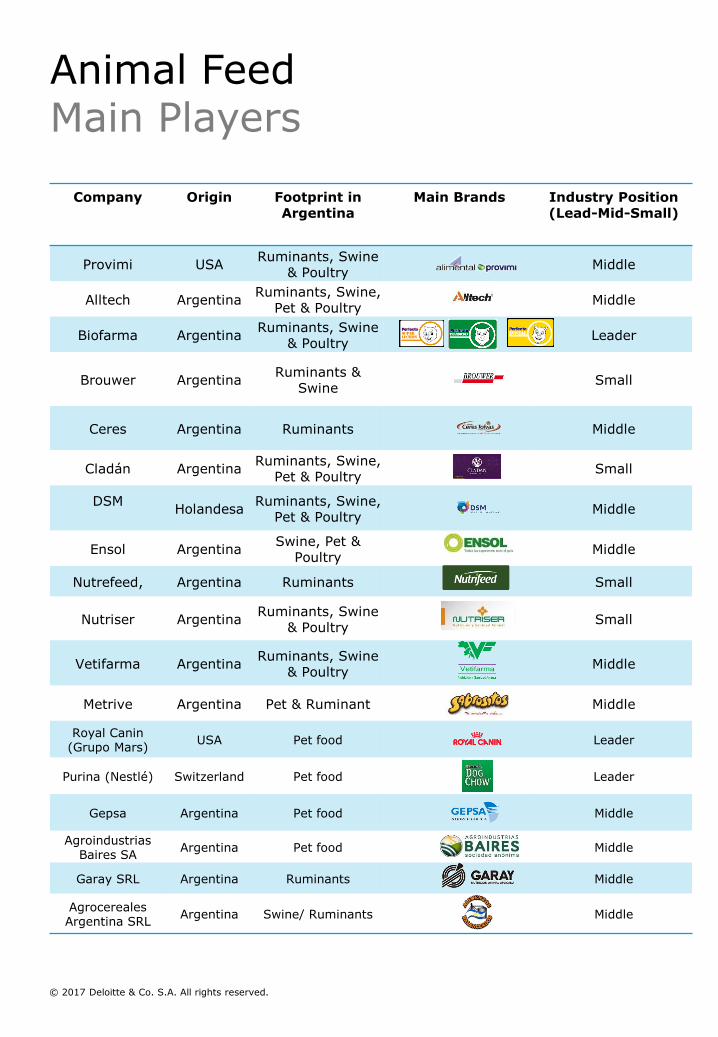
Company Origin Footprint in Argentina
Main Brands Industry Position(Lead-Mid-Small)
Provimi USARuminants, Swine
& PoultryMiddle
Alltech ArgentinaRuminants, Swine,
Pet & PoultryMiddle
Biofarma ArgentinaRuminants, Swine
& PoultryLeader
Brouwer ArgentinaRuminants &
SwineSmall
Ceres Argentina Ruminants Middle
Cladán ArgentinaRuminants, Swine,
Pet & PoultrySmall
DSMHolandesa
Ruminants, Swine, Pet & Poultry
Middle
Ensol ArgentinaSwine, Pet &
PoultryMiddle
Nutrefeed, Argentina Ruminants Small
Nutriser ArgentinaRuminants, Swine
& PoultrySmall
Vetifarma ArgentinaRuminants, Swine
& PoultryMiddle
Metrive Argentina Pet & Ruminant Middle
Royal Canin(Grupo Mars)
USA Pet food Leader
Purina (Nestlé) Switzerland Pet food Leader
Gepsa Argentina Pet food Middle
Agroindustrias Baires SA
Argentina Pet food Middle
Garay SRL Argentina Ruminants Middle
AgrocerealesArgentina SRL
Argentina Swine/ Ruminants Middle
© 2017 Deloitte & Co. S.A. All rights reserved.
Animal FeedMain Players

Sugar
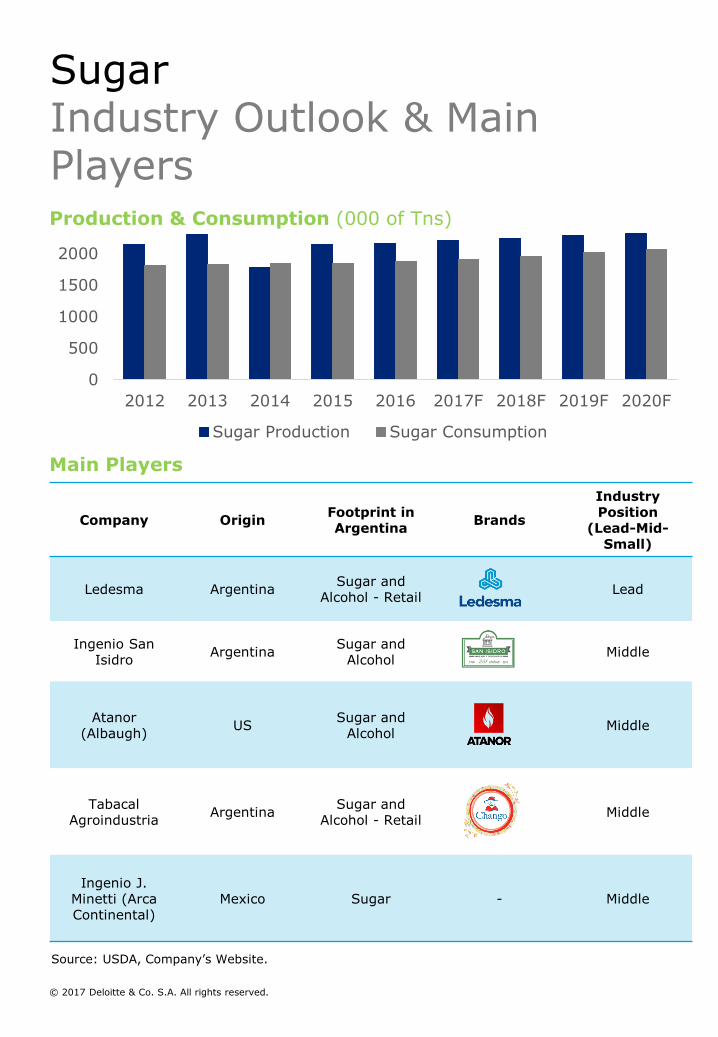
Source: USDA, Company’s Website.
Production & Consumption (000 of Tns)
0
500
1000
1500
2000
2012 2013 2014 2015 2016 2017F 2018F 2019F 2020F
Sugar Production Sugar Consumption
Main Players
Company OriginFootprint in Argentina
Brands
Industry Position
(Lead-Mid-Small)
Ledesma ArgentinaSugar and
Alcohol - RetailLead
Ingenio San Isidro
ArgentinaSugar and
AlcoholMiddle
Atanor(Albaugh)
USSugar and
AlcoholMiddle
TabacalAgroindustria
ArgentinaSugar and
Alcohol - RetailMiddle
Ingenio J. Minetti (ArcaContinental)
Mexico Sugar - Middle
© 2017 Deloitte & Co. S.A. All rights reserved.
SugarIndustry Outlook & Main Players
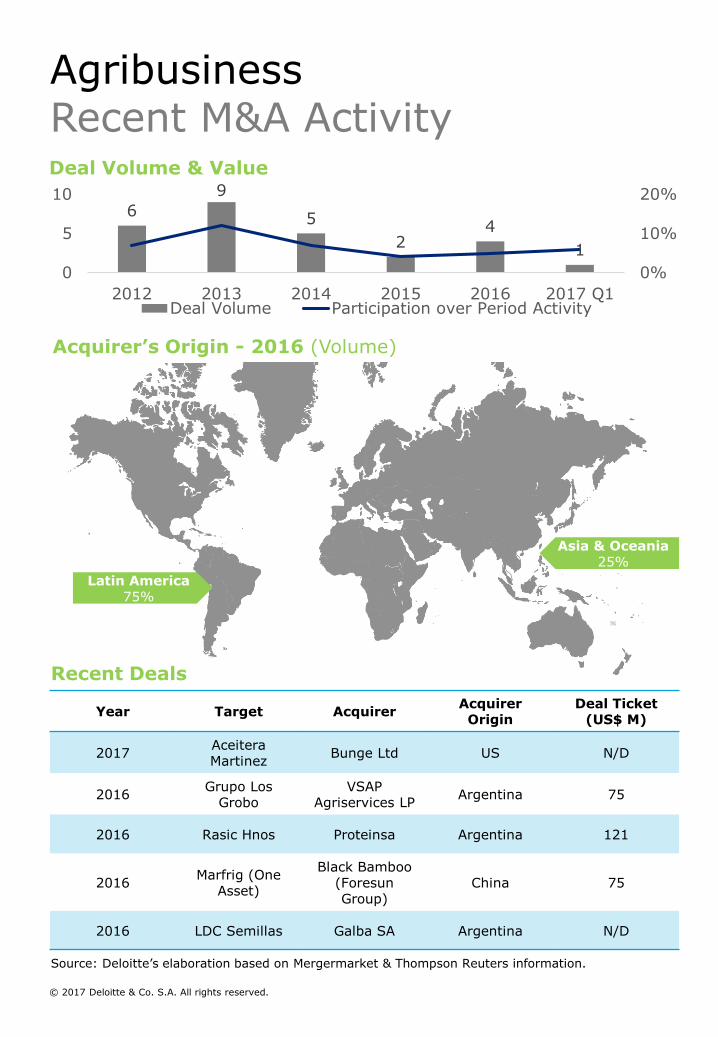
Source: Deloitte’s elaboration based on Mergermarket & Thompson Reuters information.
Year Target AcquirerAcquirer Origin
Deal Ticket(US$ M)
2017AceiteraMartinez
Bunge Ltd US N/D
2016Grupo Los
GroboVSAP
Agriservices LPArgentina 75
2016 Rasic Hnos Proteinsa Argentina 121
2016Marfrig (One
Asset)
Black Bamboo (ForesunGroup)
China 75
2016 LDC Semillas Galba SA Argentina N/D
6
9
5
24
1
0%
10%
20%
0
5
10
2012 2013 2014 2015 2016 2017 Q1Deal Volume Participation over Period Activity
Deal Volume & Value
Acquirer’s Origin - 2016 (Volume)
Latin America75%
Asia & Oceania25%
Recent Deals
© 2017 Deloitte & Co. S.A. All rights reserved.
AgribusinessRecent M&A Activity

Industry SnapshotTelecommunications, Media & Technology
Industries Highlights
Industries Subsectors
IndustryMain Players
Foreign Domestic
Telecomunications
Media
Technology
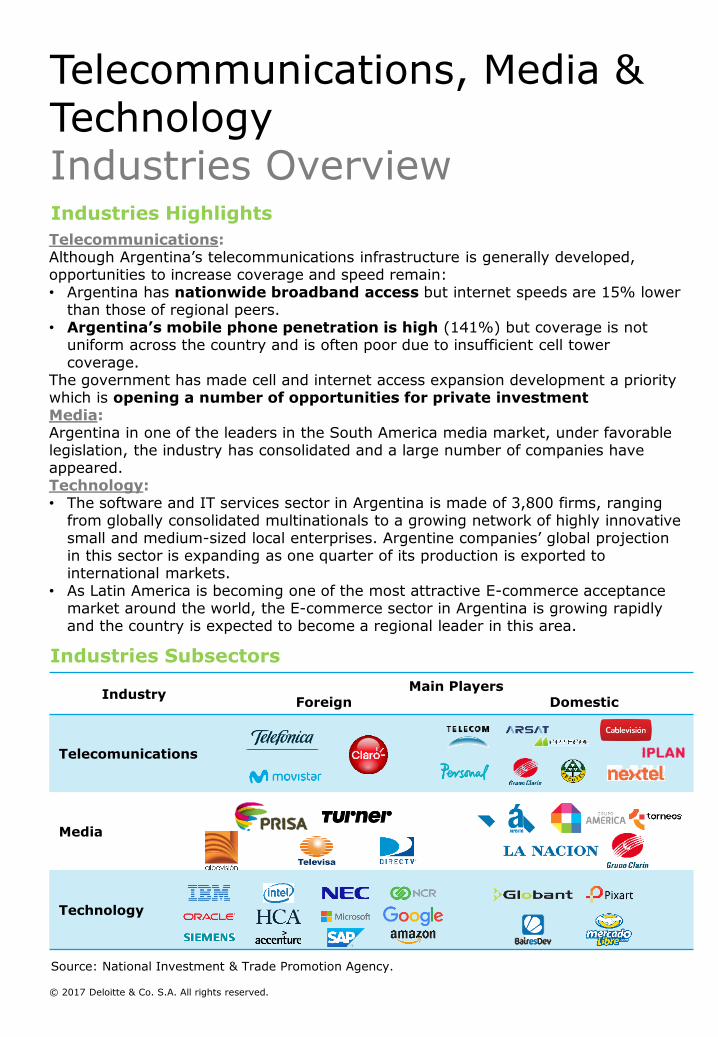
Telecommunications:Although Argentina’s telecommunications infrastructure is generally developed, opportunities to increase coverage and speed remain:• Argentina has nationwide broadband access but internet speeds are 15% lower
than those of regional peers.• Argentina’s mobile phone penetration is high (141%) but coverage is not
uniform across the country and is often poor due to insufficient cell tower coverage.
The government has made cell and internet access expansion development a priority which is opening a number of opportunities for private investmentMedia:Argentina in one of the leaders in the South America media market, under favorable legislation, the industry has consolidated and a large number of companies have appeared.Technology:• The software and IT services sector in Argentina is made of 3,800 firms, ranging
from globally consolidated multinationals to a growing network of highly innovative small and medium-sized local enterprises. Argentine companies’ global projection in this sector is expanding as one quarter of its production is exported to international markets.
• As Latin America is becoming one of the most attractive E-commerce acceptance market around the world, the E-commerce sector in Argentina is growing rapidly and the country is expected to become a regional leader in this area.
Source: National Investment & Trade Promotion Agency.
© 2017 Deloitte & Co. S.A. All rights reserved.
Telecommunications, Media & TechnologyIndustries Overview

Telecommunications
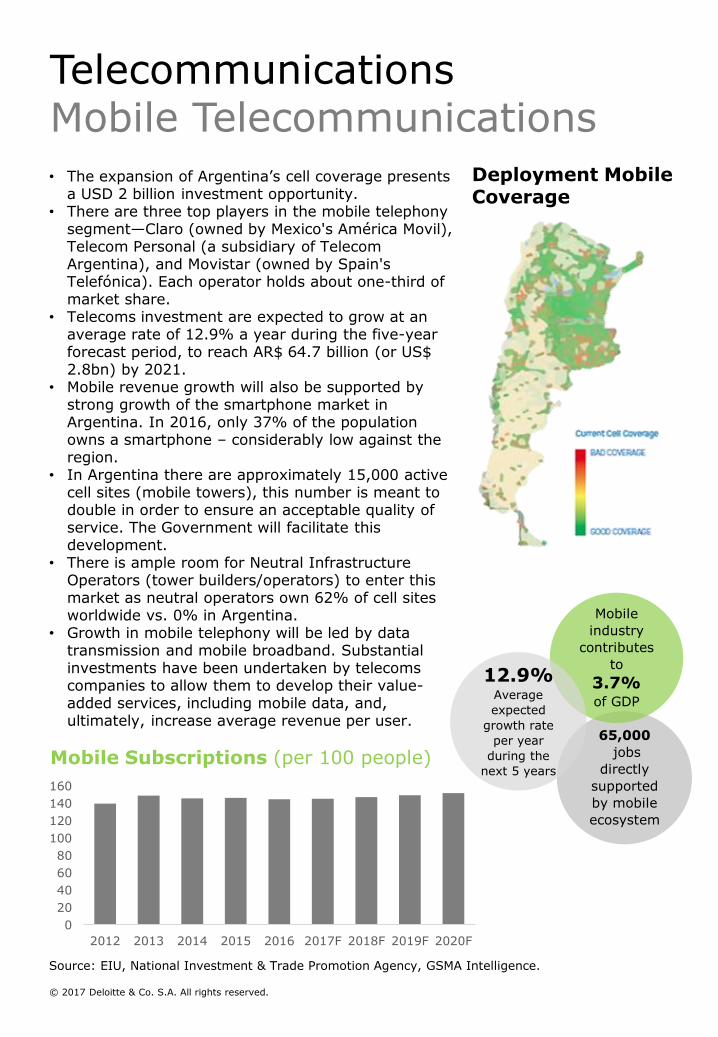
• The expansion of Argentina’s cell coverage presents a USD 2 billion investment opportunity.
• There are three top players in the mobile telephony segment—Claro (owned by Mexico's América Movil), Telecom Personal (a subsidiary of Telecom Argentina), and Movistar (owned by Spain's Telefónica). Each operator holds about one-third of market share.
• Telecoms investment are expected to grow at an average rate of 12.9% a year during the five-year forecast period, to reach AR$ 64.7 billion (or US$ 2.8bn) by 2021.
• Mobile revenue growth will also be supported by strong growth of the smartphone market in Argentina. In 2016, only 37% of the population owns a smartphone – considerably low against the region.
• In Argentina there are approximately 15,000 active cell sites (mobile towers), this number is meant to double in order to ensure an acceptable quality of service. The Government will facilitate this development.
• There is ample room for Neutral Infrastructure Operators (tower builders/operators) to enter this market as neutral operators own 62% of cell sites worldwide vs. 0% in Argentina.
• Growth in mobile telephony will be led by data transmission and mobile broadband. Substantial investments have been undertaken by telecoms companies to allow them to develop their value-added services, including mobile data, and, ultimately, increase average revenue per user.
65,000
jobs
directly
supported
by mobile
ecosystem
Mobile
industry
contributes
to
3.7%of GDP
12.9%Average
expected
growth rate
per year
during the
next 5 years
Source: EIU, National Investment & Trade Promotion Agency, GSMA Intelligence.
Mobile Subscriptions (per 100 people)
Deployment Mobile Coverage
0
20
40
60
80
100
120
140
160
2012 2013 2014 2015 2016 2017F 2018F 2019F 2020F
© 2017 Deloitte & Co. S.A. All rights reserved.
TelecommunicationsMobile Telecommunications
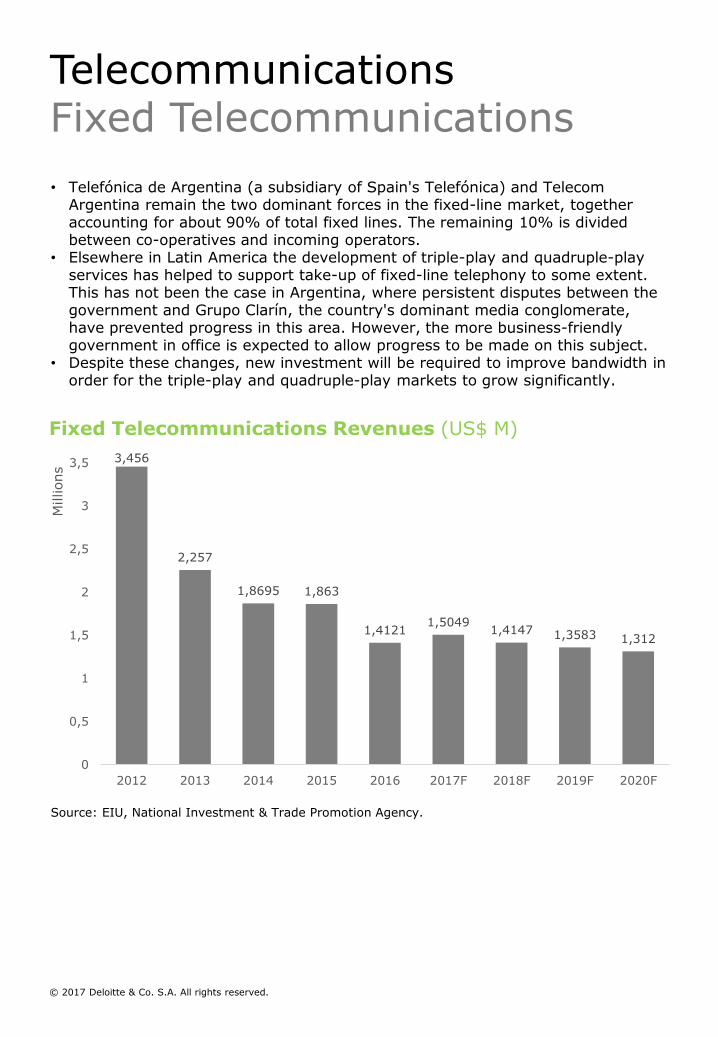
• Telefónica de Argentina (a subsidiary of Spain's Telefónica) and Telecom Argentina remain the two dominant forces in the fixed-line market, together accounting for about 90% of total fixed lines. The remaining 10% is divided between co-operatives and incoming operators.
• Elsewhere in Latin America the development of triple-play and quadruple-play services has helped to support take-up of fixed-line telephony to some extent. This has not been the case in Argentina, where persistent disputes between the government and Grupo Clarín, the country's dominant media conglomerate, have prevented progress in this area. However, the more business-friendly government in office is expected to allow progress to be made on this subject.
• Despite these changes, new investment will be required to improve bandwidth in order for the triple-play and quadruple-play markets to grow significantly.
Source: EIU, National Investment & Trade Promotion Agency.
3,456
2,257
1,8695 1,863
1,41211,5049
1,4147 1,3583 1,312
0
0,5
1
1,5
2
2,5
3
3,5
2012 2013 2014 2015 2016 2017F 2018F 2019F 2020F
Millions
Fixed Telecommunications Revenues (US$ M)
© 2017 Deloitte & Co. S.A. All rights reserved.
TelecommunicationsFixed Telecommunications
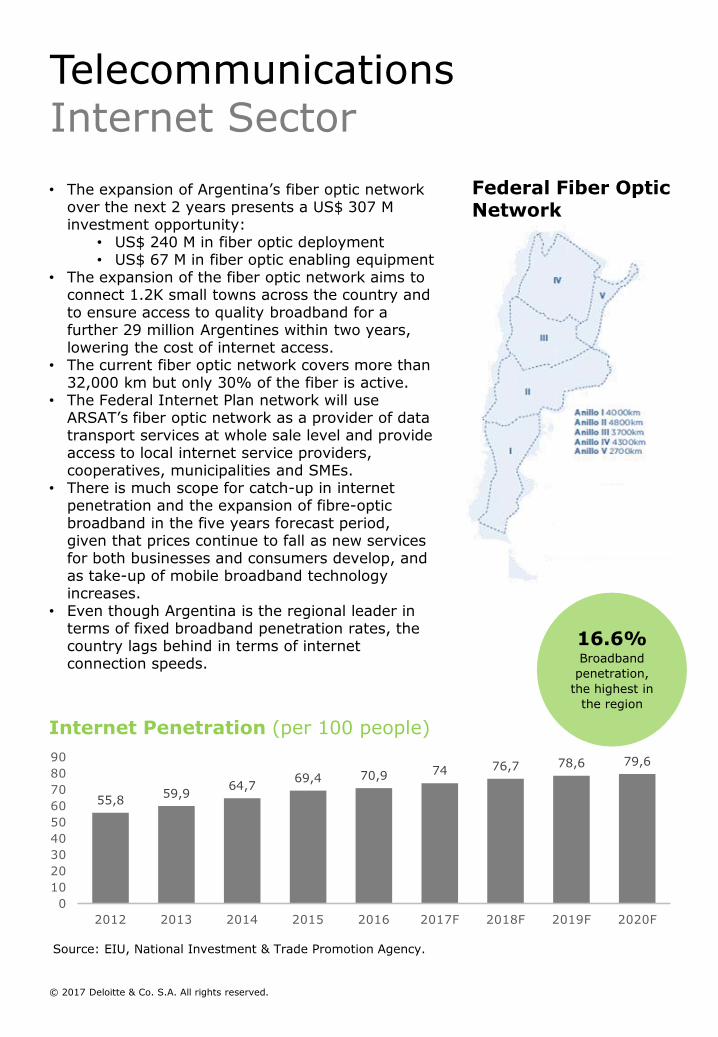
• The expansion of Argentina’s fiber optic network over the next 2 years presents a US$ 307 M investment opportunity:
• US$ 240 M in fiber optic deployment• US$ 67 M in fiber optic enabling equipment
• The expansion of the fiber optic network aims to connect 1.2K small towns across the country and to ensure access to quality broadband for a further 29 million Argentines within two years, lowering the cost of internet access.
• The current fiber optic network covers more than 32,000 km but only 30% of the fiber is active.
• The Federal Internet Plan network will use ARSAT’s fiber optic network as a provider of data transport services at whole sale level and provide access to local internet service providers, cooperatives, municipalities and SMEs.
• There is much scope for catch-up in internet penetration and the expansion of fibre-optic broadband in the five years forecast period, given that prices continue to fall as new services for both businesses and consumers develop, and as take-up of mobile broadband technology increases.
• Even though Argentina is the regional leader in terms of fixed broadband penetration rates, the country lags behind in terms of internet connection speeds.
16.6%Broadband
penetration,
the highest in
the region
Source: EIU, National Investment & Trade Promotion Agency.
Federal Fiber Optic Network
Internet Penetration (per 100 people)
55,859,9
64,769,4 70,9 74 76,7 78,6 79,6
0
10
20
30
40
50
60
70
80
90
2012 2013 2014 2015 2016 2017F 2018F 2019F 2020F
© 2017 Deloitte & Co. S.A. All rights reserved.
TelecommunicationsInternet Sector
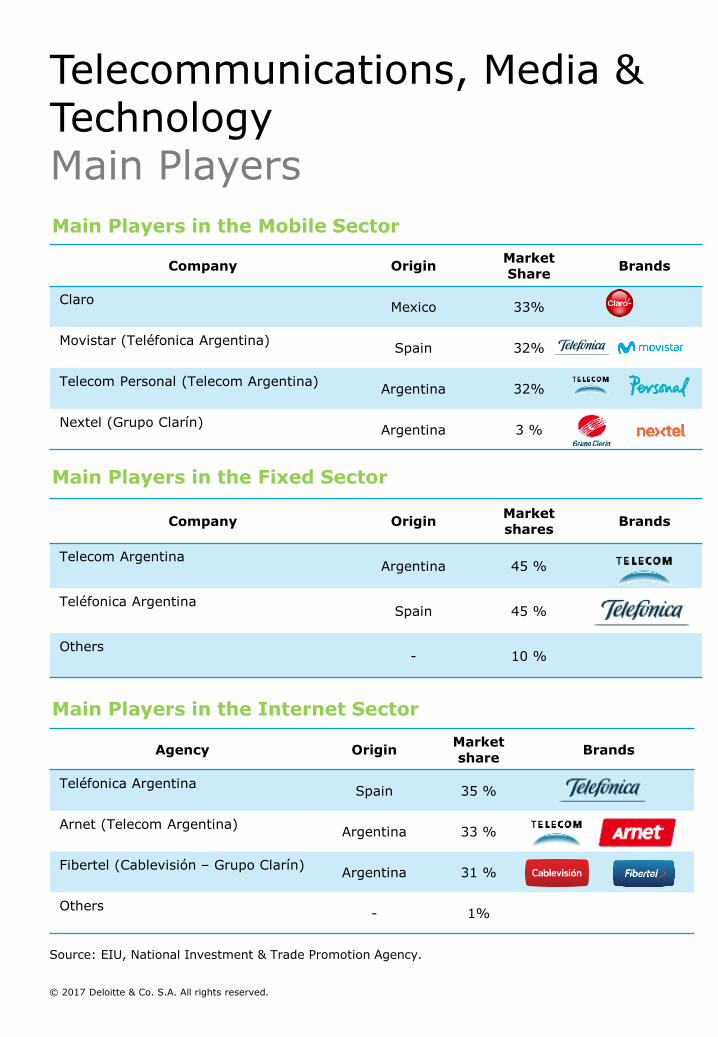
Main Players in the Mobile Sector
Company OriginMarket Share
Brands
ClaroMexico 33%
Movistar (Teléfonica Argentina)Spain 32%
Telecom Personal (Telecom Argentina)Argentina 32%
Nextel (Grupo Clarín)Argentina 3 %
Company OriginMarket shares
Brands
Telecom ArgentinaArgentina 45 %
Teléfonica ArgentinaSpain 45 %
Others- 10 %
Agency OriginMarket share
Brands
Teléfonica ArgentinaSpain 35 %
Arnet (Telecom Argentina)Argentina 33 %
Fibertel (Cablevisión – Grupo Clarín)Argentina 31 %
Others- 1%
Main Players in the Fixed Sector
Main Players in the Internet Sector
Source: EIU, National Investment & Trade Promotion Agency.
© 2017 Deloitte & Co. S.A. All rights reserved.
Telecommunications, Media & TechnologyMain Players

Media
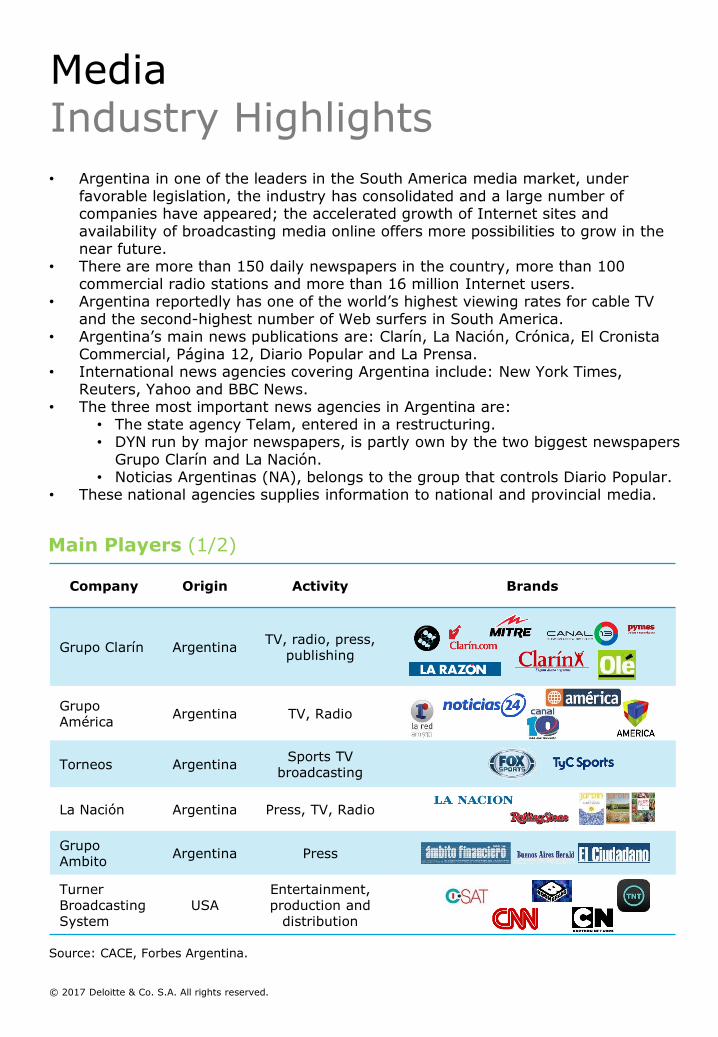
• Argentina in one of the leaders in the South America media market, under favorable legislation, the industry has consolidated and a large number of companies have appeared; the accelerated growth of Internet sites and availability of broadcasting media online offers more possibilities to grow in the near future.
• There are more than 150 daily newspapers in the country, more than 100 commercial radio stations and more than 16 million Internet users.
• Argentina reportedly has one of the world’s highest viewing rates for cable TV and the second-highest number of Web surfers in South America.
• Argentina’s main news publications are: Clarín, La Nación, Crónica, El CronistaCommercial, Página 12, Diario Popular and La Prensa.
• International news agencies covering Argentina include: New York Times, Reuters, Yahoo and BBC News.
• The three most important news agencies in Argentina are:• The state agency Telam, entered in a restructuring.• DYN run by major newspapers, is partly own by the two biggest newspapers
Grupo Clarín and La Nación.• Noticias Argentinas (NA), belongs to the group that controls Diario Popular.
• These national agencies supplies information to national and provincial media.
Source: CACE, Forbes Argentina.
Main Players (1/2)
Company Origin Activity Brands
Grupo Clarín ArgentinaTV, radio, press,
publishing
Grupo América
Argentina TV, Radio
Torneos ArgentinaSports TV
broadcasting
La Nación Argentina Press, TV, Radio
GrupoAmbito
Argentina Press
Turner Broadcasting System
USAEntertainment, production and
distribution
© 2017 Deloitte & Co. S.A. All rights reserved.
MediaIndustry Highlights
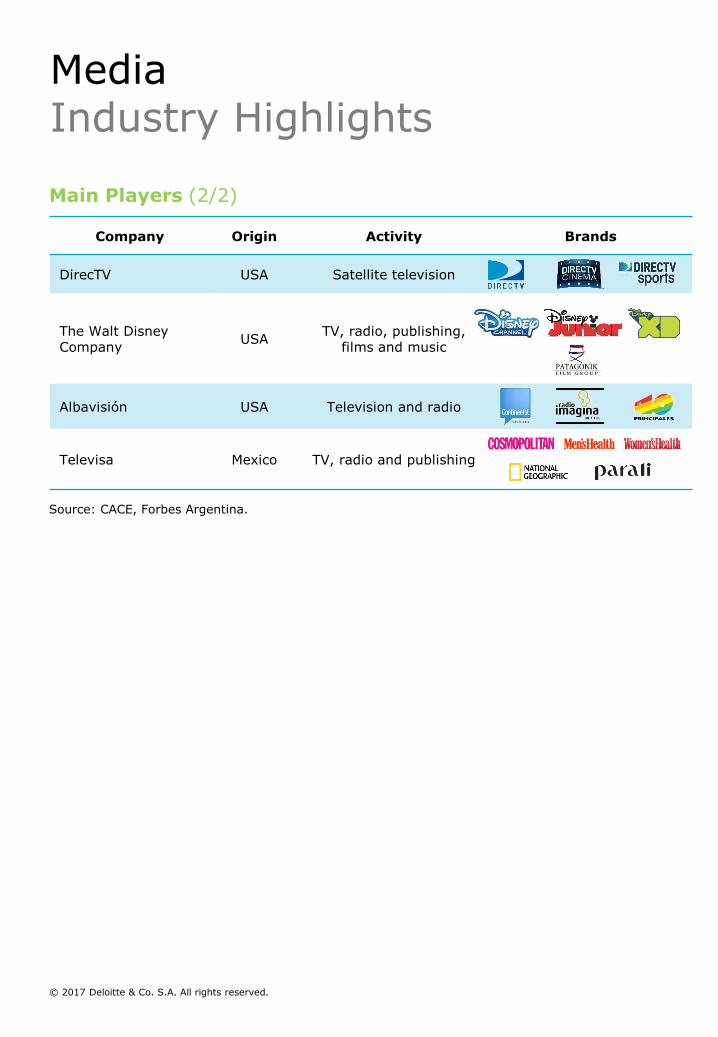
Source: CACE, Forbes Argentina.
Main Players (2/2)
Company Origin Activity Brands
DirecTV USA Satellite television
The Walt Disney Company
USATV, radio, publishing,
films and music
Albavisión USA Television and radio
Televisa Mexico TV, radio and publishing
© 2017 Deloitte & Co. S.A. All rights reserved.
MediaIndustry Highlights

Technology
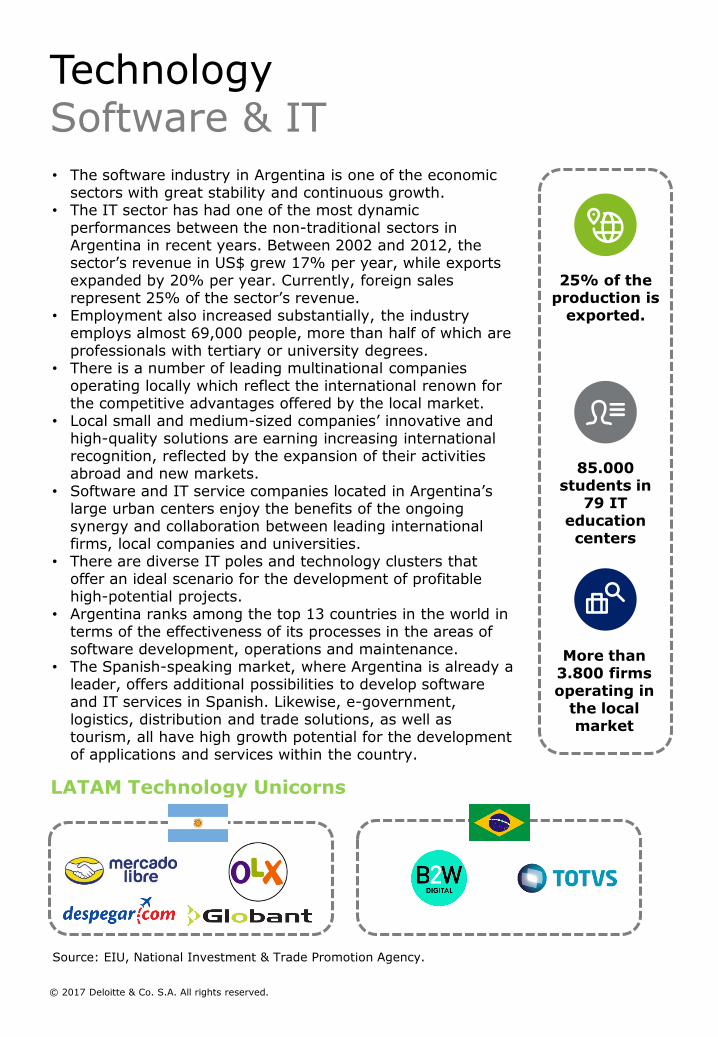
• The software industry in Argentina is one of the economic sectors with great stability and continuous growth.
• The IT sector has had one of the most dynamic performances between the non-traditional sectors in Argentina in recent years. Between 2002 and 2012, the sector’s revenue in US$ grew 17% per year, while exports expanded by 20% per year. Currently, foreign sales represent 25% of the sector’s revenue.
• Employment also increased substantially, the industry employs almost 69,000 people, more than half of which are professionals with tertiary or university degrees.
• There is a number of leading multinational companies operating locally which reflect the international renown for the competitive advantages offered by the local market.
• Local small and medium-sized companies’ innovative and high-quality solutions are earning increasing international recognition, reflected by the expansion of their activities abroad and new markets.
• Software and IT service companies located in Argentina’s large urban centers enjoy the benefits of the ongoing synergy and collaboration between leading international firms, local companies and universities.
• There are diverse IT poles and technology clusters that offer an ideal scenario for the development of profitable high-potential projects.
• Argentina ranks among the top 13 countries in the world in terms of the effectiveness of its processes in the areas of software development, operations and maintenance.
• The Spanish-speaking market, where Argentina is already a leader, offers additional possibilities to develop software and IT services in Spanish. Likewise, e-government, logistics, distribution and trade solutions, as well as tourism, all have high growth potential for the development of applications and services within the country.
Source: EIU, National Investment & Trade Promotion Agency.
LATAM Technology Unicorns
25% of the production is
exported.
85.000 students in
79 IT education centers
More than 3.800 firms operating in
the local market
© 2017 Deloitte & Co. S.A. All rights reserved.
TechnologySoftware & IT
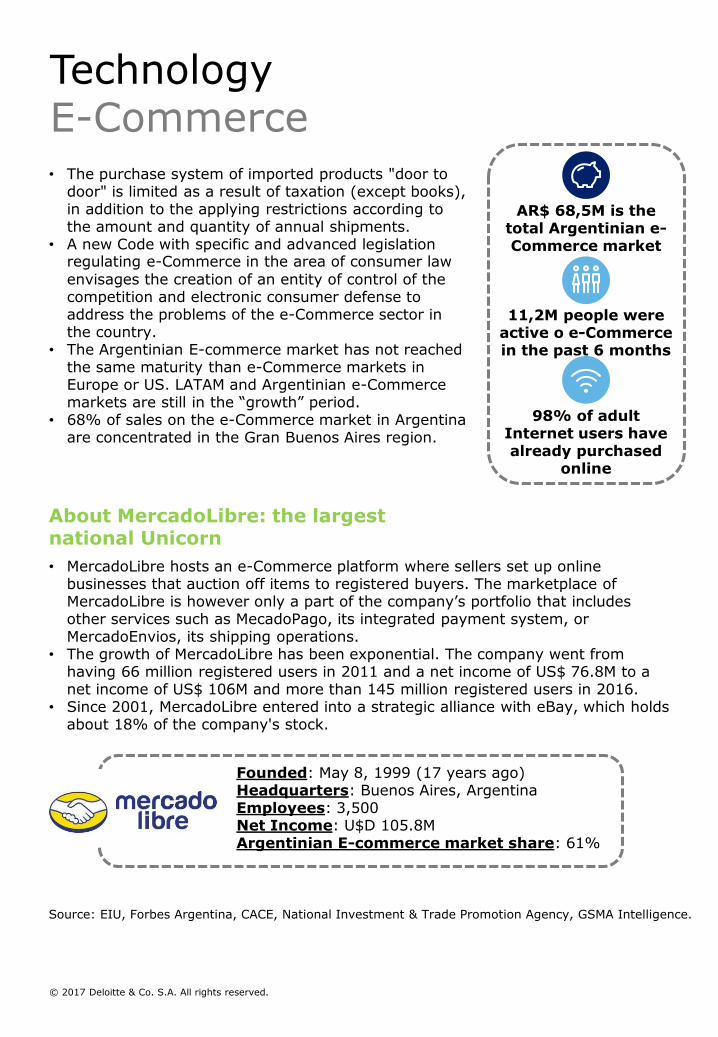
• The purchase system of imported products "door to door" is limited as a result of taxation (except books), in addition to the applying restrictions according to the amount and quantity of annual shipments.
• A new Code with specific and advanced legislation regulating e-Commerce in the area of consumer law
envisages the creation of an entity of control of the competition and electronic consumer defense to address the problems of the e-Commerce sector in the country.
• The Argentinian E-commerce market has not reached the same maturity than e-Commerce markets in Europe or US. LATAM and Argentinian e-Commerce markets are still in the “growth” period.
• 68% of sales on the e-Commerce market in Argentina are concentrated in the Gran Buenos Aires region.
• MercadoLibre hosts an e-Commerce platform where sellers set up online businesses that auction off items to registered buyers. The marketplace of MercadoLibre is however only a part of the company’s portfolio that includes other services such as MecadoPago, its integrated payment system, or MercadoEnvios, its shipping operations.
• The growth of MercadoLibre has been exponential. The company went from having 66 million registered users in 2011 and a net income of US$ 76.8M to a net income of US$ 106M and more than 145 million registered users in 2016.
• Since 2001, MercadoLibre entered into a strategic alliance with eBay, which holds about 18% of the company's stock.
Source: EIU, Forbes Argentina, CACE, National Investment & Trade Promotion Agency, GSMA Intelligence.
About MercadoLibre: the largest national Unicorn
Founded: May 8, 1999 (17 years ago)Headquarters: Buenos Aires, ArgentinaEmployees: 3,500Net Income: U$D 105.8MArgentinian E-commerce market share: 61%
AR$ 68,5M is the total Argentinian e-Commerce market
11,2M people were active o e-Commerce in the past 6 months
98% of adult Internet users have already purchased
online
© 2017 Deloitte & Co. S.A. All rights reserved.
TechnologyE-Commerce
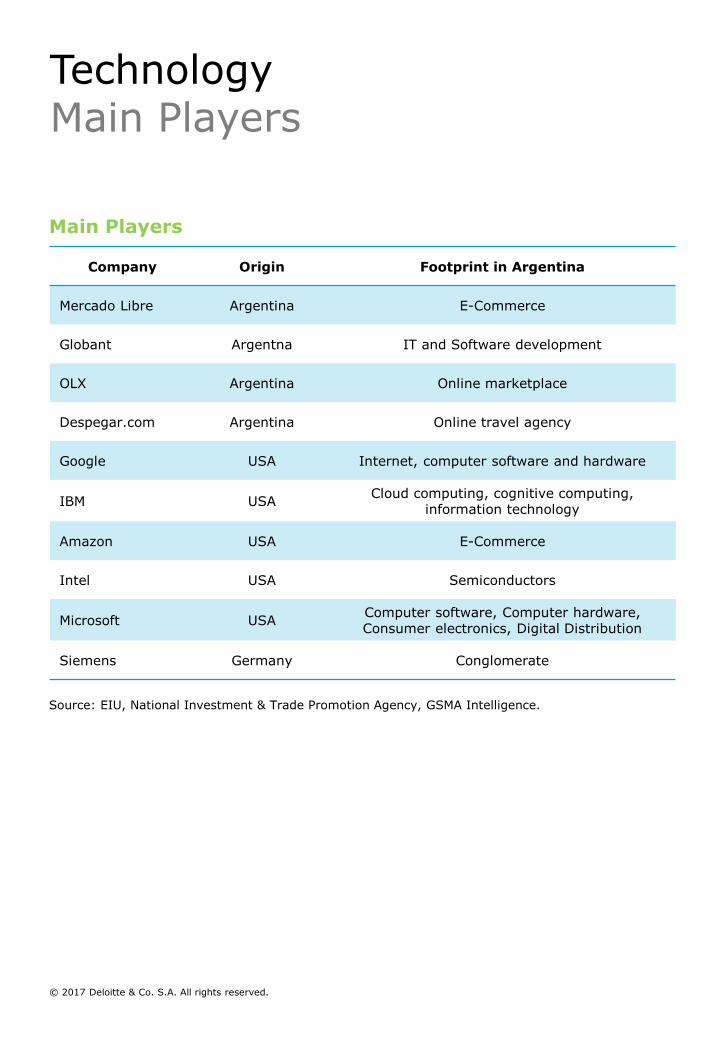
Source: EIU, National Investment & Trade Promotion Agency, GSMA Intelligence.
Main Players
Company Origin Footprint in Argentina
Mercado Libre Argentina E-Commerce
Globant Argentna IT and Software development
OLX Argentina Online marketplace
Despegar.com Argentina Online travel agency
Google USA Internet, computer software and hardware
IBM USACloud computing, cognitive computing,
information technology
Amazon USA E-Commerce
Intel USA Semiconductors
Microsoft USAComputer software, Computer hardware,Consumer electronics, Digital Distribution
Siemens Germany Conglomerate
© 2017 Deloitte & Co. S.A. All rights reserved.
TechnologyMain Players
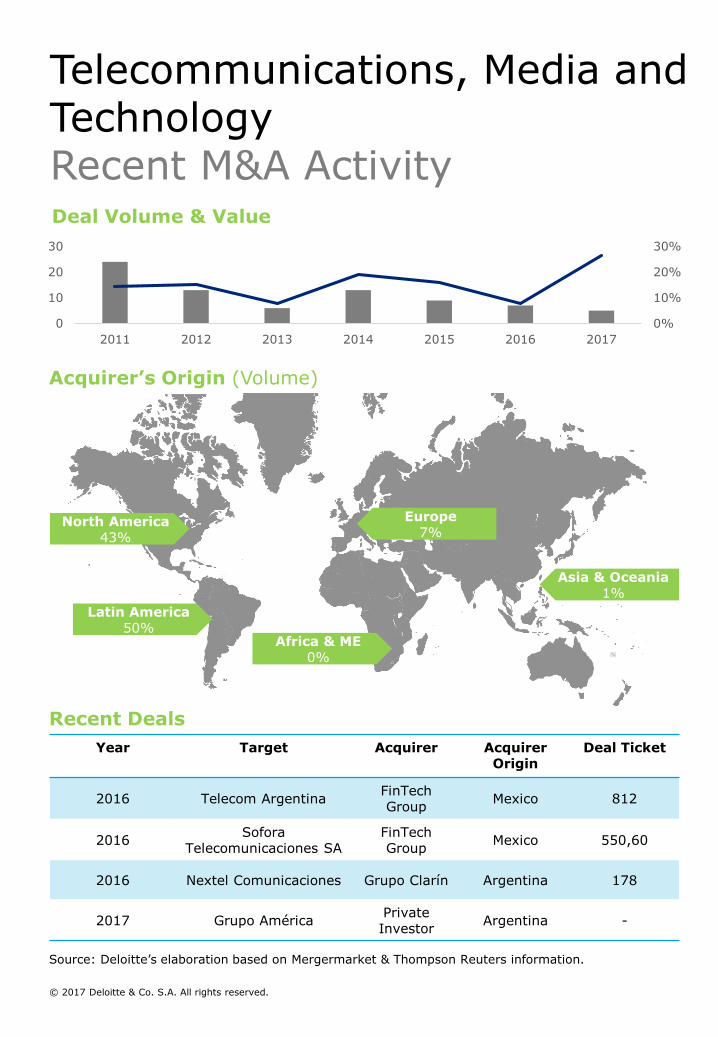
Source: Deloitte’s elaboration based on Mergermarket & Thompson Reuters information.
Year Target Acquirer Acquirer Origin
Deal Ticket
2016 Telecom ArgentinaFinTechGroup
Mexico 812
2016Sofora
Telecomunicaciones SAFinTechGroup
Mexico 550,60
2016 Nextel Comunicaciones Grupo Clarín Argentina 178
2017 Grupo AméricaPrivate Investor
Argentina -
Deal Volume & Value
Acquirer’s Origin (Volume)
North America43%
Latin America50%
Asia & Oceania1%
Europe7%
Africa & ME0%
Recent Deals
0%
10%
20%
30%
0
10
20
30
2011 2012 2013 2014 2015 2016 2017
© 2017 Deloitte & Co. S.A. All rights reserved.
Telecommunications, Media and TechnologyRecent M&A Activity

Industry SnapshotEnergy
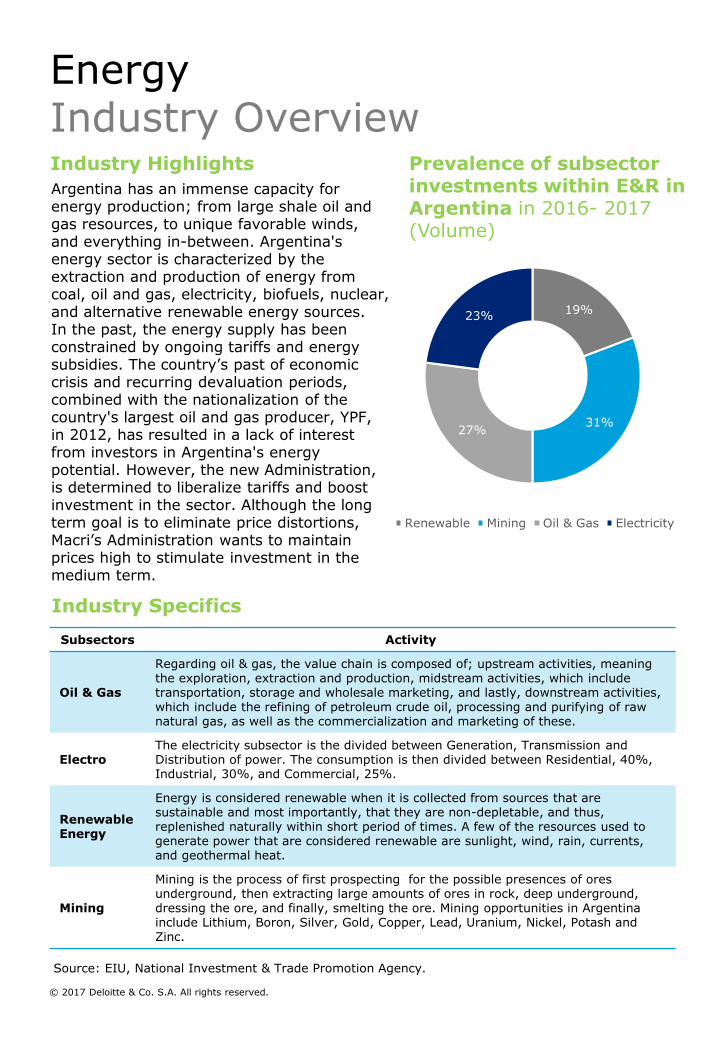
Industry Highlights
Argentina has an immense capacity for energy production; from large shale oil and gas resources, to unique favorable winds, and everything in-between. Argentina's energy sector is characterized by the extraction and production of energy from coal, oil and gas, electricity, biofuels, nuclear, and alternative renewable energy sources. In the past, the energy supply has been constrained by ongoing tariffs and energy subsidies. The country’s past of economic crisis and recurring devaluation periods, combined with the nationalization of the country's largest oil and gas producer, YPF, in 2012, has resulted in a lack of interest from investors in Argentina's energy potential. However, the new Administration, is determined to liberalize tariffs and boost investment in the sector. Although the long term goal is to eliminate price distortions, Macri’s Administration wants to maintain prices high to stimulate investment in the medium term.
19%
31%27%
23%
Renewable Mining Oil & Gas Electricity
Prevalence of subsector investments within E&R in Argentina in 2016- 2017 (Volume)
Subsectors Activity
Oil & Gas
Regarding oil & gas, the value chain is composed of; upstream activities, meaning the exploration, extraction and production, midstream activities, which include transportation, storage and wholesale marketing, and lastly, downstream activities, which include the refining of petroleum crude oil, processing and purifying of raw natural gas, as well as the commercialization and marketing of these.
ElectroThe electricity subsector is the divided between Generation, Transmission and Distribution of power. The consumption is then divided between Residential, 40%, Industrial, 30%, and Commercial, 25%.
Renewable Energy
Energy is considered renewable when it is collected from sources that are sustainable and most importantly, that they are non-depletable, and thus, replenished naturally within short period of times. A few of the resources used to generate power that are considered renewable are sunlight, wind, rain, currents, and geothermal heat.
Mining
Mining is the process of first prospecting for the possible presences of ores underground, then extracting large amounts of ores in rock, deep underground, dressing the ore, and finally, smelting the ore. Mining opportunities in Argentina include Lithium, Boron, Silver, Gold, Copper, Lead, Uranium, Nickel, Potash and Zinc.
Industry Specifics
Source: EIU, National Investment & Trade Promotion Agency.
© 2017 Deloitte & Co. S.A. All rights reserved.
EnergyIndustry Overview

Oil & Gas
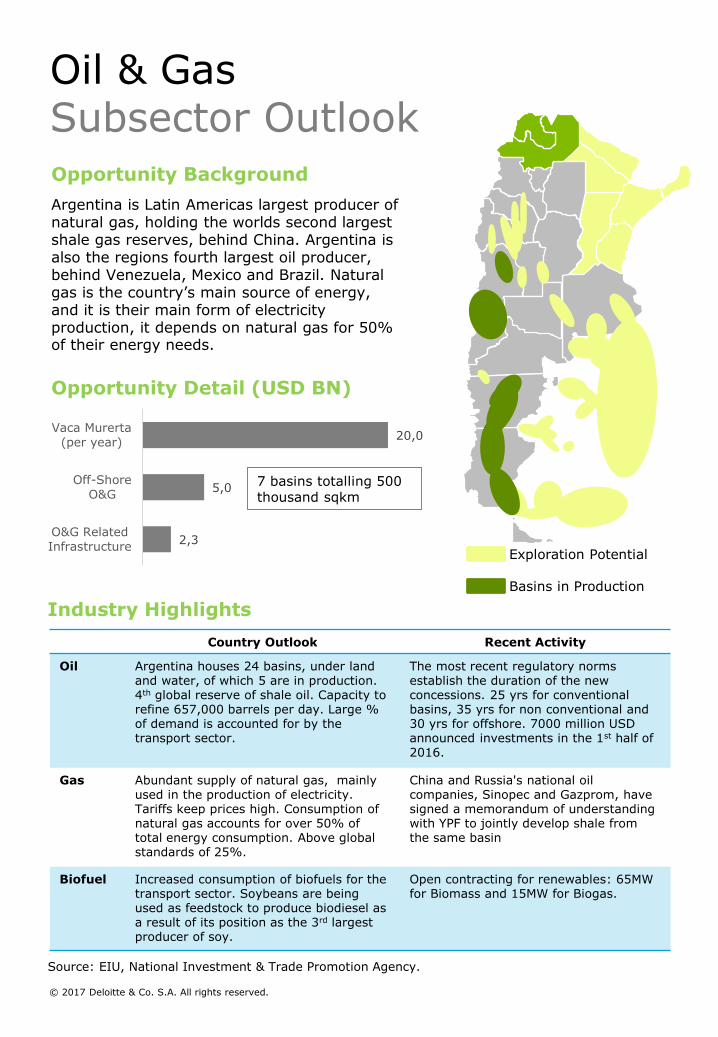
Country Outlook Recent Activity
Oil Argentina houses 24 basins, under land and water, of which 5 are in production. 4th global reserve of shale oil. Capacity torefine 657,000 barrels per day. Large %of demand is accounted for by the transport sector.
The most recent regulatory norms establish the duration of the new concessions. 25 yrs for conventional basins, 35 yrs for non conventional and 30 yrs for offshore. 7000 million USD announced investments in the 1st half of 2016.
Gas Abundant supply of natural gas, mainly used in the production of electricity. Tariffs keep prices high. Consumption of natural gas accounts for over 50% of total energy consumption. Above global standards of 25%.
China and Russia's national oil companies, Sinopec and Gazprom, have signed a memorandum of understanding with YPF to jointly develop shale from the same basin
Biofuel Increased consumption of biofuels for the transport sector. Soybeans are being used as feedstock to produce biodiesel as a result of its position as the 3rd largest producer of soy.
Open contracting for renewables: 65MW for Biomass and 15MW for Biogas.
Argentina is Latin Americas largest producer of natural gas, holding the worlds second largest shale gas reserves, behind China. Argentina is also the regions fourth largest oil producer, behind Venezuela, Mexico and Brazil. Natural gas is the country’s main source of energy, and it is their main form of electricity production, it depends on natural gas for 50% of their energy needs.
Industry Highlights
Opportunity Background
Exploration Potential
Basins in Production
Source: EIU, National Investment & Trade Promotion Agency.
20,0
5,0
2,3
Vaca Murerta
(per year)
Off-Shore
O&G
O&G Related
Infrastructure
Opportunity Detail (USD BN)
7 basins totalling 500 thousand sqkm
© 2017 Deloitte & Co. S.A. All rights reserved.
Oil & GasSubsector Outlook
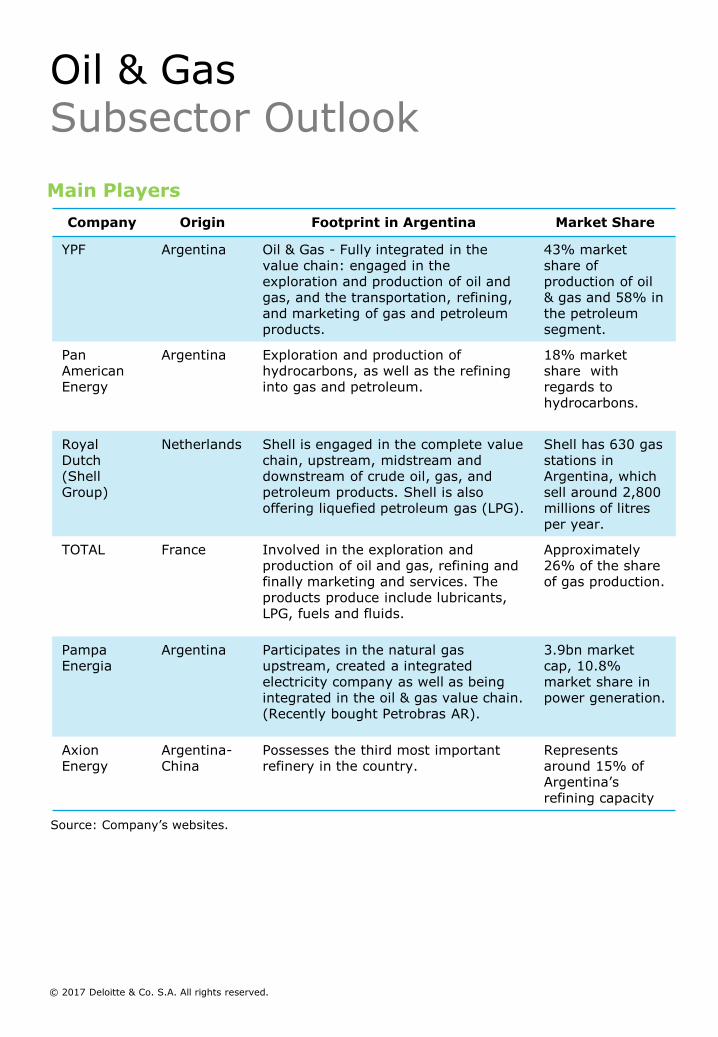
Company Origin Footprint in Argentina Market Share
YPF Argentina Oil & Gas - Fully integrated in the value chain: engaged in the exploration and production of oil and gas, and the transportation, refining, and marketing of gas and petroleum products.
43% marketshare of production of oil & gas and 58% in the petroleumsegment.
Pan American Energy
Argentina Exploration and production of hydrocarbons, as well as the refining into gas and petroleum.
18% marketshare with regards to hydrocarbons.
Royal Dutch (Shell Group)
Netherlands Shell is engaged in the complete value chain, upstream, midstream and downstream of crude oil, gas, and petroleum products. Shell is also offering liquefied petroleum gas (LPG).
Shell has 630 gas stations in Argentina, which sell around 2,800 millions of litres per year.
TOTAL France Involved in the exploration and production of oil and gas, refining and finally marketing and services. The products produce include lubricants, LPG, fuels and fluids.
Approximately26% of the share of gas production.
PampaEnergia
Argentina Participates in the natural gas upstream, created a integrated electricity company as well as being integrated in the oil & gas value chain. (Recently bought Petrobras AR).
3.9bn marketcap, 10.8% market share in power generation.
AxionEnergy
Argentina-China
Possesses the third most important refinery in the country.
Represents around 15% of Argentina’s refining capacity
Main Players
Source: Company’s websites.
© 2017 Deloitte & Co. S.A. All rights reserved.
Oil & GasSubsector Outlook
Energy: Generation, Transmission, Distribution & Demand
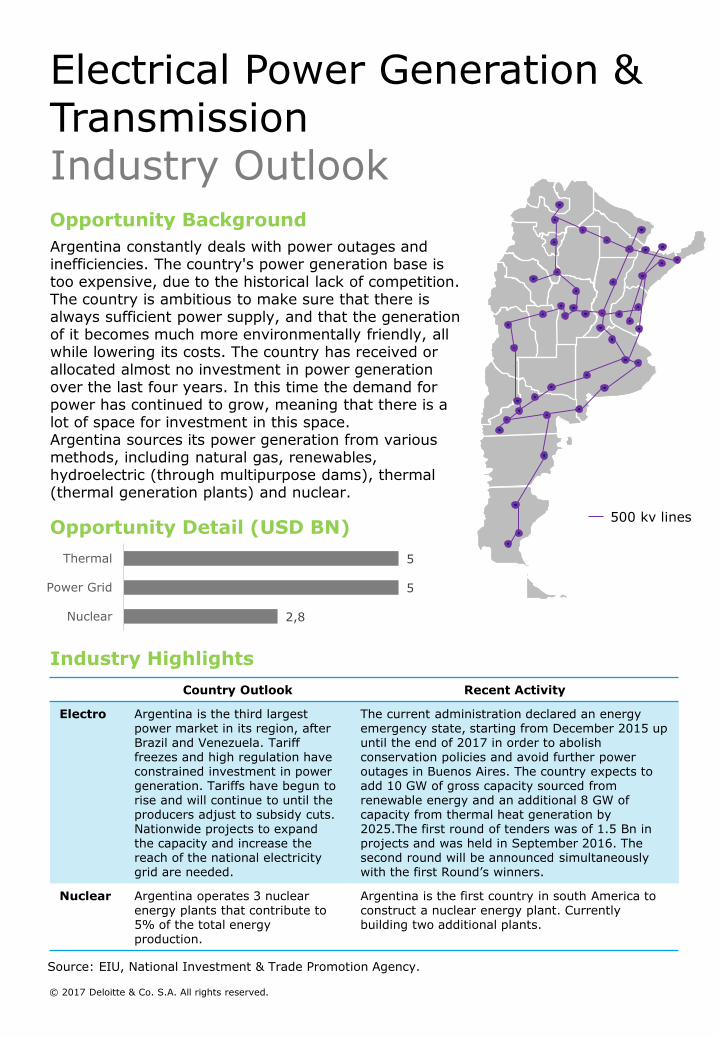
Country Outlook Recent Activity
Electro Argentina is the third largest power market in its region, after Brazil and Venezuela. Tariff freezes and high regulation have constrained investment in power generation. Tariffs have begun to rise and will continue to until the producers adjust to subsidy cuts. Nationwide projects to expand the capacity and increase the reach of the national electricity grid are needed.
The current administration declared an energy emergency state, starting from December 2015 up until the end of 2017 in order to abolish conservation policies and avoid further power outages in Buenos Aires. The country expects to add 10 GW of gross capacity sourced from renewable energy and an additional 8 GW of capacity from thermal heat generation by 2025.The first round of tenders was of 1.5 Bn in projects and was held in September 2016. The second round will be announced simultaneously with the first Round’s winners.
Nuclear Argentina operates 3 nuclear energy plants that contribute to 5% of the total energy production.
Argentina is the first country in south America to construct a nuclear energy plant. Currently building two additional plants.
Industry Highlights
Opportunity Background
Argentina constantly deals with power outages and inefficiencies. The country's power generation base is too expensive, due to the historical lack of competition. The country is ambitious to make sure that there is always sufficient power supply, and that the generation of it becomes much more environmentally friendly, all while lowering its costs. The country has received or allocated almost no investment in power generation over the last four years. In this time the demand for power has continued to grow, meaning that there is a lot of space for investment in this space. Argentina sources its power generation from various methods, including natural gas, renewables, hydroelectric (through multipurpose dams), thermal (thermal generation plants) and nuclear.
500 kv lines
Source: EIU, National Investment & Trade Promotion Agency.
5
5
2,8
Thermal
Power Grid
Nuclear
Opportunity Detail (USD BN)
© 2017 Deloitte & Co. S.A. All rights reserved.
Electrical Power Generation & TransmissionIndustry Outlook
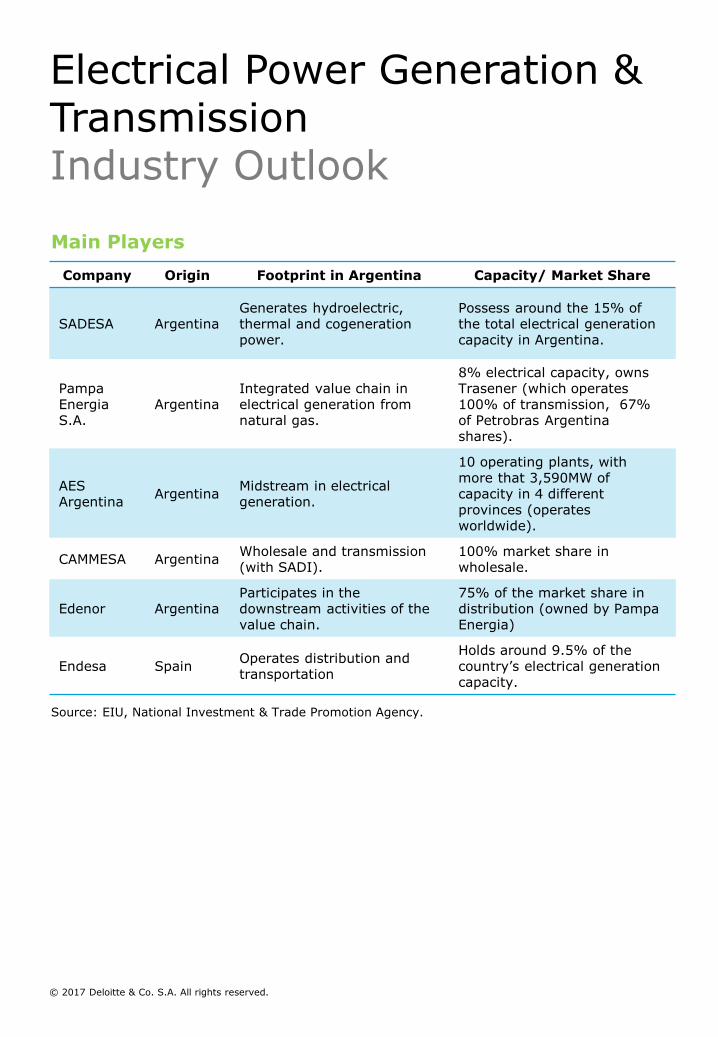
Company Origin Footprint in Argentina Capacity/ Market Share
SADESA ArgentinaGenerates hydroelectric, thermal and cogeneration power.
Possess around the 15% of the total electrical generation capacity in Argentina.
Pampa EnergiaS.A.
ArgentinaIntegrated value chain in electrical generation fromnatural gas.
8% electrical capacity, owns Trasener (which operates 100% of transmission, 67% of Petrobras Argentina shares).
AES Argentina
ArgentinaMidstream in electrical generation.
10 operating plants, with more that 3,590MW of capacity in 4 different provinces (operates worldwide).
CAMMESA ArgentinaWholesale and transmission (with SADI).
100% market share in wholesale.
Edenor ArgentinaParticipates in the downstream activities of the value chain.
75% of the market share in distribution (owned by Pampa Energia)
Endesa SpainOperates distribution and transportation
Holds around 9.5% of the country’s electrical generation capacity.
Main Players
Source: EIU, National Investment & Trade Promotion Agency.
© 2017 Deloitte & Co. S.A. All rights reserved.
Electrical Power Generation & TransmissionIndustry Outlook

Renewable Energy
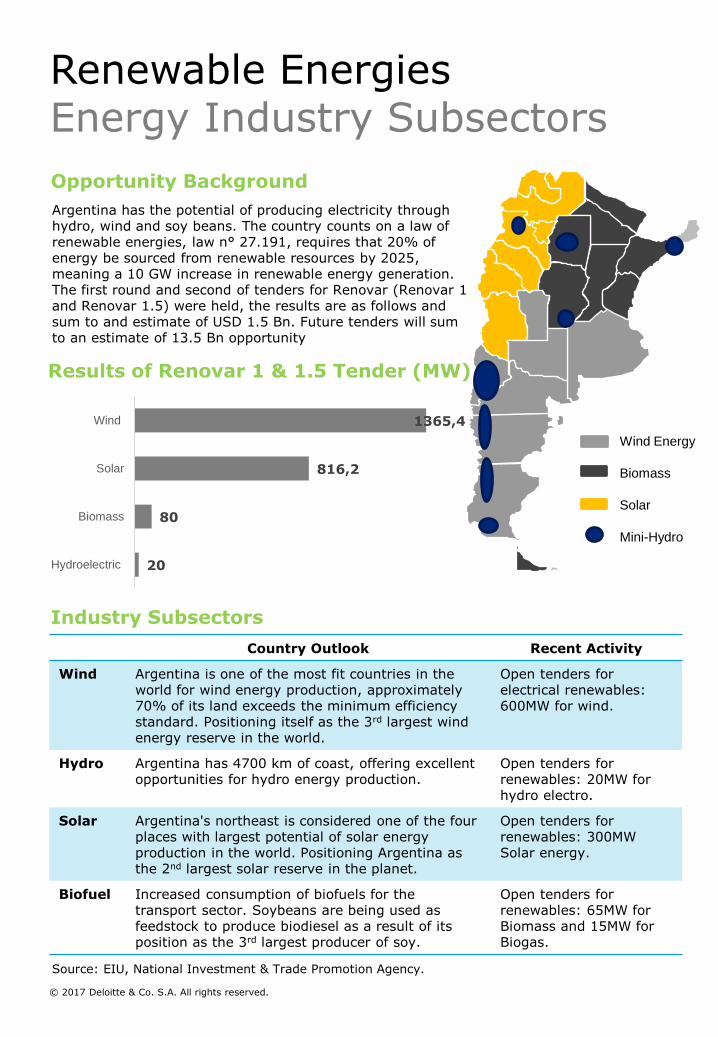
Country Outlook Recent Activity
Wind Argentina is one of the most fit countries in theworld for wind energy production, approximately 70% of its land exceeds the minimum efficiency standard. Positioning itself as the 3rd largest wind energy reserve in the world.
Open tenders for electrical renewables: 600MW for wind.
Hydro Argentina has 4700 km of coast, offering excellent opportunities for hydro energy production.
Open tenders for renewables: 20MW forhydro electro.
Solar Argentina's northeast is considered one of the four places with largest potential of solar energy production in the world. Positioning Argentina as the 2nd largest solar reserve in the planet.
Open tenders for renewables: 300MW Solar energy.
Biofuel Increased consumption of biofuels for the transport sector. Soybeans are being used as feedstock to produce biodiesel as a result of its position as the 3rd largest producer of soy.
Open tenders for renewables: 65MW for Biomass and 15MW for Biogas.
Argentina has the potential of producing electricity through hydro, wind and soy beans. The country counts on a law of renewable energies, law n° 27.191, requires that 20% of energy be sourced from renewable resources by 2025, meaning a 10 GW increase in renewable energy generation. The first round and second of tenders for Renovar (Renovar 1 and Renovar 1.5) were held, the results are as follows and sum to and estimate of USD 1.5 Bn. Future tenders will sum to an estimate of 13.5 Bn opportunity
Opportunity Background
Industry Subsectors
Wind Energy
Biomass
Solar
Mini-Hydro
Source: EIU, National Investment & Trade Promotion Agency.
Results of Renovar 1 & 1.5 Tender (MW)
1365,4
816,2
80
20
Wind
Solar
Biomass
Hydroelectric
© 2017 Deloitte & Co. S.A. All rights reserved.
Renewable Energies Energy Industry Subsectors
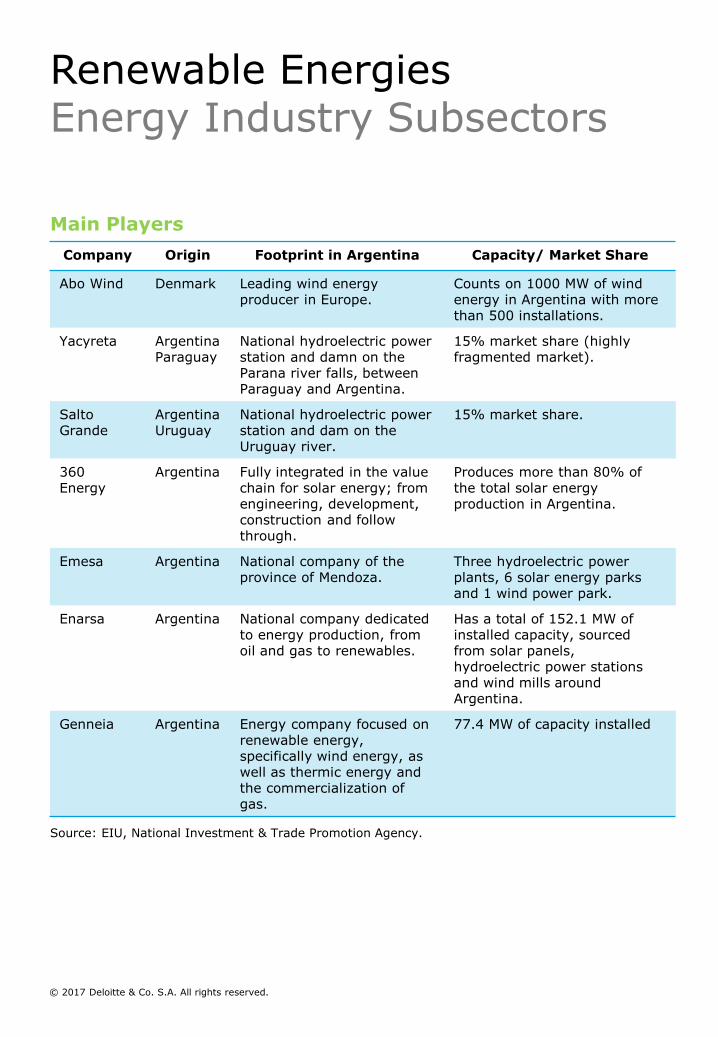
Company Origin Footprint in Argentina Capacity/ Market Share
Abo Wind Denmark Leading wind energy producer in Europe.
Counts on 1000 MW of wind energy in Argentina with more than 500 installations.
Yacyreta Argentina Paraguay
National hydroelectric power station and damn on the Parana river falls, between Paraguay and Argentina.
15% market share (highly fragmented market).
Salto Grande
Argentina Uruguay
National hydroelectric power station and dam on the Uruguay river.
15% market share.
360 Energy
Argentina Fully integrated in the value chain for solar energy; from engineering, development, construction and follow through.
Produces more than 80% of the total solar energy production in Argentina.
Emesa Argentina National company of the province of Mendoza.
Three hydroelectric power plants, 6 solar energy parks and 1 wind power park.
Enarsa Argentina National company dedicated to energy production, from oil and gas to renewables.
Has a total of 152.1 MW of installed capacity, sourcedfrom solar panels, hydroelectric power stations and wind mills around Argentina.
Genneia Argentina Energy company focused on renewable energy, specifically wind energy, as well as thermic energy and the commercialization of gas.
77.4 MW of capacity installed
Main Players
Source: EIU, National Investment & Trade Promotion Agency.
© 2017 Deloitte & Co. S.A. All rights reserved.
Renewable Energies Energy Industry Subsectors

Mining
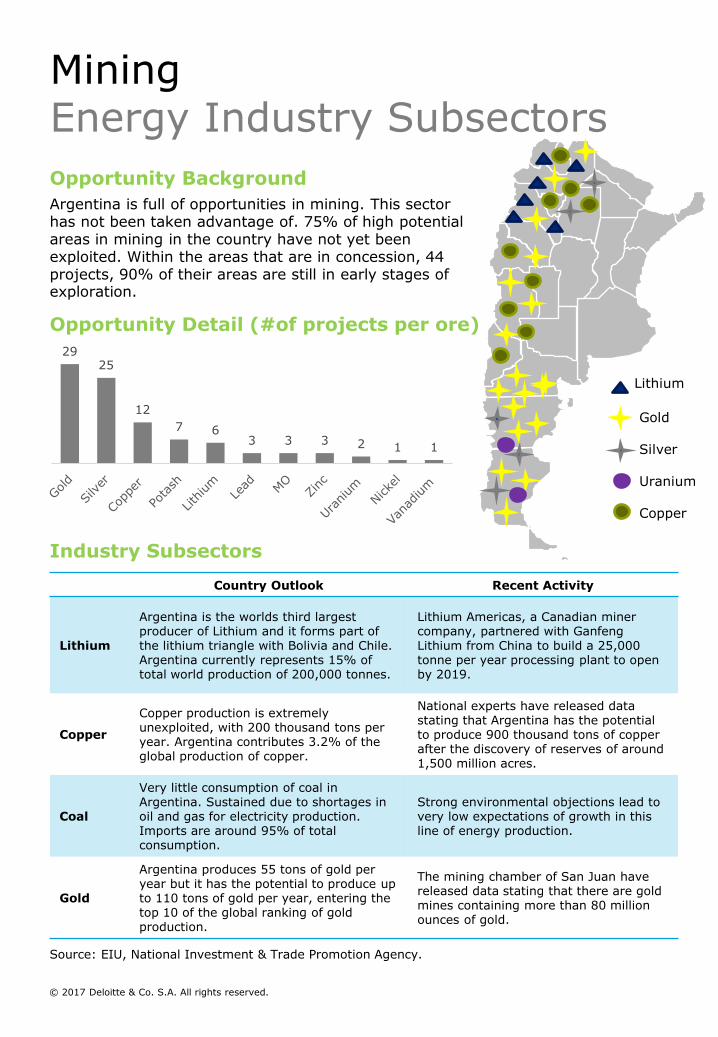
Country Outlook Recent Activity
Lithium
Argentina is the worlds third largest producer of Lithium and it forms part of the lithium triangle with Bolivia and Chile. Argentina currently represents 15% of total world production of 200,000 tonnes.
Lithium Americas, a Canadian miner company, partnered with GanfengLithium from China to build a 25,000 tonne per year processing plant to open by 2019.
Copper
Copper production is extremelyunexploited, with 200 thousand tons per year. Argentina contributes 3.2% of the global production of copper.
National experts have released data stating that Argentina has the potential to produce 900 thousand tons of copper after the discovery of reserves of around 1,500 million acres.
Coal
Very little consumption of coal in Argentina. Sustained due to shortages in oil and gas for electricity production. Imports are around 95% of total consumption.
Strong environmental objections lead to very low expectations of growth in this line of energy production.
Gold
Argentina produces 55 tons of gold per year but it has the potential to produce up to 110 tons of gold per year, entering the top 10 of the global ranking of gold production.
The mining chamber of San Juan have released data stating that there are gold mines containing more than 80 million ounces of gold.
Lithium
Gold
Silver
Uranium
Copper
Industry Subsectors
Argentina is full of opportunities in mining. This sector has not been taken advantage of. 75% of high potential areas in mining in the country have not yet been exploited. Within the areas that are in concession, 44 projects, 90% of their areas are still in early stages of exploration.
Opportunity Background
Source: EIU, National Investment & Trade Promotion Agency.
2925
12
7 63 3 3 2 1 1
Opportunity Detail (#of projects per ore)
© 2017 Deloitte & Co. S.A. All rights reserved.
MiningEnergy Industry Subsectors
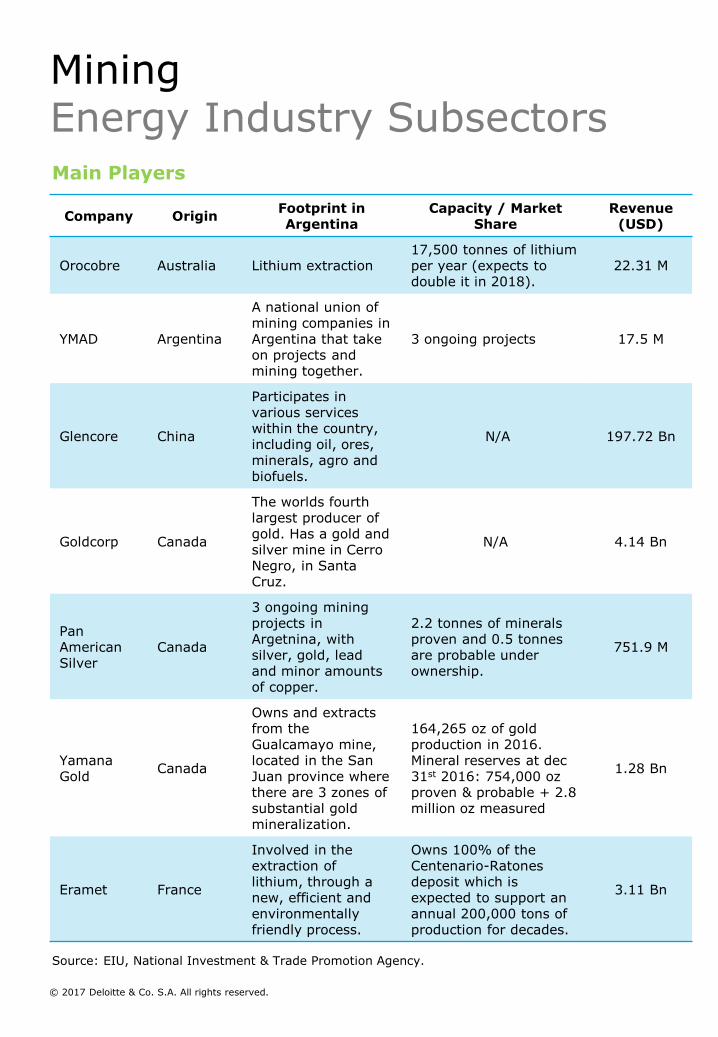
Company OriginFootprint in Argentina
Capacity / Market Share
Revenue(USD)
Orocobre Australia Lithium extraction17,500 tonnes of lithium per year (expects to double it in 2018).
22.31 M
YMAD Argentina
A national union of mining companies in Argentina that take on projects and mining together.
3 ongoing projects 17.5 M
Glencore China
Participates in various services within the country, including oil, ores, minerals, agro and biofuels.
N/A 197.72 Bn
Goldcorp Canada
The worlds fourthlargest producer of gold. Has a gold and silver mine in Cerro Negro, in Santa Cruz.
N/A 4.14 Bn
Pan American Silver
Canada
3 ongoing mining projects in Argetnina, with silver, gold, lead and minor amounts of copper.
2.2 tonnes of mineralsproven and 0.5 tonnesare probable under ownership.
751.9 M
YamanaGold
Canada
Owns and extracts from the Gualcamayo mine, located in the San Juan province where there are 3 zones of substantial gold mineralization.
164,265 oz of gold production in 2016. Mineral reserves at dec31st 2016: 754,000 ozproven & probable + 2.8 million oz measured
1.28 Bn
Eramet France
Involved in the extraction of lithium, through a new, efficient and environmentally friendly process.
Owns 100% of the Centenario-Ratonesdeposit which is expected to support an annual 200,000 tons of production for decades.
3.11 Bn
Main Players
Source: EIU, National Investment & Trade Promotion Agency.
© 2017 Deloitte & Co. S.A. All rights reserved.
MiningEnergy Industry Subsectors
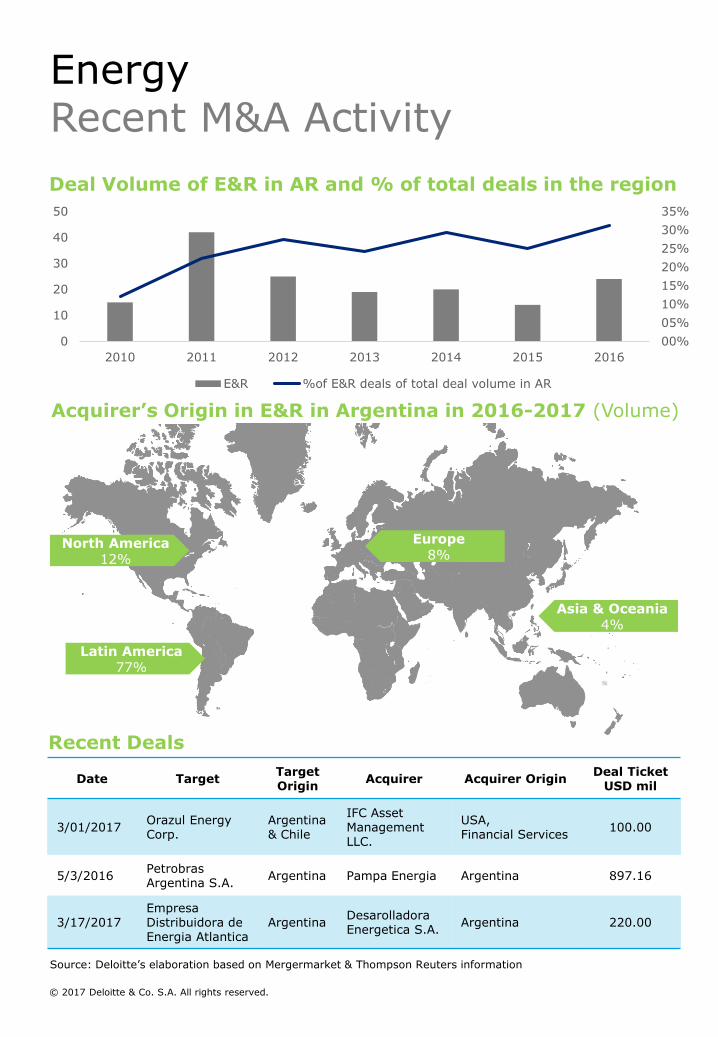
Source: Deloitte’s elaboration based on Mergermarket & Thompson Reuters information
Date TargetTargetOrigin
Acquirer Acquirer OriginDeal Ticket
USD mil
3/01/2017Orazul Energy Corp.
Argentina& Chile
IFC Asset Management LLC.
USA,Financial Services
100.00
5/3/2016Petrobras Argentina S.A.
Argentina Pampa Energia Argentina 897.16
3/17/2017EmpresaDistribuidora de Energia Atlantica
ArgentinaDesarolladoraEnergetica S.A.
Argentina 220.00
Acquirer’s Origin in E&R in Argentina in 2016-2017 (Volume)
North America12%
Latin America77%
Asia & Oceania4%
Europe8%
Recent Deals
Deal Volume of E&R in AR and % of total deals in the region
00%
05%
10%
15%
20%
25%
30%
35%
0
10
20
30
40
50
2010 2011 2012 2013 2014 2015 2016
E&R %of E&R deals of total deal volume in AR
© 2017 Deloitte & Co. S.A. All rights reserved.
EnergyRecent M&A Activity
Deloitte refers to one or more of Deloitte ToucheTohmatsu Limited, a UK private company limited by guarantee (“DTTL”), its network of member firms, and their related entities. DTTL and each of its member firms are legally separate and independent entities. DTTL (also referred to as “Deloitte Global”) does not provide services to clients. Please see www.deloitte.com/de/UeberUns for a more detailed description of DTTL and its member firms.
Deloitte provides audit, tax, financial advisory and consulting services to public and private clients spanning multiple industries; legal advisory services in Germany are provided by Deloitte Legal. With a globally connected network of member firms in more than 150 countries, Deloitte brings world-class capabilities and high-quality service to clients, delivering the insights they need to address their most complex business challenges. Deloitte’s more than 225,000 professionals are committed to making an impact that matters.
© 2017. Deloitte & Co. S.A..
Marcelo BastanteLead PartnerFinancial Advisory [email protected]
Tomás AquerretaSr. AssociateFinancial Advisory [email protected]
Miguel SarquizSr. AssociateFinancial Advisory [email protected]
Lucrezia RiganoAssociateFinancial Advisory [email protected]
Daiana CardozoSr. AssociateFinancial Advisory [email protected]
Marcos G. BazanPartnerFinancial Advisory [email protected]