Embed Size (px)
Citation preview
n
Contract No. W-7405-eng-26
OR NL-1659
Copy No.
INVESTIGATIONS ON THE RANQUE-HILSCH (VORTEX) TUBE
P. S. Baker
W. R. Rathkamp
DATE ISSUED
:- h r , '
OAK RIDGE NATIONAL LABORATORY Operated by
CARBIDE AND CARBON CHEMICALS COMPANY A Division of Unian Carbide and Carbon Corporation
Past Office Bax P Oak Ridge, Tennessee
3 4 4 5 6 0360b93 b

ORNL- 1659 Instrumentation
INTER NA L D lSTR I6 UTI0 N
1 . C. E. Center 2. Biology Library 3. Health Physics Library
-5. Central Research Library 6. Reactor Experimental
Engineering L i brary 7-1 1. Laboratory Records Department
12. Laboratory Records, ORNL R.C. 13. C. E. Larson 14. L. B. Emlet (K-25) 15. J. P. Murray (Y-12) 16. A. M. Weinberg 17. E. H. Taylor 18. E. D. Shipley 19. C. P. Keim 20. W. H. Jordan 21. F. C. VonderLage 22. S. C. L ind 23. F. L. Culler 24. A. H. Snell 25. A. Hollaender 26. M. T. Kelley 27. G. H. CIewett 28. K. Z. Morgan 29. J. H. Frye, Jr. 30. C. E. Normand
31. R. S . Livingston 32. T. A. Lincoln 33. A . S. Householder 34. C. S. Harri l l 35. C. E. Winters 36. 0. W. Cardwell 37. E. M. King 38. A. J. Miller 39. D. D. Cowen 40. J. A. Lane 41. Russell Baldock 42. J. R. Mchially, Jr. 43. Boyd Weaver
44-48. P. S. Baker 49-58. W. R. Rathkanip
59. Grey Stone 60. P. M. Griff in 61. A. Ruark 62. S.H. Jury 63. T. A. Love 64. M. J, Skinner 65. S. J. Cromer 66. P. M. Reyling 67. G. C. Wi l l iams 68. C. J. Eorkowski
EXTERNAL D lSTR 18 UTION
69. R. F. Bacher, California Inst i tute of Technology 70. David Cope, AEC, Oak Ridge 71. Division of Research and Medicine, AEC, O R 0
72-31 1. Given distribution a5 shown in TID-4500 under lnstrunientatian category
DISTRIBUTION PAGE TO BE REMOVED IF REPORT IS GIVEN PUBLIC DISTRIBUTION
... I I I

P
CONTENTS
ABSTRACT ......................................................... 1
INTRODUCTION ...................................................... 1
THEORY ........................................................... 2
EXPERIMENTAL ...................................................... 3 Analytical ......................................................... 3 Separation Experiments ................................................. 6 Operational Experiments ................................................ 9
RESULTS ........................................................... 34
CONCLUSIONS ....................................................... 36
ACKNOWLEDGMENT ................................................... 37
BIBLIOGRAPHY ...................................................... 37
APPENDIX .......................................................... 38
V

LIST OF FIGURES
F i g . 1. Sampling Flask . . . . . . . . . . . . . . . . . . . . . . . . . . . . . . . . . . . . . . . . . . . . . . . . . . 4 F i g . 2 . Chart of Mass Spectra of Air . . . . . . . . . . . . . . . . . . . . . . . . . . . . . . . . . . . . . . . . . 4 F i g . 3 . Ostwald Viscometer . . . . . . . . . . . . . . . . . . . . . . . . . . . . . . . . . . . . . . . . . . . . . . . 7 F i g . 4 . Viscosity-Composition Curve; N,.O, Mixtures . . . . . . . . . . . . . . . . . . . . . . . . . . . . . . 8 F i g . 5 . Viscosity-Calibration Curve . . . . . . . . . . . . . . . . . . . . . . . . . . . . . . . . . . . . . . . . . . 8 F i g . 6 . Hi lsch Tubes . . . . . . . . . . . . . . . . . . . . . . . . . . . . . . . . . . . . . . . . . . . . . . . . . . . 9
F i g . 7 . Unif low Tube . . . . . . . . . . . . . . . . . . . . . . . . . . . . . . . . . . . . . . . . . . . . . . . . . . . 10 F i g . 8 . Chart for Argon-Helium Mixtures . . . . . . . . . . . . . . . . . . . . . . . . . . . . . . . . . . . . . . . 10 F i g . 9 . Vortex Tube Flow Patterns . . . . . . . . . . . . . . . . . . . . . . . . . . . . . . . . . . . . . . . . . . 11 F i g . 10 . VortexT-Tube . . . . . . . . . . . . . . . . . . . . . . . . . . . . . . . . . . . . . . . . . . . . . . . . . . 12 F i g . 1 1 . Temperature Prof i le for Unbaffled T-Tube . . . . . . . . . . . . . . . . . . . . . . . . . . . . . . . . 12 F i g . 12 . Temperature Prof i le . Baff le adjacent to thermocouple No . 1 . ................... 12 F ig . 13 . Temperature Profi le . Baff le adjacent to thermocouple No . 7 . . . . . . . . . . . . . . . . . . . . 14 F ig . 14 . Temperature v s Baff le Opening . Baff le adjacent to thermocouple No . 1 . . . . . . . . . . . . . . 15 F i g . 15 . Temperature vs Baff le Owning . Baff le adjacent to thermocouple No . 7 . . . . . . . . . . . . . 15 F i g . 16 . Temperature Prof i le . Baff le into tube . . . . . . . . . . . . . . . . . . . . . . . . . . . . . . . . . . . 18 Fig . 17 . Temperaturevs Baff le Location . . . . . . . . . . . . . . . . . . . . . . . . . . . . . . . . . . . . . . . 18 F i g . 18 . Hollow Probe-Tube Effect . Effect of baff le distance . . . . . . . . . . . . . . . . . . . . . . . . . 19 F i g . 19 . Hollow Probe-Tube Effect . Effect of probe arrangement . . . . . . . . . . . . . . . . . . . . . . . 29 F i g . 20 . Eleven-Station Vortex Tube . . . . . . . . . . . . . . . . . . . . . . . . . . . . . . . . . . . . . . . . . . 21 F i g . 21 . Unbaffled Temperature Prof i le of 11-Station Tube . . . . . . . . . . . . . . . . . . . . . . . . . . . 21 F i g . 22 . Baff led Temperature Prof i le of 1 I-Stat ion Tube . Baff le introduced from
end adjacent to thermocouple No . 11 . . . . . . . . . . . . . . . . . . . . . . . . . . . . . . . . . . . F i g . 23 . Baff led Temperature Prof i le of 11-Station Tube . Baff le introduced from
end adjacent to thermocouple No . 1 . . . . . . . . . . . . . . . . . . . . . . . . . . . . . . . . . . . 24 F i g . 24 . Luc i te and Glass Vortex Tubes . . . . . . . . . . . . . . . . . . . . . . . . . . . . . . . . . . . . . . . . 26 F i g . 25 . Temperature Prof i le of Luc i te Tube with Various Baffles . . . . . . . . . . . . . . . . . . . . . . 27 F i g . 26 . Luc i te Tube Used for Pressure Measurements . . . . . . . . . . . . . . . . . . . . . . . . . . . . . . 27 F i g . 27 . Hypodermic Needles Used for Pressure Measurements . . . . . . . . . . . . . . . . . . . . . . . . . 28 F i g . 28 . Pressure Profi le Along Tube . Jet pressure. 25 psig; baffle. 17 in . from jet . . . . . . . . . . . 28 F i g . 29 . Pressure Prof i le Along Tube . Jet pressure. 40 psig; baffle. 17 in . from jet . . . . . . . . . . . 30
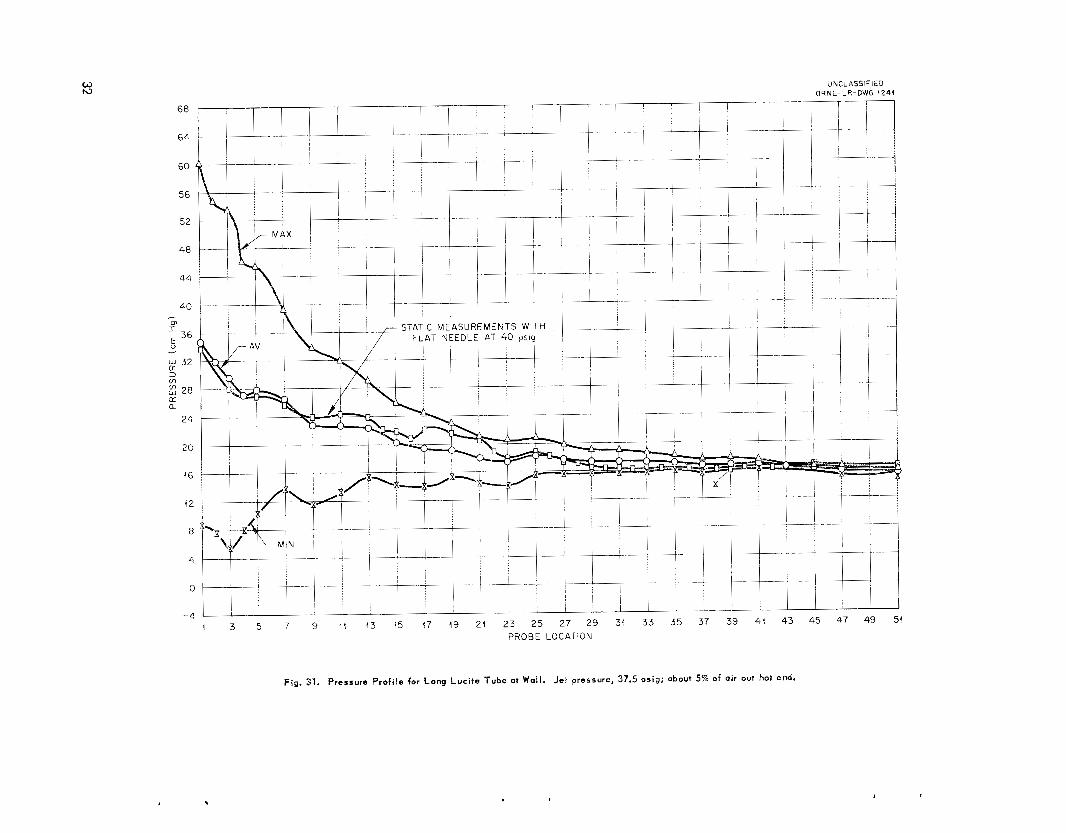
F i g . 30 . Pressure Profi le Across Tube at Various Stations . . . . . . . . . . . . . . . . . . . . . . . . . . . . 31 F i g . 31 . Pressure Profi le for Long Luc i te Tube at Wall . Jet pressure.
32
24
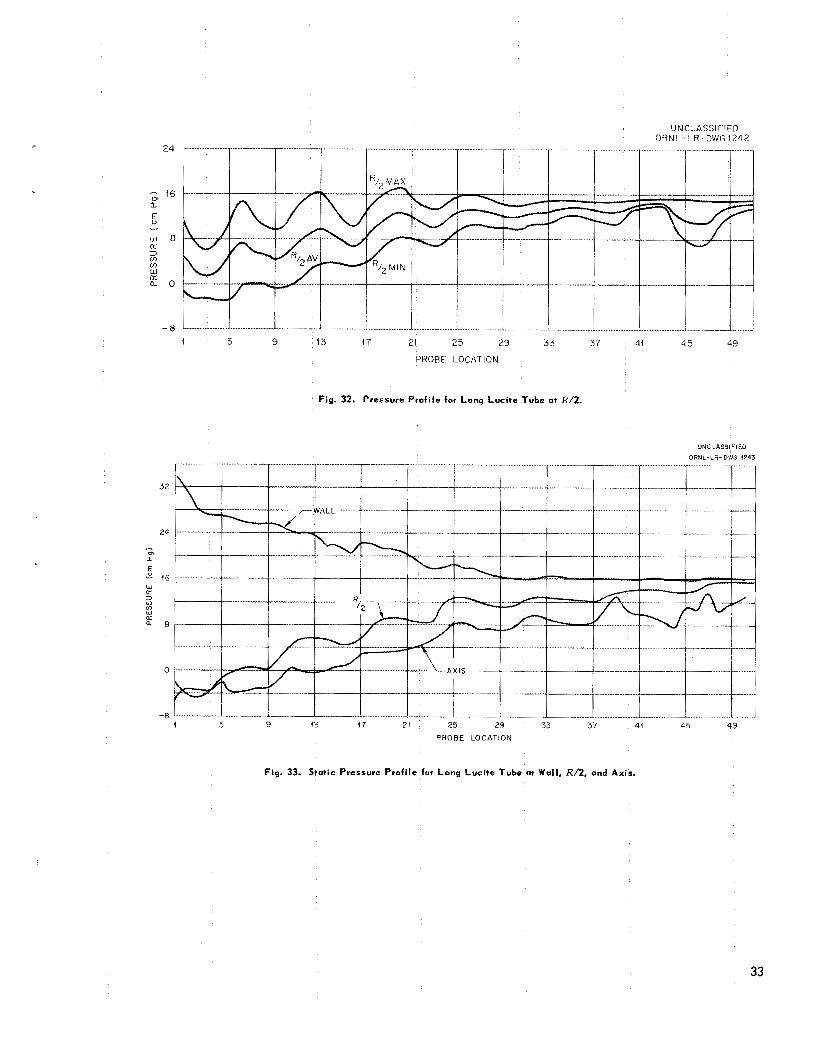
37.5 psig; about 5% of air out hot end . . . . . . . . . . . . . . . . . . . . . . . . . . . . . . . . . F i g . 32 . Pressure Profi le for Long Luc i te Tube at R/2 . . . . . . . . . . . . . . . . . . . . . . . . . . . . . 33
. . . . . . . . . . . . . . . F i g . 33 . Static Pressure Prof i le for Long Luc i te Tube at Wall. K/2 . and Ax is
F i g . 34 . Copper Vortex Tube Sawed Lengthwise . . . . . . . . . . . . . . . . . . . . . . . . . . . . . . . . . . 33 34
v i i

LIST OF TABLES
Table 1 . Mass Ratios for Air Collected over Water ............................... 5 Table 2 . Samples Collected over Mercury ..................................... 5 Table 3 .
of Samples Collected over Mercury .................................. 6 Table 4 . Ostwald Viscometer Data. ......................................... 6
Table 5 . N2-to-02 Ratios for Separation Experiments .............................. 8 Table 6 . Analysis o f Control Samples of Air ................................... 9
Comparison o f Deviations of Samples Collected over Water with Those
Table 7 . Argon-Helium Mixtures ........................................... IO Table 8 . Effect of Baf f le Distance at Various Thermocouple Stations . Baffle adjacent to
Effect o f Baff le Distance at Various Thermocouple Stations . Baffle adjacent to
Table 10 . Temperature Measurements as Baffle Was introduced into Tube . Baffle: adjacent
Table 11 . Table 12 Table 13 . Temperature Data for 9t.i" . Tube with 11 Thermocouples . Baff le adjacent to
Table 14 . Temperature Data for 9 b.in . Tube with 11 Thermocouples . Baffle adjacent to
thermocouple No . 1 ............................................. 12
13
16 17 21
22
Table 9 . thermocouple No . 7 ............................................. to thermocouple No . 7 . . . . . . . . . . . . . . . . . . . . . . . . . . . . . . . . . . . . . . . . . . .
Temperature Measurements Along Tube with Probe in End Opposite Baffle. . . ....... Temperature Measurements Along Tube with Probe Tube Plugged at Outer End . . . . . . .
thermocouple No . 11 ............................................ thermocouple No . 1 ............................................ 23
Table 16 . Pressure-Probe Data for Short Luci te Tube .............................. 26 Table 17 . Pressure-Probe Data for Long Luci te Tube .............................. 29 Table 18 . Samples Taken at Hot Spot. ........................................ 35
Table 15 . Temperature Measurements Along Luc i te Tube ............................ 25
ix

INVESTIGATIONS
P. S. Baker
ON THE RANQUE-HILSCM (VORTEX) TUBE
W. 8. Rathkornp
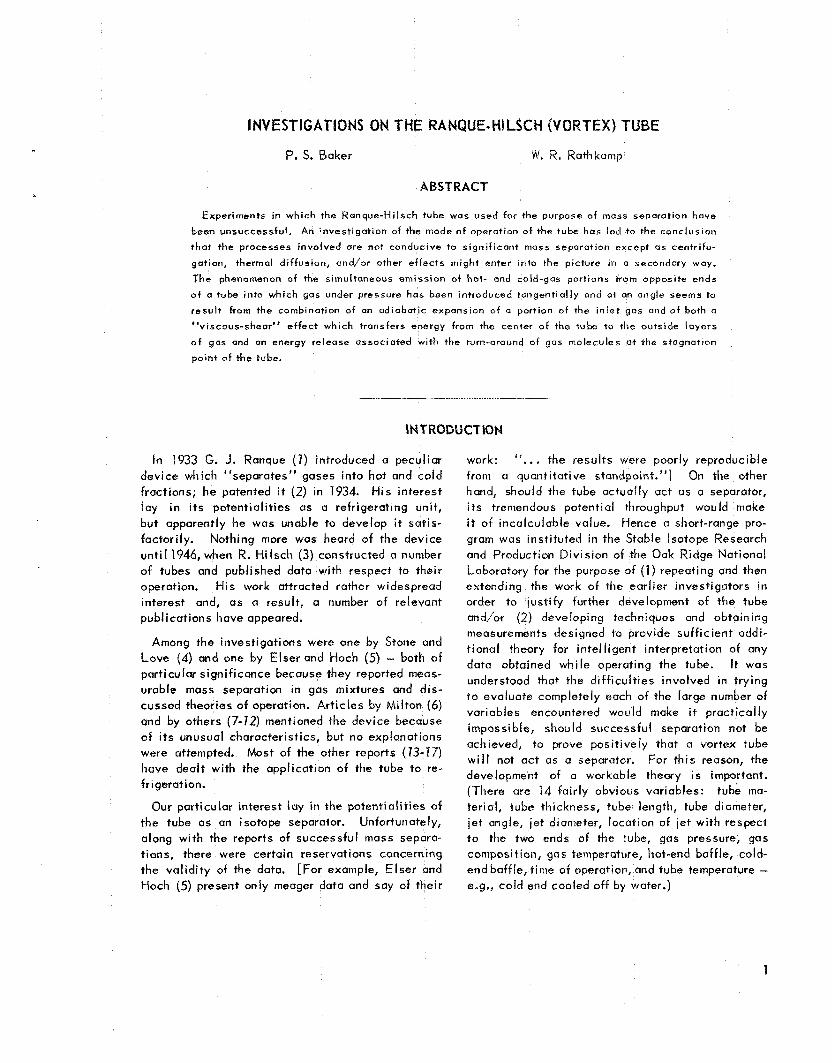
ABSTRACT
Experiments in which the Ranque-Hilseh tube was used for the purpose of mass separation hove
been unsuccessful. An invest igat ion of the mode of operation of the tube ha5 led to the conclusion
that the processes involved are not conducive to signif icant mass separation except as eentrifu-
gatian, thermal diffusion, and/or other ef fects might enter into the picture in a secondary way.
T h e phenomenon of the simultaneous emission ot hot- and cold-gas portions from opposite ends
of a tube into which gas under pressure has been introduced tangential ly and at an angle Seems to
resul t from the combination o f an adiabutic expansion of a portion of the in le t gas and o f both a
viscous-shear” ef fect which transfers energy from the center of the tube to the outside layers
o f gas and on energy release associated with the turn-around of gas molecules a t the stagnation
point of the tote .
* I
IN T RODUCT 10N
In 1933 G. J. Ranque ( 7 ) introduced a peculiar device which “separates” gases into hot and cold fractions; he patented it (2) in 1934. H i s interest lay i n i t s Potentialit ies as a refrigerating unit, but apparently he was unable to develop it satis- factorily. Nothing more was heard of the device until 1946, when R. H i lsch (3) constructed a number of tubes and published data with respect to their operation. H is work attracted rather widespread interest and, as a result, a number of relevant publications hove appeared.
Among the investigations were one by Stone and Love (4) and one by Elserand Hoch (5) - both of particular significance because they reported meas- urable mass separation rn gas mixtures and dis- cussed theories of operation. Art ic les by Mil ton (6) and by others (7-72) mentioned the device because of i t s unusual choracteristics, but no explanations ware attempted. Most of the other reports (73-17) have dealt with the application of the tube to re- fr i gerat ion.
Our particular interest lay in the potential i t ies of the tube a5 an isotope separator. Unfortunately, along with the reports of successful mass separa- tions, there were certain reservations concerning the val id i ty of the data. [For example, EIser and Hoch (5) present only meager data and say of their
work: ’ I , . . the results were poorly reproducible from a quantitative standpoint.”l On the other hand, should the tube actually act as a separator, i t s tremendous potential throughput would make i t of incalculable value. Hence a short-range pro- gram was inst i tuted in the Stable Isotope Research and Production Div is ion of the Oak Ridge National Laboratory for the purpose of (1) repeating and then extending the work of the earlier investigators in order to justify further development of the tube and/or (2) developing techniques and obtaining measurements designed to provide suff icient oddi- t ional theory for intel l igent interpretation of any data obtained while operating the tube. It was understood that the di f f icul t ies involved in trying t o evaluate completely each of the large number of variables encountered would make i t practical ly impossible, should successful separation not be achieved, to prove posit ively that a vortex tube w i l l not act as a separator. For th is reason, the development of a workable theory i s important. (There are 14 fair ly obvious variables: tube ma- terial, tube thickness, tube length, rube diameter, jet angle, iet diameter, tocation of ie t with respect t o the two ends of the tube, gas pressure, gas composition, gas temperature, hot-end baffle, cold- end baffle, time of operation, and tube temperature - e.g., cold end cooled off by water.)
1
THEORY
When a jet of air under pressure (ranging’ from 10ps ig to an optimum of about 10 atm) i s introduced into a small tube tangentially and simultaneously a t a s l ight axial angle, it i s found that air i s druwn in through the end of the tube behind the jet and blown out through the end ahead of the jet. Under these conditions the back end of the tube i s very s l ight ly cooler and the front end of the tube very s l ight ly warmer than ambient. A t pressures above about 30 psig, the velocity of the gas emitt ing from the jet i s in the sonic range.
When the “warm” end i s part ial ly throttled by insertion of some sort of a baff le into the tube, however, the warm side becomes much warmer and the cold side colder. If the air i s impeded enough by the throttle, gas i s forced out the back end of the tube and becomes quite cool, whereas the gas by-passing the baff le becomes quite warm. H i lsch (3) has shown the temperature relat ionships o f hot-end to cold-end ex i t gases for various exi t - gas ratios. A temperature difference of 100°C: between the two ends i s readily attainable. Per- haps the most amazing observation i s the develop- ment of a very marked “hot spot” when the warm end i s shut off completely, or almost completely. The location of the hot spot - a place on the tube which i s considerably warmer than the other parts of the tube in either direction from it - depends upon the in let gas pressure and upon the tube characteristics. (Baff l ing i s far more important than iet angle, since a hot spot may be obtained with a right-angle T-tube by proper baff l ing of the two ends.) The ex i t gas under these conditions i s s l ight ly cooler than ambient, probably part ly be- cause of the Joule-Thomson effect and portly be- cause some of the gas expansion i s adiabatic. Now, as the hot-end barrier i s gradually removed or opened, the hot spot moves down the tube toward the end and eventually disappears.
Most of the investigators have proposed theories o f tube operation of one sort or orother, hut no theory so far completely explains a l l the observed characteristics. Actually, there are almost as many suggestions as t o how the tube operates os there have been investigators. Many of the pro- posols admittedly have been based upon a few superf icial measurements of gas f lows and tem- peratures of in let and autlets; the hot spot i s
infrequently recognized. (It turns out, as a matter o f fact, that the temperature ef fect i t se l f - warm gas at one end and cold gas at the other - i s di f f icul t t o avoid when high-velocity gas is intro- duced tangentially into any tube which has been thratt led a t one end.) In general, however, the explanntions can be included in one of the fol low- ing categories.
The r ‘ V i 5 ~ ~ u ~ - S 1 R ~ ~ r ’ ’ T h e ~ r y . Supported entirely or in part by Webster (73), Fulton (14, Corr (77), Roebuck (78), Taylor (78,19), Ashley e t a / . (20), and Kassner and Knoernschild ( a ] ) , the viscous- shear theory suggests, in essence, that the gas spiral ing down the tulse from the jet consists of concentric layers of gas with angular velocit ies increasing toward the center (tending to mi~sewe angular momentum). The result is a shearing effect by which energy i s t r a n s h i e d from the inner layers of gas to the outer Ioyers, result ing in a coal ing o f the inner layers and warming of the outer layers. Corr (17) presents considerable data with respect t o the ef fect of dimensions on performance, Ex- planations by these investigators did not rnention the hot spot, probilbly because the interest has usually been in the cold portion of the tube. Generally included Q S port of the theory, however, i s the adiabatic expansion of part of he gas as contributing to the cold temperature.
The Kinetic-Molecular Interpretation. Supported by Stone and Love ( 4 ) and by Elser and Hoch ( S ) , the k i neti c-mo lecu I ar i nterpretot ion suggests that there is some peculiar (and generally unexplained) effect based on a molecular distr ibution other than Maxwell-Boltzmann which gives r ise to the peculiar temperature distribution. Stone and Love talk in terms of an “explosive dif fusion” of lighter mole- cules, and Elser and Hoch in termsof a phenomenon wi th a “kinetic-molecular basis.” Stone and Love claim that a counterflow system i s required i n which “. .. the jet streurn selectively gathers hot molecules as it approaches the hot spot, select ively loses hot molecules as it f lows on down toward the closed (or almost closed) end, The core stream f lowing back from the closed end gathers the hot molecules unt i l it reaches the hot spot and i s then selectively depleted of hot molecules unti I i t passes the jet.”2 They also suggest that o temperature
’Reference 5, p 28.
2
LReferance 4, p 24,
difference i s prima-facie evidence of mass separa- tion.
Scheper (22), basing h i s conclusions on probe work in which he found the stat ic temperature of the core stream to be higher than that of the outer helix, suggests that a heat transfer results from a “forced convection” to the outer helix; however, ha admits “. . . the required over-all heat transfer coeff icient i s greater than can beaccounted for by conventional cakulat ions.” It i s possible that he has oversimplif ied the funda- mental relationships involved and that he has lent loo much significance to small temperature dif- ferences. Scheper, l i ke severol 04 the investigators already mentioned, was primarily interested i n the cold end of the tube.
van Deernter (23), in a theoretical paper, suggests that a thermodynamic-aerodynamic explanation in- vo lv ing an extended Bernoull i equation is quite satisfactory, since the experimental results o f H i l sch and o f Elser and Hoch agree, for the greater part, with the theory.
Specific Explanations.
Bergner (24) also has written a theoretical paper in which he discusses a new method for separation of isotopes, namely, uranium. He does not refer specif ical ly to the Rmque-Hi Isch tu& but rather to the “vortex principle,” apparently presuming centrifugation; his report, furthermore, i s rather vague as to operational details.
It should perhaps be mentioned that as far as any muss separation i s concerned the separation of two different elements or compounds does not necessarily guarontee subsequent application of the tube to successful isotope separation. The differences in physical charucteristics or constants (e.g., number of atoms, molecular weight, specif ic heat, adiabatic exponent, polar or nonpolar charac- terist ics, kinematic viscosity, etc.) of the elements or compounds might wel l be of fundamental s igni f i - cance in their separation, whereas these factors would generally be much Jess important in the case of isotopes. In other words, separation of CO, from air or of N, from 0, may not be a “mass” separa- t ion in the real sense of the word.
EXPERlMENTAL
The experimental port ion of the investigation was arbitrari ly divided into three parts: 1. the development o f a suitabiie analyt ical method, 2. an attempt to obtain mass separation, 3. an attempt to obtain suff icient data to explain
the mode of tube operation. For the preliminary work, air was used as the gas, since previous investigators had used it and since it was readi ly avai lable and of fair ly constant composition.
Ana t yt ical
In order to evaluate the Ranque-Hilsch tube i n terms of i ts abi l i ty to effect mass separation, i t was necessary to devise an analyt ical procedure which would assure reasonable accuracy. Since different gas mixtures were expected to be used during the course of the investigation and since, even for air, the Orsat method of analysis i s sub- ject to some objection because of the d i f f i cu l ty in completely absorbing CO, and 0, and because it i s part ia l ly a dif ferential method, it was decided to employ a method based on the use of a mass
spectrometer. By relat ing “peak heights” of the various constituents involved, ratios can be ob- tained from which it i s possible to determine changes in gas composition. It was believed that an analyt ical method which could detect 10% of the t heoreti ca I I y pos s i ble enrichment should be sui t- oble for our needs. (For N,-0, mixtures, the fheo- ret ical enrichment factor for diffusion, E t as calcu- lated from Graham’s law, i s equal to @ J ? T = 1.07. If E is defined as i12/t3, + A , / t l , , where A , and f3, are the amounts of the tvvo constituents or ig i - nal ly present and A , and B z are the amounts pre- sent after enhancement, then the volume rat io of N, to 0, could be increased by a single-step en- richment from 3.72 normally to a theoretical value of 3.98. The mass-spectrometric method should be sensit ive enough to detect one-tenth of this dif fer- ence.)
f o r the purpose of sampling air streams passing through the vortex tube it was a t f i rs t decided to
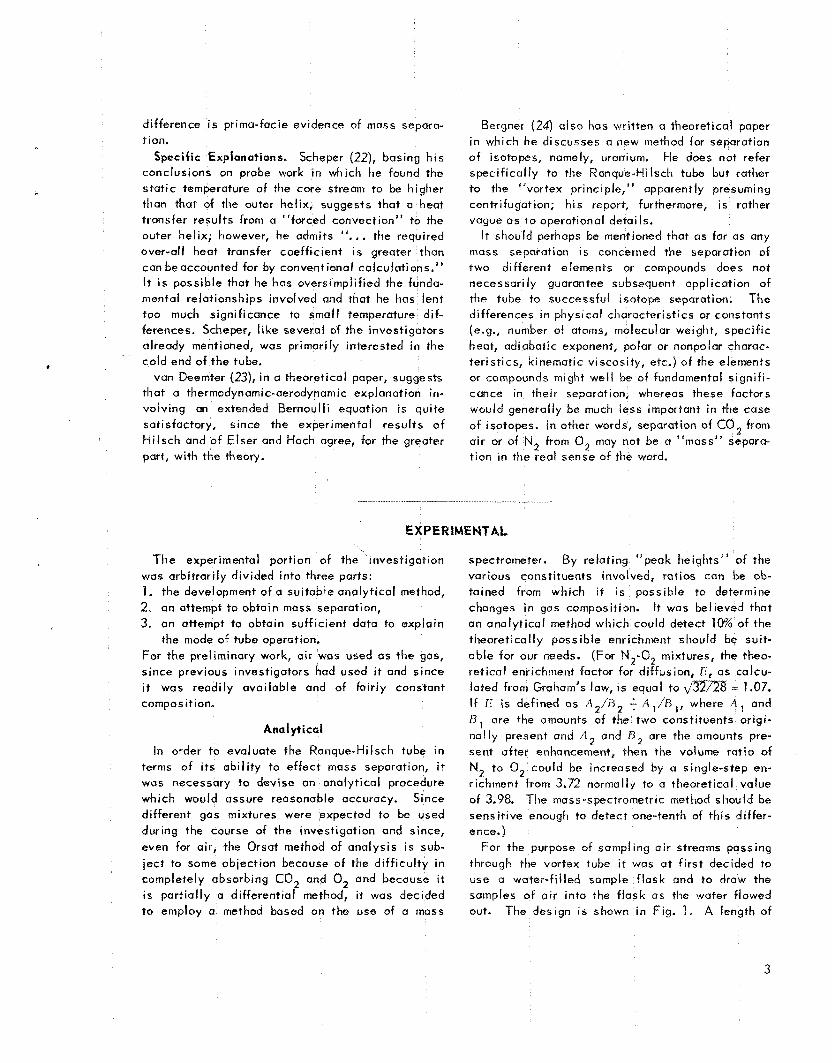
use a water-f i l led sample f lask and to draw the samples of a i r into the f lask as the water flowed out. A length of The design i s shown in Fig. 1.
3
rubber tubing connected the top of the f lask to a takeoff from the a i r stream to be sampled, When the stopcocks were opened, the water ran out and the sample was drawn in. Closing the stopcocks isolated the samp I e.
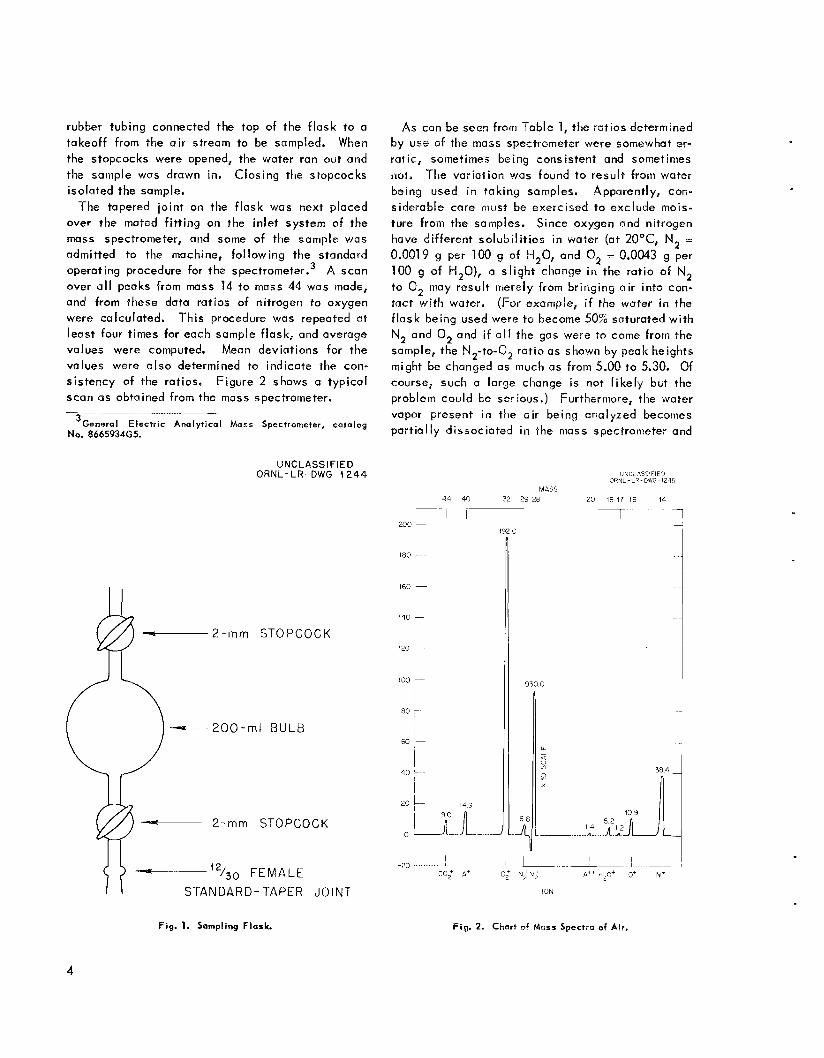
The tapered joint on the f lask was next placed over the mated f i t t ing on the in let system of the mass spectrometer, and some of the sample was adrni tted to the machine, fol lowing the standard operating procedure for the ~pec t romete r .~ A scan over a l l peaks from mass 14 t o mass 44 was made, and from these data ratios of nitrogen to oxygen were calculated. This procedure was repeated at least four times for each sample flask, and average values were computed. Mean deviations for the values were also determined to indicate the con- sistency of the ratios, Figure 2 shows a typical scan as obtained from the mass spectrometer.
'General Electric Analytical M a s s Spectrometer, catalog No. 0665934G5.
As can be seen from Table 1, the ratios determined by use of the mass spectrometer were somewhat er- ratic, sometimes being consistent and sometimes not. The variat ion was found to resul t from water being used in tnking samples. Apparently, con- siderable care must be exercised to exclude mois- ture from the samples. Since oxygen and nitrogen have different solubi l i t ies i n water (at 2Q°C, N, =
0.901 9 g per 100 g of H20, and 0, = 0.0043 g per 100 g of H,O), a s l ight change in the rat io of N, to 0, may result merely from bringing air into con- tact w i th water. (For example, i f the water in the f lask being used were to become 50% saturated with N, and 0, and i f all the gas were to come from the sample, the N2-to-02 rat io as shown by peak heights might be changed as much as from 5.00 to 5.30. Of course, such a large change is not l i ke ly but the problem could be serious,) Furtherniore, the water vapor present in the air being cnalyzed becomes part ia l ly dissociated i n the mass spectrometer and
UNCLASSIFIED ORNL-LR-DWG 1244
180
160 -
Fig. 1. Sampling Flask.
14C
120
'00
80
60
"0
20
0
-20
I4 9
MASS 32 23 26
I 1
930 0
6 8
A.
w 1 a
n P x
Fig. 2. Chart of Mars Spectro of Air.
UNC.ASS'FIED 3RNL-LR-DWG-I215
20 I8 17 I6 14
71
4
thereby contributes to the oxygen peaks; this lowers the apparent value of the N2-to-02 ratio. Because both these effects depend upon the quan- t i t y o f water present, th is quantity i t se l f being variable, inconsistent results were obtained. (The fact that these two errors tend to cancel each other probably explains why the values are not more erratic than they are.)
The absolute value of the N2-to-02 rat io i s not part icularly important. Owing to differences in ionization efficiencies, ionirat ion potentia Is, frac- tionation, and molecular dissociat ion between the two gases involved, the calculated rat ios are not the same as those based on volumes. Furthermore, there are dailly variations which are much greater than the variations in successive samples run during a period o f a few hoursa4 It is of interest to note, however, that where N228-to-N229 rat ios are calculated the di f f icul t ies mentioned above are
‘See Table 4.
Table 1. Mass Ratios for Air Collected over Water ~~ ~ ~~ ~~
N Z - t o - 0 2 Ratios
Sample A Sample C Somple F . . . ~.___II_ I_..___._
___ .... ~~ ............... ___ .... ~~~.~ ~
4.84 5.11 4.67
4.96 5.2 1 4.98
4.93 4.89
4.95 4.88
Av 4.90 k 0.06 Av 5.05 f 0.1 1 AV 4.86 .t 0.09
unimportant, and the values ure in very good agreement with the published data.
In order to eliminate water as a source of error, mercury was substituted as the displacing medium. The solubi l i ty of air i n mercury is negligible, and in the mass spectrometer mercury contributes peaks i n the mass 200 region, which i s wel l outside the range being investigated. This change i n technique qave values repeatable to about one part i n 250, as shown in Tables 2 and 3. Further experiments showed that admitting one charge t o the spectrome- ter chamber from a given sample f lask and then scanning it several times gave the same average deviations of results us the earl ier procedure which involved admitting one charge, scanning, pumping out, and then admitting a i e w sample for scanning.’ Obviously, this change I n procedure reduced the operating t i m e considerably, although from the standpoint of sampl ing theory it was somewlmt less desirable.
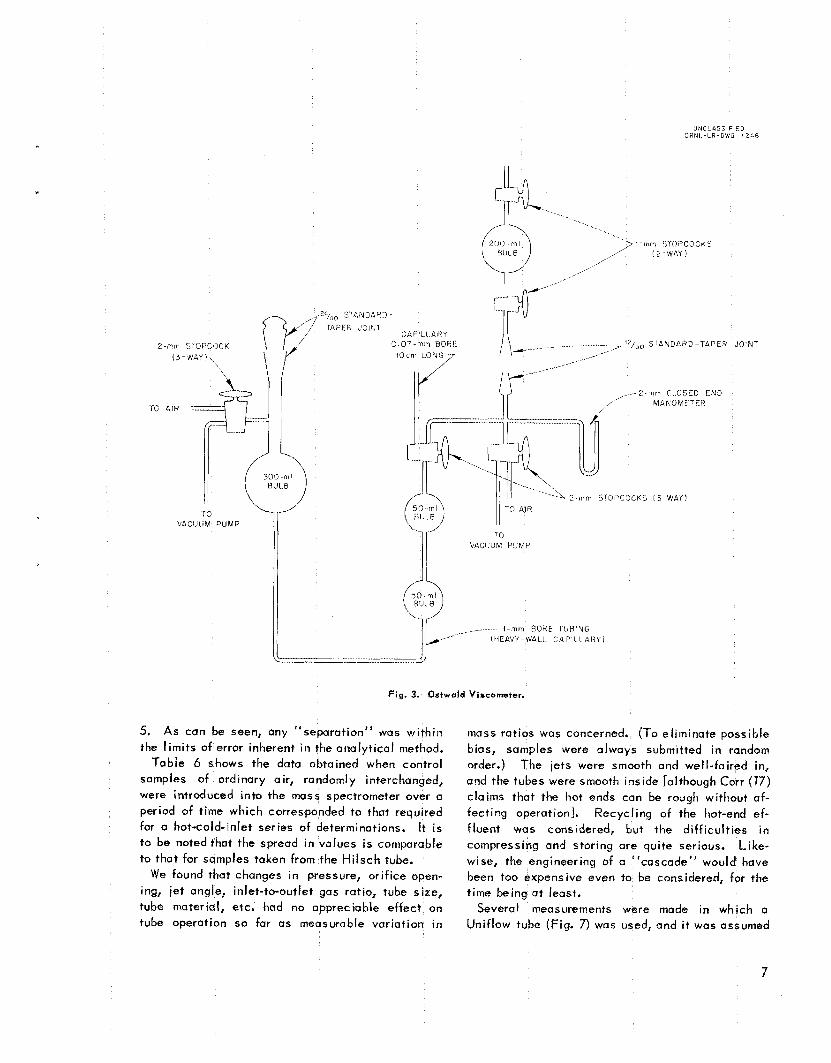
To provide what was hoped would be a referee and perhaps a faster, alternative analyt ical method for the qas analyses, an Ostwald viscometer was constructed that consists of the arrangement shown in Ftq. 3. The operation depends upon Poisseuil le’s equation:
where
q = viscosi ty coefficient, poises, r 1: radius of tube,
5Sec f a b l e 6.
Table 2. Samples Collected over Mercury _.............I.
N2-to-02 Rat ios
Sample 12 Sample 13 Sample 17 Sample 18
4.98 4.94
5.29 5.03 4.98 5.01
5.29 5.02 4.95 4.93
5.32 4.97 4.98 4.96
5.31 4,94 4.96 4.90
Av 5.30 t- 0.01 Av 4.99 t 0.03 Av 4.97 * 0.02 Av 4.95 f 0.03 I-.__ __ ..__I_
5
V = volume of gas, P = pressure difference, 1 = length of tube, t = time of flow.
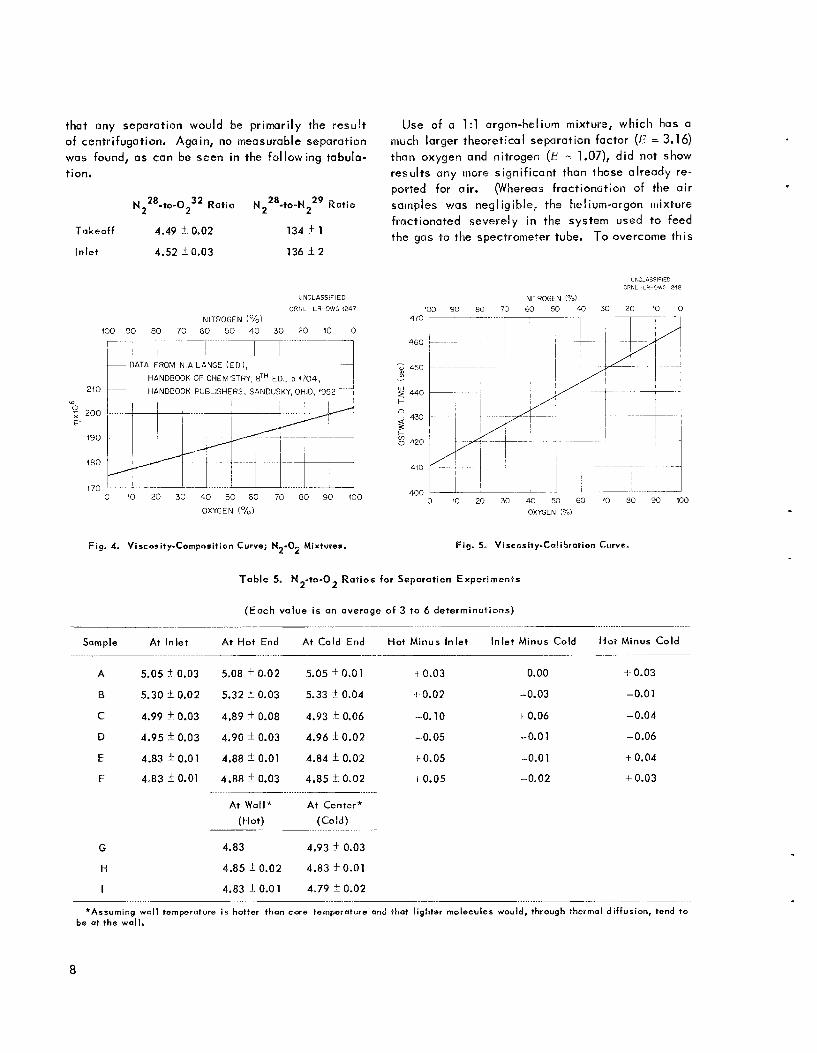
The application depends upon the assumption that the changes in the v iscosi ty of gas mixtures are proportional t o the changes in the composition of the gas. Figure 4 shows the theoretical curve for the v iscosi t ies of various N,-0, mixtures.
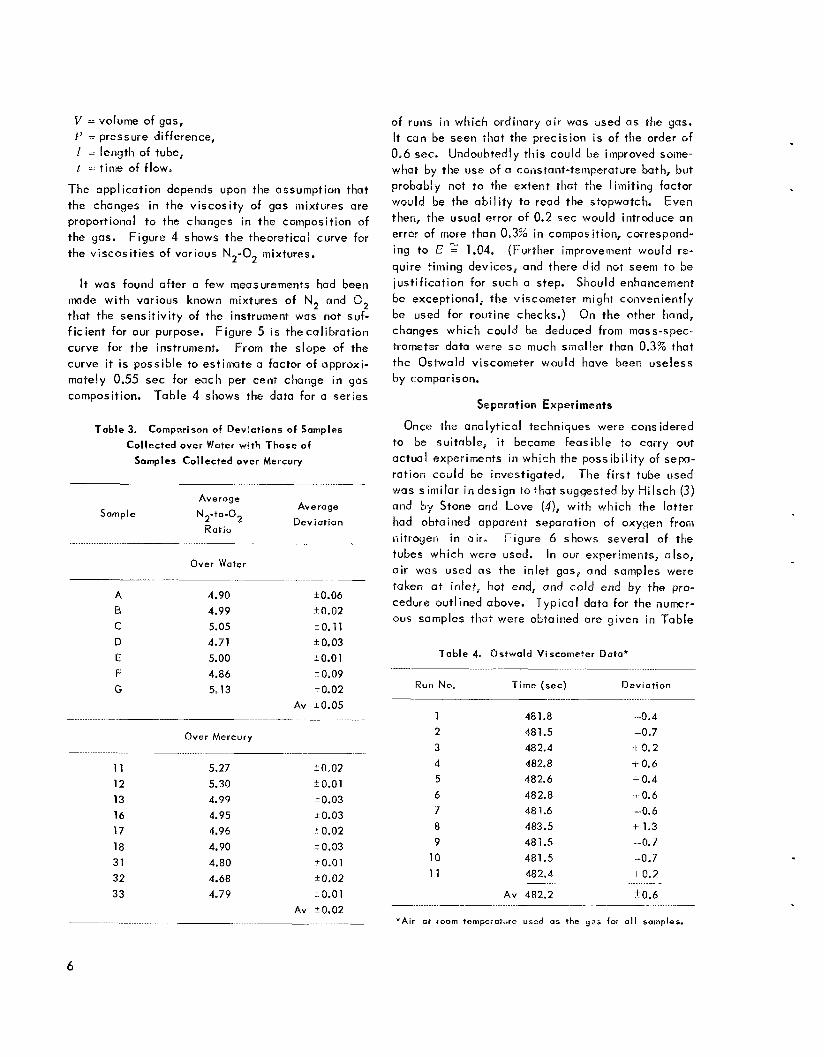
It was found after a few measurements had been made w i th various known mixtures o f N, and 0, that the sensi t iv i ty of the instrument was riot suf- f ic ient for our purpose. Figure 5 i s thecal ibrat ion curve for the instrument. From the slope of the curve it is possible to estimate a factor of approxi- mately 0.55 see for each per cent change in gas composition. Table 4 shows the data for a series
T a b l e 3. Comparison of Deviations of Samples
Col lected aver Water with Those o f
Samples Col lected over Mereury
of runs i n which ordinary air was used CIS the gas. It can be seen that the precision i s of the order of 0.6 sec. Undoubtedly this could be improved some- what by the use o f n constant-temperature bath, but probably not t o the extent that the l imi t ing factor would be the ab i l i t y to read the stopwatch. Even then, the usual error of 0.2 see would introduce an error of more than Q,3% in composition, correspand- ing to E 2' 1.04. (Furtlier improvement would re- quire timing devices, and there did not seem to be just i f icat ion for such a step. Should enhancement be exceptional, the viscometer might conveniently be used for routine checks.) On the other hand, changes which could be deduced from mass-spec- trometer data were 5 0 much smaller than 0.3% that the Ostwald viscometer would have been useless by comparison.
Separation Experiments
Once the analyt ical techniques were considered to be suitable, it become feasible to carry out actual experiments in which the possibi l i ty of sepa- rat ion could be investiaated. The f i rst tube used
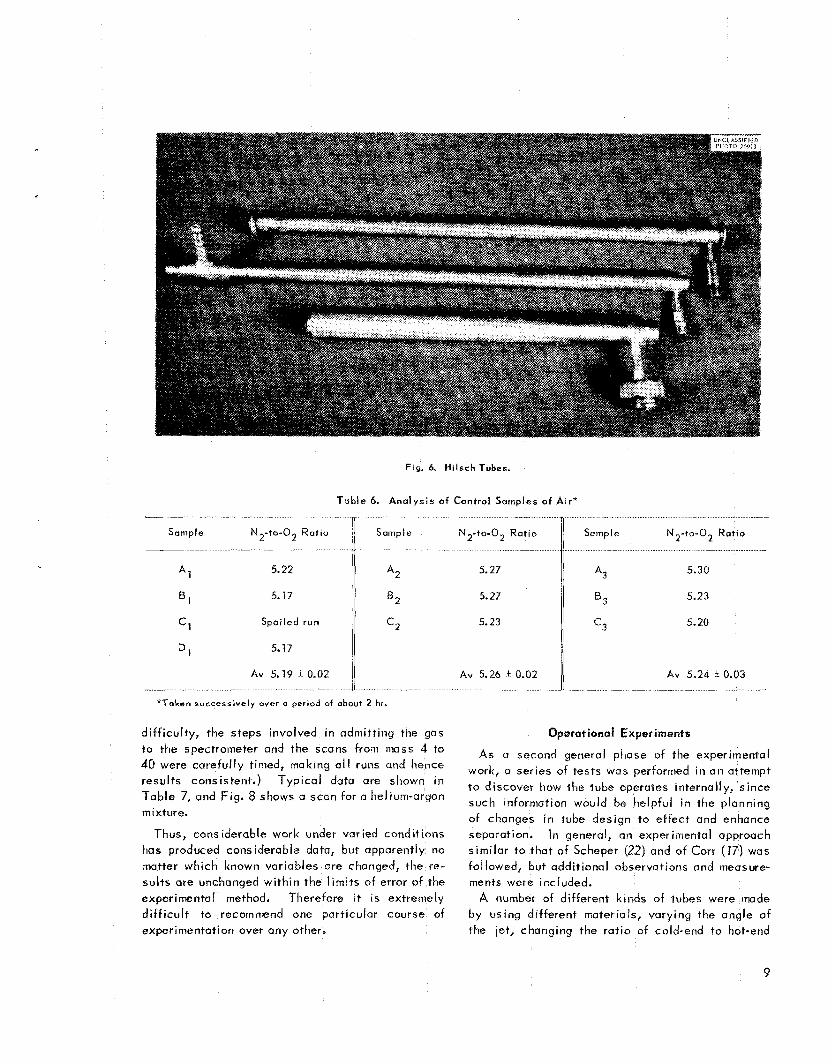
w - ....... ___ was similar in design to tha t suggested by H i lsch (3) nnd by Stone and Love ( 4 ) , with which the latter
2 Deviat ion had obtained apparent separation of oxygen from _ .................... .......... -_ -- nitrogen in a i r " Figure 6 shows several of the
Average Average
Sample N 2 - t o - 0
Ratio
Over Water
4.90 4.99 5.05 4.71 5.00 4.86 5.13
Av
k0.06 k0,02 kO.11 f 0.03 kO.01 t0.09 k0.02 10.05
Over Mercury
1 1 12 13 16 17 18 31 32 33
5.27 5.30 4.99 4.95 4.96 4.90 4.80 4.68 4.79
*0*02 k 0.0 1 i0.03 0.03
+ 0.02 1-0.03 *0.01 k0.02 kO.01
Av k0.02
tubes which were used. In our experiments, also, air was used as the inlet gas, and samples were taken at inlet, hot end, and cold end by the pro- cedure outlined above. Typical data for the numer- ous samples that were obtained are given in Table
T a b l e 4. Qstwald Viscometer Data*
Run No. Time (see) Deviat ion
1 481.8 -0.4 2 481.5 -0.7 3 482.4 -I- 0.2 4 482.8 + 0.6 5 48 2.6 + 0.4 6 482.8 .! 0.6 7 481.6 -0.6 8 183.5 + 1.3 9 48 1.5 -0.7 10 481.5 -0.7
482.4 + 0.2 1 1
482.2 f0.6 ~. .. ....
- .......... .......... .- ......... __
'Air at r o o m temperature used as the g ~ s for a l l s a m p l e s .
JNCLASSI FIFO ORNl -LR-UWu 1246
-7, mrn YrOI’COCKS ,’ ’ ( 2 WP.Y 1
_ . _ _ ~,, ‘ 7 1 ~ ~ SrANUAHD -TAPE9 JOINT
-.-Z mrr c l G S f D END
GAP’LL A 3 Y 0 07-rnin BOhf
MANOME TFP
VAGLJIJM I’IJMP
(HEAVY WALL LAPILCARY I
Fig. 3. Ostwald Viscometer.
VACIJIJU PUMP
5. As can be seen, any “separation” was within mass rat ios was concerned. (To eliminate possible the l im i ts of error inherent i n the analyt ical method. bias, samples were always submitted i n random
Table 6 shows the data obtained when control order.) The jets were smooth and well-faired in, samples of ordinary air, randomly interchanged, and the tubes were smooth inside [although Corr (17) were introduced into the mass spectrometer over a claims that the hot ends can be rough without af- period of time which corresponded to that required fect ing operationl. Recycl ing of the hot-end ef- for a hot-cold-inlet series of determinations. It is f luent was considered, but the di f f icul t ies i n to be noted that the spread i n values i s comparable compressing and storing are quite serious. L ike- to that for samples taken from the H i lsch tube. wise, the engineering of a “cascade” would have We found tha? changes in pressure, ori f ice open- been too expensive even to be considered, for the
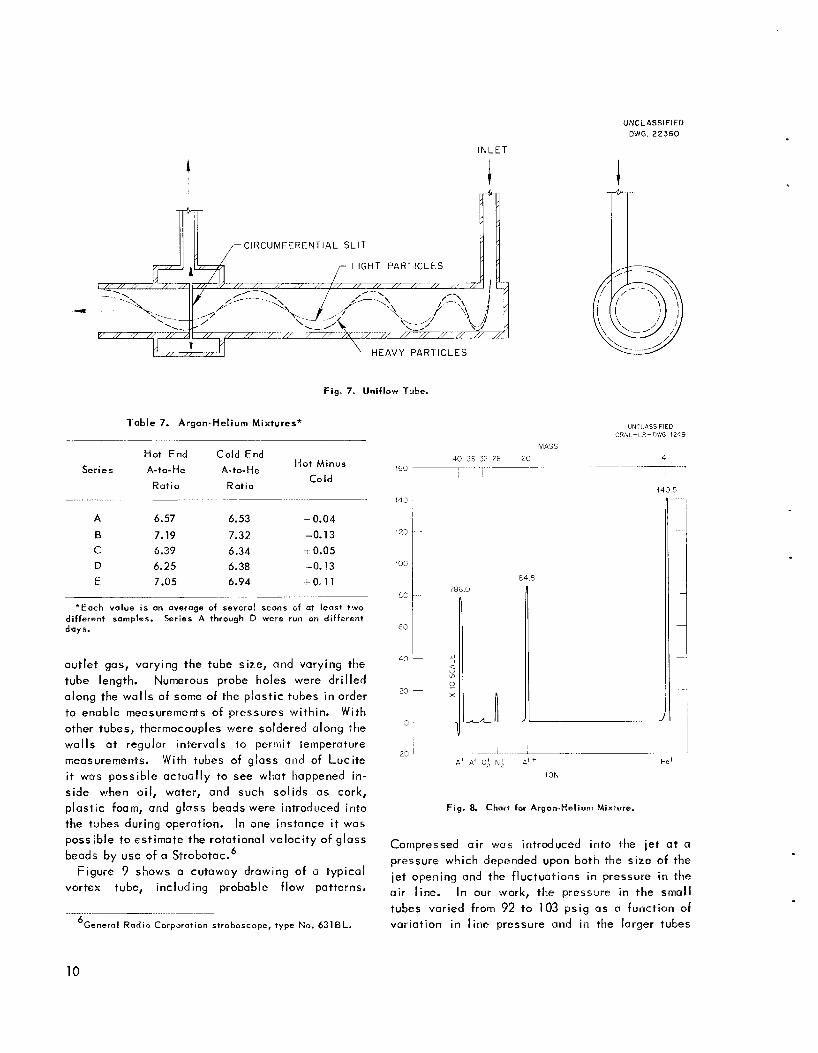
ing, jet angle, inlet-to-outlet 9a5 ratio, tube size, time being a t least. tube material, etc. had no appreciable effect on Several measurements were made in which a tube operation so far as measurable variat ion i n Unif low tube (Fig. 7) was used, and it was assumed
7
that any separation would be primari ly the resul t of centrifugation. Again, no measurable separation was found, as can be seen in the fol lowing tabula- tion.
F ' 1 L 5 J . Y -
" 0 1 ; 200
190
180 // .-
/' 4 70 j 1 1-
N228-tc-0232 Rat io N228-to-N229 Rat io
Takeoff 4.49 f 0.02 134 & 1
In let 4.52 k 0.03 136 * 2
UUCLASSIFIED CRHL L R SJlG 1247
NITROGEN !%) 400 90 80 70 6 0 5 0 40 30 2 0 10 0
DATA FROM N A LANGE ( E D ) ,
HANDBOOK cr CHEWTRY, sTH ED, 4704, HANDBOOK PUBLISHERS, SANDUSKY, OHIO, 4952
Fig. 4. Viscosity-Composition Curve; N 0 Mixtures. 2- 2
Use of a 1:l argon-helium mixture, which has a inuch larger theoretical separation factor ( E = 3.16) than oxygen and nitrogen ( E = 1.07), d id not show results any iiiore signif icant than those already re- ported for air. (Whereas fractionation of the air sarriples was negligible, the helium-argon mixture fractionated severely in the system used to feed the gas to the spectrometer tube. To overcome this
WCLASSI~ IF I I URNL d - D w ,748
NITROGEN (%I 100 90 80 70 6 0 50 A0 30 20 YO 0
470 7- , , 4 6 0
- o 450 P w 2 4 4 0 + n
430
._
2 420
410
0 10 20 30 4 0 50 6 0 70 80 90 100 OXYGEN !%I
Fig. 5. Viscosity-Calibralion Curve.
T a b l e 5. N - t o 4 Rat ios for Separation Experiments 2 2
(Each value i s an average of 3 to 6 determinations)
Sample At Inlet ... . . . . . ... .. . .. . . . . . . .. . ..
A 5.05 ?L 0.03
B 5.30 k 0.02
C 4.99 f 0.03
D 4.95 + 0.03
E 4.83 5 0.01
F 4.83 k 0.01
At Hot End At Cold End ____ _....._..
5.08 i 0.02 5.05 i 0.01
5.32 k 0.03 5.33 k 0.04
4.89 0.08 4.93 * 0.06 4-90 Ifi 0.03 4.96 0.02
4.88 0.01 4.84 * 0.02 4.88 k 0.03 4.85 * 0.02
At Wall* At Center*
(Hot) (Cold)
G
H
I
4.83 4.93 ? 0.03
4.85 ? 0.02 4.83 * 0.01 4.83 1: 0.0 1 4.79 * 0.02
Hot Minus Inlet Inlet Minus Cold H o t Minus Cold
+ 0.03 0.00 4 0.03
-! 0.02 -0.03 -0.01
-0.10 i 0.06 -0.04
-0.05 -0.01 -0.06
rr0.05 -0.01 + 0.04 + 0.05 -0.02 + 0.03
*Assuming w a l l temperature is hotter than core temperature and that lighter molecules would, through thermal diffusion, tend t o be at the wall.
8
............ .... ~~~ ............. J . ..
A 1 5.22
B 1 5.17
*2
B 2
c 2 Spoiled run c1
D l 5.17
A v 5.19 i 0.02 11. ....... .................. ~.
*Taken successively over a period of about 2 hr.
diff iculty, the steps involved in admitt ing the gas
t o the spectrometer and the scans from m o s s 4 to 40 were careful ly timed, making a l l runs and hence results consistent.) Typical data are shown in Table 7, and Fig. 8 shows a scan for a helium-argon mixture.
Thus, cons iderable work under varied condit ians has produced considerable data, but apparently no matter which known variables are changed, the re- sults are unchanged w i th in the l im i ts of error of the experimental method. Therefore it I S extremely d i f f i cu l t to recomnm-id one particular course of experimentatiort over any other.
5.27
5.23
5.23
5.20
Av 5.26 f a.02 / / Av 5.24 f 0.03
Operational Experiments
A s a second general phase of the experimental work, a series of tests was perforrrted i n an attempt to discover how the tube cperates internally, since such information would be helpful i n the planning of changes i n tube design to effect and enhance separation. In general, an experimental approach similar to thut of Scheper (22) and of Corr (17) was followed, but addit ional observations and measure- ments were included.
A number of different kinds of tubes were made by using different materials, varying the angle of the let, changing the ratio of cold-end to hot-end
9
UNCLASSIFIED DWG. 22360
--
I INLET
I
CIRCUMFERENTIAL SL IT
LIGHT PARTICLES
Fig. 7. Uniflow Tube.
Table 7. Argon-Helium Mixtures*
Hot End Cold End Hot Minus
Co Id Series A-to-He A- t 0- He
Ratio Ratio _ ..................... .......... ..........
A 6.57 6.53 + 0.04 El 7.19 7.32 -0.13 c 6.39 6.34 i- 0.05 D 6.25 6.38 -0.13 E 7.05 6.94 t O . 1 1
...... ..........
*Each value is on average of sevaral scans of at least two different samples. Series A through D were run on different days.
out let gas, varying the tube size, and varying the tube length. Numerous probe holes were dr i l led along the wal ls of some of the plast ic tubes i n order to enable measurements of pressures within. With other tubes, thermocouples were soldered along the wal ls a t regular intervals to permit temperature measurements. With tubes of glass and of Luc i te it was possible actual ly to see what happened in- side when oil, water, and such solids as cork, p last ic foam, and glass beads were introduced into the tubes during operation. In one instance it was possible to estimate the rotational veloci ty of glass beads by use of a Strobotac.'
Figure 9 shows a cutaway drawing of a typical vortex tube, including probable f low patterns.
.. ... ........ ~__ 'General Radio Corporation stroboscope, type No. 631BL.
123
10c
ac
60
40
20
3
I
llNC1 4SSlFlED C!?\L-LR-OWG 1249
MASS
4 0 35 32 28 20 4 7
786.0
i 1'
a4.8
Fig. 8. Chart for Argon-Helium Mixture.
Cornpressed a i r wus introduced into the jet a t a pressure which depended upon both the s ize of the jet opening and the fluctuations i n pressure in the air line. In our work, the pressure in the small tubes varied from 92 t o 103 ps ig as a function of variation i n l ine pressure and i n the larger tubes
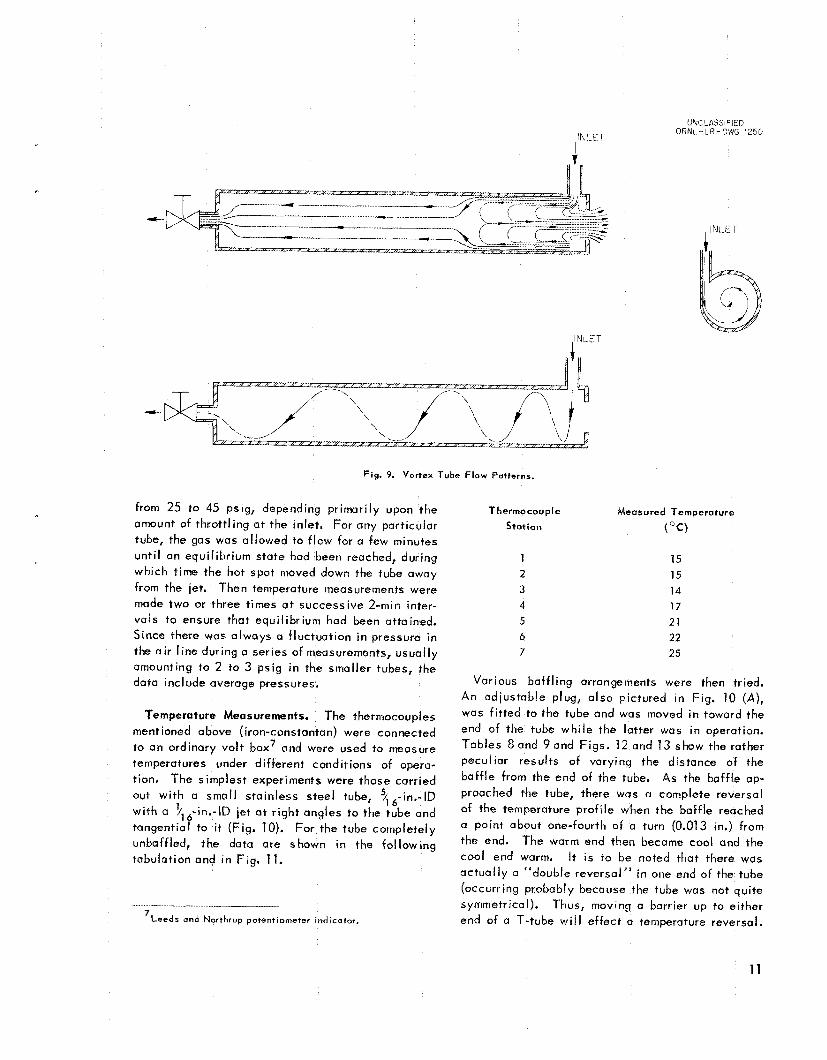
Fig. 9. Vortex Tube F l o w Patterns.
from 25 to 45 p i g , depending primarily upon the arrlount of thrott l ing at the inlet. For any particular tube, the gas was al lowed to f low for a few minutes un t i l an equil ibr ium state had been reached, during which time the hot spot moved down the tube away from the jet. Then temperature measurements were made two or three times a t successive 2-min inter- vals to ensure that equi l ibr ium had been attained. Stnce there was always a f luctuotion i n pressure in the air l ine during a series OF measurements, usuaily amounting to 2 to 3 psig i n the smaller tubes, the data include average pressures.
Temperature Mea s urernents. The thermocouples mentioned above (iron-constantan) were connected to an ordinary vo l t box7 and were used to measure temperatures under different conditions of opera- tion. The simplest experiments were those carried out wi th a small stainless steel tube, $,-in.-IQ
tangential to it (Fig. 10). For the tube completely unbaffled, the data are shown in the fol lowing tabulation and i n Fig. 11.
with a 1 /,6-in.-lD iet at r igh t angles to the tube and
-__- -l_l__
’Leeds and Northrup potentiometer indicator.
Thermocouple Measured Temperoture
Station ( O C )
1 15 2 15 3 14 4 17 5 21 6 22 7 25
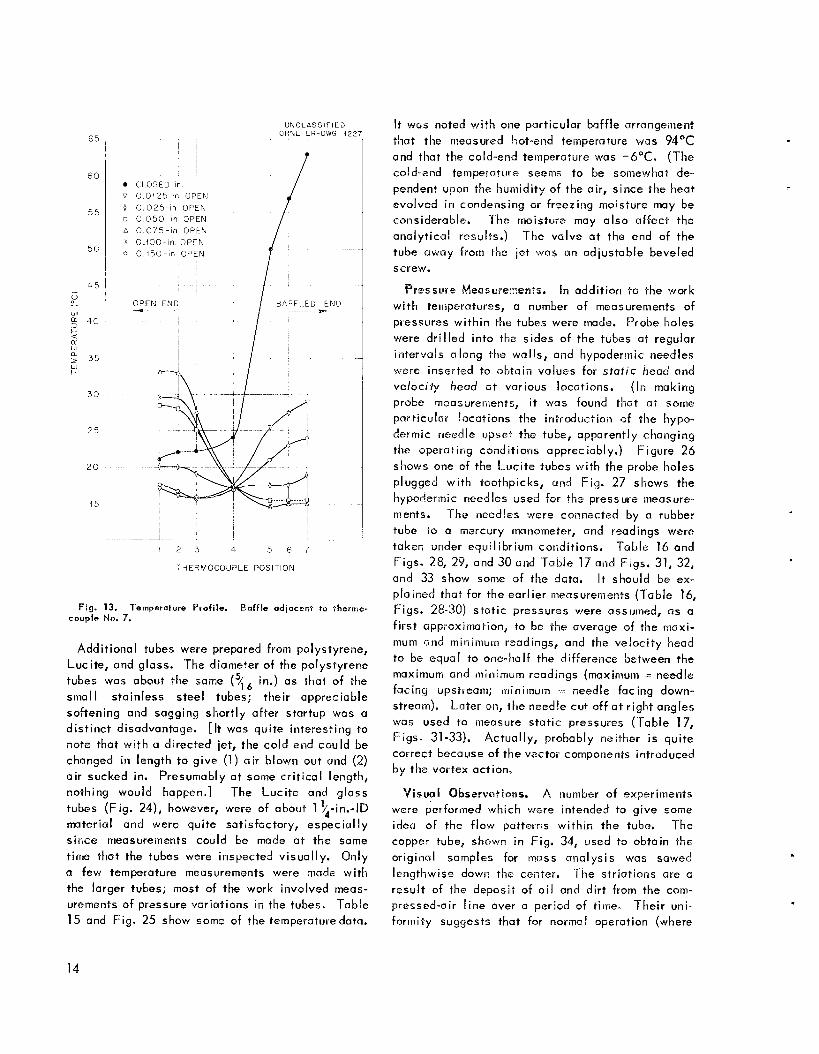
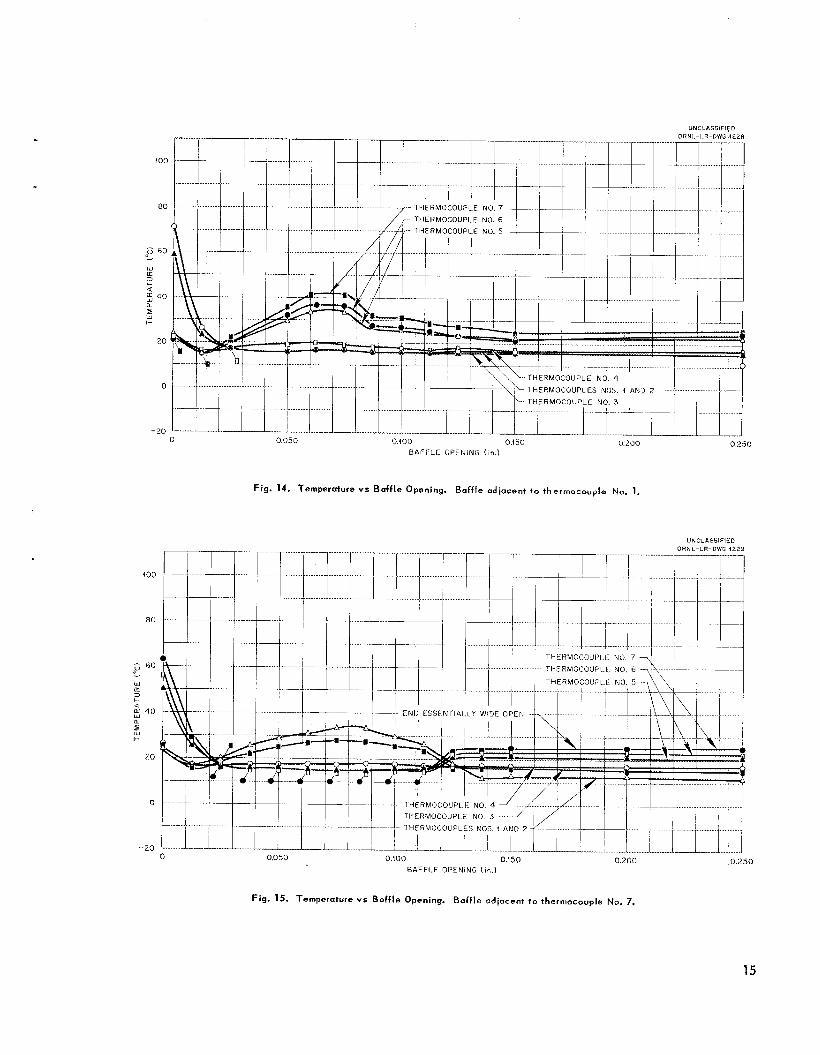
Various baff l ing arrangements were then tried. An adiustable plug, also pictured i n Fig. 10 (A), was f i t ted to the tube and was moved i n toward the end of the tube whi le the latter was in operation. Tables 8 and 9 and Figs. 12 and 13 show the rather peculiar results of varying the distance of the baff le from the end of the tube. As the baff le ap- proached the tube, there was u complete reversal of the temperature prof i le when the baffle reached a point about one-fourth of a turn (0.013 in.) from the end, The warm end then became cool and the cool end warm. It is to be noted that there was actual ly a “double reversal” i n one end of the tube (occurring probably because the tube was not quite symmetrical). Thus, moving a barrier up to either end of a T-tube w i l l effect a temperature reversal.
11
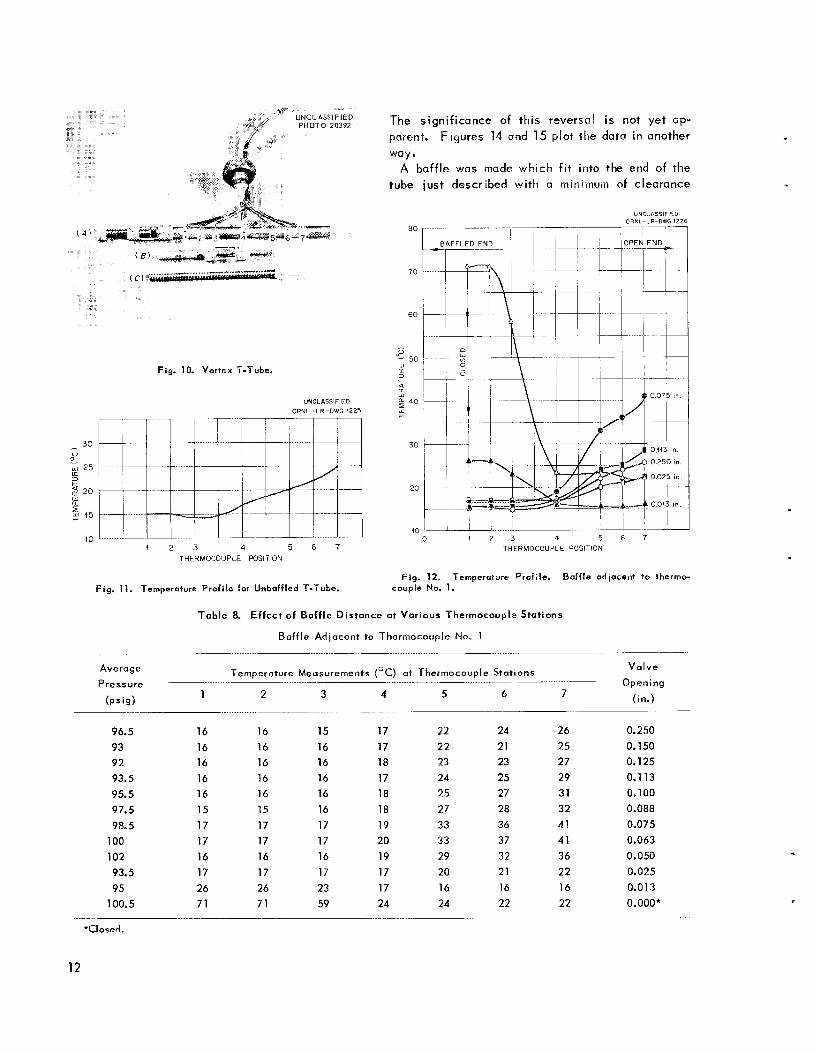
Fig. 10. Vortex T-Tube.
UNCLASSIFIED 0RNI.-LR -CWG 4225
4 2 3 4 5 6 7 THERMOCOUPLE POSITION
Fig. 11. Tempernture Profile for Unboffled T-Tube.
The signif icance of this reversal i s not yet ap- parent. Figures 14 and 15 plot the data i n another way.
A baff le was made which f i t into the end of the tube just described w i t h a minimum of clearance
UNZLASSIFIFO
8 0
70
60
- .u - 50
n: $-
(L W
$ 40
W c
30
20
Fig. 12, Temperoture Profile. Baffle odjocent to thermo- couple No. 1.
T a b l e 8. E f fec t of Baff le Distance at Various Thermocouple Stations
Baf f le Adjacent to Thermocouple No. 1
V a l v e
Opening
(in.)
........ ~
AveraSe pressure . . . . . . . . . .- . ....
Temperature Meusurements ( "C) at Thermocouple Stations
1 2 3 4 5 6 7 ....~~~~..
( p s i g ) . . . . . . . . . . . . . . . . . . . . . . .
96.5 93 92 93.5 95.5 97.5 98.5
100 102 93.5 95
1 00.5
16 16 16 16 16 15 17 17 16 17 26 71
16 16 16 16 16 15 17 17 16 17 26 71
15 16 16 16 16 16 17 17 16 17 23 59
17 17 18 17 i a 18 19 20 19 17 17 24
22 22 23 24 25 27 33 33 29 20 16 24
24 21 23 25 27 28 36 37 32 21 16 22
26 25 27 29 31 32 41 41 36 22 16 22
0.250 0.150 0.125 0.1 13 0.100
0.075 0.063 0.050 0.025 0.013 o.ooo*
0.088
*Closed.
12
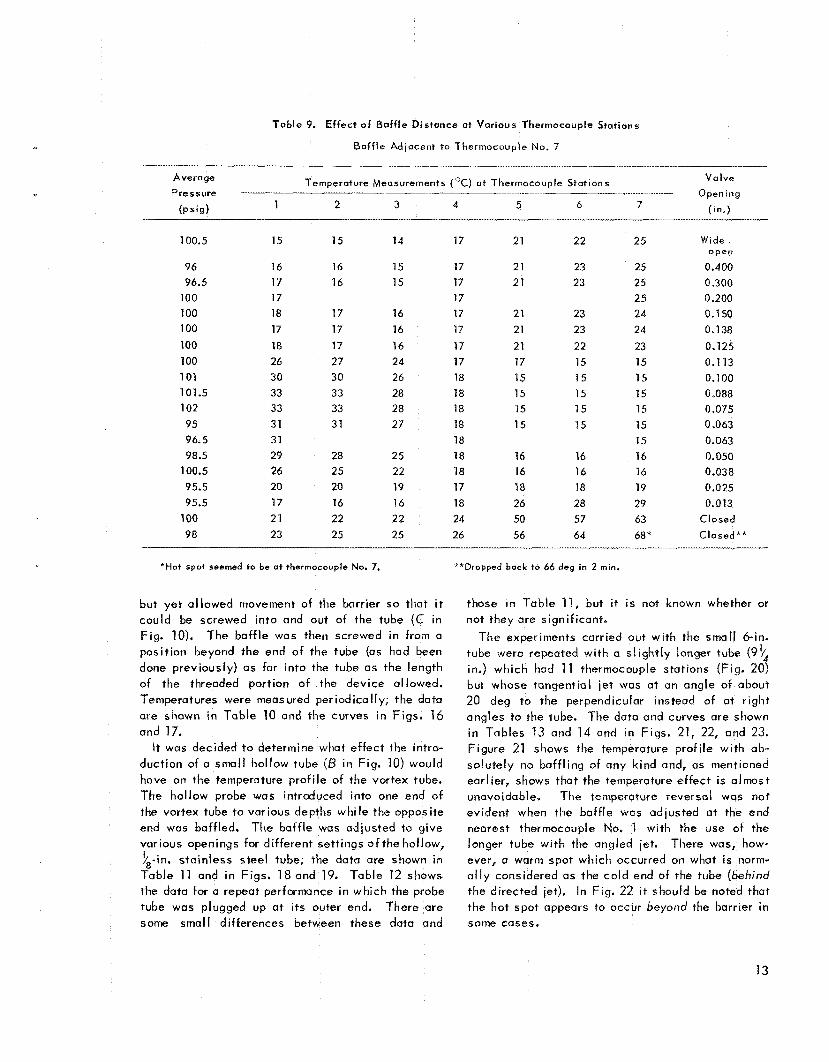
Table 9. Ef fec t of Baff le Distance at Various Thermocouple Stations
Baffle Adiacent to Thermocouple No. 7
Valve Opening
(In.)
Average Rre s sure
Temperature Measurements ("C) a t Thermocouple Stations
1 2 3 4 5 6 7 I_- - - - I
( P S l d
100.5 15 15 14 17 21 22 25 Wide open
96 16 16 15 17 2 1 23 25 0.400 96.5 17 16 15 17 21 23 25 0.300
100 17 17 25 0.200 100 18 17 16 17 21 23 24 0,150 1 00 17 17 16 17 21 23 24 0.138 100 18 17 16 17 21 22 23 0.125 100 26 27 24 17 17 15 15 0.1 13 101 30 30 26 18 15 15 15 0.100 101.5 33 33 2a i a 15 15 15 0 -088 102 33 33 2a 18 15 15 15 0.075 95 31 31 27 18 15 15 15 0.063 96.5 31 18 15 0.063 98.5 29 28 25 18 16 16 16 0.050
100s 26 25 22 18 16 16 16 0.038 95.5 20 20 19 17 18 18 19 0.025 95.5 17 16 16 18 26 28 29 0.013 100 21 22 22 24 50 57 63 Closed 98 23 25 25 26 56 64 68 * Closed**
__.....___I ___..
*Hot spot seemed t o be at thermocouple No. 7.
but yet al lowed movement of the barrier so that i t could be screwed into and out of the tube (C in Fig. 10). The baff le was then screwed in from a posit ion beyond the end o f the tube (as had been done previously) os far into the tube as the length of the threaded portion of the device allowed. Temperatures were measured periodically; the data are shown in Table 10 and the curves i n Figs. 16 and 17.
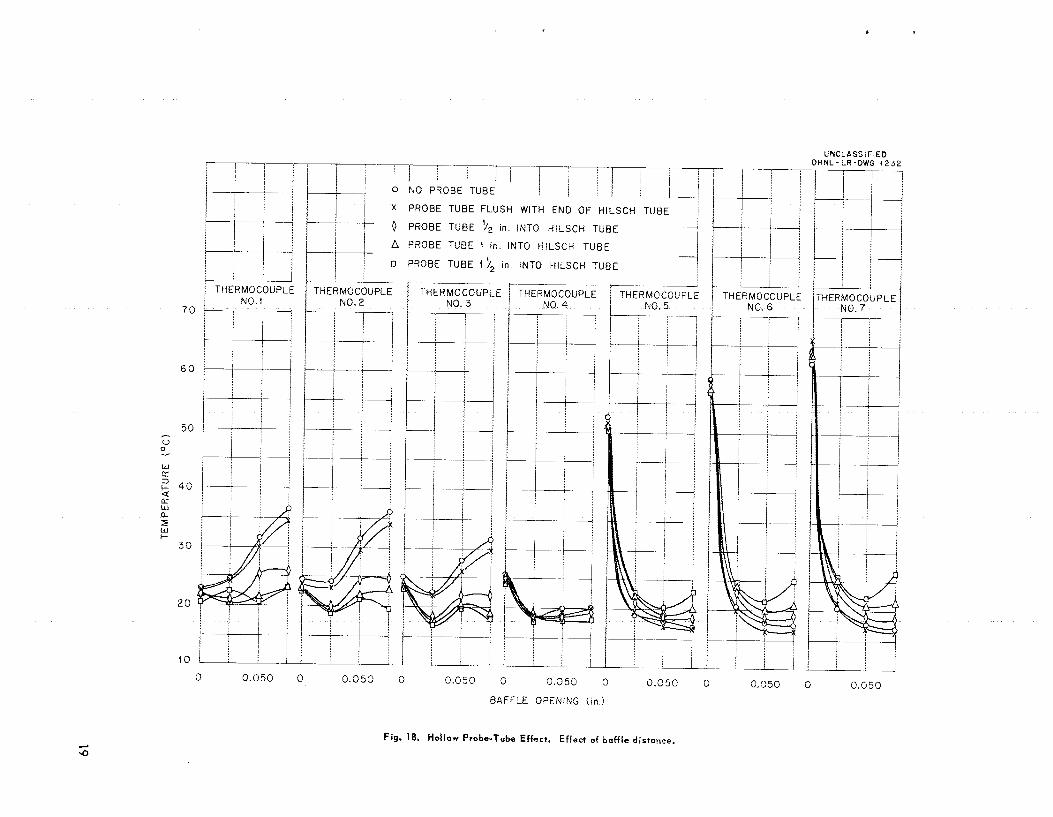
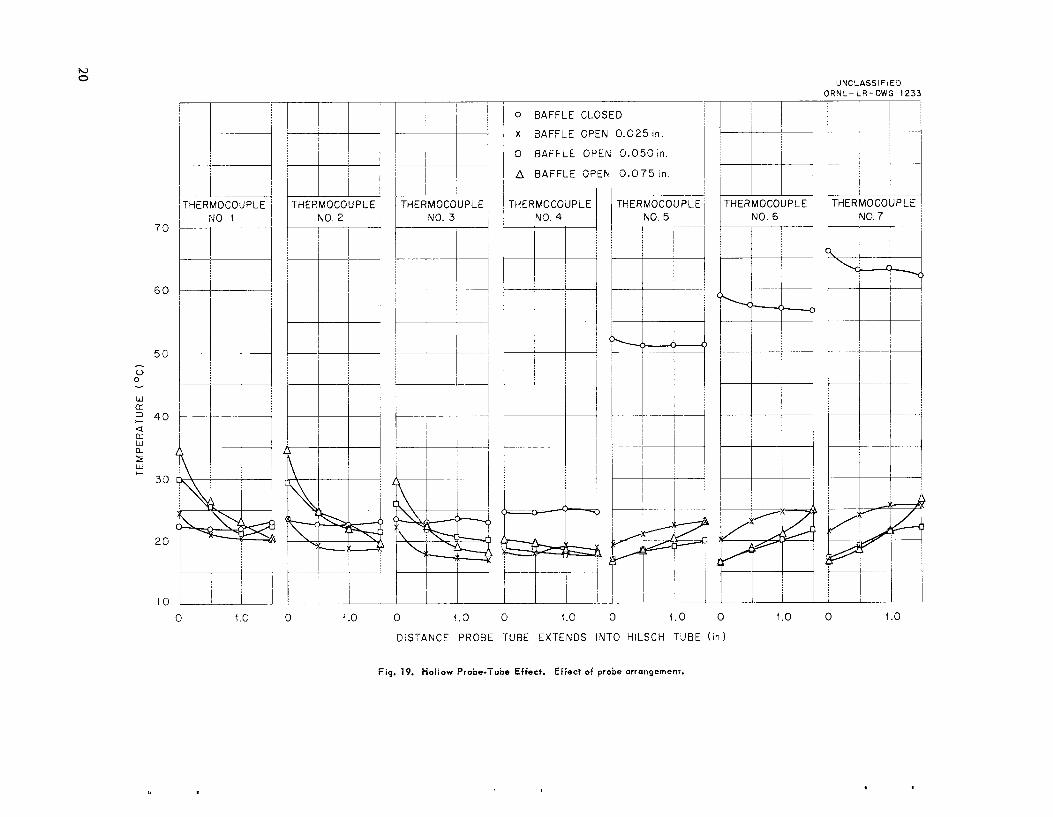
It was decided t o determine what ef fect the intro- duction of a small hollow tube (€3 in Fig. 10) would have on the temperature profi le of the vortex tube. The hollow probe was introduced into one end o f the vortex tube to various depths while the opposite end was baffled. The baff le was adjusted to give various openings for different settings o f the hollow, &-in. stainless steel tube; the data are shown in Table 1 1 and i n Figs. 18 and 19. Table 12 shows the data for CI repeat performance i n which the probe tube was plugged up a t i ts outer end. There are some small differences between these data and
**Dropped back t o 66 deg in 2 rnin.
those i n Table 11, but it i s not known whether or not they are significant.
The experiments carried out wi th the small &in. tube were repeated with a s l ight ly longer tube (9'/4 in.) which hod 1 1 thermocouple stations (Fig. 20) but whose tangential jet was at an ongle of about 20 deg to the perpendicular instead of at r ight angles to the tube, The data and curves are shown in Tables 13 and 14 and in Figs. 21, 22, and 23. Figure 21 shows the temperature profi le wi th ab- solutely no baff l ing of any kind and, as mentioned earlier, shows that the temperature effect is almost unavoidable. The temperature reversal was not evident when the baff le was adlusted a t the end nearest thermocouple No. 1 with the use of the longer tube wrth the angled jet. There was, how- ever, a warm spot which occurred on what is norm- a l l y considered as the cold end of the tube (behind
the directed let). In Fig. 22 i t should be noted that the hot spot appears to occur beyond the barrier i n some cases.
13
6 5
60
5 5
5c
4 5 - Y ._ ill 5 40
a
a
L.
cr w 2 3 5 L l J e-
30
2 5
20
15
I
I
CLOSED in ? 0 0425 n OPEN 0 0 0 2 5 in O P E k 0 0 0 5 0 in OPEN A 0 0 1 5 - i n OPFhl x 0.400-in O P E N 0 0 150 P O P E N
O P E N END
UNCLASSIFI t D O R N L - L R - D W G 12
~
1- BAFFLED END
I /
( 2 3 a 5 6 7
THERMOCOUPLE POSITION
Fig. 13. Temperature Profile. Baffle odjacen? t o thermo- couple No. 7.
Addit ional tubes were prepared from polystyrene, Lucite, and glass. The diameter of the polystyrene tubes was about the same ( t6 in.) as that of the sinal I stainless steel tubes; their appreciable softening and sagging short ly after startup was a dist inct disadvantage, [It was quite interesting to note that w i th a directed jet, the cold end could be changed in length to give (1) air blown out and (2) air sucked in. Presumably a t some cr i t i ca l length, nothing would happen,] The Luc i te and glass tubes (Fig. 24), however, were of about 1 t - in.- ID material and were quite satisfactory, especial ly since measurements could be made a t the same time that the tubes were inspected visual ly. Only Q few temperature measurements were made with the larger tubes; most of the work involved meas- urements o f pressure variations in the tubes. Table 15 and Fig. 25 show some of the temperaturedata.
It was noted w i th one particular baffle arrangement that the measured hot-end temperature was 94°C and that the cold-end temperature was -6°C. (The co1 $-end tempernture seems to be somewhat de- pendent upon the humidity of the air, since the heat evolved in condensing or freezing moisture may be considerable. The moisture may also affect the analyt ical results.) The valve a t the end of the tube away from tl-ie jet was an adiustable beveled screw.
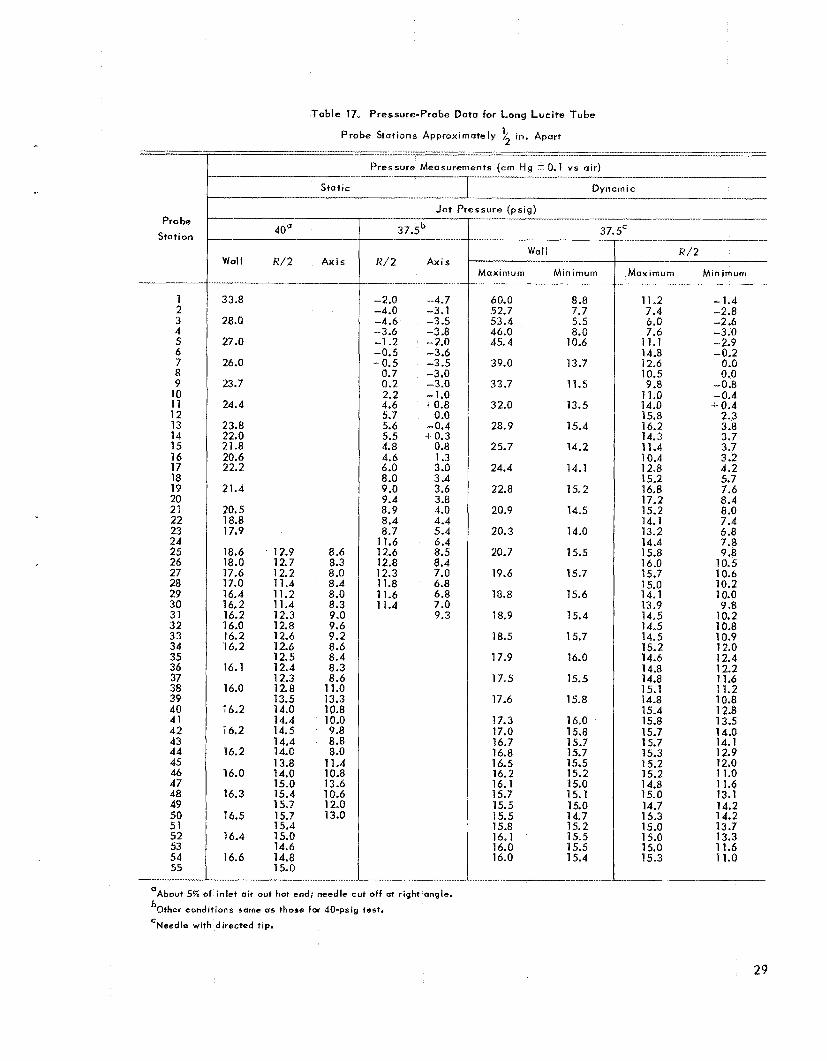
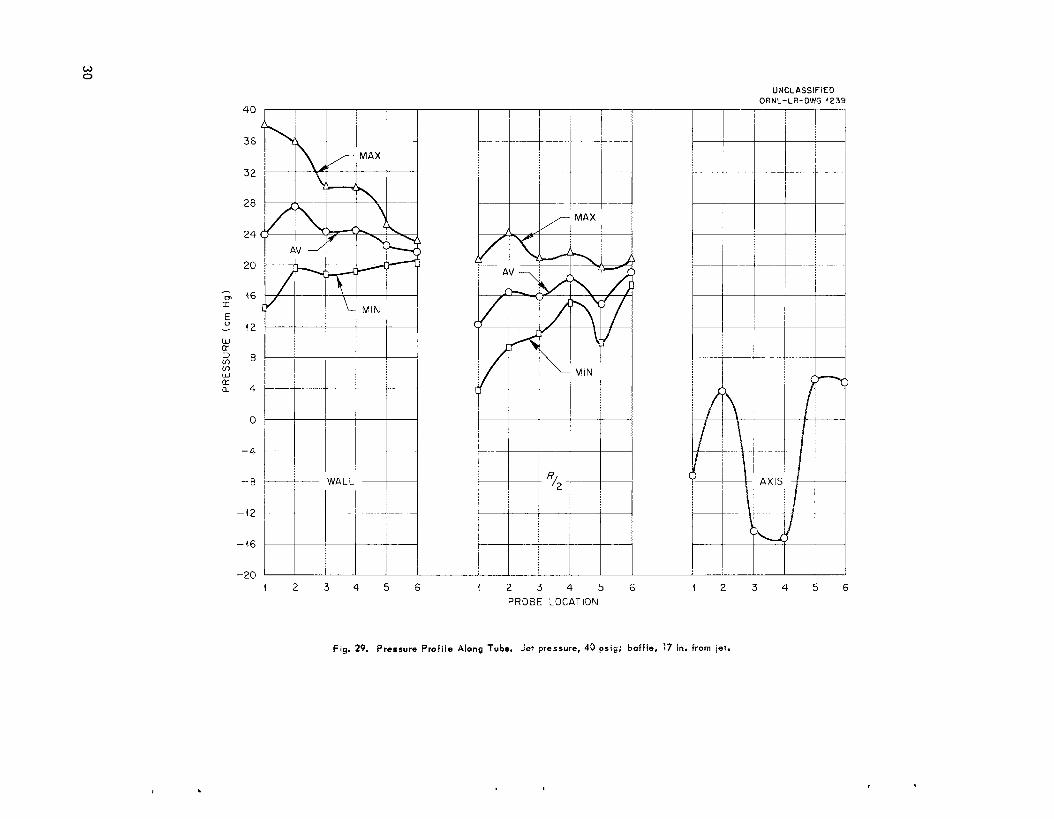
Pressure Measurements. In addit ion to the work wi th temperatures, a number of measurements of pressures w i th in h e tubes were made. Probe holes were dr i l led into the sides of the tubes at regular intervals along the walls, and hypodermic needles were inserted to ohtoin values for stat ic head and ve/ocity heod a t various locations. (In making probe measurements, it was found that at some particular locations the intraduction of the hypo- dermic needle upset the tube, apparently changing the operating condi t iors appreciably.) Figure 26 shows one of the Luc i te tubes w i th the probe holes plugged with toothpicks, and Fig. 27 shows the hypodermic needles used for the pressure ineosure- ments. The needles were c ~ i - ~ n i ~ t e d by a rubber tube i o a mercury iiianometsr, and readings were taken under equi l ibr ium conditions. Table 16 and Figs. 28, 29, and 30 and ‘Table 17 and Figs. 31, 32, and 33 show some of the data. It should be ex- plained that for the earl ier measurements (Toble 16, Figs. 28-30) stat ic pressures were assumed, as a f i rst approximation, to he the average of the maxi- mum arid minimum readings, and the veloci ty head to be equal to OnG-haIf the difference between the maximum and minimum readings (maximum = needle facing upstream; minimum = needle facing down- stream). Later on, the needle cut o f f a t r ight angles was used to measure stat ic pressures (Table 17, Figs. 31-33). Actually, probably neither i s quite correct because of the vector components introduced by the vortex action,
Visual Oboervntians. A number of experiments were performed which were intended to give some idea of the f low patterns wi th in the tube. The copper tube, shawn in Fig. 34, used to obtain the original samples for mass analysis was sawed lengthwise down the center. The str iat ions are a resul t of the deposit of o i l and d i r t from the com- pressed-air l ine over a period of time. Their uni- forinity suggests that for normal operation (where
14
400
80
oG 60 - w Lz 3 i-
40 a 5 W 1-
20
0
400
80
- BO e 'A CC 3 c
2 10 a 5 +-
20
0
-20
0.400 0.q 50 0.200 0.050
BAFFLE OPENING hn.) 0250
Fig. 14. Temperature vs Baff le Opening. Baffle adiacent t o thermocouple No. 1.
UNCLCSIIFIED
15
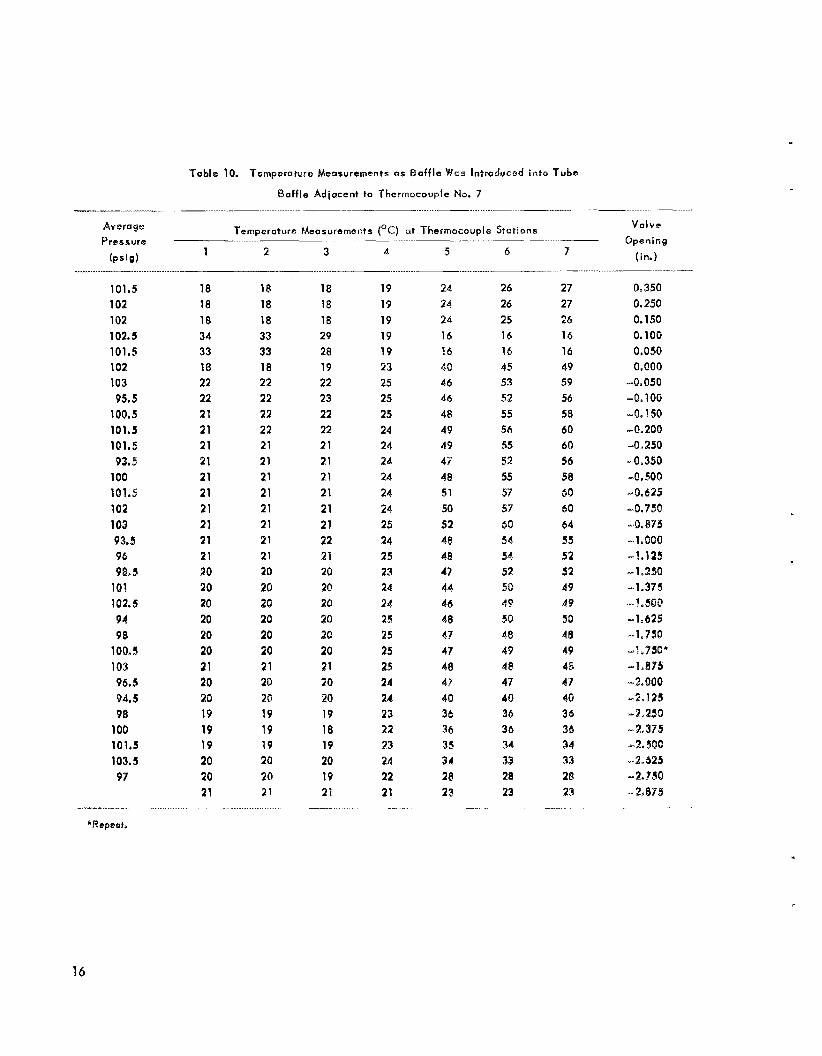
Table 10. Tompcratuae Measurements as Baffle Was Introduced into Tube
Baf f le Adiacent to Thermocouple No. 7
Avoragc Temperature bAeasurerncnts (OC) at Thermocouple SfCItiQnS
101.5 102 102 102.5 101.5 102 103 95.5
100.5 101.5 101.5 93.5
100 101.5 10% 1 Q3 93.5 96 98. s
191 102,s 94 98
100,s 103 96.5
94.5 98
100 101.5 103.5 97
18 18 18 34 33 18 22 22 21 21 21 21 21 21 21 21 21 21 20 20 20 20 20 20 21 20 20 19 19 19 20 20 21 ..-..
18 18 18 33 33 18 22 22 22 22 21 21 21 21 21 21 21 21 20 20 2Q 20 20 20 21 20 20 19 19 19 20 29 2 1 . ...
18 10 18 29 28 19 22 23 22 22 21 21 21 21 21 21 22 21 20 28 20 20 28 20 21 20 20 19 18 19 20 19 21
4 ___ .......
19 19 19 19 19 23 25 25 25 24 24 24 24 24 24 25 24 25 23 24 24 25 as 25 as 24 24 23 22 23 24 22 21
5 5 7
24 24 24 16 16 4Q 46 44 48 49 49 47 48 51 50
52 48 48 47 44 46 48 47 47 48 47 40 34 16 35 34 2e 23 -
26 26 25 16 16 45 53 52 55 56 55 52 55 137 57 50 54 54 52 50 49 50 4% 49
47 40 35 36 34 33 28 23
de
27 27 26 14 16 49 59 56 58 60 60 56 58 69
64 55 a2 52 48 49 50 48 49
48 47 40 3Q 36 34 33 28 28
Qa
__
Valve Opening
(in.)
0,350 0.250 0.150 0.100 0.059 9.000
-9.050 -a, 100 -0.150 -0.200 - 0 a 250 -8.350 -0,500 -0,625 -0.750 -9.875
-1,125 -1,290 -8.375 -.. 1 .SOB -1,525 -1,750
-1,875 -2.ooo - 2 s 125 -2.250 -2.375 -2.9QB - 2.625 -2.750 .-2.875
-1m0
.- I ,?sa*
16
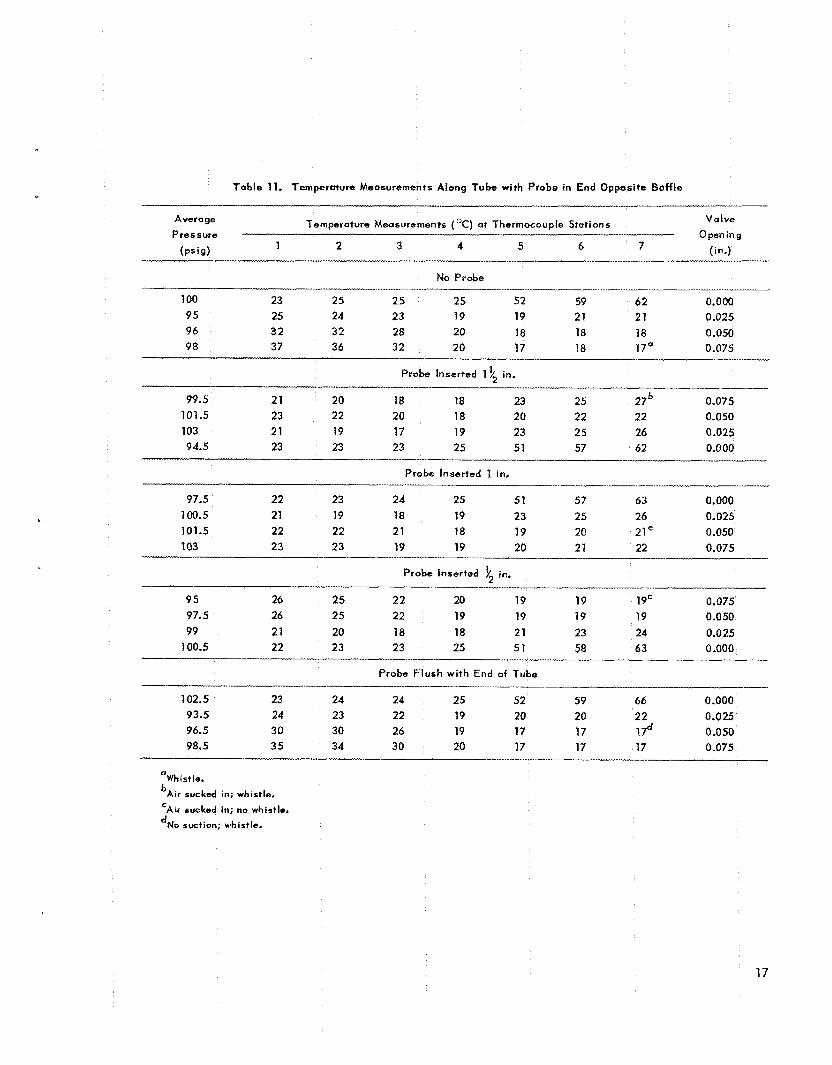
Table 11. Temperature Measurements Along Tube with Probe in End Opposite Baffle
V a l v e
0 pen in g Temperature Measurements (OC) a i Thermocouple Stations Average
Pres sure .- ( F i g ) 5 6 7 (in,) 1 2 3 4
No Probe
100 23 25 25 25 52 59 62 0.000 9s 25 24 23 19 19 21 21 0.025 96 32 32 28 20 18 18 18 0.050
0.075 98 37 36 32 20 17 18 17" -_I_
Probe Inserted 1% in.
99.5 21 20 18 18 23 25 27b 0.075 101.5 23 22 20 18 20 22 22 0.050 103 21 19 17 19 23 25 26 0.025 9d.5 23 23 23 25 51 57 62 0.000
Probe Inserted 1 in,
97.5 22 23 24 25 51 57 63 0.000 100.5 21 19 18 19 23 25 26 0.025 101.5 22 22 21 18 19 20 21 0.050 103 23 23 19 19 20 21 22 0.075
.-
-- - I
- - Probe Inserted ?' 2 In*
95 26 25 22 -20 19 19 19' 0.075 97.5 26 25 22 19 19 19 19 0.050 99 21 20 I8 18 21 23 24 0.025
100.5 22 23 23 25 51 58 63 0.000
Probe Flush with End of Tube
102.5 23 24 24 25 52 59 66 0.000 93.5 24 23 22 19 20 20 22 0.025
98.5 35 34 30 20 17 17 17 0.075
-_
96.5 30 30 26 19 17 17 1 7d 0 .o 50
OWhistle. bAir sucked in; whistle.
CAir sucked in; no whistle.
dNo auction; whistle.
17
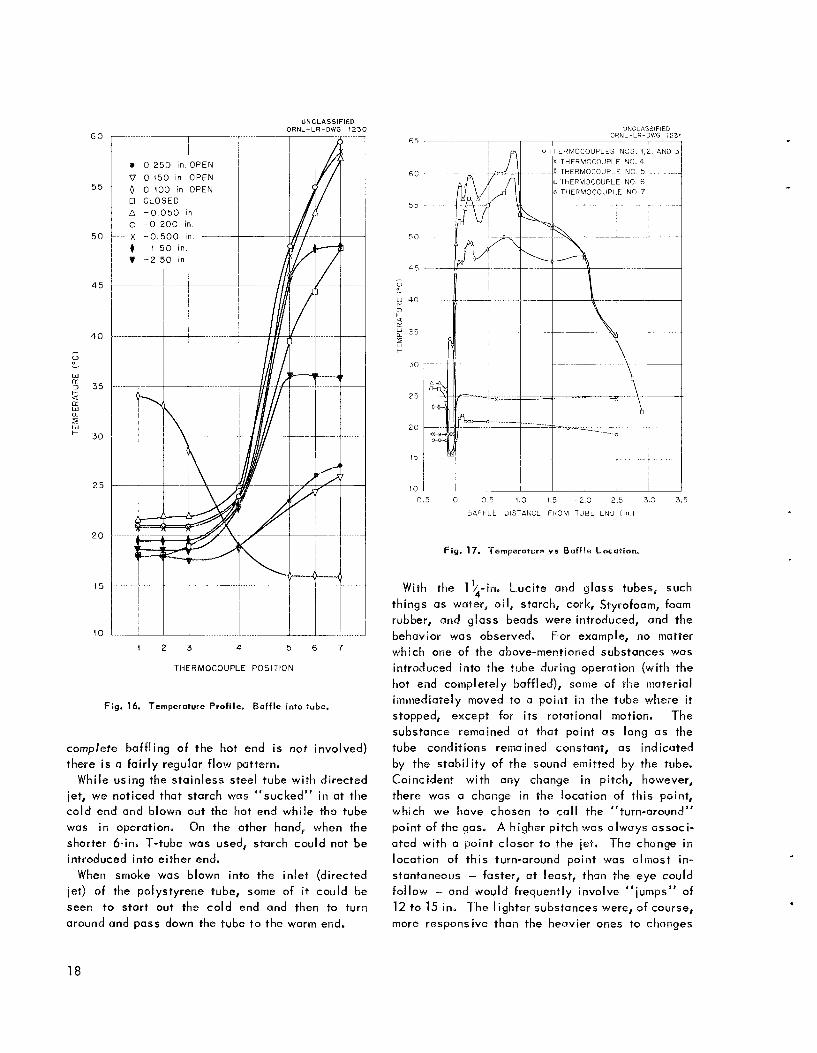
UNCLASSIFIED ORNL-LR-DWG 1230
60
55
50
4 5
40
I
u - W K 3 3 5 t- a K W a z w
30
2 5
2 0
15
70
( 2 3 4 5 6 7
THERMOCOUPLE POSITION
Fig. 16. Temperature Profile. Baffle into tubc.
complete baff l ing of the hot end i s not involved) there i s a fa i r ly regular f low pattern.
While using the stainless steel tube with directed jet, we noticed that starch was “sucked” i n at the co ld end and blown out the hot end while the tube was in operation. On the other hand, when the shorter &in. T-tube was used, starch could not be introduced into either end.
When smoke was blown into the in let (directed jet) of the polystyrene tube, some of it could be seen to start out the co ld end and then to turn around and pass down the tube to the warm end,
UhCLASblFlEU ORNL LR-ULLG 123t
tRMOC0UPLES NOS l , 2 , A N THERMOCOJPLE NC 4
6 C Tt‘ERMOCOUPLF NO 5 THERMOCOUPLE NO 6 THER‘rl3COUPLE NO 7
5 5
50
4 5 I
u
LII 40 3
U K
3 5 z
, 0 . 5 0 -0 .5 -1.C -1.5 -2.0 -2.5 -3.0 -3.5
B4FFLE DISTAkCE FROM TUBE E N 0 [ i n 1
Fig. 17. Ternperoture v s Baf f le Location.
With the l b - i n e huc i te and glass tubes, such things as water, oil, starch, cork, Styrofoam, foam rubber, arid glass beads were introduced, and the behavior was observed, For example, no matter which one of the above-mentioned substances was introduced into the tube during operation (with the hot end completely baffled), some of the material immediately moved to a point i n the tube where it stopped, except for i t s rotational motion. The substance remained at that point as long as the tube conditions remained constant, as indicated by the stabi l i ty of the sound emitted by the tube, Coincident wi th any change in pitch, however, there was a change in the location of th is point, which we have chosen to ca l l the “turn-around” point of the qas. A higher p i tch was always associ- ated with a point closer ta the iet, The change i n location of th is turn-around point was almost in- stantaneous - faster, a t least, than the eye could fo l low - and would frequently involve “jumps” of 12 to 15 in. The lighter substances were, of coursel more responsive than the heavier ones to changes
18
c
0 c, W ar 3
+-
TPERMOCOUPLE NO. 3
-IT--- i
i
1
* 0 NO PROBE TUBE
X PROBE TUBE FLUSH WITH END OF HILSCH TUBE i
i PROBE TUBE 4, in. INTO HILSCH TUBE
PROBE TUBE f > 2 in. INTO HILSCH TUBE
A PROBE TUBE 1 i n . INTO HILSCH TUBE
UNCLASSIFIED ORNL-LR-DWG i 2 3 2
/&/--i 1 1 : :
. -
THERMOCOUPLE NO 7 1
r -1
I -.
0.050 0 0.050 0 0.050 0 0.050 0 0.050 0 0.050 0 0.050 0
BAFFLE OPENlNG (In)
Fig. 18. Hollow Probe-Tube Effect. Effect of baffle dirtonce.
20
3
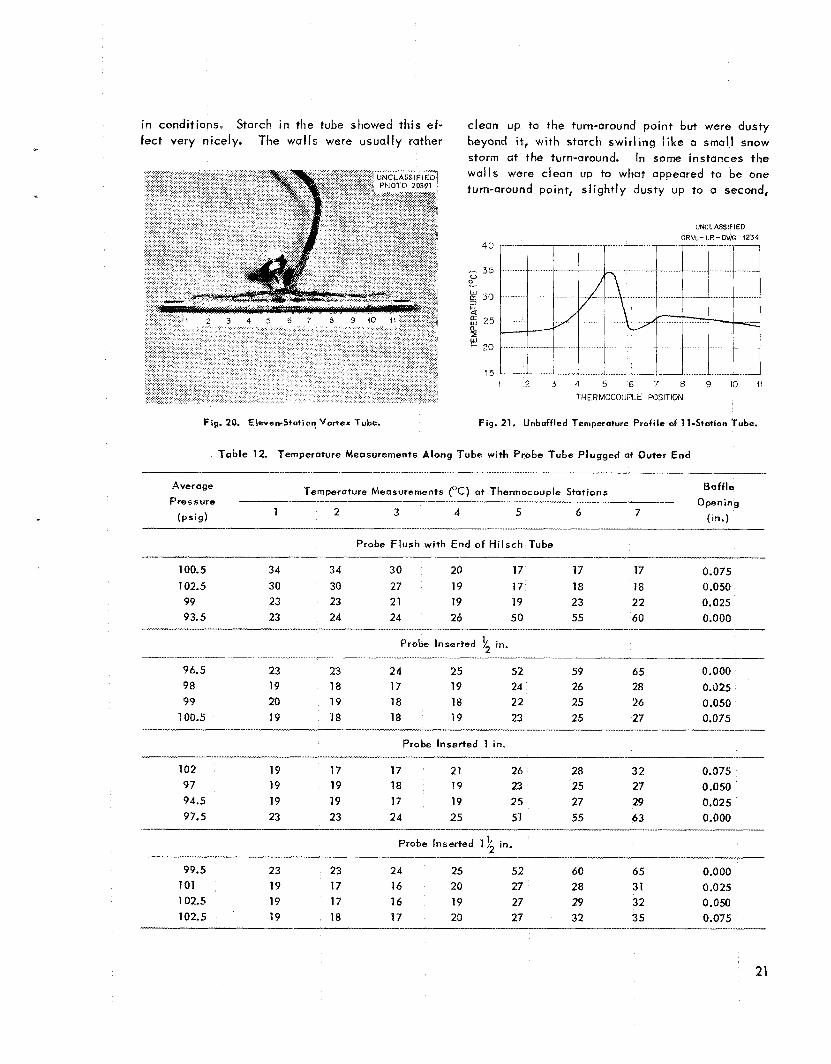
in conditions, Starch i n the tube showed this ef- fect very nicely. The walls were usually rather
clean up to the turn-around point but were dusty beyond it, with starch swir l ing like a small snow storm at the turn-around. In some instances the wal ls were clean up to what appeared to be one turn-around point, s l ight ly dusty up to a second,
UNCLASSIFIED ORNL- LR- CWG 1234
40
.-. 35 0, 0
g 30 c a f= 25 a I
20
15 1 7 3 4 5 6 7 8 9 1 0 1 1
THERMOCOLJPLE POSITION
Fig. 20. ElevenStot ion Vortex Tube. Fig . 21, Unboffled Temperature Profile of 1 I-Station Tube.
T a b l e 12. Temperature Measurements Along Tube with Probe Tube Plugged at Outer End _. _._.I - _...
Baff le Temperature Measurements ("C) at Thermocouple Stations Average
Pres sure -- Opening 1 2 3 4 5 6 7
Probe Flush with End of Hilsch Tube
1 00.5 34 34 30 20 17 17 17 0.075 102.5 30 30 27 19 17 18 18 0.050 99 23 23 21 19 19 23 22 0.025 93.5 23 24 24 26 50 55 60 0.000
(in.) -- . __ -. _______ ( P S l d
I --
Probe Inserted ?' in. - ll_____l___
2 I_._ - - -__ - _-_
96.5 23 23 24 25 52 59 65 0.000 98 19 18 17 19 24 26 28 0.025 99 20 19 18 18 22 25 26 0.050
100.5 19 18 18 19 23 25 27 0.075
Probe Inserted 1 in.
102 19 17 17 21 26 28 32 0.075 97 19 19 18 19 23 25 27 0.050 94.5 19 19 17 19 25 27 29 0.025 97.5 23 23 24 25 51 55 63 0.000
Probe Inserted 1) in. 2
99.5 23 23 24 25 52 60 65 0.000
102.5 19 17 16 19 27 29 32 0.050 101 19 17 16 20 27 28 31 0.025
102.5 19 18 17 20 27 32 35 0.075
21
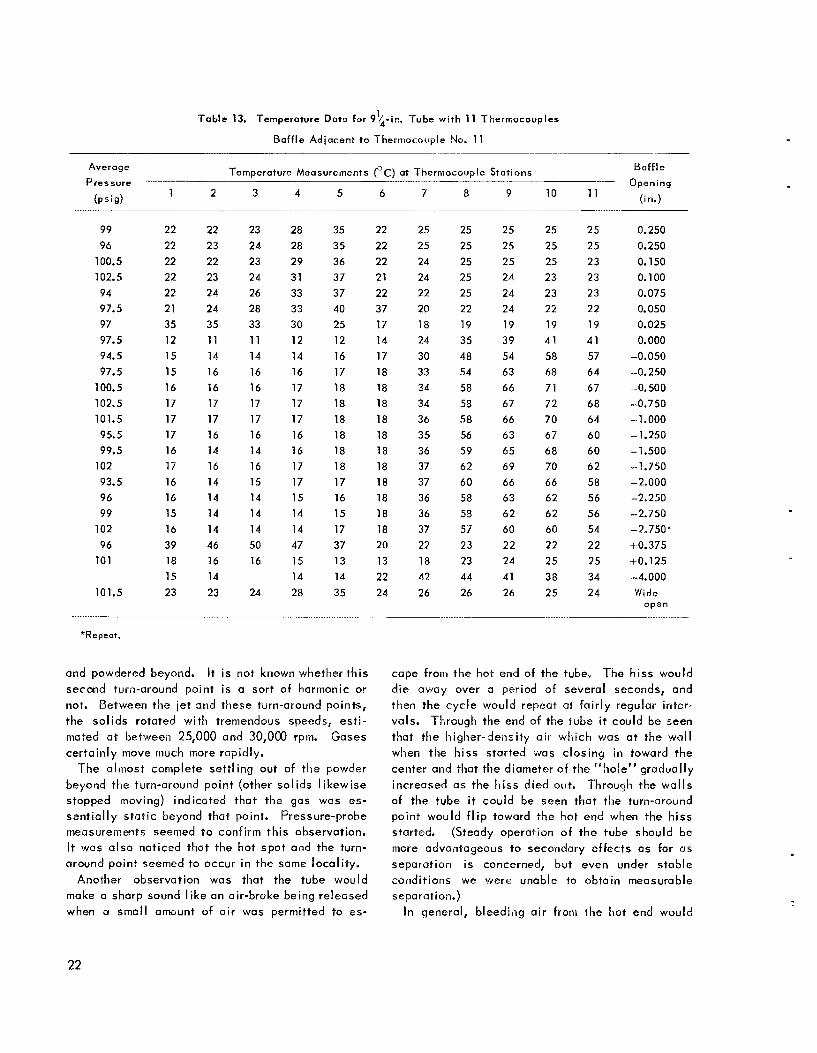
T a b l e 13. Temperature Doto for 9!4-in. Tube wi th 11 Thermocouples
Baffle Adjacent to Thermocouple No. 11
Baffle Opening
Temperature Measurements (OC) at Thermocouple Stations Average
Psessure .. (in.) I I 1 2
b i g ) 3 4 5 6 7 8 9 10
99 22 96 22
100.5 22 102.5 22 94 22 97.5 21 97 35 97.5 12 94.5 15 97.5 15
100.5 16 102.5 17 101.5 17 95.5 17 99.5 16
102 17 93.5 16 96 16 99 15
102 16 96 39
101 18 15
101.5 23
22 23 22 23 24 24 35 11 14 16 16 17 17 16 14 16 14 14 14 14 46 16 14 23
23 2.4 23 24 26 28 33 11 14 16 16 17 17 16 14 16 15 14 14 14 50 16
24
28 28 29 31 33 33 30 12 14 16 17 17 17 16 16 17 17 15 14 14 47 15 14 28
35 35 36 37 37 40 25 12 16 17 18 18 18 18 18 18 17 16 15 17 37 13 14 35
22 22 22 21 22 37 17 14 17 18 18 18 18 18 18 18 18 18 18 18 20 13 22 24
25 25 24 24 22 20 18 24 30 33 34 34 36 35 36 37 37 36 36 37 22 18 42 26
25 25 25 25 25 22 19 35 48 54 58 55 58 56 59 62 60 58 58 57 23 23 44 26
25 25 25 24 24 24 19 39 54 63 66 67 66 63 65 69 66 63 62 60 22 24 41 26
25 25 25 23 23 22 19 41 58 68
71 72 70 67 68 70 66 62 62 60 22 25 38 25
25 2 5 23 23 23 22 19 41 57 64 67 68 64 60 60 62 58 56 56 54 22 25 34 24
0.250 0.250 0.150 0.100 0.075 0.050 0.025 0.000
-0.050 -0.250 -0.500 -0.750 -- 1 * 000 -1.250 - 1.500 -1.750 -2,000 -2.250 -2.750 -2.750* t 0.375 +O. 125 -4.000 Wide
open
‘Repeat.
and powdered beyond. It is not known whether th is second turn-around point is a sort of harmonic or not. Between the jet and these turn-around points, the sol ids rotated with tremendous speeds, est i - mated a t between 25,000 and 30,000 rpm. Gases certainly move much more rapidly.
The almost complete sett l ing out of the powder beyond the turn-around point (other sol ids I ikewise stopped moving) indicated that the gas was es- sent ia l ly stat ic beyond that point. Pressure-probe measurements seemed to confirm this observation. It was also noticed that the hot spot and the turn- around point seemed to occur i n the same local i ty.
Another observation was that the tube would make a sharp sound l i ke an air-brake being released when a small amount of air was permitted to es-
cape from the hot end of the tube, The hiss would die away over 0 period o f several seconds, and then the cycle would repeat at fa i r ly regular inter- vals. Through the end of the tube it could be seen that the higher-density air which was a t the wal l when the h i s s started was closing i n toward the center and that the diameter of the “hole” gradually increased as the hiss died out. Through the w o l l s of the tube it could be seen that the turn-around point would f l i p toward the hat end when the hiss started. (Steady operation of the tube should be more advantageous to secondary effects as far as separation is concerned, but even under stable conditions we were unable to obtain measurable separation.)
In general, bleeding air from the hot end would
22
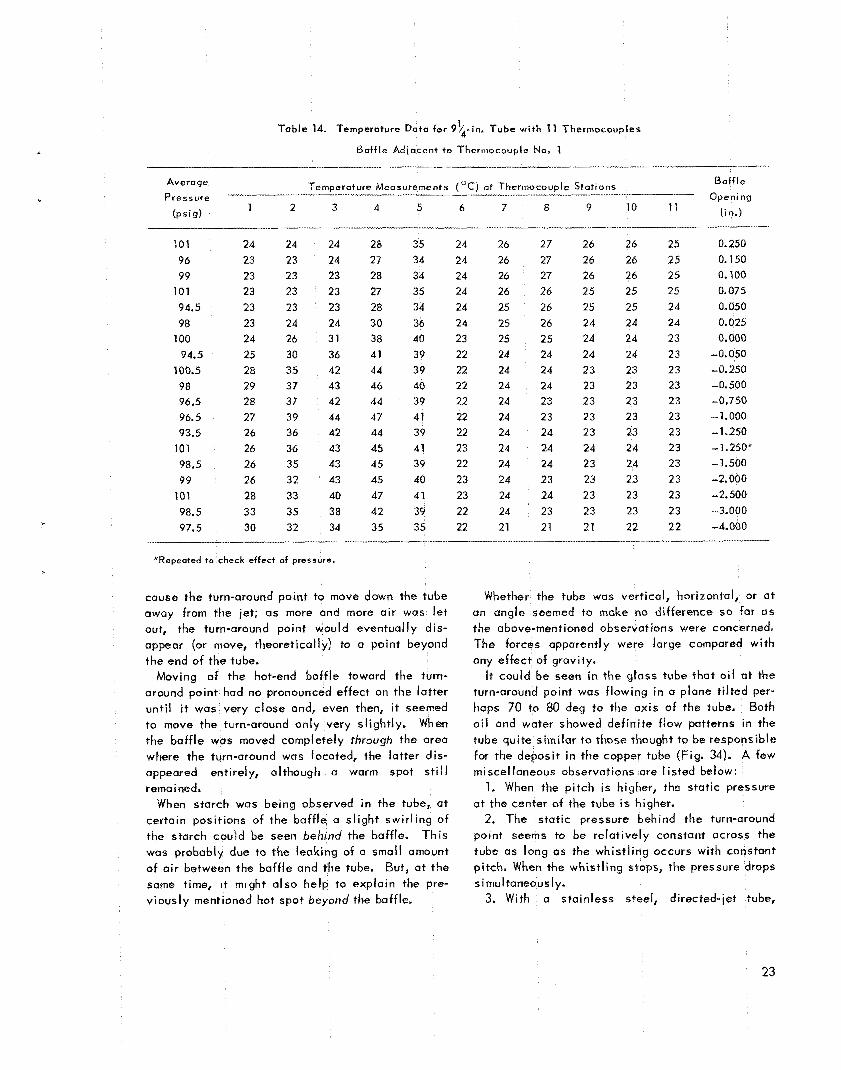
Table 14. Temperature Data for 9 4 - i n . 1 Tube wi th 11 Thermocouples
Baftle Adjaccnt to Thermocouple Noa 1
Baff le
Opening _-_- Average Pressure
(psig)
101 24 24 24 2s 35 24 26 27 26 26 25 0.250 96 23 23 24 27 34 24 26 27 26 26 25 0.150 99 23 23 23 28 34 24 26 27 26 26 25 0.100 101 23 23 23 27 35 24 26 26 25 25 25 0.075 94.5 23 23 23 28 34 24 25 26 25 25 24 0.050 98 23 24 24 30 36 24 25 26 24 24 24 0.025 100 24 26 31 38 40 23 25 25 24 24 23 0.000
Temperature Measurements ("C) a i Thermocouple Stations
10 11 (In.) 1 2 3 4 5 6 7 a 9
.- -. .- _____II _.___ - -
94.5 25 30 36 41 39 22 24 24 24 24 23 -0.050 100.5 2a 35 42 44 39 22 24 24 23 23 23 -0.250 98 29 37 43 46 40 22 24 24 23 23 23 -0.500 96.5 28 37 42 44 39 22 24 23 23 23 23 -0.750 96.5 27 39 44 47 41 22 24 23 23 23 23 -1.000 93.5 26 36 42 44 39 22 24 24 23 23 23 -1.250 101 26 36 43 45 41 23 24 24 24 24 23 -1.250* 98.5 26 35 43 45 39 22 24 24 23 24 23 -1.500 99 26 32 43 45 40 23 24 23 23 23 23 -2.000 101 28 33 40 47 41 23 24 24 23 23 23 -2.500 98.5 33 35 38 42 39 22 24 23 23 23 23 -3.000
22 22 -4.000 97.5 30 32 34 35 35 22 21 21 21 ________-.. -.I___ I__- __-__I_--- --_-II_
*Repeated to check effect of pressure.
cause the turn-around point to move down the tube away from the jet; as more and more air was l e t out, the turn-around point would eventually dis- appear (or move, theoretically) to a point beyond the end of the tube.
Moving of the hot-end baff le toward the turn- around point had no pronounced effect on the latter unt i l i t was very close and, even then, it seemed to move the turn-around only very slightly. When the baff le was moved completely through the area where the turn-around was located, the latter dis- appeared entirely, although a warm spot s t i l l rema insd.
When starch was being observed in the tube, at certain positions of the baff le Q sl ight swir l ing of the starch coujd be seen behind the baffle. Th is was probably due to the leaking of a small amount of a i r between the baff le and the tube. But, a t the same time, it might a lso help to explain the pre- v ious ly mentioned hot spot beyond the baffle.
Whether the tube was vertical, horizontal, or a t an angle seemed to make no difference so far as the above-mentioned observations were concerned, The forces apparently were large compared with any effect of gravity.
It could be seen i n the glass tube that o i l a t the turn-around point was f lowing i n a plane t i l ted per- haps 70 to 80 deg to the axis of the tube. Both o i l and water showed definite flow patterns in the tube quite similar to those thought to be responsible for the deposit in the copper tube (Fig. 34). A few miscellaneous observations are I isted below:
1. When the p i tch is higher, the static pressure at the canter of the tube i s higher.
2. The stat ic pressure behind the turn-around point seems to be relat ively constant across the tube as long as the whist l ing occurs with constant pitch. When the whist l ing stops, the pressure drops s i mul taneous I y.
3. With a stainless steel, directed-iet tube,
23
70
60
50
- 0:
40 3 + n w a z
30
20
40
0 0 2 3 4 5 6 7 8 9 10 1 4 12
THERMOCOUPLE LOCATION
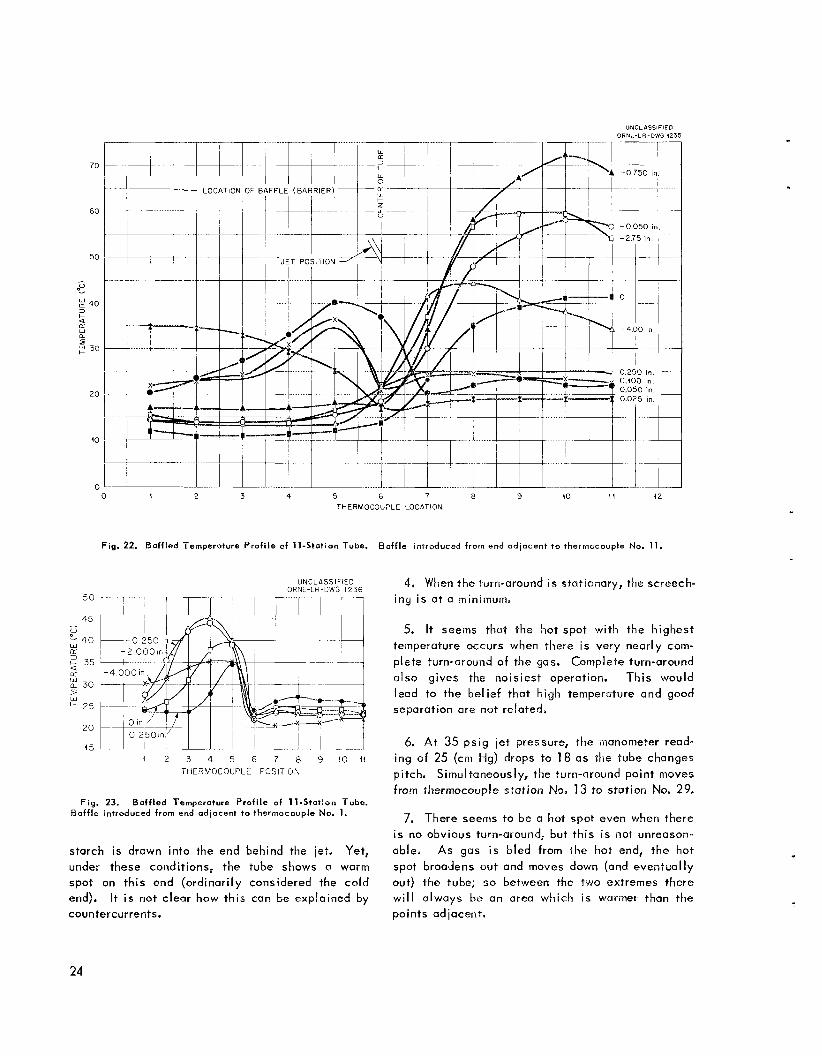
Fig. 22. Baffled Ternperoture Profile of 11-Station Tube.
UNCLASS lFiE0 ORNL-LFI DWG 1236
( 2 3 4 5 6 7 8 9 1 0 1 1 THERMOCOUPLE POSITION
Fig. 23. Baffled Temperature Profile of 11-Station Tube. Baffle introduced from end adjacent to thermocouple No. 1.
starch is drawn into the end behind the jet, Yet, under these conditions, the tube shows a warm spot on th is end (ordinarily considered the co ld end). It i s not clear how this can De explained by
Baffle introduced from end adjacent to thermocouple No. 11.
4. When the turn-around i s stationary, the screech- ing i s a t a minimum,
5. It seems that the hot spot wi th the highest temperature occurs when there i s very nearly com- plete turn-around of the gas. Complete turn-around also gives the noisiest operation. Th is would lead to the bel ief that high temperature and good separation are not related,
6. A t 35 ps ig jet pressure, the manometer read- ing of 25 (cm Hg) drops to 18 as the tube changes pitch. Simultaneously, the turn-around point iiioves from thermocouple stat ion No, 13 to station No. 29.
7. There seerris to be a hot spot even when there is no obvious turn-around, but th is i s not unreason- able. As gas i s bled from the hot end, the hot spot broadens out and moves down (and eventually out) the tube; so between the two extremes there w i l l always be an area which i s warmei- than the
countercurrents. points adiacent.
24
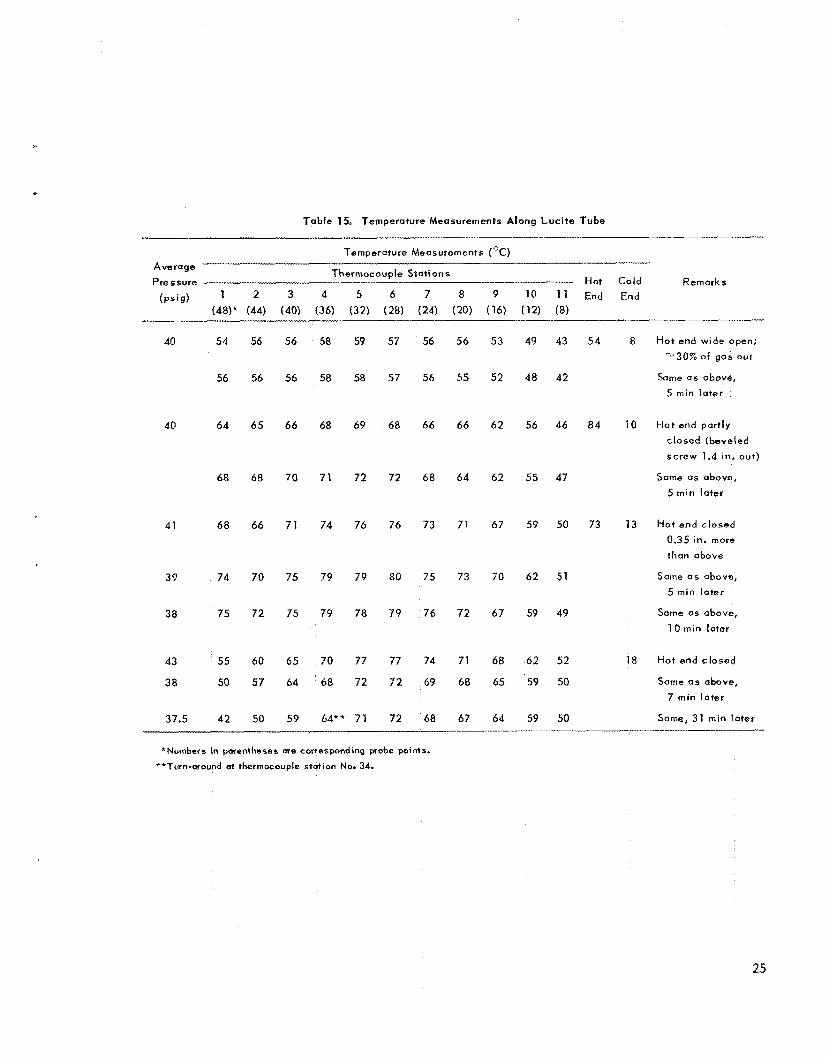
T a b l e 15. Temperature Measurements A long L u c i t e Tube
40
40
41
39
38
43
38
37.5
54
56
64
68
68
74
75
55
50
42
56
56
65
68
66
70
72
60
57
50
56
56
66
70
71
75
75
65
64
59
58
58
68
71
74
a9
79
70
68
59
58
69
72
76
79
78
77
72
64** 7'1
57
57
68
72
76
80
79
77
72
72
56
56
66
6%
73
75
76
74
69
68
56
55
66
64
71
73
72
71
68
67
53
52
62
62
67
70
67
68
65
64
49 43
48 42
56 46
55 47
59 50
62 51
59 49
62 52
59 50
59 50
54 8 Hot end wide open; "-30% of gas out
Some as above,
5 min la te r
84 10 H o t end por t l y
c losed (beveled
screw 1.4 in. out)
Same as above, 5 m i n la te r
73 13 H o t e n d c losed 0.35 in. more
than above
Same a s above, 5 min la te r
Same os above,
ID min later
18 Hot end c losed
Same a s above,
7 min la te r
Same, 31 min l a te r
*Numbers in parentheses are c a r e s p o n d i n g probe points.
**Turn-around at thermocouple station No. 34.
25
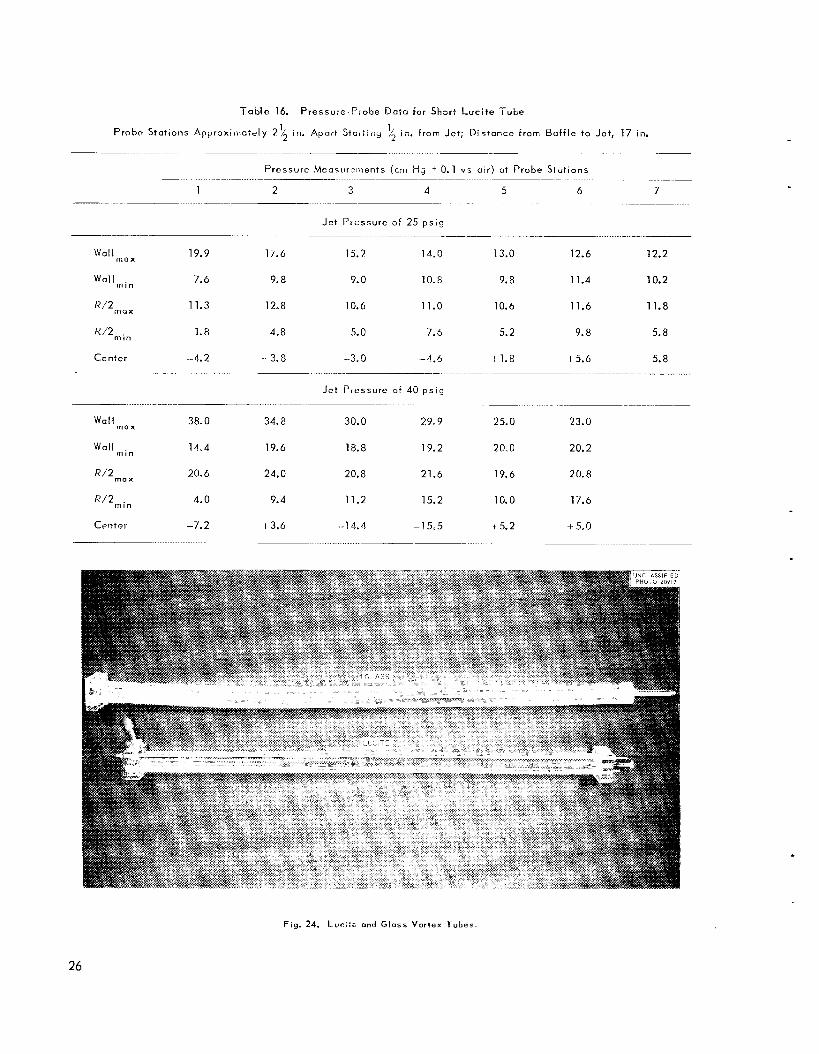
T a b l e 16. Pressure-PioLe D o i o for Shop; huc l te T u b e
Probr Stations Approximately 7 % In. Apoi: Sta,t ,ng /2 ~ n . from Jet, Di - tance from Baff le t o Jet, 17 In. 1
~- -
Pressure Measur-ments (cm H j 0.1 v s atr) at Probe Statlons
1 2 3 4 5 6 7
Jet Piossure ~t 25 p s i g
Wo‘lrnax
Wallmin
K/2,ClX
R’2min
Center
19.9 l i .6
7.6 9.8
11.3 12.8
1.8 4.8
-4.2 -1 3.8
15.7 1 A.O 13.0 12.6 12.2
9.0 10.8 9. a 11.4 10.2
10.6 11.0 10.6 11.6 11.8
5.0 7.5 5.2 9.8 5. a
. 3.0 -4.6 ! 1.s t 5.6 5.8
Jet Pressure of 40 p s ~ g
38.0 34.8
14-4 19.6
20.6 24.0
4.0 9.4
-7.2 +3.6
30.0 29,9 25.0 23.0
18.8 19.2 70.0 20.2
20.8 21.6 19.6 20.8
11.2 15.2 10.0 17.6
-14.4 -1L5 t 5.2 t 5,o
Fig. 24. I-sci:e and Glass Vortex i‘ubes,
26
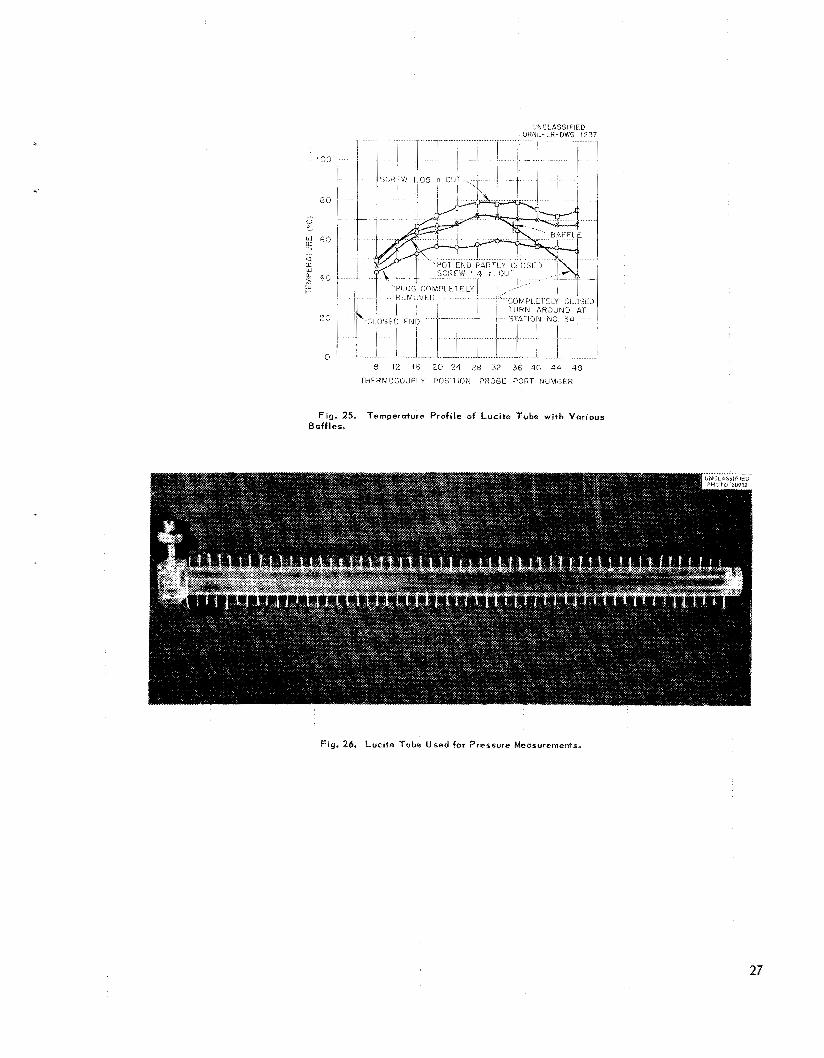
Fig. 25. Temperature Profile of Lucite Tube w i t h Various Boff 1.4.
- -
Fig. 26, Lucite Tube Used for Pressure Measurements.
27
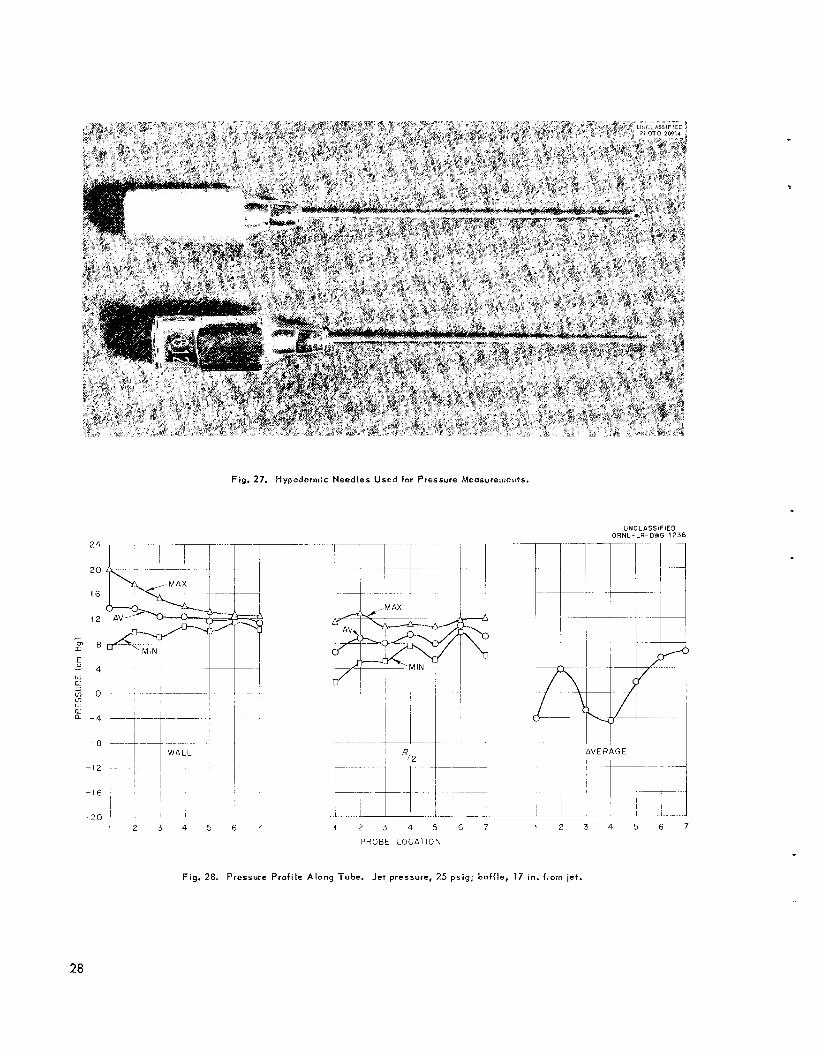
Fig. 27. Hypodermic Needles Used for Pressure Measurements.
24
2 0
16
12
- F - 8
- 5 4 W 0 3
u)
0
l n o
a - 4
- 8
w
-12
-16
1 2 3 4 5 6 7 i 2 3 4 5 6 7 1 2 3
PROBE L O C A T I O N
UNCLASSIFIED ORNL-LR-DWG 1238
Fig. 28. Presswe Profile Along Tube. Jet pressure, 25 psig; boff le , 17 in. from jet.
28
Stat ic
Pro be
Station
- __- Dyncmic
1 2 3 4 5 6 7
9 10 1 1 12 13 14 15 16 17
19 20 21 22 23 24 25 26 27 28 29 30 31 32 33 34 35 36 37
39 40 41 42 43 44 45 46 47
49
a
ia
3a
48
50 51 52 53 54 55
40"
Wall Rf2 Axis
33.8
28.0
27.0
26.0
23.7
24.4
23.8 22.0
20.6 22.2
21.4
20.5
17.9
18.6 18.0 17.6 17.0 16.4 16.2 16.2 16.0 16.2 'I 6.2
16.1
16.0
16.2
16.2
16.2
16.0
16.3
16.5
16.4
16.6
21.8
18.8
12.9 12.7 12.2 11.4 11.2 11.4 12.3
12.6 12.6 125 12.4 12.3 12.8 13.5 14.0 14.4 14.5 14.4 14.0 13.8 14.0 15.0 15.4 15.7 15.7 15.4 15.0 14.6
15.0
12.8
14.8
8.6 8.3 8 -0 8.4
9.0 9.6 9.2 8.6
8.3 8.6 11.0 13.3 10.8 10.0 9.8 8.8 8.0 11.4 10.8 13.6 10.6 12.0 13.0
8.0 8.3
8.4
37Sb
K/2 A x i s
-2.0 -4.0 -4.6 -3.6 -1.2 -0.5 + 0.5 0.7 0.2 2.2 4.6 5.7 5.6 5.5
4.6 6.0
4.8
-4.7 -3.1 -3.5
-2.0 -3.6 -3.5 -3.0 -3.0 -1.0 i 0.8 0 .o
-0.4 .i- 0.3
1.3 3 .O
-3 .a
0.8
8.0 3.4 9.0 3.6
8.9 4.0 9.4 3.8
a .4 4.4 8.7 5.4 11.6 6.4 12.6 8.5 12.8 8.4 12.3 7.0 1 1.8 6.8 11.6 6.8 11.4 7.0
9.3
37. sc Wall
Maximum Minimum
60.0 52.7 53.4 46.0 45.4
39.0
33.7
32.0
28.9
25-7
24.4
22.8
20.9
20.3
20.7
19.6
13.8
18.9
18.5
7.9
7.5
7.6
7.3 7.0 6.7 6.8 6.5 6.2 6.1 15.7
16.1 16.0 16.0
a .8 7.7 5.5
10.6
13.7
11.5
13.5
15.4
14.2
14.1
15.2
14.5
14.0
15.5
15.7
15.6
15.4
15.7
16.0
15.5
15.8
16.0 15.8 15.7 15.7 15.5 15.2 15.0 15.1 15.0 14.7 15.2 15.5 15.5 15.4
8.0
K / 2
Maximum Min irnurri
11.2 7.4 6.0 7.6
11.1 14.8 12.6 10.5
11.0 14.0 15.8 16.2 14.3 11.4 10.4 12.8 15.2 16.8 17.2 15.2 14.1 13.2 14.4
16.0 15.7 15.0 14.1 13.9 14.5 14.5 14.5 15.2 14.6
9 .a
15.8
14.8 14.8
I 4.8 15.1
15.4 15.8 15.7 15.7 15.3 15.2 15.2
15.0 14.7 15.3 15.0 15.0 15.0 15.3
14.8
- 1.4 -2-6 -3.0 -2.9 -0.2
0.0 0.0
-0.4 t 0.4 2.3
3.7 3.7 3.2 4.2 5.7 7.6
8.0 7.4 6.8
-2.8
-0.8
3.8
8.4
7.8 9 .a 10.5 10.6 10.2 10.0
10.2 10.8 10.9 12.0 12.4 12.2 11.6 11.2 10.3 12.8 13.5 14.0 14.1 12.9 12.0 11.0 11.6 13.1 14.2 14.2 13.7 13.3 11.6 11.0
9 .a
OAbovt 5% of inbet air out hot end; needle cut off at right angle.
'Other conditions same as those for 40-psig test.
'Needle with directed tip.
29
w 0
UNCLASSIFIED ORNL-LR-DWG 1239
40
35
32
28
24 I
20
16
42
a
4
0
-4
- 9
-42
-46
-20 1 2 3 4 5 6 j 2 3 4 5 6 1 2 3 4 5 6
PROBE LOCATION
Fig. 29. Pressure Profiie Along Tube. Jet pressure, 40 psig; baffle, 17 in. from jet.
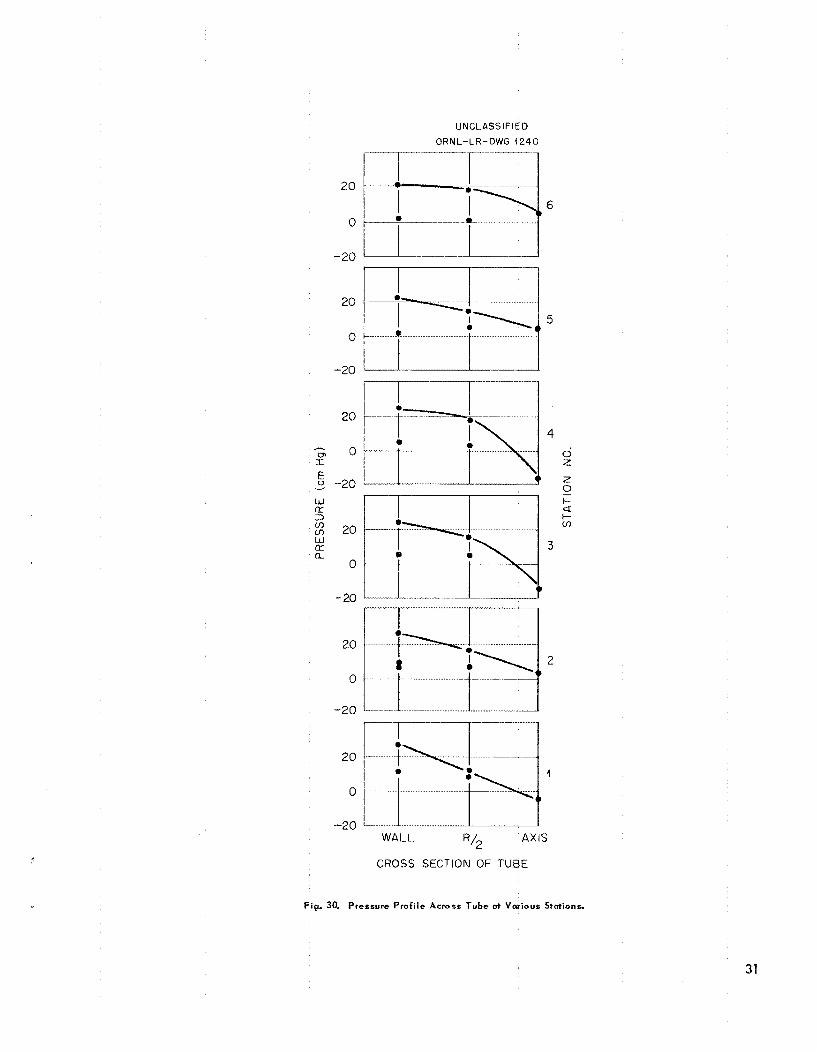
UNCLASSIFIED ORNL-LR-OWG 1240
20
0
-20
6
5
4 0 z 2 0 t- Q t- v)
-
3
2
1
AXIS R/2 WALL
CROSS SECTION OF TUBE
Fig. 30. Pressure Profile Across Tube at Various Stations.
31
0
0 e
I: c
0
0
0
v)
0
2
L
.- L
R + .. oi
VI a
.- v! h
m
+
u 7
cn 0
-1 0 L
.+
32
‘JNCLASSIFIED
24
21 25 79 33 37 41 45 49 5 9 13 17
PROBE LOCATION
Fig. 32. Pressure Profile for Long Lucite Tube ut R/2.
UNCLAS’51FIEO
32
24
PROBE LOCATION
F i g . 33. Static Pressure Profile for Long Lucite Tuba at WulI, R / 2 , and Axis.
33
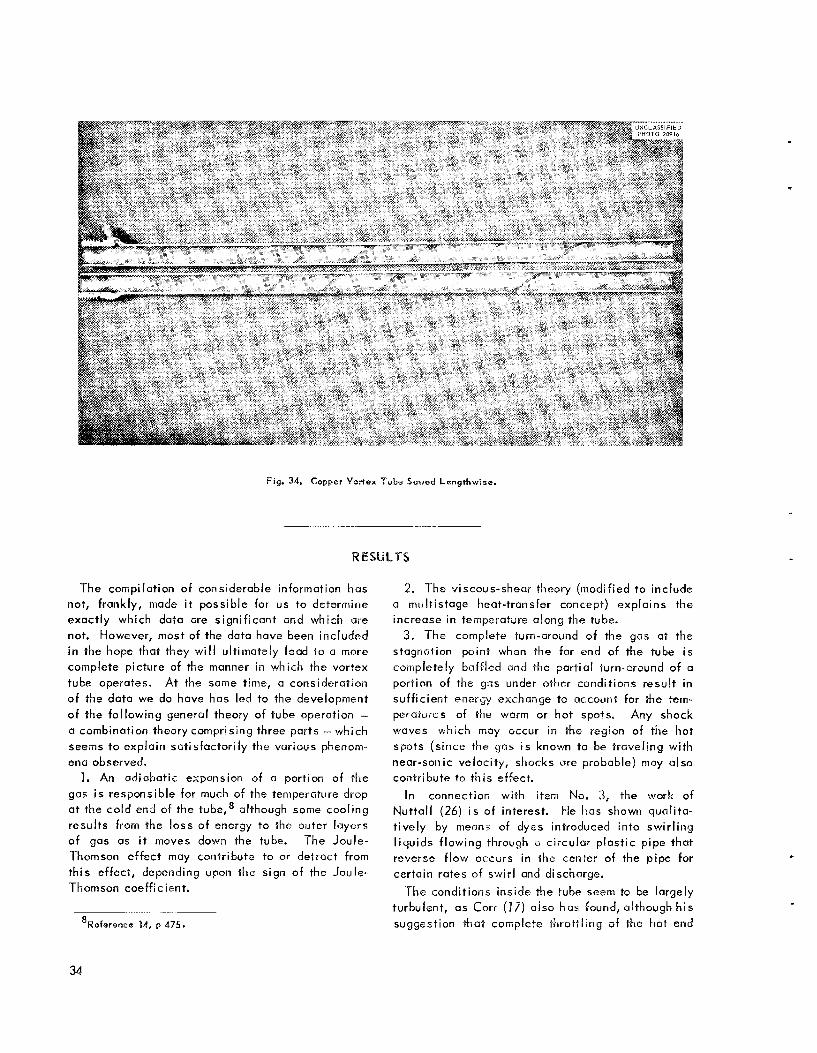
Fig. 34. Cnppcr Vorrex T u b e Sowed Lengthwise.
RESULTS
The compilation o f considerable information has not, frankly, made i t possible for us to determine exactly which data are signif icant and which are not. However, most of the data have been included in the hope that they w i l l ultimately lead to il more complete picture of the manner in which the vortex tube operates. At the same time, a consideration o f the data we do have has led to the development o f the fol lowing general theory of tube operation .- a combination theory eomprising three parts - which seems to explain satisfactori ly the various phenom- ena observed.
1. An adiabatic expansion of a portion o f the gas i s responsible for much of the temperature drop a t the cold end of the tube,l although some cooling results from the loss of energy to the outer layers o f gas as i t tnoves down the tube. The Joule- Thornson effect may contribute to or detract from this effect, depending upon the sign of the Joule- Thomson coefficient.
*Reference 14, p 475.
34
2. The viscous-shear theory (modified to include a multistage heat-transfer concept) explains the increase in temperature along the tube.
3. The complete turn-around o f the gas at the stagnation point when the far end of the tube i s completely baffled and the part ial turn-around of a portion of the gas under other conditions resul t in suff icient energy exchange to account for he tem- peratures of the warm or hot spots. Any shock waves which may occur in the region of tile hot spots (since the gas i s known to be travel ing with near-sonic velocity, shocks are probable) may also contribute to th is effect.
In connection with item No. 3, the work of Nuttal l (26) i s of interest. He has shown qml i t a - t ively by means of dyes introduced into swir l ing l iquids f lowing through a circular plast ic pipe that reverse f low occurs in the center of the pipe for certain rates of swir l and discharge.
The conditions inside the tube seem to be largely turbulent, as Csrr (17) also h a s found, although h i s suggestion that complete t l i tott l ing of the hot end
destroys the temperature dif ferential has not been gas in this area i s quite turbulent). Fulton (25) borne out. also seems to have encountered t h i s dif f iculty.
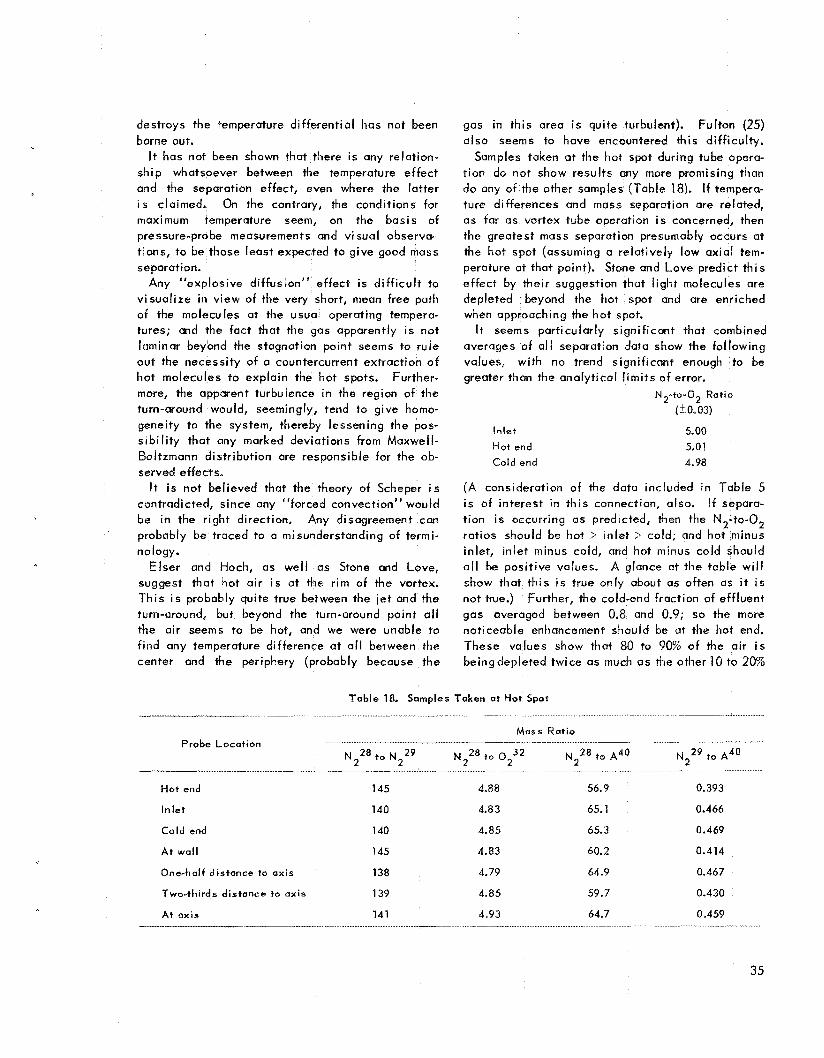
It has not been shown that there i s any relat ion- Samples taken at the hot spot during tube opera- ship whatsoever between the temperature effect t ion do not show results any more promising than and the separation effect, even where the latter do any of the other samples (Table 18). If tempwa- i s claimed, On the contrary, the conditions for ture differences and mass separation are related, maximum temperature seem, on the basis of as far as vortex tube operation i s concerned, then pressure-probe measurements and vi sua1 observa- tions, to be those least expected to give good mass separation.
Any “explosive dif fusion’# effect is d i f f i cu l t to v isual ize in view of the very short, mean free path of the molecules at the usual operating tempera- tures; and the fact that the gas apparently i s not laminar beyond the stagnation point seems t o rule out the necessity of a countercurrent extraction o f hot molecules to explain the Rot spots. Further- more, the apparent turbulence i n the region of the turn-around would, seemingly, tend to give homo-
the greatest mass separation presumably occurs at the hot spot (assuming a relat ively low axial tem- perature at that point). Stone and Love predict th is effect by their suggestion t h Q t l ight molecules are depleted beyond the hot spot and are enriched when approaching the ho t spot.
It seems particularly signif icant that combined averages of a l l separation data show the fol lowing values, with no trend signif icant enough to be greater than the analyt ical l im i ts of error.
N 2 - t o - 0 2 Rat10 (t0.03)
Inlet 5.00 Hot end 5.01 Cold end 4.98
(A consideration of the data included In Table 5 i s of interest in th is connection, also. If separa-
geneity to the system, thereby lessening the pos- s ib i l i t y that any marked deviations from Maxwefl- Boltzmann distr ibution are responsible for the ob- served effects,
It i s not believed that the theory of Scheper i s contradicted, since any “forced convection” would be in the r ight direction. Any disagreement can probably be traced to a misunderstanding of termi- nology.
Elser and Hoch, as wel l as Stone and Love, suggest that hot a i r i s at the r im of the vortex. This i s probahly quite true between the i e t and the turn-oround, but beyond the turn-around point a l l the air seems to be hot, and we were unable to f ind any temperature difference a t a l l between the center and the periphery (probably because the
t ion i s occurring as predicted, then the N2- to -02 rat ios should be hot > in let > cold, and hot minus inlet, in let minus cold, and hot minus cold should a l l be posit ive values. A glance at the table w i l l show that th is i s true only about as often as it i s not true.) Further, the cold-end fraction of effluent gas averaged between 0.8 and 0.9; so the more noticeable enhancement should be ~t the hot end. These values show that 80 to 90% of the air i s beingdepleted twice as much as the other 70 to 20%
T a b l e 18. Samples Taken ot Hot Spot
Mnss Ratio
NZ2* to N229 N228 to O2 32 N228 to A‘’ N229 to A4’ ......~.__..........._I - - - - - - - - ........... Probe Location
Hot end
Inlet
145
140
4.88
4.83
56.9 0.393
65.1 0.466
Cold end 140 4.85 65.3 0.469
At wall 145 4.83 60.2 0.414
One-half d is tance to ax is 138 4.79 64.9 0.467
Two-thirds distance to axis 139 4.85 59.7 0.430
At ax is 141 4.93 64.7 0.459 I_c_.___ ~ ~~~~.~........ - __
35
i s being enriched. In other words, i f die differ- ences are reul, the figures bel ie the usual expea- tations with regard to material balanse.
Another interesting interpretation of the data can be made from the results in Table 18, which includes several mass rat ios i n addition to the N2- to-02 ratio, It appears that l ight nitrogen i s being con- centrated at the hot-spot wall and at &‘ne hot end with respect to heavy nitrogen; but i t also appears that argon l ikewise is being concentrated at the hot-spot wall and at the hot end with respect to the same nitrogen, Further, l ight nitrogen i s being concentrated at the axis with respect to the heavy nitrogen, and th is i s contrary to theory. In other words, under f ixed conditions o f operation of a particular tube, i t i s not expected that some heavy molecules or atoms w i l l be separated i n one direc-
t ion and other heavy atoms or molecules in another direction, although some property of the gases might conceivably al low this. Elser and Hosh9 were unable to correlate what they found with any
obvious gas characteristic; Johnson (76), on the other hand, thinks 2’1’ is mass-dependent.
Even i f th is s l ight trend could be construed as real, the enhancement factor i s so small (hot end, 1.002; cold end, 1.004) that improvement of tube operation would be absolutely essential i f i t s use i s t o be feasible. However, correlation of data so far apparently has shown no trends; therefore a long-range program would be necessary for evalu- ating the variables and/or developing a workable theory.
9Refercnce 5, p 29.
At present, the status of the Ranque-Hilsch tube from the standpoint of i t s appl icat ion to mass separation is as follows:
1. On the basis of the doto obtained to date, interpretation does not indicate that such n tube i s a good mass separator; furthermore, any separa- t ion which may occur would pl-obably result from secondary effects such as centrifugation or from thermal dif fusion associated with the hot part of the tube.
2. It is not denied that there may possibly be conditions under which the tube w i l l operute satisfactorily, but so far our arrangements have not been fortuitous. As a matter of fact, we can- not even point to trends.
3. To ruleout posi t ivelythe vortextube asa mass separator could wel l involve a long-time program for accumulating suff icient data for an ironclad theory of operation to be formulated, On the other hand, any particular experiment might happen t o involve the right Combination o f variables to effect separation. Our brief program has indicated no readi ly observable trends and has produced
sufficient data to support our bel ief that separation is not l ikely. On this basis, further work at present seems to he unwarranted.
Two quotations sum up very nicely our observa- t ions. Johnsonlo says: Samples of air taken from the two ends were analyzed and the results guve no indication of any separation of the air into i ts components i n passing through the heat separator.” Corr ’ l says: “With such high (centri- fugal) f ields one would expect centrifuging effects on water vapor, or perhaps the gas tnolecules themselves, Hutriidity measurements made on the hot uir indicated CI sl ight enrichment of the hot air, but such differences were wel l w i th in the l imi t of experimental error and not regarded as significant. Dr. F. J, Norton analyzed some samples of hot and cold air using the m a s 5 specfro- graph and found no apparent separation of the component gases.”
I ,
”Reference 16, p 301. ”Reference 17, p 34.
34
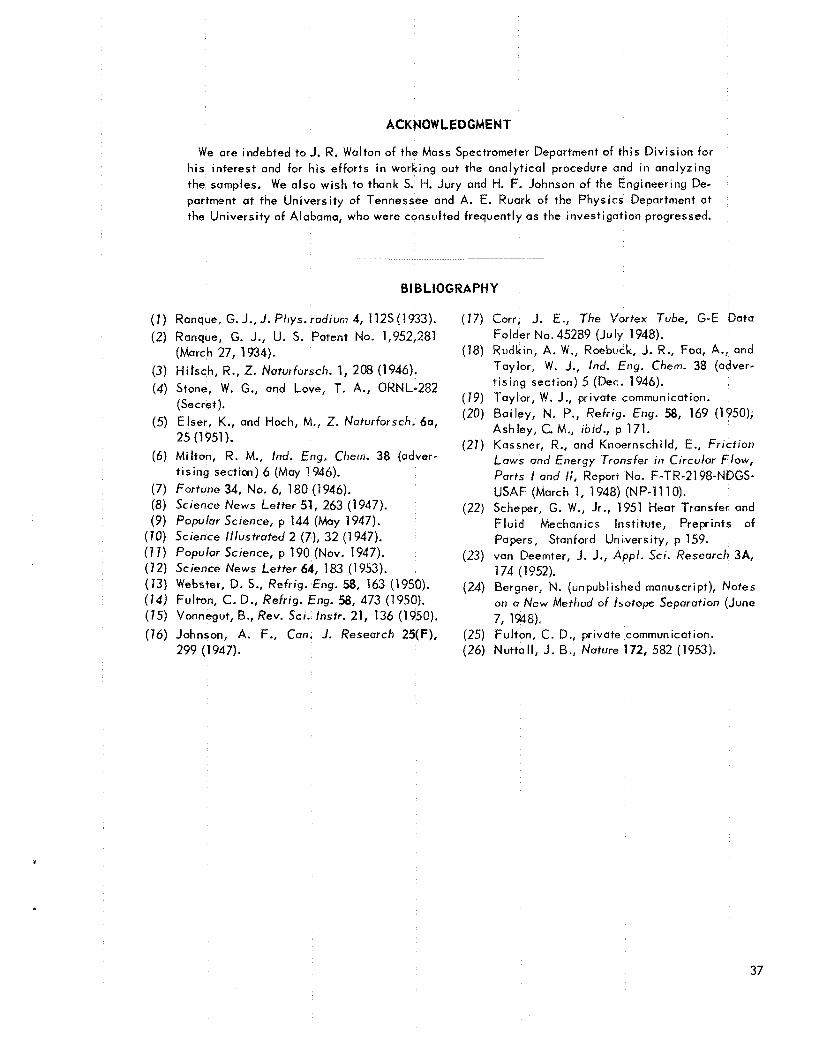
ACKNOWLEDGMENT
We are indebted to J. R. Walton o f the? Mass Spectrometer Department of thi5 Div is ion for his interest and for his efforts i n working out the analyt ical procedure and in analyzing the somples. We a lso wish to thank S. H. Jury and H. F. Johnson of the Engineering De- partment at the University of Tennessee and A. €. Ruark of the Physics Department at the University of Alabama, who were consulted frequently as the investigation progressed.
-
BIBLIOGRAPHY
( I ) Ranque, G. J.,J. Phys.radium 4, 1125(1933). ( 1 7 ) Corr, J. E., The Vortex Tube, G-E Data (2) Ranque, G. J., U. 5. Patent NO. 1,952,281 Folder No. 45289 (July 1948).
(March 27, 1934). (78) Rudkin, A. W., Roebuck, J. R., Foa, A., and Taylor, W. J., Ind. Eng. Chem. 38 (adver- (3) Hitsch, R., 2. Naturforsch. 1, 208 (1946). t is ing section) 5 (Dec. 1946). (4) Stone, W. G., and Love, T. A., ORNL-282
(19) Taylor, W. J., private communication. (Secret). (20) Bailey, N. P., Refrig. Eng. 58, 169 (1950); (5) Elser, K., and Hoch, M., Z. Naturforsch. 60, Ashley, C. M., hid., p 171. (21) Kassner, R., and Knoernschild, E., Frrct ion
25 (1951). (6) Milton, R. M., Ind. Eng. Chern. 38 (adver- Laws and Energy ‘Transfer i n Circular Flow,
t i s ing section) 6 (May 1946). Parts I and I/, Report No. F-TR-2198-NDGS- (7) Fortune 34, No. 6, 180 (1946). USAF (March 1, 1948) (NP-1110). (8) Science News Letter 51, 263 (1947). (22) Scheper, G. W., Jr., 1951 Heat Transfer and (9) Popular Science, p 144 (May 1947). F lu id Mechanics Institute, Preprints of
(70) Science I l lustrated 2 (7), 32 (1 947). Papers, Stanford University, p 159. ( 7 7 ) Popular Science, p 190 (Nov. 1947). (23) van Deemter, J. J., Appl . ~ C I . Research 3A, (12) Science News Letter 64, 183 (1953). 174 (1 952). (73) Websfer, D- s.1 Refrig. Eng- 58, 163 (1950). (24) Bergner, N. (unpublished manuscript), Notes (74 ) Fulton, C. D., Refrig. Eng. 58, 473 (1950). on a New Method of isotope Separation (June
7, 1948). (16) Johnson, A. F., Can. J. Research 25(F), (25) Fulton, C. D., private communication.
(26) Nuttal l , J. B., Nature 172, 582 (1953).
(75) Vonnegut, B., Rev. Scr. Instr. 21, 136 (1950).
299 (1 947).
37
APPEIdDi X
Should it be desirable to continue work on the vortex tube, a few experiments which have been suggested during our investigation are l is ted here for what they may be worth. Certainly other ideas w i l l occur to those reading this report.
1. Measure pressures in front of and behind turn-around when tone of tube changes.
2. Use a porous alundum OF porous carbon tube. See i f a hot. spot s t i l l occurs when some of the gas i s al lowed to seep through the tube. A l s o get mass analyses of both outer and inner gos.
3. Recycle or cascade the effluent from the hot end and analyze.
4. Explain why the hot spot moves down the tube after startup.
5. Explain how the apparent hot spot occurs beyond the barrier i n some cases.
6. Find the exact location where the stat ic pressure changes sign (1) along the tube and (2) from wal l to axis.
7. Get samples for analysis just beyond turn- around (where centrifugal effect should be great).
8. Try a tube threaded on the inside to control the spiral.
9. Try a copper coi l inside a laager tube, wi th the le t directed SO that the gas passes through the
coi l . Perforate the coi l t o le t molecules escape. Check for hot spot.
10. Make as short a tube a4 possible which s t i l l shows turn-around, Introduce o very small tube into the hot end and extend i t beyond the turn-around to determine whether or not air i s sucked in; according to pressure measurements, there should be some locations where the air should be drawn in.
Put a thin-walled concentric tube which C Q ~
be rotated a t velocit ies approaching those o f the gas inside another tube, Check for hot spot, and i f there s t i l l i s one comparable to that without the inside tube, the viscous-shear theory w i l l be sup- ported and the kinetic-molecular theory disproved.
11.
12. Find out exactly how the “reversal” of the warm spot i s related to the tube length.
13. Study further the flow characteristics wi th in the tube by introducing Freon at various points in the tube and test ing for it a t other points; using fluorescent gases to study flow patterns; using radioactive tracers as a possible aid; using HCl- NH,OH as a possible aid, that is, placing a piece of cotton soaked in HCI a t the hat end of the tube and intraducing NH,OH into the in le t stream; note where NH,CI i s formed,
38


![Comparative Study and Performance Analysis between a ...The Ranque-Hilsch vortex tube [1] uses compressed gas and cools it down as it passes through the length of tube. In our setup,](https://img.pdfslide.us/doc/110x75/6092a55f934a6564560d9b49/comparative-study-and-performance-analysis-between-a-the-ranque-hilsch-vortex.jpg)