Embed Size (px)
Citation preview

Georgia Southern University
Digital Commons@Georgia Southern
Electronic Theses and Dissertations Graduate Studies, Jack N. Averitt College of
Fall 2011
Investigations of the Tribological Effects of Engine Oil Dilution by Vegetable and Animal Fat Feedstock Biodiesel on Selected Surfaces Sultana Mahbuba Shanta
Follow this and additional works at: https://digitalcommons.georgiasouthern.edu/etd
Recommended Citation Shanta, Sultana Mahbuba, "Investigations of the Tribological Effects of Engine Oil Dilution by Vegetable and Animal Fat Feedstock Biodiesel on Selected Surfaces" (2011). Electronic Theses and Dissertations. 776. https://digitalcommons.georgiasouthern.edu/etd/776
This thesis (open access) is brought to you for free and open access by the Graduate Studies, Jack N. Averitt College of at Digital Commons@Georgia Southern. It has been accepted for inclusion in Electronic Theses and Dissertations by an authorized administrator of Digital Commons@Georgia Southern. For more information, please contact [email protected].
INVESTIGATIONS OF THE TRIBOLOGICAL EFFECTS OF ENGINE OIL DILUTION BY
VEGETABLE AND ANIMAL FAT FEEDSTOCK BIODIESEL ON SELECTED SURFACES
by
SULTANA MAHBUBA SHANTA
(Under the Direction of Gustavo J. Molina)
ABSTRACT
Biodiesels have become attractive alternative fuel to replace traditional fossil fuels. Biodiesels
can be used in diesel engines with no major modification, but its use leads to some degree of
engine oil dilution because of biodiesel leaking and scrapping to engine oil pan. Biodiesels can
be made from vegetable and animal fat feedstocks. Therefore, the fatty acid methyl ester
components of biodiesel may vary upon these sources of feedstock. In this thesis work, engine
oil is diluted with vegetable (canola oil, peanut oil and soybean oil biodiesel) and animal
(chicken fat) feedstock biodiesels at known percentages and these mixtures are tested in a pin-
on-disk tribometer. In-process friction force and temperature changes are observed and specific
wear on the tested surface and dilution effects on viscosity are measured. The oxidative stability
of diluted engine oils is also assessed by observation. Experimental results suggest that a higher
fraction of palmitic and a lower fraction of linoleic acid contents of the biodiesel play a role for
providing good lubricity when mixed with the engine oil in the tested condition and animal
feedstock biodiesel perform better than that of vegetable feedstock biodiesel.
INDEX WORDS: Biodiesel, Engine oil dilution, Vegetable feedstock, Animal feedstock

ii
INVESTIGATIONS OF THE TRIBOLOGICAL EFFECTS OF ENGINE OIL DILUTION BY
VEGETABLE AND ANIMAL FAT FEEDSTOCK BIODIESEL ON SELECTED SURFACES
by
SULTANA MAHBUBA SHANTA
B.Sc. Bangladesh University of Engineering and Technology, Bangladesh, 2005
A Thesis Submitted to the Graduate Faculty of Georgia Southern University in Partial
Fulfillment
of the Requirements for the Degree
MASTERS OF SCIENCE IN APPLIED ENGINEERING
STATESBORO, GEORGIA
2011

iii
© 2011
SULTANA SHANTA
All Rights Reserved

iv
INVESTIGATIONS OF THE TRIBOLOGICAL EFFECTS OF ENGINE OIL DILUTION BY
VEGETABLE AND ANIMAL FAT FEEDSTOCK BIODIESEL ON SELECTED SURFACES
by
SULTANA MAHBUBA SHANTA
Major Professor: Gustavo J. Molina
Committee: Valentin A. Soloiu
Norman E. Schmidt
Electronic Version Approved:
December 2011

v
DEDICATION
This thesis work is dedicated to my parents who give me inspiration through continuous
encouragement, advisement and cordial care.

vi
ACKNOWLEDGMENTS
I would like to express my sincere gratitude to my supervisor Dr. Gustavo J. Molina for his
valuable direction, encouragement and supports in the progress of this research and thesis work. I
would also express my most sincere gratitude and thanks to my co-supervisor Dr. Valentin A.
Soloiu for his advice, efforts and time in the accomplishment of this thesis.
A special thanks to the biodiesel formulation group and Mr. Jeff Lewis of the Renewable Energy
& Engines Lab at Georgia Southern University for supplying the vegetable feedstock biodiesel.
My gratitude also goes to Mr. Andrew Michaud for helping with machining the disk and setup
the data acquisition system. I also appreciate the support of my thesis committee member Dr.
Norman E. Schmidt. Finally I want to thank the Department of Mechanical and Electrical
Engineering at Georgia Southern University for supplying materials and equipments used for this
work.

vii
TABLE OF CONTENTS
ACKNOWLEDGMENTS ............................................................................................................ vi
LIST OF TABLES .................................................................................................................... ixiv
LIST OF FIGURES………………………………………………………………………………x
NOMENCLATURE .................................................................................................................... xv
CHAPTER
1 INTRODUCTION ............................................................................................................. 1
1.1 General ...................................................................................................................... 1
1.2 Biodiesel Characterization and Standards ................................................................ 2
1.2.1Chemical Properties of Biodiesel as Fuel ............................................................... 6
1.2.2 Biodiesel Limitations ........................................................................................... 12
1.3 Purpose of the Research of This Thesis .................................................................. 13
1.5 Overview of the Thesis ........................................................................................... 14
2 LITERATURE REVIEW ................................................................................................ 15
2.1 Introduction ............................................................................................................. 15
2.2 How Engine Oil Works ........................................................................................... 17
2.3 Engine Friction and Wear ....................................................................................... 19
2.3.1 Piston Ring Assembly Friction (PRA) ................................................................. 22
2.3.2 Factors for the Modeling of Diesel Engine Friction and Wear ............................ 23
2.4 Engine Oil Contamination by Diesel Engine Fuel .................................................. 25
2.5 Primary Cause of Engine Oil Dilution by biodiesel ............................................... 27
2.6 Problems Associated with Engine Oil Dilution by Diesel Engine Fuel ................. 28
2.7 Methods for Determining Lubricity of the Engine Fluid ........................................ 29
2.8 Literature Review on Lubrication Property Studies of Biodiesel Due to the presence
of Bio-Components and its Blending with Diesel Fuel ........................................... 34
2.9 Literature Review on Lubrication Properties of Biodiesel Diluted Engine Oil. ...... 41
3 METHODOLOGY ............................................................................................................ 46
3.1 Introduction .............................................................................................................. 46
3.2 Overview .................................................................................................................. 46
3.3 Pin-On-Disk Tribometer ........................................................................................... 48

viii
3.3.1 Mechanical Unit of Pin-On-Disk Tribometer ........................................................ 48
3.3.2 Measuring and Controlling Unit: ........................................................................... 51
3.4 Modifications of the Pin-On-Disk Tribometer ......................................................... 57
3.4.1 New Optical Sensor Installation ............................................................................ 58
3.4.2 Data Acquisition System........................................................................................ 59
3.5 Pin-On-Disk Tribometer Calibration ........................................................................ 63
3.5.1 Frictional Force Calibration ................................................................................... 64
3.5.2 Rotational Speed Calibration .................................................................................. 66
3.6 Disk and Ball Materials of the Tested Friction Couple ............................................. 67
3.7 Disk Cutting and Polishing Process ........................................................................... 68
3.8 Surface Cleaning Process ........................................................................................... 68
3.9 Biodiesel and Engine Oil Used in this Thesis Work.................................................. 70
3.11 Preparation of Biodiesel Diluted Engine Oil ........................................................... 73
3.12 Viscosity Measurement ............................................................................................ 75
3.13 Specific Wear Calculation ....................................................................................... 77
4 RESULTS AND DISCUSSIONS ...................................................................................... 78
4.1 Introduction ................................................................................................................. 78
4.2 Experimental Results of Biodiesel Diluted Engine Oil .............................................. 78
4.2.1 Canola Oil Biodiesel Diluted Engine Oil................................................................. 79
4.2.2 Peanut Oil Biodiesel Diluted Engine Oil ................................................................. 88
4.2.3 Soybean Oil Biodiesel Diluted Engine Oil .............................................................. 98
4.2.4 Chicken Fat Biodiesel Diluted Engine Oil............................................................. 106
4.3 Friction and Wear Test for Pure Biodiesel ............................................................... 114
4.4 Overall Comparison of Results .................................................................................. 118
5 CONCLUSIONS AND RECOMMENDATIONS FOR FUTURE WORK ....................... 123
REFERENCES .......................................................................................................................... 128
APPENDICES
A. REST OF THE TEMPERATURE CHANGE AND IN-PROCESS FRICTIONAL
FORCE PLOT…………................................................................................................132
B. DEVELOPED MATLAB CODE FOR THE DATA ANALYSIS…………….….…..138
C. SAMPLE PREPARATION ............................................................................................ 148

ix
LIST OF TABLES
Table 1: Properties of No.2 Diesel fuel and Biodiesel ................................................................... 7
Table 2: Kinematic viscosity in diesel fuel standards ................................................................... 10
Table 3: WSD (Wear Scar Diameter) of different biodiesel blend ............................................... 12
Table 4: Composition and Acid value of Biodiesel ...................................................................... 36
Table 5: Typical properties of 15W-40 mineral oil ...................................................................... 71
Table 6: Fatty acid percentages in chicken fats ............................................................................ 72
Table 7 Fatty acid percentages in typical vegetable fat. ............................................................... 73
Table 8: Fatty acid percentages in different feedstock ................................................................. 73

x
LIST OF FIGURES
Figure 1: Rudolf Diesel and first model of diesel engine run by peanut oil. (Chasen &
Fasano,2009) .................................................................................................................... 2
Figure 2: Typical molecular structure of Triglyceride ................................................................... 3
Figure 3: Reaction of transesterification process .......................................................................... 4
Figure 4: Block schematics of biodiesel manufacturing process ................................................... 5
Figure 5: Biodiesel productions in US from 1999 to 2009. ......................................................... 16
Figure 6: Overview of Engine Fluid Interaction. ......................................................................... 17
Figure 7: Lubrication Circuit and Flow Path of Oil in Engine..................................................... 18
Figure 8: The two typical lubricating condition of oil film formation (Bennett, 2009) ............ 19
Figure 9: Distribution of total mechanical loss in a typical diesel engine. ................................... 20
Figure 10: Typical Stribeck curve (Comfort, 2003) .................................................................... 21
Figure 11:2-D Model of Piston and Crank-throw assembly (Comfort, 2003) ............................. 22
Figure 12: Relative Velocity of Piston with respect to Liner vs. Crank angle at 1800 rpm......... 23
Figure 13: The factors that must be considered for developing accurate simulation of friction and
wear in diesel engine. .................................................................................................. 24
Figure 14: Basic path of the blow by of partially burn fuel as it enters the engine crankcase. .... 26
Figure 15: SAE viscosity rating decrease as the percentage of fuel contamination of the engine
oil increase (Schwaller, 2005). .................................................................................... 29
Figure 16: Basic Schematic of SLBOCLE (Garpen, 2004) ......................................................... 30
Figure 17: Basic Schematics of HFRR test method. (Garpen, 2004) .......................................... 31
Figure 18: Schematic layout of Optimol SRV machine (Burger, 2006). ..................................... 32
Figure 19: Load unit schematic of M-ROCEL method.(Totten, 2001) ........................................ 33

xi
Figure 20: Basic schematics of pin-on-disk tribometer (Jürgen Butt, Graf, & Kappl, 2003) ...... 34
Figure 21: A Typical Chromatogram of Biodiesel. ...................................................................... 35
Figure 22: Wear Scar at 1% volume addition of ester to base fuel observed by HFRR. ............. 37
Figure 23: Lubricity effect of different type of minor component. .............................................. 38
Figure 24: Lubricity of the residue of different distilled biodiesel. (Wadumestheige, Ara, Salley,
& Simon Ng, 2009) ...................................................................................................... 39
Figure 25: Friction coefficient change with the change of methyl ester concentration in the diesel
fuel. (Sulek, Kulczycki, & Malysa, 2010) ................................................................... 40
Figure 26: (a) Depth of Wear Scar by B5. (b) Depth of Wear Scar by B30. (c) Depth of Wear
Scar by B100. (Sulek, Kulczycki, & Malysa, 2010) ................................................... 40
Figure 27: Kinematic Viscosity change of engine oil at 40◦C for B20 and Diesel Fuel. (Agarwal,
August, 2006) ............................................................................................................... 43
Figure 28: Kinematic Viscosity change of engine oil at 100◦C for B20 and Diesel Fuel.
(Agarwal, August, 2006) .............................................................................................. 43
Figure 29: Ash content in the Engine oil for B20 and Diesel Fuel. (Agarwal, August, 2006) ... 44
Figure 30: Iron content in the Engine oil for B20 and Diesel Fuel (Agarwal, August, 2006) ..... 44
Figure 31: Employed experimental test setup of tribometer and dedicated data acquisition system
...................................................................................................................................... 47
Figure 32: Schematics of T-11 Pin-on-disk Tribometer............................................................... 49
Figure 33: Friction force transducer ............................................................................................ 50
Figure 34: Components of the disk holding assembly .................................................................. 51
Figure 35: Functional block diagram of computer aided set of control and measurement unit in
the pin-on-disk machine. (Tribology, 1994) ............................................................... 52
Figure 36: Front view of the MST-02 board (input output unit) (Tribology, 1994) ................... 53

xii
Figure 37: Motor speed controller ................................................................................................ 56
Figure 38: Basic working principle optical sensor (Quadrature Encoder Measurements) ........... 58
Figure 39: (a) Optical sensor and (b) Its holder ........................................................................... 59
Figure 40: Front panel of the developed LabView VI ................................................................. 61
Figure 41: Control panel of the developed LabView VI .............................................................. 62
Figure 42: Schematic of the calibration of frictional force transducer ......................................... 64
Figure 43: Frictional force calibration dialog box in T-11 program (Tribology, 1994) .............. 65
Figure 44: Dialog box of entering current load value for frictional force calibration with T-11
program. (Tribology, 1994) ......................................................................................... 65
Figure 45: Correct frictional force calibration characteristic obtained by T-11 program.
(Tribology, 1994) ......................................................................................................... 66
Figure 46: Calibration progress window in T-11 program (Tribology, 1994) ............................ 67
Figure 47: Rotational speed characteristic of the motor during calibration using T-11 program.
(Tribology, 1994) ......................................................................................................... 67
Figure 48: Ultrasonic bath of the disk with indirect method ........................................................ 69
Figure 49: (a) Volume measurements of oil by micropipette. (b) Magnetic stirrer for making
homogeneous mixture of engine oil and biodiesels. .................................................... 75
Figure 50: Viscosity change of EO when diluted by COB .......................................................... 80
Figure 51: Viscosity change of COB diluted EO after the experiment. ....................................... 81
Figure 52: Specific wear amount of the surface in presence of COB diluted EO. ....................... 83
Figure 53: In process friction force with the time for COB diluted EO ....................................... 85
Figure 54: Average friction force between the contacted surfaces for COB diluted EO. ............ 86
Figure 55: The left over oxidized oil after a test run with a typical COB diluted EO. ............... 87
Figure 56: Viscosity change of EO when diluted by POB ........................................................... 89

xiii
Figure 57: Viscosity change of POB diluted EO after the experiment. ....................................... 90
Figure 58: Specific wear amount of the surface in presence of POB diluted EO. ....................... 91
Figure 59: Average friction force between the contacted surfaces for POB diluted engine oil ... 92
Figure 60: In process friction force Vs the time for POB diluted EO .......................................... 94
Figure 61: In process temperature profiles of ball and test chamber vs. time for POB diluted EO.
...................................................................................................................................... 96
Figure 62: The left over oxidized oil after a test run with a typical POB diluted EO .................. 97
Figure 63: Measured viscosity of EO when diluted by SOB ...................................................... 99
Figure 64: Viscosity change of SOB diluted EO after the experiment. ..................................... 100
Figure 65: Specific wear amount of the surface in presence of SOB diluted EO. ................... 101
Figure 66: Average friction force between the contacted surfaces for SOB .............................. 103
Figure 67: In process friction force with the time for SOB diluted EO ..................................... 104
Figure 68: The left over oxidized oil after a test run with a typical SOB diluted EO ................ 105
Figure 69: Viscosity change of EO when diluted by CFB ......................................................... 107
Figure 70: Viscosity change of CFB diluted EO after the experiment....................................... 108
Figure 71: Specific wear amount of the surface in presence of CFB diluted EO. ................... 110
Figure 72: Average friction force between the contacted surfaces for CFB .............................. 111
Figure 73: In process friction force with the time for CFB diluted EO ..................................... 112
Figure 74 : The left over oxidized oil after a test run with a typical CFB diluted EO ............... 113
Figure 75: In process friction force with the time for B100 for the four tested biodiesel and EO
.................................................................................................................................... 115
Figure 76: Specific wear amount of the surface in presence of all four types B100 and pure EO
.................................................................................................................................... 117
Figure 77: Viscosity change of EO when diluted by Biodiesel.................................................. 119

xiv
Figure 78: Viscosity change of diluted EO after the experiment ............................................... 120
Figure 79: Specific wear amount of the surface in presence of all four types Biodiesel and Diesel
oil diluted Engine oil. ................................................................................................ 121

xv
NOMENCLATURE
Acronym Definition
ASTM American Society of Testing and materials
B100 100% Biodiesel
BDC Bottom Dead Center
BOCLE Ball on Cylinder Lubricity Evaluator
CFB Chicken Fat Biodiesel
CSO Cotton Seed Biodiesel
COB Canola Oil Biodiesel
DG Diglycerides
DPF Diesel Particle Filters
ECR Electrical Contact Resistant
EE Ethyl ester
EN EuroNorme
EMA Engine Manufacturer’s Association
EPA Environment Protection Agency
EO Engine Oil
FAME Fatty Acid Methyl Ester
FFA Free Fatty acids
FIE Fuel Injection Equipment
FTIR Fourier Transform InfraRed (spectrometer)
HFRR High Frequency Reciprocating Rig

xvi
HSDI High Speed Direct Injection
LN Lubricity Number
LOME Methyl Ester of Linseed oil
MG Monoglycerides
ME Methyl Ester
MEE Methyl Ethyl Ester
M-ROCLE Munson Roller in Cylinder Lubricity Evaluator
NCWM National Conference on Weights and Measure
NMR Nuclear Magnetic Resonance Spectroscopy
P31
-NMR Phosphorous 31 nuclear magnetic resonance
(analytical technique)
PRA Piston Ring Assembly
PF Poultry Fat Biodiesel
POB Peanut Oil Biodiesel
S8 Synthetic Fuel Blend
SBO Soybean Oil Biodiesel
SOB Soybean Oil Biodiesel
SLBOCLE Scuffing Load Ball On cylinder Lubricity Evaluator.
SRV Optimol Reciprocating Rig
TAE Trends in Agricultural Engineering
TDC Top Dead Center
TG Triglyceride
ULSD Ultra Low Sulfur Diesel
WSD Wear Scar Diameter
YG Yellow Grease Biodiesel
ZDDP Zinc Dialkyl Dithio Phosphate

1
CHAPTER 1
INTRODUCTION
1.1 General
The recent energy crisis of the world draws attentions towards bio-fuels and biodiesels.
Biodiesel development started in the 19th century. The process of transesterification that is used
to derive biodiesel from vegetable oil is a more than one hundred year old technology. This
process was used initially to derive glycerin from vegetable oil. The byproduct of that glycerin
production process was methyl ester and what is today called biodiesel. Rudolf Diesel envisioned
using vegetable oil as a fuel of his engine, as he stated in his 1912 speech saying "the use of
vegetable oils for engine fuels may seem insignificant today, but such oils may become, in the
course of time, as important as petroleum and the coal-tar products of the present time” (Chasen
& Fasano, 2009). At the 1900 World Exhibition in Paris, a diesel engine was demonstrated
running on peanut oil. In fact, the general feeling in the early 20th
century was that vegetable fuels
would be the primary fuel for diesel engines, and biodiesels were widely used until the 1920s.
However, during the 1920's, diesel engine manufacturers altered their engines to utilize the lower
viscosity of fossil fuel, best known as petro diesel, rather than to run on biomass vegetable oil
fuel. The first patent of biodiesel fuel derived from palm oil was granted in 1937. In 1938, J.
Walton promote the use of FAME (Fatty Acid Methyl Ester) from which glycerol had been
removed (Chasen & Fasano, 2009). During the shortage of fuel in 1970’s and 1980’s, interest in
alternative fuels was again revived.

2
(a) (b)
Figure 1: Rudolf Diesel and first model of diesel engine run by peanut oil. (Chasen &
Fasano,2009)
1.2 Biodiesel Characterization and Standards
Bio-diesel is an alternative fuel for diesel engine that is obtained from renewable
agricultural sources such as canola, soybean, peanut, and olive oil; animal fat and waste
vegetable oil, through a process called transesterification. All vegetable oils and animal fats
consist primarily of triglyceride molecules as shown in Figure 2.

3
Figure 2: Typical molecular structure of Triglyceride
In Figure 2, R1, R2, and R3 represent the hydrocarbon chains of the fatty acid elements of
the triglyceride. The properties of the triglyceride and the biodiesel fuel will be determined by
the amounts of each fatty acid that are present in the molecules. Biodiesel consists of the
monoesters, formed when the triglycerides react with an alcohol such as methanol. This process
is known as transesterification. In the transesterification process, vegetable oil or animal fat
reacts with the alcohol in presence of catalyst (e.g. KOH, NaOH, NaOCN3,) and produces
glycerol and biodiesel as shown in the Figure 3.

4
Triglyceride + Methanol Mixture of fatty esters (biodiesel) + glycerol
Triglyceride (oil) Biodiesel
Figure 3: Reaction of transesterification process
Typical feedstock is transformed into fatty acid methyl ester (FAME) by
transesterification. The chemistry in biodiesel production involves a single step transesterifiction
process. Major by-product of the transesterifiction process is glycerin but as it is more polarize
and have higher density than FAME, it is immediately separate during the reaction and can be
easily removed, once the reaction is completed.
Biodiesel is manufactured both in US and Europe, and there are currently several large
biodiesel manufacturers in US. Biodiesel can be obtained from vegetable oil, animal fat or
grease, but the large variation of feedstock oils, of their chemistry, and of control used in
manufacturing process, make the biodiesel production process more expensive than that of diesel
fuel. Requirements for biodiesel are established by the ASTM D6751, a standard specification
for biodiesel fuel (B100) blend stock for distillate fuel. Feedstock oil or fat which are used in
biodiesel production do not follow any standard for consistent quality control of
transesterification (Weiksner, Crump, & White) .There is some controversy in the biodiesel
5
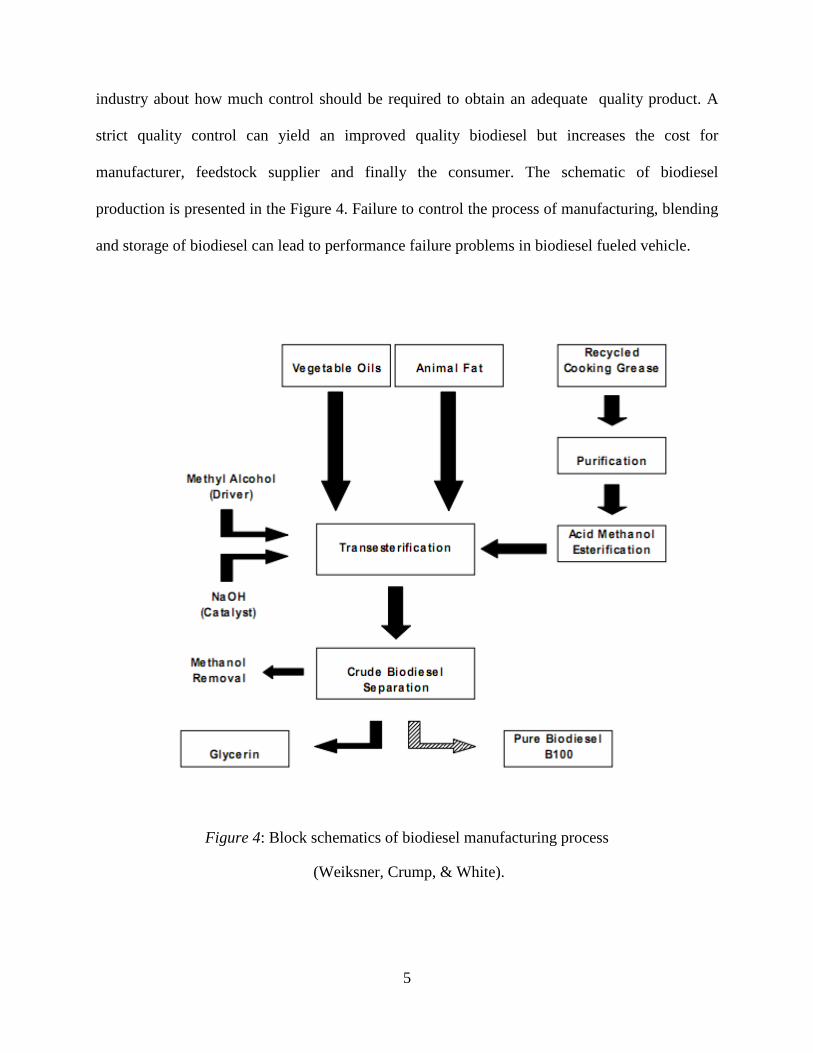
industry about how much control should be required to obtain an adequate quality product. A
strict quality control can yield an improved quality biodiesel but increases the cost for
manufacturer, feedstock supplier and finally the consumer. The schematic of biodiesel
production is presented in the Figure 4. Failure to control the process of manufacturing, blending
and storage of biodiesel can lead to performance failure problems in biodiesel fueled vehicle.
Figure 4: Block schematics of biodiesel manufacturing process
(Weiksner, Crump, & White).

6
1.2.1Chemical Properties of Biodiesel as Fuel
Biodiesel chemical properties vary in a wide range due to the different composition of
feedstock. Different feedstock creates biodiesels which may have advantages or disadvantage
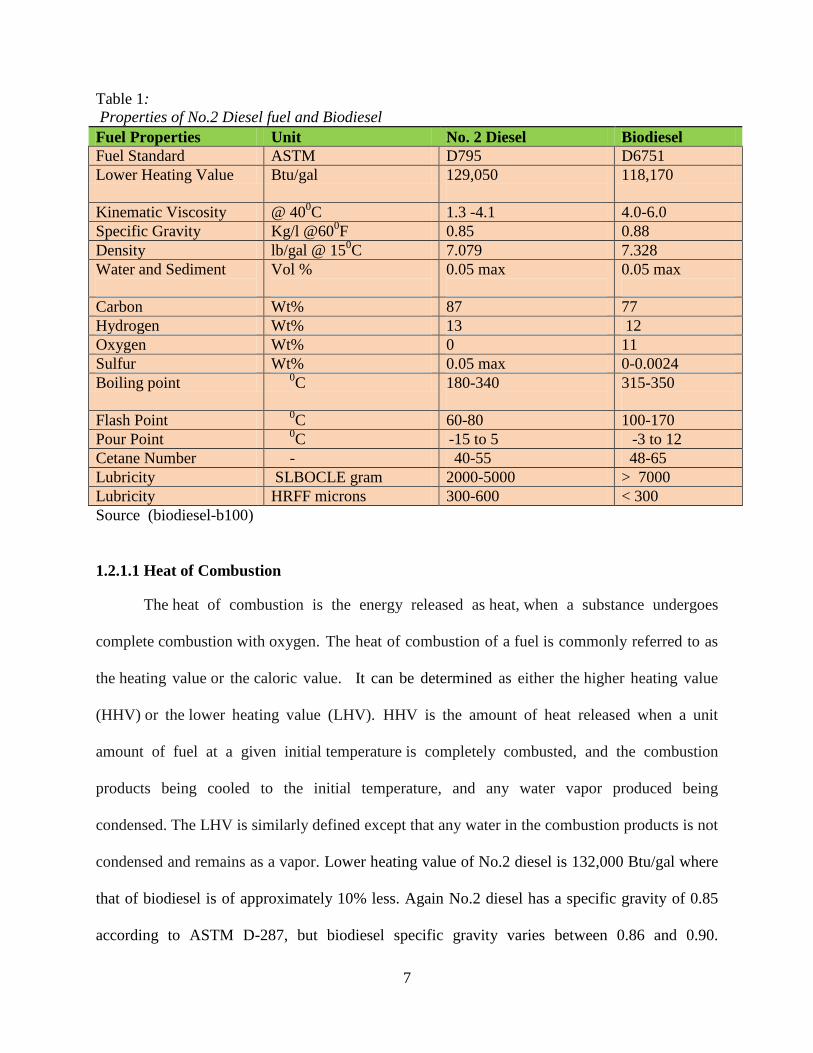
over petroleum diesel (Duffield, Shapouri, Graboski, McCormick, & Wilson, 1998). Table 1
presents properties of biodiesel and diesel fuel (No 2 Diesel fuel). In the distillation process of
crude oil, there are four broad product fraction generated: refinery gas, liquefied petroleum gas,
gasoline and distillate fuels. Distillate fuels are further subdivided according to the temperature
boiling fraction. The lightest or lowest temperature boiling fraction is known as kerosene or No.
1 diesel fuel. The next fraction used in cold weather condition in automotives or trucks is known
as diesel fuel or No.2 diesel fuel or D-2 (EPA, 1999). Table 1 indicates heat of combustion,
ignition quality, flash point, oxidative stability, cold flow, viscosity and lubricity properties
difference between biodiesel and No.2 diesel fuel. These seven key fuel properties are very
important and good indication of fuel quality.
7
Table 1:
Properties of No.2 Diesel fuel and Biodiesel
Fuel Properties Unit No. 2 Diesel Biodiesel
Fuel Standard ASTM D795 D6751
Lower Heating Value Btu/gal 129,050
118,170
Kinematic Viscosity @ 400C 1.3 -4.1 4.0-6.0
Specific Gravity Kg/l @600F 0.85 0.88
Density lb/gal @ 150C 7.079 7.328
Water and Sediment
Vol %
0.05 max
0.05 max
Carbon Wt% 87 77
Hydrogen Wt% 13 12
Oxygen Wt% 0 11
Sulfur Wt% 0.05 max 0-0.0024
Boiling point 0C 180-340
315-350
Flash Point 0C
60-80 100-170
Pour Point 0C -15 to 5 -3 to 12
Cetane Number - 40-55 48-65
Lubricity SLBOCLE gram 2000-5000 > 7000
Lubricity HRFF microns 300-600 < 300
Source (biodiesel-b100)
1.2.1.1 Heat of Combustion
The heat of combustion is the energy released as heat, when a substance undergoes
complete combustion with oxygen. The heat of combustion of a fuel is commonly referred to as
the heating value or the caloric value. It can be determined as either the higher heating value
(HHV) or the lower heating value (LHV). HHV is the amount of heat released when a unit
amount of fuel at a given initial temperature is completely combusted, and the combustion
products being cooled to the initial temperature, and any water vapor produced being
condensed. The LHV is similarly defined except that any water in the combustion products is not
condensed and remains as a vapor. Lower heating value of No.2 diesel is 132,000 Btu/gal where
that of biodiesel is of approximately 10% less. Again No.2 diesel has a specific gravity of 0.85
according to ASTM D-287, but biodiesel specific gravity varies between 0.86 and 0.90.

8
Therefore the volumetric metering of biodiesel results in slightly higher mass of fuel compared
to that of No. 2 diesel. Although a large mass of biodiesel fuel is delivered by the fuel injector,
its energy delivery is lower than that of No.2 diesel (Duffield, Shapouri, Graboski, McCormick,
& Wilson, 1998). Fuel consumption is in general proportional to the volumetric energy density
of the fuel or energy per unit volume of fuel. As biodiesel has lower LHV (lower heating value)
and higher specific gravity, it has lower volumetric energy density, which eventually leads to a
lower mileage range. However, some research claim that energy efficiency based upon the lower
heating value is almost same for No.2 diesel, biodiesel and biodiesel blend (Graboski, M. S.;
McCormick, R. L.; J.D. Ross, 1996).
1.2.1.2 Ignition Quality
A common parameter of ignition quality is the dimensionless Cetane number (CN),
which (for biodiesel) is also affected by hydrocarbon chain length, un-saturation and branching
(F. D. Gunstone, 2007). The Cetane number of a fuel is specified by the ASTM D-613. A
Cetane number implies a shorter time between the fuel injection and the ignition start in the
cylinder. No-2 diesel has CN ranging from 40 to 52. While CN for soybean oil methyl ester
ranges from 44 to 55 that for rapeseed oil methyl ester range from 48 to 61.8. CN for other types
of methyl esters, range from 48 to 60 (Duffield, Shapouri, Graboski, McCormick, & Wilson,
1998). An increasing Cetane Number helps reducing Nox emissions. But higher CN (of above 55
to 60) have small additional positive effect in the reduction of emission (Heywood, 1988).
Highly saturated esters are generally expected to show higher Cetane Number (Graboski, M. S.;
McCormick, R. L.; J.D. Ross, 1996).

9
1.3.1.3 Flash Point
According to the U.S Department of Transportation neat biodiesel (B100) is much safer
than petroleum biodiesel (Biodiesel blend). One of the parameters to assess safety of fuel
handling and storage is flash point. A flash point is the temperature at which mixture of the fuel
vapors and the air above the fuel is ignites. All No.2 diesel fuel has high flash point (from min
540C to 71
0C max) and it is considered safe under normal operating conditions. It is clear from
the definition of flash point that the higher the fuels flash point the less likely it would
accidentally ignite. Therefore, from this point biodiesel is even safer than diesel fuel because its
flash point is typically greater than 1000C (Duffield, Shapouri, Graboski, McCormick, & Wilson,
1998).
1.3.1.4 Viscosity
Viscosity measures the thickness of the fuel and it describes a fluid internal resistance to
flow. It is also a measurement of the resistance of a fluid which is being deformed by either shear or
tensile stress. Viscosity is generally independent of pressure, but liquids under extreme pressure
often experience an increase in viscosity. Like every other fluid, engine oil viscosity varies with
temperature. Based upon the anticipated operating condition of the engine, the viscosity behavior of
engine oil would be specified in advance. In the United States, the organization that sets the
standards for performance of motor oils is the Society of Automotive Engineers (SAE). Oils with
low SAE numbers are generally less viscous or runnier than oils with high SAE numbers, which
tend to be thicker. There are two related measurements of fluid viscosity, known as dynamic (or
absolute) and kinematic viscosity. In most of the engineering application dynamic viscosity
measurement is used.

10
High viscosity of oil may leads to poorer atomization of fuel spray from the fuel injector.
Viscosity is the one of the main reason why vegetable oil or animal fat are converted to biodiesel
through transesterifiction (Knothe & Steidley, 2005). Viscosity of biodiesel is however slightly
greater than that of No.2 diesel. Biodiesel and its blends with petro diesel show the same
temperature dependent viscosity behavior like the pure No.2 diesel.
Additionally, as temperature decreases the viscosity of biodiesel and biodiesel blend
increases faster than that of petro diesel (Van Garpen, September, 1996). The effect of biodiesel
content on the blend viscosity is lower than the prediction by linear combination model (i.e.
according to the volume fraction in mixture). However, B30 soybean or rapeseed methyl ester
exhibits the same viscosity as that of No.2 diesel fuel (Duffield, Shapouri, Graboski, McCormick,
& Wilson, 1998). Table 2 presents the measured typical viscosity of petro-diesel and biodiesel
according to ASTM and EN standard.
Table 2:
Kinematic viscosity in diesel fuel standards
Standards Location Fuel Method
Kinematic
Viscosity
mm2/s
ASTM United
States
Petrodiesel ASTM
D445
1.9-4.1
ASTM United
States
Biodiesel ASTM
D445
1.9-6.0
EN Europe
Petrodiesel ISO
3104
2.0-4.5
EN Europe Biodiesel ISO
3104
3.5-5.0
Source: (Knothe & Steidley, 2005)

11
1.2.1.5 Lubricity
Lubricating properties of the diesel fuel are very important parameters for diesel engine
performance because most of diesel fuel injection systems relied on fuel as a lubricant. In the
fuel injection pump all the moving parts are lubricated by the fuel itself, and not by the engine
oil. Lubricity of the fuel can give an indication of the wear that would occur between two
surfaces in relative motion when covered by the fuel or lubricant.
Before 1993 lubricity of the typical diesel fuel was sufficient to maintain adequate
performance of engines. But after 1993, the use of hydro-treating process changed diesel fuel
composition by primarily reducing fuel sulfur and aromatic components which then reduced
some of the compounds that provided fuel lubricity. This decrease of fuel lubricity can cause
premature equipment breakdown and in some cases even catastrophic failure. The problem
became more dramatic as EPA (Environment Protection Agency) introduced further reductions
in acceptable sulfur levels of the diesel fuel.
Biodiesel typically has higher lubricity than that of reduced sulfur content No.2 diesel.
Although lubricity of typical commercial diesel is acceptable, increased lubricity as that of
biodiesel yields some benefits regarding engine frictional power loss. A premium diesel task
force set up in 1996 by the NCWM (National Conference on Weights and Measure) with the
support from ASTM (American Society of Testing and Materials), analyzed the merit of enhance
lubricity of fuel in diesel engine (Duffield, Shapouri, Graboski, McCormick, & Wilson, 1998).
Lubricity can be measured by Scuffing Load Ball on Cylinder Lubricity Evaluator (SLBOCLE)
or High Frequency Reciprocating Rig (HFRR) test. The addition of biodiesel in the petro-diesel
even in small amount has been showed to produce a significant amount of increase in lubricity.
The Fuel Injection Equipment (FIE) manufacturer adopted the HFRR method and recommend
that all diesel fuel meet a limit of 460 micron wear scar diameter (WSD) (Delphi Diesel System,

12
June, 2000). A typical experimental measurement of WSD of HFRR method for No.1 and No.2
diesel fuel blend is presented in Table 3. For HFRR, a lower wear scar indicates better lubricity.
The detail methods for determining lubricity will be discussed in Chapter 2.
Table 3
WSD (Wear Scar Diameter) of different biodiesel blend
Percent Biodiesel HFRR WSD (micron)
No.2 Diesel
No.1 Diesel
0.0 536 671
0.4 481 649
1.0 321 500
2.0 322 355
20 314 318
100 314 314
Source: (Fuel Fact Sheet)
Therefore, lubricity test shows that a biodiesel exhibit a superior lubricity when
compared to a conventional low sulfur diesel fuel. Blending biodiesel with low sulfur diesel at
0.4 percent or higher percentage significantly improves fuel lubricity quality.
1.2.2 Biodiesel Limitations
Although biodiesels present big advantages for the environment and they are able to
substitute a portion of fossil fuel use, there are still some major limitations for the massive use of
biodiesels. The main limitations are a lower energetic yield and higher production cost.
Energetic yield represent the ratio of all energetic inputs for biodiesel production such as crops,
cultivation, transport, transformation etc. to the all outputs (that is fuel and by product). For
example, energetic yield of biodiesel from soybean is 3.2. This means that for every unit of
energy used in the production of biodiesel, 3.2 unit of energy needs to be harvested (Pavesi &
Fauchet, 2008) .
13
Engines fueled by biodiesel have a 10% reduced fuel economy and power as compared to
those of diesel fuel vehicles. The biodiesel fueled engine also emits more nitrogen oxide than
diesel fuel (Edwards, 2009) .
Another consideration is fuel price. Biodiesel are not yet economically competitive.
Storage, transportation and handling require special management .Biodiesel also have good
solvent properties which can be a problem for engines which are running for long time.
1.3 Purpose of the Research of This Thesis
At present biodiesel is already being used as diesel engine fuel in most of diesel engines
without any major modification of engine, engine materials or engine oil. It is used as B100
(100% biodiesel) or in a blend with the diesel fuel. Although biodiesel is proved to be an
energetically alternative to diesel engine fuel, in some aspects, especially in its chemical
composition and fuel properties, biodiesel has some differences as compared to the regular petro-
diesel fuel. For instance, biodiesel has lower LHV (lower heating value), higher kinematic and
dynamic viscosity and higher specific gravity than those of regular petro diesel.
In a typical diesel engine some degree of engine oil dilution is expected. The reasons and
the processes of engine oil dilution will explained in chapter 2. Engine oil performance is a very
important factor regarding engine wear and frictional power loss. When biodiesel is used as
blend with the regular petro diesel there may be some changes regarding lubricity of the fuel,
which may depend upon the feedstock employed for biodiesel or corresponding fatty acid
components. As with regular petro-diesel fueled engines, biodiesel or biodiesel blend fueled
engines also have some degree of engine oil dilution problem. The purpose of this study is to
investigate effects of both vegetable and animal fat feedstock biodiesels on the engine oil, in

14
terms of lubricity, wear protection properties and oxidative stability of biodiesel diluted engine
oil.
1.5 Overview of the Thesis
Chapter 2 contains the theory behind engine wear, engine oil dilution and methods for
laboratory estimation of wear. This chapter also contains some literature review about the effects
of engine oil dilution by biodiesel and effects of biodiesel components on the diluted engine oil.
Chapter 3 describes the experimental methodology and employed equipments. The description of
sample making and surface finishing processes is also included in this chapter.
Chapter 4 presents the experimental results and their discussion and chapter 5 includes
conclusions and future research directions.

15
CHAPTER 2
LITERATURE REVIEW
2.1 Introduction
Biodiesel has become an attractive alternative renewable source of energy. According to
the National Biodiesel Board of US, from 1999 to 2008, biodiesel production increased from
500,000 gallons to 700 million gallon. Figure 5 present the annual increment of the biodiesel
production from 1999 to 2009 (Scott, 2009). Because of this increased use of biodiesel, it is
essential to determine the impact of biodiesel on critical operation points of diesel engines.
Figure 6 presents the interaction path of engine fuel with the engine lubricant. There are
significant differences in composition between biodiesel and petroleum diesel fuels which have
the potential to influence, for instance, ash emissions and thereby affecting after-treatment
system performance. Although it is true that biodiesel can be used in diesel engine with no
modification, no separate fuel tank or no heat exchanger but still yields acceptable engine
performance. Engine oil dilution effect on engine frictional and wear patterns and on emissions
are still under investigation.
The fuel also interacts directly with the lubricant through fuel dilution, and may impact
lubricant properties ( (Sappok & Wong, April 2009). The currently used engine oils produced
from mineral hydrocarbons were mainly developed for low sulfur standardized hydrocarbon fuel.
The main impact to engine oils by biodiesel compounds can occur from oil dilution by the fatty
acid methyl ester (FMAE) and the oil thickening by oxidation of the diluted biodiesel. In this
chapter engine oil dilution with biodiesel and its consequences on the lubricity properties of

16
engine oil, lubricity properties of biodiesel with the diesel fuel base oil, friction and wear on
reciprocating surfaces will be discussed.
Figure 5: Biodiesel productions in US from 1999 to 2009.
(Scott, 2009)

17
Figure 6: Overview of Engine Fluid Interaction.
(Gili, Igartua, Luther, & Woydt, January 2010)
2.2 How Engine Oil Works
Engine oil primarily provides for the lubrication of the engine moving parts. Figure 7
presents the elements of the lubrication circuit and flow path of oil in a typical engine.
Lubricants are designed to reduce the friction between the surfaces that are or could be in contact
with one another, which could cause wear at the contact point and they also hydro-dynamically
separate the parts in relative motion. Along with the friction reduction modern diesel engine oil
performs as a coolant, a cleaning agent and a sealant.

18
Figure 7: Lubrication Circuit and Flow Path of Oil in Engine
(Bennett, 2009)
Engine oil forms a film between the moving surfaces. The friction occurs in the oil itself
preventing direct metal to metal contact. This phenomenon is known as fluid friction. Engine oil
perform its lubricating action in two ways: (Bennett, 2009)
1. Thick Film Lubrication: It occurs when the distance between two moving surface are
wider, such as between rotating crankshaft and its main bearing. This lubrication is also
known as hydrodynamic lubrication. Figure 8(a) presents the film thickness pattern of
hydrodynamic lubrication.
2. Boundary lubrication: It occurs when metal to metal surface distance are very narrow
such as those between crankshaft and its main bearing when engine is not running or

19
during start and ideal periods. Boundary lubrication occurs when the lubricating film is of
about same the thickness as that of the surface roughness. Figure 8 (b) presents the film
thickness pattern of boundary lubrication. For a hydrostatic or hydrodynamic bearing
this operating regime is undesirable, but during start-up, shutdown and low speed
operation, the engine is in this boundary lubrication condition.
a: hydrodynamic lubrication b: boundary lubrication
Figure 8: The two typical lubricating condition of oil film formation (Bennett, 2009)
2.3 Engine Friction and Wear
Diesel engine achieves a high fuel efficiency, which can approach to 50%.This means
that 50% of heat of the combusted fuel is converted into useful work. Although most of the
energy is dissipated due to inherent thermodynamic limitations, still 5% of the combustion heat
and approximately 10% of the potential useful power are lost due to mechanical loss (Dardalis,
2004). Various internal resistances determine the mechanical power loss of the diesel engine.
About 70% of the mechanical power loss of the engine is due to frictional power loss. Power loss
due to friction between piston and position rings is approximately 50-60% of the engine
frictional loss (Macartchouk, 2002). Loss due to friction in crankshaft bearings is 30-35% of the

20
frictional loss and loss due to friction in inlet/outlet distributing system is 10-12% of total engine
frictional loss. Therefore, the greatest frictional loss happens between piston and piston rings.
Decrease the frictional loss is one of the main concerns of engine tribological design.
Figure 9: Distribution of total mechanical loss in a typical diesel engine.
(Comfort, 2003)

21
Figure 10: Typical Stribeck curve (Comfort, 2003)
Engine friction can be generally classified into two groups. First one is Coulomb Friction
or Dry Friction: This friction occurs when asperities come into contact between two relatively
moving surfaces. Second one is Fluid Friction: This occurs when adjacent layers of fluid are
moving at different velocities. In real cases it is very difficult to assign an actual degree of engine
friction to either group, instead each friction component lies somewhere in between these two
categories of friction, and for engine friction there is a continuum between dry and fluid
frictions. This continuum depends upon component geometry, surface roughness, and relative
velocity of the moving surface, normal loads and various rheological properties of lubricant. This
continuum approach can be expressed by the Stribeck curve. Figure 10 presents the regime of
lubrication as described the Stribeck curve. Stribeck curve was initially developed for journal
bearing studies but the result of those studies can be extended to other lubricated systems.

22
2.3.1 Piston Ring Assembly Friction (PRA)
Piston ring assembly consists of piston ring, skirt and cylinder liner .The primary role of
the PRA is to maintain the effective gas seal between combustion chamber and crankcase. It also
transfers heat from the piston to the cylinder wall and it limits the amount of oil transported from
crankcase to combustion chamber.PRA should perform all these three tasks with minimum
frictional power loss at the sliding interface with the cylinder wall, and with minimum wear.
PRA friction was discussed using different theories and mathematical expression, which were
based on experimental results and simulations. Velocity of the piston relative to cylinder liner
can be modeled as a general plane motion and it plays important role to transfer momentum to
the lubricating fluid film. According to the Stribeck curve this relative velocity is also a major
factor to determine the lubricating regime of PRA.
Figure 11:2-D Model of Piston and Crank-throw assembly (Comfort, 2003)
Figure 11 presents the model of piston and crank-throw assembly. The distance from the
main journal center line to the piston pin can be expressed as:

23
y= l cosθ + r sin φ 2. 1
And the relative velocity of piston with respect to linear can be expressed as
v = - lθ′sinθ + rφ′sinφ 2.2
The type of friction occurring in the PRA can be predicted from the velocity profile of the
piston. By comparison with the Stribeck curve, when piston velocity is zero both at top dead
center (TDC) and bottom dead center (BDC) as presented in Figure12, lubricant regime would
be boundary and some asperity contact would occur. When the piston velocity reaches the
maximum, lubricant regime would be hydrodynamic. Any point in between these two extreme
points would go to a transition from mixed lubrication to hydrodynamic lubrication.
Figure 12: Relative Velocity of Piston with respect to Liner vs. Crank angle at 1800 rpm.
(Comfort, 2003)
2.3.2 Factors for the Modeling of Diesel Engine Friction and Wear
There are six main factors whose effects must be addressed while performing the
laboratory scale tests of engine lubricants and wear. Most of the factors, which are presented in
Figure 13, are interrelated. Therefore, the change of one factor may affect the several other

24
factors. This complexity makes it difficult to conduct friction and wear experiments with one
controlled independent variable while considering everything else as constant.
Figure 13: The factors that must be considered for developing accurate simulation of friction and
wear in diesel engine.
Besides contact stress, relative motion, stiffness and damping capacity of the system is
also considered important mechanical factors in friction and wear modeling. Under rubbing
contact, chemical reactivity also change due to compound formation in the lubricant. But this
chemical reactivity strongly varies with temperature and also third body particles need to
consider. In abrasive wear, some particle is removed from the surface and this wear particles at

25
the interface need to be considered as third bodies. Lubricant chemistry, film thickness,
lubrication regime, and surface tribo-chemistry may play an important role for modeling engine
friction and wear. These factors are again strongly affected by engine oil characteristics.
Therefore, to model engine friction and wear, engine oil dilution or change of lubricity
property, chemical properties and corresponding interactions with the surface play very
important roles.
2.4 Engine Oil Contamination by Diesel Engine Fuel
Engine oil contamination can be one main reason of early oil degradation and of eventual
engine cessation. Engine oil can become contaminated when unburned or incomplete burnt fuel
blows by through the piston rings and ends up in the crankcase. The presence of fuel in the
crankcase can reduce oil viscosity and attenuate detergency or additives performance. Frequent
engine starts, excessive idling and cold running conditions can lead to moderate and acceptable
fuel dilution. Some fuel dilution is always expected and basically 0.36 percent of the total fuel
consumption ends up in the crankcase (Fitch, 2007) in a typical engine. Figure 14 presents the
flow path of engine fuel towards the crankcase.

26
Figure 14: Basic path of the blow by of partially burn fuel as it enters the engine crankcase.
(Schwaller, 2005)
In four cycle diesel engines more than four percent of fuel dilution in oil is considered
abnormal (U.S Oilchek). Fuel dilution above this percentage indicates that a potential problem
may occur with injectors, fuel pumps, gaskets or seals. Faulty operation of fuel system then may
lead to excessively rich mixture and defective pressure regulator, poor combustion, bad timing or
worn piston. Leakage of oil/fuel heat exchanger may also cause the fuel to enter into the
crankcase (Schwaller, 2005). In some newer model diesel engines, late post- injection method is
used as a strategy of emission control but it is also can creates more oil dilution.
Engine oil contamination can be detected in the laboratory by three methods: Viscosity,
flash point and gas chromatography. Viscosity of the contaminated oil can drop, but sometimes
fuel soot level and oil oxidation can nullify such viscosity reduction effect. Measurement of flash
27
point of the oil is better way to determine the percentage of fuel contamination. The most
accurate method of quantitative measurement of oil dilution is gas chromatography (Booser,
1994).
2.5 Primary Cause of Engine Oil Dilution by biodiesel
Some limited engine oil dilution by diesel engine fuel is acceptable and it happens in all
engines. But when the engine is fueled by biodiesel or biodiesel blend then engine oil dilution
rate and its effect can be different than those from the regular diesel fuel. Gili at el. (Gili F. ,
Igartua, Luther, & Woydt, 2010) discussed three reasons that are responsible for the biodiesel
dilution in the engine oil.
1. Compared to the equi-viscous hydrocarbons (diesel fuel), ester fluids (biodiesel) have
more penetrating and solvencies properties. These properties lead to more unburned
biodiesel fuel dilution in the engine oil.
2. Today most of the diesel engines with DPF (Diesel Particle Filters), use filter generation
system. This system involves a periodic injection of small quantity of a fuel with the burn
fuel in order to increase the exhaust temperature and to burn-off all the unburned carbon
at exhaust. This procedure increases the dilution of unburned biodiesel fuel in the engine
oil.
3. The distillation temperature of the biodiesel is shifted by about 1000C lower than the
diesel fuel, therefore it tends to accumulate in the engine oil and it leads to a long term
dilution.
28
2.6 Problems Associated with Engine Oil Dilution by Diesel Engine Fuel
Service properties of the engine oil may change or sometimes oil can lose its working
capacity when contaminated by fuel. Problems associated with engine oil dilution are (Fitch,
2007):
In cold operating conditions, engine oil dilution can create wax which eventually leads to
low oil pressure and to starvation during start up conditions.
Fuel dilution can cause reduction of engine oil viscosity and have a detrimental effect on
the critical oil film thickness. This results in premature combustion-zone wear and
crankcase bearing wear.
High fuel dilution changes the concentration of engine oil and their effectiveness. Figure
15 presents a typical viscosity degradation of engine oil with the increase of fuel dilution
percentage.
If the fuel dilution is caused by a faulty fuel injector, it can wash-down cylinder liner oil.
This may lead to piston ring, piston and cylinder wear. It can also increase blow-by and
fuel consumptions.
Engine oil diluted by biodiesel fuel can create some additional problems such as
oxidation stability; filter plugging, deposit formation and crankcase accumulation.

29
Figure 15: SAE viscosity rating decrease as the percentage of fuel contamination of the
engine oil increase (Schwaller, 2005).
2.7 Methods for Determining Lubricity of the Engine Fluid
Lubrication properties are important parameters that determine engine wear and frictional
properties. Lubricity test assess frictional properties of the fluid. There are three types of test to
evaluate the lubricity of engine fluid (Knothe, Gerpen, & Krahl, The Biodiesel Handbook, 2005):
Vehicle Tests,
Fuel Injection Equipment Tests, and
Laboratory Tests.
Most type of vehicle test and fuel injection equipment test need 500-1000hr of closely
monitored operation, and are expensive and lengthy. Laboratory test methods are of low cost,
faster moreover able to give accurate evaluation (Munson & Hetz, 1999). There are several
standard laboratory test methods available to evaluate lubricity:
Munson Roller in Cylinder Lubricity Evaluator (M-ROCLE)
Scuffing Load Ball On Cylinder Lubricity Evaluator( SLBOCLE)
Ball On Cylinder Lubricity Evaluator (BOCLE)
High Frequency Reciprocating Rig.(HFRR)

30
Optimol Reciprocating Rig( SRV)
Pin-on-disk Tribometer
The BOCLE and SLBOCLE test devices press a steel ball against a steel rotating ring
which is partially immerse in the test fluid. A load is applied until a scuff mark is seen on the
rotating cylinder. The gram of load or force is needed to produce a scuff is recorded. In the
United States EMA (Engine manufacturer’s Association) suggested use of SL-BOCLE test with
minimum 3100g load. Figure 16 presents the schematic experimental setup of the SL-BOCLE
test.
Figure 16: Basic Schematic of SLBOCLE (Garpen, 2004)
HFRR (High Frequency Reciprocating Rig) is the most widely used method and it
consists of a reciprocating friction and wears measurement system. This test setup includes a ball
which is oscillating with a 1mm stroke length and a 200g load applied on the ball. After 75
minutes of contact, the worn spot of the steel ball is measured with a 100X microscope. The

31
width of the spot diameter (WSD) directly relates to lubricating properties of the fluid being
tested. The WSD (Wear scar diameter) value of HRFF test of different biodiesel blends is
presented in Table 3 of section 1.2.1.5. Figure 17 presents the basic schematics and working
principle of High Frequency Reciprocating Rig test.
Figure 17: Basic Schematics of HFRR test method. (Garpen, 2004)
In the SRV (Optimol Reciprocating Rig) test method a 10 mm steel ball is sliding against
a 25 mm diameter disk, in an off-center mode. Disk and ball are flooded by fuel or oil in the
contacting surfaces. Ball is loaded in an incremental sequence. Frequency and stroke of the
sliding ball can be changed. The friction between the ball and disk results in a torque which is
exerted on the disk. Based on the torque, frictional coefficient can be determined. Figure 18
presents the basic schematic and working principle of SRV (Optimol Reciprocating Rig) test
method.

32
Figure 18: Schematic layout of Optimol SRV machine (Burger, 2006).
Another bench test method is M-ROCEL (Munson Roller in Cylinder Lubricity
Evaluator). It employs a crossed roller on cylinder geometry and a data acquisition system. A
vertical load is applied on the test roller through the test cylinder under the test fluid lubrication
conditions. The wear scar area produced on the roller is determined by using an optical
microscope and is approximated by the area formula of an ellipse. The wear scar area stress is
also measured and divided by the theoretical Hertzian contact stress and frictional coefficient, to
obtain a dimensionless Lubricity Number (LN). This LN is the indication of lubricity of the
tested fuel. When LN is greater than 1.0 for the tested fuel, it is considered to have sufficient
lubricity. In Figure 19 basic schematics of M-ROCEL (Munson Roller in cylinder Lubricity
Evaluator) test method is described.

33
Figure 19: Load unit schematic of M-ROCEL method.(Totten, 2001)
A classical device to measure the friction coefficient under the well defined load is the
pin-on-disk tribometer. In this device, a disk is rotating while its surface is scratched by a pin
under the test oil lubricating conditions. In this tribometer, the tangential friction force is
determined between pin and the rotating disk. Load on the pin is controlled and represents the
normal friction force of the friction joint at static condition. The pin is mounted on a stiff lever
and tangential frictional force may be determined by the deflection of the lever (Jürgen Butt,
Graf, & Kappl, 2003) and deflection of the lever is proportional to tangential friction force at
friction couple which is measured by the displacement sensor touched the stiff lever arm. Wear
coefficient can be determined after the test by the weight loss of either from pin or of the disk.
These two parameters, frictional force and wear are important indications of lubricity of the oil.
The research work of this thesis uses a pin-on-disk tribometer to determine the lubricity of
biodiesel and mixtures of biodiesel with engine oil. The details of the employed tribometer are
described in Chapter 3. Figure 20 presents the basic schematics of pin-on-disk tribometer.

34
Figure 20: Basic schematics of pin-on-disk tribometer (Jürgen Butt, Graf, & Kappl, 2003)
2.8 Literature Review on Lubrication Property Studies of Biodiesel Due to the
Presence of Bio-Components and its Blending with Diesel Fuel
Biodiesel is defined as a mono-alkyl ester of vegetable oil and of animal fat. Among the
fuel properties of biodiesel, viscosity and lubricity are the most important to this research work.
Lubricity of the biodiesel strongly depends upon the tranesterification process, fatty acid
composition and alcohols.
Jianbo Hu and Zexue (Hu & Zexue Du, 2005) made a study on the lubrication properties of
biodiesel. In that research, a series of FAME (Fatty Acid Methyl Ester) were synthesized from
corn oil, sunflower oil, canola oil, and soybean oil and then they were refined by distillation at
reduced pressure and high temperature. In Figure 21 a typical chromatogram of biodiesel is
presented. Table 4 presents the percentage of ME (Methyl ester), MG (Monoglycerides), DG
(Diglycerides), TG (Triglyceride) and acid value of biodiesel from different vegetable feedstock.
Evaluation of the lubrication properties of the refined and unrefined biodiesel was done by
measuring the wear scare diameter (WSD) of the HFRR (High Frequency Reciprocating Rig)
test. They also find the effects of MG (Monoglycerides), DG (Diglycerides), TG (Triglyceride)

35
and FFA (Free Fatty acids) on the lubricity properties of biodiesel. The result of this research
indicates that unrefined biodiesel significantly reduces WSD (Wear scar diameter) when it was
used with diesel base oil as compared to refined biodiesel. They concluded that FFA profile was
same for both refined and unrefined biodiesel and that MG, DG and TG are the most probable
compounds that enhance the lubrication properties of unrefined biodiesel.
Figure 21: A Typical Chromatogram of Biodiesel.
(Hu & Zexue Du, 2005)

36
Table 4
Composition and Acid value of Biodiesel
Refined
Canola
Biodiesel
Sunflower
Biodiesel
Corn
Biodiesel
Canola
Biodiesel
Soybean
Biodiesel
Refined
sunflower
Biodiesel
Methyl
Esters
(w/w%)
96.46 94.88 96.19 96.70 98.00 98.00
Mono-
glycerides
(w/w%)
0.34 0.27 0.35 0.49 ND ND
Diglycerides
(w/w%)
0.46 0.37 0.20 1.10 ND ND
Triglyceride
(w/w%)
0.44 1.64 0.78 ND ND ND
Acid Value
(mg
KOH/g)
0.14 0.21 0.20 0.18 ND 0.30
(Hu & Zexue Du, 2005)
Kulkarni at el. (Kulkarni, Dalai, & Bakhshi, 2007), investigated the impact of
transesterification processes on the lubricity characteristics of biodiesel. In their work they use
canola vegetable oil which underwent transesterification with methanol, ethanol and various
mixture of methanol/ethanol, keeping the molar ratio of oil to alcohol 1:6, and using KOH as
catalyst. They found that the rate of transesterification with mixed alcohols was faster than that
for pure methanol and the lubricity of the base oil was better when added 1 %( by vol) of ethyl
ester as compared to methyl ester. They also carried out a lubricity test of purified ME (Methyl
ester), EE (Ethyl ester), MEE (3:3) (Methyl-ethyl ester obtained by the reaction of vegetable oil
with methanol and ethanol by a molar ratio 3:3) and MEE (4.5:1.5) by HFRR and they concluded
that lubricity of MEE (3:3) (Methyl ethyl ester with molar ratio 3 to 3) was better than that of
pure ME (Methyl ester).

37
Figure 22: Wear Scar at 1% volume addition of ester to base fuel observed by HFRR.
(Kulkarni, Dalai, & Bakhshi, 2007)
Knothe and Steidley (Knothe & Steidley, Lubricity of Component of Biodiesel and
Petrodiesel, 2005) investegated the influence of kinematic viscosity factor in the biodiesel fuel
components. In their research they used both straight-chain-ester and branched-esters.They used
NMR(Nuclear Magnetic Resonance Spectroscopy) to conform the chain structure of esters, and
to determined the kinematic viscosity they used Cannon-Fatenske viscometer.Their results
indicate that chain length, position , number,nature of double bonds and nature of oxygenated
moieties ( oxygenated functional group of the ester molecule) greatly influence the kinematic
viscosity fatty acid and it also affects the resulting ester of the biodiesel.
Wadumestheige et al. (Wadumestheige, Ara, Salley, & Simon Ng, 2009) investigated the
effect of minor components of biodiesel such as FFA(Free Fatty acids), glycerol, phospholipids
and antioxidants. They use ULSD(Ultra Low Sulfur Diesel) and S8 (Synthetic fuel blend) as
base oils and the HFRR(High Frequency Reciprocating Rig) method for lubricity test .They also
determined the temperature effects on biodiesel lubricity and boundary film formation. Their

38
results indicated that residues of biodiesel (e.g.unrefined biodiesel) showed better lubricity than
those of distilled biodiesel. The presence of minor components such as FFA(Free Fatty acids),
glycerol, antioxidant, palmitic acid, tecopherol and asolectin also reduced WSD (Wear scar
diameter) by 55% in HFRR(High Frequency Reciprocating Rig.) test, while distilled biodiesel
reduced 29% the WSD for the ULSD blend . Figure 23 presents effects of all minor components
on HFRR test. For a 2% blend of SBO(Soybean oil biodiesel) in ULSD, Wadumestheige et al.
found that WSD increased as the temparature increased up to 700C . However, at higher
temperature the molecular motion of the polar components would increase enough to distribute
them on the metal surfaces and then enhance the lubricity while decreasing WSD. Figure 24
presents effect of the presence of the residue and distilled biodiesel from different sources in
ULSD(Ultra Low Sulfur Diesel).
Figure 23: Lubricity effect of different type of minor component.
(Wadumestheige, Ara, Salley, & Simon Ng, 2009)

39
Figure 24: Lubricity of the residue of different distilled biodiesel. (Wadumestheige, Ara, Salley,
& Simon Ng, 2009)
Sulek at el. (Sulek, Kulczycki, & Malysa, 2010) made an assessment of tribological
properties of the composition of diesel fuel and methyl ester derived from rapeseed oil. That
study was carried out for steel-steel pairs with HFRR (High Frequency Reciprocating Rig.) test
method. After 75 min tests with a 2N load in presence of 5% methyl ester (%Vol) in diesel oil as
base oil they found that friction coefficient decreased by 20%. Their results are presented in
Figure 25 and indicate that a further increase of methyl ester content decreases frictional
coefficient, and that B100 exhibit a 30% lower friction coefficient than that of diesel fuel. They
also characterized wear scar profile by using TOPO L50 profilometer which is presented in
Figure 26.

40
Figure 25: Friction coefficient change with the change of methyl ester concentration in the
diesel fuel. (Sulek, Kulczycki, & Malysa, 2010)
.
(a) (b)
(c)
Figure 26: (a) Depth of Wear Scar by B5. (b) Depth of Wear Scar by B30. (c) Depth of Wear
Scar by B100. (Sulek, Kulczycki, & Malysa, 2010)

41
Sulek at el. also found that 5% (% vol) presence of methyl ester (B5) in diesel oil reduced
the depth of wear scar as compared to that of pure diesel fuel oil. After that, an increase of
methyl ester concentration caused an increase of depth of wear scar. At 20 %( B20), 25 %( B25),
30% (B30) concentration of methyl ester in the diesel fuel showed the high depth of wear scar
than the pure diesel fuel.
2.9 Literature Review on Lubrication Properties of Biodiesel Diluted Engine Oil.
Engine oil dilution effect by biodiesel needs to be investigated. Biodiesel has lower
distillation temperature and boiling point and tends to dilute the engine oil even at the small
percentage in the fuel. This section reviews previous experimental work from available literature
on the effects of biodiesel dilution of engine oil.
A recent research done by Thornton et al. (Thornton, Alleman, Luecke, & McCormick,
June, 2009) at the National Renewable Energy Laboratory evaluated the biodiesel fuel blend
effect on oil dilution and associate engine performance. A 4 cylinder 2.15L high speed direct
injection (HSDI) diesel engine was used as test cell and run by a 20% blend of soy-derived
FAME with ultra low sulfur diesel fuel (ULSD). The base engine oil used for the study was CJ-4
oil. After the test run of the engine the engine oil was examined for the presence of FAME and
viscosity. Total base number (TBN) and total acid number (TAN) was also determined. Along
with engine oil analysis, bearing, piston and PRA were inspected for signs of excessive wear.
The result showed that viscosity decreased with increased oil age and increased with fuel
dilution. TBN of the engine oil decreased sharply with the increase of oil dilution while TAN
increased slightly. Iron content in the oil also increased with the time. The researcher concluded
that biodiesel in the engine oil caused oxidation which produced acid and a reduction in TBN. At
42
the end of test, the engine was disassembled and none of the moving components showed signs
of excessive wear or other signs of deterioration.
Agarwal at el. (Agarwal, August, 2006) carried out a detailed investigation to assess the
wear effect on engine using biodiesel fuel. They investigated the effects of long term engine
operation on engine wear for a 20% blend of LOME (Linseed Oil Methyl Ester). In their
research, an engine was run for 32 cycles, each of 16hr of continuous running and engine oil
samples were collected after each 128hr of running. After the completion of the test, the engine
was disassembled for physical inspection of the wear of moving parts. The results of the
investigation, which are presented in Figure 27, 28, and 29, indicated that the lowering of engine
oil viscosity was lower in case of biodiesel-fueled system as compared to that of diesel fuel
system. Agarwal at el. concluded that for biodiesel fueled engine, oil dilution was lower than that
of diesel fueled engine. The quantitative analysis in their research showed that an ash content,
which mainly represents the wear debris, was found to be less for biodiesel fueled engine. By use
of atomic absorption spectroscopy on the engine oil they found that biodiesel fuel led to lower
amount of metallic debris such as Fe, Cu, Zn, Mg, Cr, Pb and Co. This metallic debris originated
from various the moving parts of the engine. Figure 29 & 30 presents the amounts of metallic
debris in engine oil for both biodiesel and diesel fueled engine. The physical investigation and
oil analysis indicated that wear of the various vital parts reduced up to 30% because of the
additional lubricity properties of biodiesel.

43
Figure 27: Kinematic Viscosity change of engine oil at 40◦C for B20 and Diesel Fuel. (Agarwal,
August, 2006)
Figure 28: Kinematic Viscosity change of engine oil at 100◦C for B20 and Diesel Fuel.
(Agarwal, August, 2006)

44
Figure 29: Ash content in the Engine oil for B20 and Diesel Fuel. (Agarwal, August, 2006)
Figure 30: Iron content in the Engine oil for B20 and Diesel Fuel (Agarwal, August, 2006)
Fang and Yamaguchi (Fang, Whitacre, Yamaguchi, & Boons, 2007) carried out an
extensive study on a biodiesel contaminated engine oil by Electrical Contact Resistant (ECR),
High Frequency Reciprocating Rig(HFRR) and Four-ball test. Their research showed that
partially oxidized biodiesel components competed with the typical oil anti-wear additives,
mainly with ZDDP (Zinc Dialkyl Dithio Phosphate).They studied a complex formation between
oxidized biodiesel component and the ZDDP with FTIR (Fourier Transform InfraRed
spectrometer) and P-NMR (Phosphorous 31 Nuclear Magnetic Resonance) techniques. The
45
result of their study showed that FAME fuel dilution had a negative impact on engine oil
performance when methyl esters partially degraded and interacted with the ZDDP anti-wear
additives. Even though fresh biodiesel (Fresh methyl ester) may have some potential benefits for
engine oil, such as higher intrinsic lubricity and acting as friction modifier. Based on the bench
wear test and spectroscopic studies they concluded that engine oil dilution with the aged
biodiesel increased wear up to concentration of 5% while fresh biodiesel actually decreased
wear.

46
CHAPTER 3
METHODOLOGY
3.1 Introduction
This chapter presents experimental setup, instruments and data collections methodology.
The details of main experimental instruments (pin-on-disk tribometer), its calibration process,
and problems associated with data collections and the implemented solutions are discussed.
Information about testing parameters, measuring process and measuring equipments are also
provided.
3.2 Overview
The research work of this thesis intended to observe the effects of engine oil dilution with
biodiesels from canola oil, soybean oil, peanut oil and chicken fat feedstock. Engine oil (15W
40) is diluted with known percentages of biodiesel from these four different feedstock and the
changes of dynamic viscosity and lubricity performance of diluted engine oil are being observed.
Lubricity is assessed in terms of the frictional force between metal surface contacts, under the
diluted engine oil lubricating conditions with a pin-on-disk tribometer.
The effects of the biodiesel diluted engine oil are observed on AISI 1018 steel made
rotating disk which is in contact with AISI 316 stainless steel ball. The steel disks are made from
a 1” diameter round steel bar, cut by a horizontal lathe. A sequence of polishing stages with files,
surface grinder and emery paper are applied on the steel disk to obtain a mirror like polished
surface. This polished steel disk is subsequently cleaned in an ultrasonic cleaner bath with a
standard cleaning solution. Cleaning procedure is described in section 3.8.
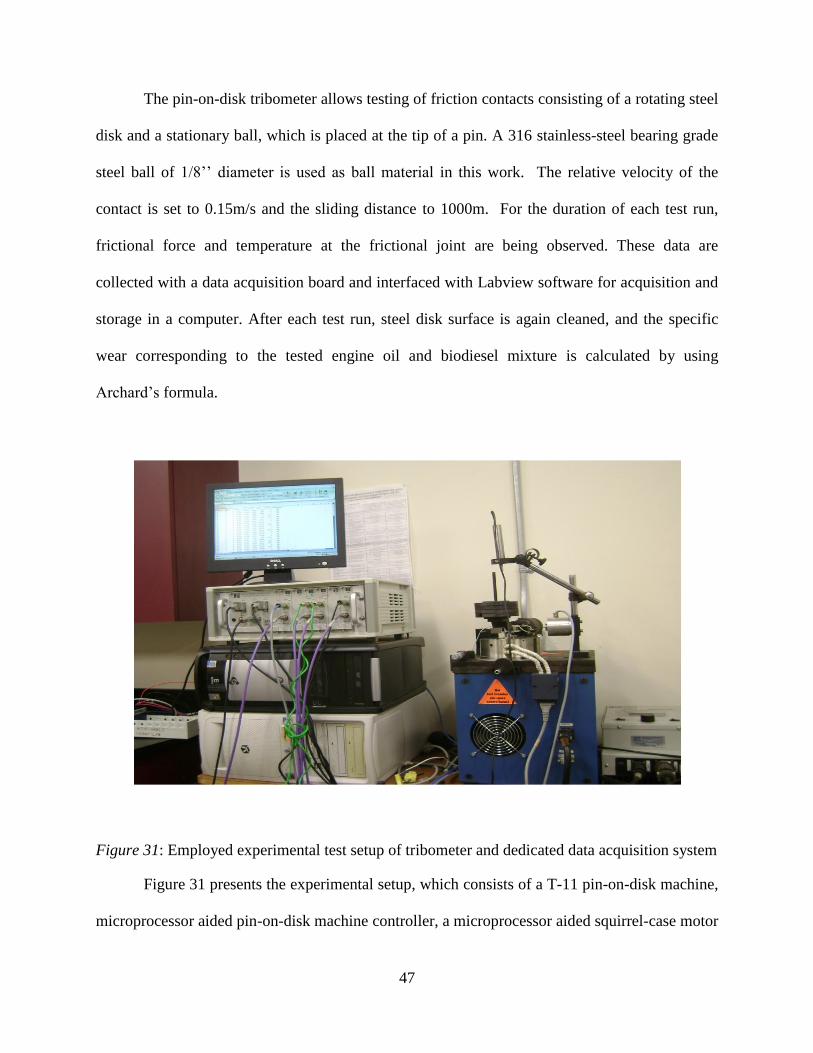
47
The pin-on-disk tribometer allows testing of friction contacts consisting of a rotating steel
disk and a stationary ball, which is placed at the tip of a pin. A 316 stainless-steel bearing grade
steel ball of 1/8’’ diameter is used as ball material in this work. The relative velocity of the
contact is set to 0.15m/s and the sliding distance to 1000m. For the duration of each test run,
frictional force and temperature at the frictional joint are being observed. These data are
collected with a data acquisition board and interfaced with Labview software for acquisition and
storage in a computer. After each test run, steel disk surface is again cleaned, and the specific
wear corresponding to the tested engine oil and biodiesel mixture is calculated by using
Archard’s formula.
Figure 31: Employed experimental test setup of tribometer and dedicated data acquisition system
Figure 31 presents the experimental setup, which consists of a T-11 pin-on-disk machine,
microprocessor aided pin-on-disk machine controller, a microprocessor aided squirrel-case motor

48
speed controller, data acquisition board and a computer, which is interfaced with both controller
and data acquisition board.
3.3 Pin-On-Disk Tribometer
The employed pin-on-disk tribometer can be used to assess tribological properties of
lubricants and the engineering materials used for the friction couple in sliding contact. This
instrument is specially used to determine the wear factor, specific wear or wear resistance of the
tested pair of materials in the presence of different type lubricants, sliding velocity and applied
load. The tribometer used in this work is a T-11 pin-on- disk tribometer, designed and
manufactured by the Institute for Sustainable Technologies, National Research Institute in
Radom, Poland. This tribometer has two units, mechanical unit and measuring or control unit,
which are described below.
3.3.1 Mechanical Unit of Pin-On-Disk Tribometer
The mechanical unit of pin-on-disk tribometer consists of the following assemblies:
Body,
Table,
Driving unit,
Friction couple loading unit,
Specimens holding assemblies,
Test chamber,
Track radius changing mechanism,
Force Transducer unit, and
Displacement transducer unit.
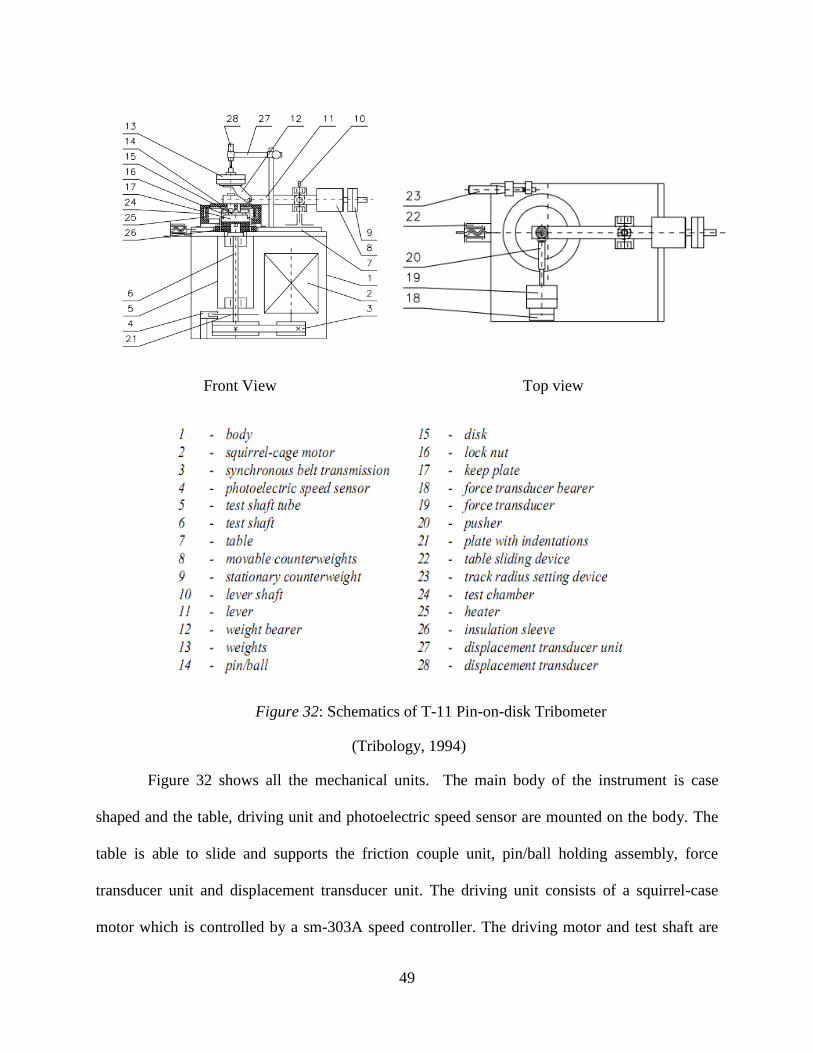
49
Front View Top view
Figure 32: Schematics of T-11 Pin-on-disk Tribometer
(Tribology, 1994)
Figure 32 shows all the mechanical units. The main body of the instrument is case
shaped and the table, driving unit and photoelectric speed sensor are mounted on the body. The
table is able to slide and supports the friction couple unit, pin/ball holding assembly, force
transducer unit and displacement transducer unit. The driving unit consists of a squirrel-case
motor which is controlled by a sm-303A speed controller. The driving motor and test shaft are
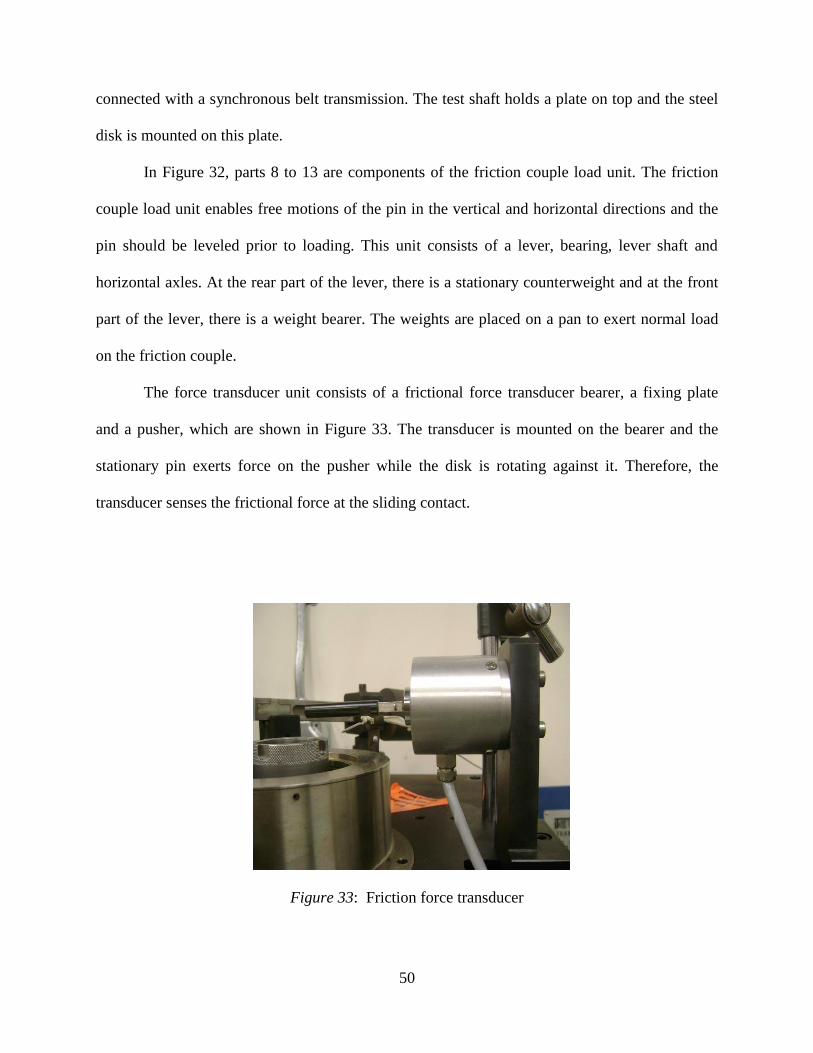
50
connected with a synchronous belt transmission. The test shaft holds a plate on top and the steel
disk is mounted on this plate.
In Figure 32, parts 8 to 13 are components of the friction couple load unit. The friction
couple load unit enables free motions of the pin in the vertical and horizontal directions and the
pin should be leveled prior to loading. This unit consists of a lever, bearing, lever shaft and
horizontal axles. At the rear part of the lever, there is a stationary counterweight and at the front
part of the lever, there is a weight bearer. The weights are placed on a pan to exert normal load
on the friction couple.
The force transducer unit consists of a frictional force transducer bearer, a fixing plate
and a pusher, which are shown in Figure 33. The transducer is mounted on the bearer and the
stationary pin exerts force on the pusher while the disk is rotating against it. Therefore, the
transducer senses the frictional force at the sliding contact.
Figure 33: Friction force transducer

51
The pin holding assembly is located in the front part of the lever of the friction couple
load unit. It consists of a holder, which is inserted into a sleeve and fixed by a nut. The disk
holding assembly consisting of a keep plate, lock nut and spring ring as shown in Figure 34.
Figure 34: Components of the disk holding assembly
A displacement transducer unit is placed on top of the weight pan of the friction couple unit. This
unit consists of a linear variable differential transducer (LVDT) which is held by a clamp and a
fixing bolt. In Figure 32 (part 26 and 27) the displacement transducer unit is shown.
3.3.2 Measuring and Controlling Unit:
The Measuring and Controlling system consists of the following parts:
MST-02 microprocessor aided controller,
SM-303A motor speed controller,
Transducers and sensors mounted on the machine, and
T-11 software for interfacing with the computer.

52
Figure 35 presents and schematic of the control and data acquisition of the pin-on-disk
tribometer, interconnections of working unit and flow of signals. Transducers mounted on the
machine receive an analog voltage signal and transfers the voltage signals to the counter unit
through a V/F (voltage to frequency) converter. The counter unit measures the frequency signals
coming from V/F (voltage to frequency) converter. There is an optical speed sensor which is able
to measures rotational speed of the motor shaft.
Figure 35: Functional block diagram of computer aided set of control and measurement unit in
the pin-on-disk machine. (Tribology, 1994)

53
A control or data acquisition software (T-11 program) is used to communicate the
hardware part of the tribometer with the microprocessor of the MST-02 controller. The SM-
303A motor speed controller controls the speed of the motor in the instrument according to the
value set in the computer via the microprocessor of the MST -02.
3.3.2.1 MST-02 Microprocessor Aided Controller
The MST-02 microprocessor aided controller controls the I/O (input and output) signals
of the tribometer with the help of the T-11 program. It communicates with the computer through
a RS-232/24v serial port at a 9600 baud rate. The T-11 program of the computer controls MST-
02 and it also stores and convert acquired signals into numeric value. More details about the
program will be discussed later in this chapter. Figure 36 presents the I/O (input output) panel of
the MST-02 microcontroller.
Figure 36: Front view of the MST-02 board (input output unit) (Tribology, 1994)
The MST-02 controller consists of the following unit:
(a) MG-02 Main Board Panel,

54
(b) MF 22 Board Panel,
(c) MT 32 Board Panel, and
(d) MW 52 Board panel
(a) MG-02 Main Board Panel:
It is an I/O (input output) and control board, which is an interface between computer and
measuring boards of the MST-02. The force, temperature, and displacement transducers acquire
inputs as analog voltage signals, and the MG-02 converts analog voltage signals into digital
frequency signals. The frequency signals are communicated to the computer with a RS-232C
serial interface through a DB-9 connector (D-Sub type connector which has 9 pins (for the male
connector) or 9 holes (for the female connector)). The MG 02 main board is connected to the
following channels output:
The photo Electric speed sensor,
The channels for temperature control,
The SM-303A motor speed controller, and
The Computer
The MG 02 main board also connects with the following panels through the internal bus
(A system which connects all the internal components to the motherboard):
MF 22 board panels ( employed for force measurement)
MT 32 board panels (employed temperature measurement)
MW 52 board Panels ( employed for vertical displacement
measurement)
55
(b) MF 22 Board Panel:
The MF 22 board panel is designed to measure the frictional force. This panel amplifies
and converts a voltage signal coming from a force transducer into frequency (digital) signals
using TTL (transistor –transistor logic gate). The converted signals are transferred to the MG 02
main board through an internal bus, where they can be measured by the counters. The MF 22
board panel is connected to the force transducer through the input socket. The output socket of
the MF 22, which presented in the Figure 36, provides an amplified voltage signal coming from
the force transducer.
(c) MT 32 Board Panel:
This panel is able to measure the temperature. It is connected with the thermocouples by
a connecting cable via an input socket. This board amplifies the voltage signals coming from the
thermocouples and converts it into digital signals. Conversion of the voltage to frequency is
performed by TTL (transistor –transistor logic gate). The frequency signal is further transferred
to the MG 02 main board via an internal bus and it can be measured by the counter. The MST 02
contains two MT 32 boards, which are able to measures the temperature of two different
thermocouples. There is an output socket in each of the MT 32 board panel. The amplified and
conditioned voltage signals of the thermocouples feed out from that socket.
(d) MW 52 board Panels
The MW 52 board panel is designed to measure the vertical displacement of the friction
couple. It is connected to the vertical displacement transducer (LVDT). This measurement was
not considered in this thesis work.
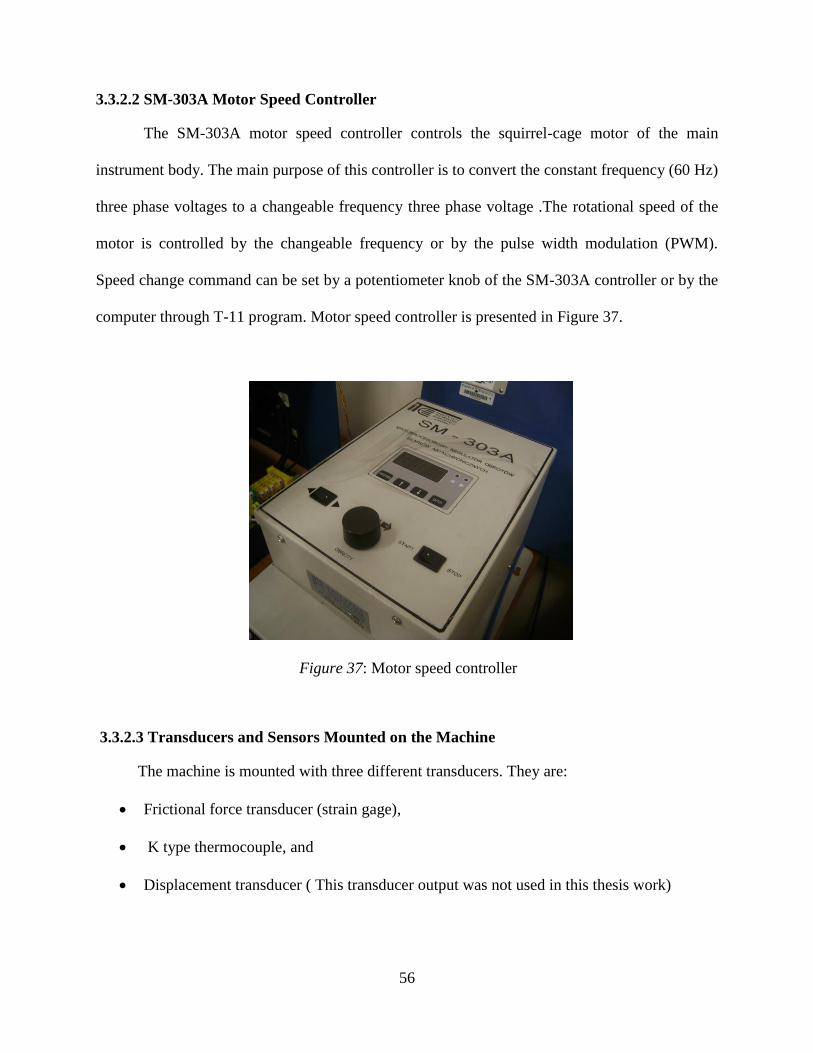
56
3.3.2.2 SM-303A Motor Speed Controller
The SM-303A motor speed controller controls the squirrel-cage motor of the main
instrument body. The main purpose of this controller is to convert the constant frequency (60 Hz)
three phase voltages to a changeable frequency three phase voltage .The rotational speed of the
motor is controlled by the changeable frequency or by the pulse width modulation (PWM).
Speed change command can be set by a potentiometer knob of the SM-303A controller or by the
computer through T-11 program. Motor speed controller is presented in Figure 37.
Figure 37: Motor speed controller
3.3.2.3 Transducers and Sensors Mounted on the Machine
The machine is mounted with three different transducers. They are:
Frictional force transducer (strain gage),
K type thermocouple, and
Displacement transducer ( This transducer output was not used in this thesis work)

57
Frictional force transducer
The transducer senses the tangential frictional force at the sliding contact. In this
tribometer, a disk is rotating while its surface is scratched by a pin under a fixed loaded condition
and tangential force exerts on the stationery pin. The transducer used in the tribometer is strain
gage base transducer. The exerted forced is converted to electrical signal achieved by physical
deformation of strain gage attached at the transducer and wired in Wheatstone bridge
configuration.
3.3.2.3 T-11 Software and Associated Incompatibility with Available Computer
The T-11 software was written using the Turbo Pascal 6 programming language. This
program was primarily written for DOS operating system with 286, 386 or 486 type
microprocessor, whose internal clock frequency (speed) must be less than 40 MHz. In this thesis
work a Pentium 4 microprocessor and windows XP operating system based computer were used,
as the recommended type microprocessor and operating system is obsolete. The internal clock
frequency (speed) of the computer used with the tribometer machine is 800 MHz, which is 20
times faster than that of recommended speed. This mismatch causes data or memory over flow
during the long experiment duration and T-11 program is crashed. Because of this, the
experimental data in this thesis is collected and stored with a separate data acquisition system,
which is presented later in this chapter. In the research work of thesis, the T-11 program is only
used for the operation of the motor speed controller and for start of the main instrument (pin-on-
disk tribometer).
3.4 Modifications of the Pin-On-Disk Tribometer
The reason of software crash of the T-11 program was explained in section 3.3.2.3. To
solve this problem a separate data acquisition system was introduced to collect the signals from
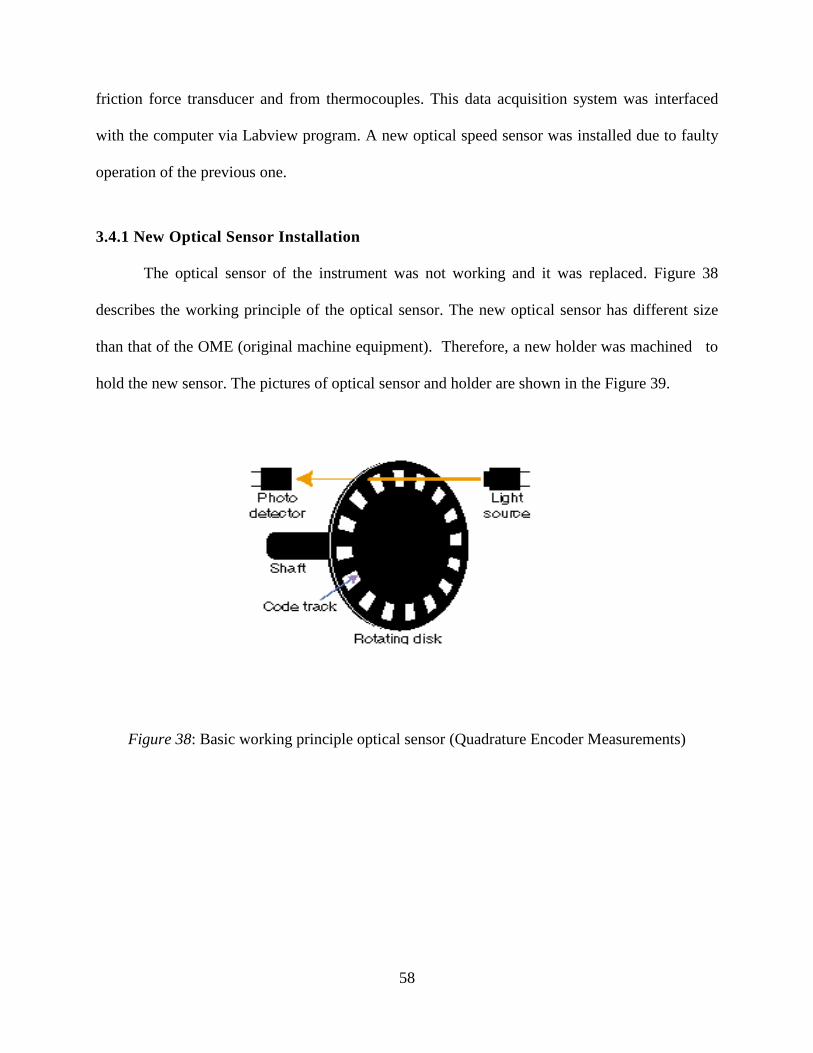
58
friction force transducer and from thermocouples. This data acquisition system was interfaced
with the computer via Labview program. A new optical speed sensor was installed due to faulty
operation of the previous one.
3.4.1 New Optical Sensor Installation
The optical sensor of the instrument was not working and it was replaced. Figure 38
describes the working principle of the optical sensor. The new optical sensor has different size
than that of the OME (original machine equipment). Therefore, a new holder was machined to
hold the new sensor. The pictures of optical sensor and holder are shown in the Figure 39.
Figure 38: Basic working principle optical sensor (Quadrature Encoder Measurements)

59
(a) (b)
Figure 39: (a) Optical sensor and (b) Its holder
3.4.2 Data Acquisition System
A new additional data acquisition system was set to acquire signals from friction force
transducer and thermocouple used in the instrument. The data acquisition system consists of two
NI (National Instruments) modules (NI 9205 and NI 9211) and a legacy chassis NI cDAQ 9171.
Figure 40 presents a picture of the modules and Figure 41 presents a picture of the chassis.
The National Instruments 9205 is a C Series module. The NI 9205 is featured with 32 single-
ended or 16 differential analog inputs, 16-bit resolution, and a maximum sampling rate (how
frequently the analog signal is measured) of 250 kS/s. It has 36-position spring terminal
connector for direct connection. Each channel has programmable input ranges of ±200 mV, ±1,
±5, and ±10 V. In this work the ±1V range is used. This module is compatible with the windows
operating system and is able to acquire data in real time. Frictional force signal is acquire by this
module. The output socket signal of MF 22 board panel is used as the input signal of the module.
Out of the 16 differential input channels one channel is in use (+ a2 and -a2).This module able to
take both the single ended input and differential ended inputs. In this work the differential inputs

60
are used, where two signal wires coming from each signal sources to the module, one of them
goes to the positive input and the other one to the negative input.
The National Instruments NI 9211 thermocouple input module is used to acquire the
thermocouple signals. It has 4 differential input channels, 24 bit resolution and 14S/s of sampling
rate. This module is able to acquire and decode the thermocouple signals with high-accuracy.
This module conditions the signals from two k-type thermocouples, read their signals in mVolts
and representing in 0C.
The NI cDAQ-9172 is an eight-slot NI (National Instruments) compact DAQ chassis
which can hold up to eight C Series I/O modules. It is connected to the PC with the high speed
USB (Universal Serial Bus) port. The NI cDAQ-9172 has two 32-bit counter or timer chips,
which are built into the chassis. Module NI 9211 is used for measuring frictional force and
module NI 9205 is employed for measuring temperature and both the modules are integrated
with the NI cDAQ 9172. Because of this integration, both modules can act as a single device and
can outputs all of the collected data through the same bus interface, and it making the Labview
programming easier.
3.4.2.1 Labview Program for DAQ System
The NI module and chassis are interfaced with the computer through LabView 2009. The
programming language used in LabView (Laboratory Virtual Instrumentation Engineering
Workbench) is also referred as G, which is a dataflow type programming language. LabView
programs are called virtual instruments (VIs). Each VI has two components: a block diagram and
a front panel. During the program run, indicators on the front panel allow monitoring the
acquired data.

61
Figure 40: Front panel of the developed LabView VI
The Figure 40 presents the front panel of the LabView program written for this thesis
work. The front panel shows the change of frictional force, temperature change of
“thermocouple-1”(Inside the hollow pin which holds the ball at its tip) and “thermocouple-2”
(temperature change of the friction joint).

62
Figure 41: Control panel of the developed LabView VI
Three sets of data (Frictional force, and two k- type thermocouples signal) are taken by
the DAQ assistant in the LabView program and are shown in the control panel of VI, presented
in Figure 41. For the frictional force signal, data acquisition system reads the change in voltage
difference and converts it into kilogram force using the correlation.
y=0.2101*x+0.2942
Where, y = friction force in kilogram, and
x= friction force signal in mVolt
This correlation was derived from the transducer calibration and it was inserted it in the
program to obtain the actual frictional force (in kilogram force) measurements. The NI9211 that

63
is used for the thermocouple is able to perform the conversion of the voltage signals into
temperature. Therefore, no temperature correlation is needed in the LabView program. The
program writes the three data pieces into an Excel file at the specified location in the computer,
which is set by the program. The front panel also shows the change of data after each 10,000
mseconds or 10 seconds and writes 10 pieces of data per second in the file. After each run (test
run duration was 6,700 seconds) this program stores a data file of 67,000 data points. The
program can be stopped at anytime by clicking the “stop” button in the front panel.
3.5 Pin-On-Disk Tribometer Calibration
Before using the tribometer each of the sensors and transducers needs to be calibrated.
The MST-02 controller and SM 303A speed controller do not need calibration as they are relying
on factory settings. The T-11 program calibration command consists of the following menu
options:
Frictional force calibration,
Rotational speed calibration,
Pin/ball temperature calibration,
Chamber temperature calibration, and
Displacement calibration.
Displacement sensors output is not used in this thesis work and the thermocouple signals
are alternatively conditioned and measured by the NI9205 module. The frictional force
transducers signals are conditioned by the MST 02 controller but measured by NI 9211 module.
For these reasons, frictional force transducer and rotational speed of the motor are calibrated
through the T-11 program.

64
3.5.1 Frictional Force Calibration
The frictional force transducer must be unscrewed from the main body of the machine for
its calibration. The pusher rod is also removed and the transducer is placed on a flat surface for
calibration. A calibration pan of weight is 0.093 gm was placed on the transducer according to
Figure 42. The load was gradually applied on the calibration pan ranged in a range of 0 to 5 kg.
When the frictional force calibration option is chosen in the calibration menu, the dialog box
presented in Figure 43 appears and the applied load must be correctly entered in the dialog box
presented in Figure 44. Once the calibration was completed, the plot of Figure 45 was displayed
on the computer screen. This plot was an indication of correct calibration of the frictional force
transducer.
Figure 42: Schematic of the calibration of frictional force transducer

65
Figure 43: Frictional force calibration dialog box in T-11 program (Tribology, 1994)
Figure 44: Dialog box of entering current load value for frictional force calibration with T-11
program. (Tribology, 1994)

66
Figure 45: Correct frictional force calibration characteristic obtained by T-11 program.
(Tribology, 1994)
3.5.2 Rotational Speed Calibration
The rotational speed calibration is carried out automatically by the T-11 program when
the rotational speed calibration command is chosen from the calibration menu of the T-11
program. In this automatic calibration process, rotational speed is changed from lowest (0 rps) to
highest value (16 rps) and the instant speed (rps) appears in the dialog box like Figure 46. Before
starting the rotational speed calibration, the SM 303A speed controller was set in start mode.
After a successful calibration, a characteristic plot as that of Figure 47 appears on the screen, and
it is the indication of correct performance of optical speed sensors and the motor.
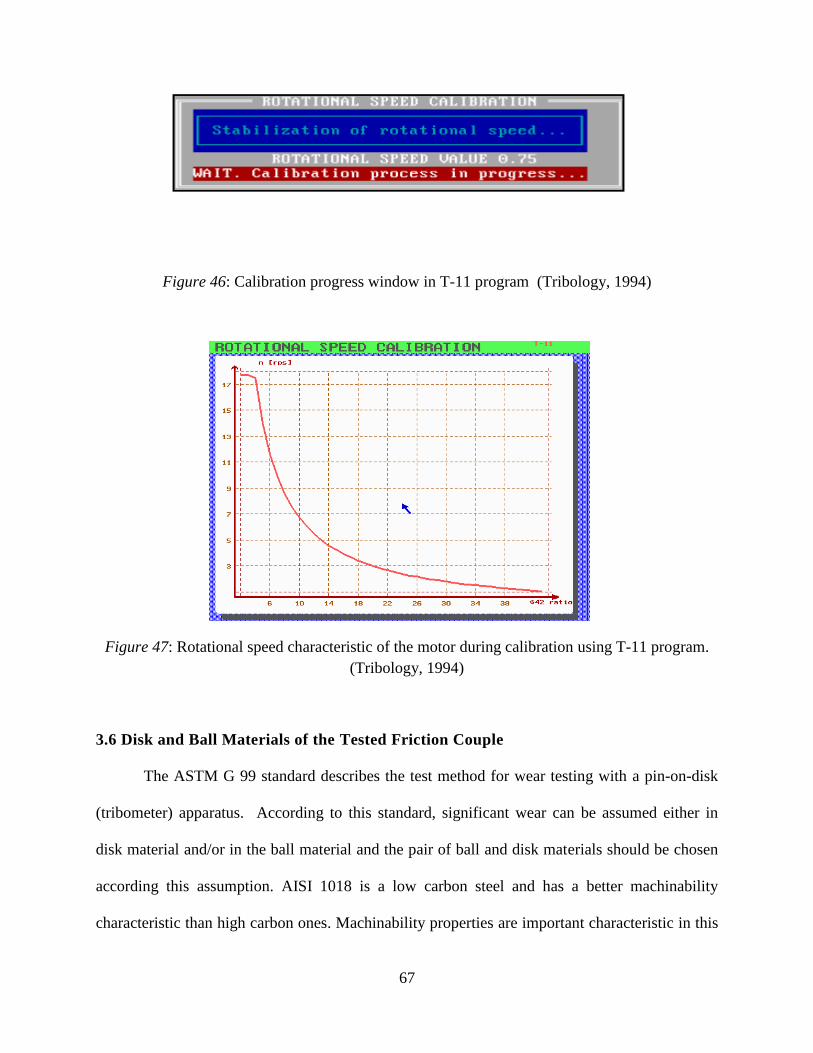
67
Figure 46: Calibration progress window in T-11 program (Tribology, 1994)
Figure 47: Rotational speed characteristic of the motor during calibration using T-11 program.
(Tribology, 1994)
3.6 Disk and Ball Materials of the Tested Friction Couple
The ASTM G 99 standard describes the test method for wear testing with a pin-on-disk
(tribometer) apparatus. According to this standard, significant wear can be assumed either in
disk material and/or in the ball material and the pair of ball and disk materials should be chosen
according this assumption. AISI 1018 is a low carbon steel and has a better machinability
characteristic than high carbon ones. Machinability properties are important characteristic in this

68
thesis work, as disks are made from 1” diameter round bar through several steps. The density of
AISI 1018 is 7.87g/cm3 and its hardness (in Rockwell B scale) is 71. The 316 stainless-steel is
the standard molybdenum-bearing grade austenitic stainless steels and its density is 8.00 g/cm3
and its hardness (in Rockwell B scale) is 95.
In this thesis work, it is assumed that significant wear would happen only for the disk
material. AISI 1018 steel is used as disk material and bearing grade 316 stainless-steel is used as
the ball material, the latter being much harder than the disk material. In summary because of
typical hardness of the materials, the assumption is made that the wear happens on the softer
surface of the AISI 1018 steel disk.
3.7 Disk Cutting and Polishing Process
The tribological experiments with the pin-on-disk tribometer are carried out on a 25.4
mm (1”) diameter disk, with a width 6 ±1 mm. This disk is made from the 1” diameter round bar
by a standard parting operation with a horizontal lathe machine. This process yields a disk with
unfinished rough surface. This rough disk is polished in a sequence with files, grinding wheels
and finally with emery paper to obtain a mirror like polished surface. The detail of disk polishing
process will be discussed elaborately in Appendix C
3.8 Surface Cleaning Process
After polishing, the disk surface was cleaned in ultrasonic bath. A Cole-Parmer 8848
ultrasonic cleaner was used for the ultrasonic cleaning of the disk. The employed ultrasonic
cleaner is presented in the Figure 48.

69
Figure 48: Ultrasonic bath of the disk with indirect method
Surface cleaning is critical before and after each test run according to ASTM G99 test
standard. Before each of the experiments, the disk was cleaned in ultrasonic bath for 20 minutes
with Cole-Parmer Micro-90 Cleaning Solution. Cole-Parmer Micro-90 Cleaning Solution
removes oil, grease, wax, particulates, stains and biological debris from the metal disk surface.
Indirect method for ultrasonic cleaning was used in cleaning the disk, which means the disk is
not placed inside the ultrasonic cleaner directly. The tray inside the ultrasonic cleaner is filled
with water. A beaker is filled with warm water and Cole-Parmer Micro-90 Cleaning Solution in
a volume ratio of 50:1. The disk is placed inside the beaker.
The surface cleaning process is repeated after the completion of test run in order to obtain
an accurate weight of metal removed from the disk surface due to wear. This wear estimation
operation is described in the chapter 4.
70
3.9 Biodiesel and Engine Oil Used in this Thesis Work
The US Army, Navy, Air Force and Marines all use standard B20, a mixture of 20%
biodiesel and 80% diesel throughout the country (National Biodiesel Board , 2003). A recent
report reveals the military efforts to use sustainable biofuels across all their operations (Military
Biofuel Applications, 2010). 15W 40 engine oil is one of the military's widely used lubricating
oils (Masoner, Erck, & Ajayi, 2009) and this was the reason to choose 15w 40 as the test
lubricating or engine oil in this work.
Biodiesel from different feedstock contains different types and fractions of fatty acid.
Therefore, biodiesel dilution effects on the performance of engine oil (15w 40) may vary based
upon the employed biodiesel feedstock. In this thesis work, biodiesel from four types feedstock
is used, three of them are from vegetable feedstock (canola, peanut and soybean oil biodiesel)
and one of them is from animal source (chicken fat biodiesel).
15W-40 mineral oil is a heavy duty engine oil, and it is primarily recommended for use in winter
climate where temperatures never fall below 150 F (-9
0 C). (Dixon, 2008). In this work partially
synthetic SAE 15W 40 Mobil engine oil is used, with a 30% synthetic base stock. This engine oil
satisfies the SAE 40 viscosity grade. Table 5 presents the typical properties of the employed
15W-40 engine oil.

71
Table 5
Typical properties of 15W-40 mineral oil
(Mobil Delvac Elite 15W-40)
Chicken Fat Biodiesel (CFB):
Animal fats are attractive feedstock for biodiesel because they may cost less than
vegetable oil. Animal fat feedstock can be made into a high-quality biodiesel which meets
the ASTM specifications for biodiesel. Animal fats are highly saturated and solidify at a
relatively high temperature; this allows the use of animal fat biodiesel in warm climates. The
saturated fatty acids in animal fats should contribute to better oxidative stability for biodiesel
(Stuckey, 1972). The fatty acid types are defined by the number of carbon atoms and the number
of double bonds in the molecule. Animal fats contain very little polyunsaturated fatty acids, such
as linoleic acid and linolenic acid, which are responsible for chemical decomposition of fat. In
this work, animal fat biodiesel from chicken fat feedstock is used, collected from “Down To
Earth Energy” company, a biodiesel producer in Georgia. Table 6 presents the different fatty
acids percentage of chicken fat.
SAE Grade 15W-40
Viscosity, ASTM D 445
cSt @ 40ºC
cSt @ 100ºC
111
15.2
Viscosity Index, ASTM D 2270 140
Sulfated Ash, wt%, ASTM D 874 0.9
Total Base Number, mg KOH/g,
ASTM D 2896
10.7
Pour Point, ºC, ASTM D 97 -36
Flash Point, ºC, ASTM D 92 241
Density @15 ºC kg/l, ASMT D 4052 0.872
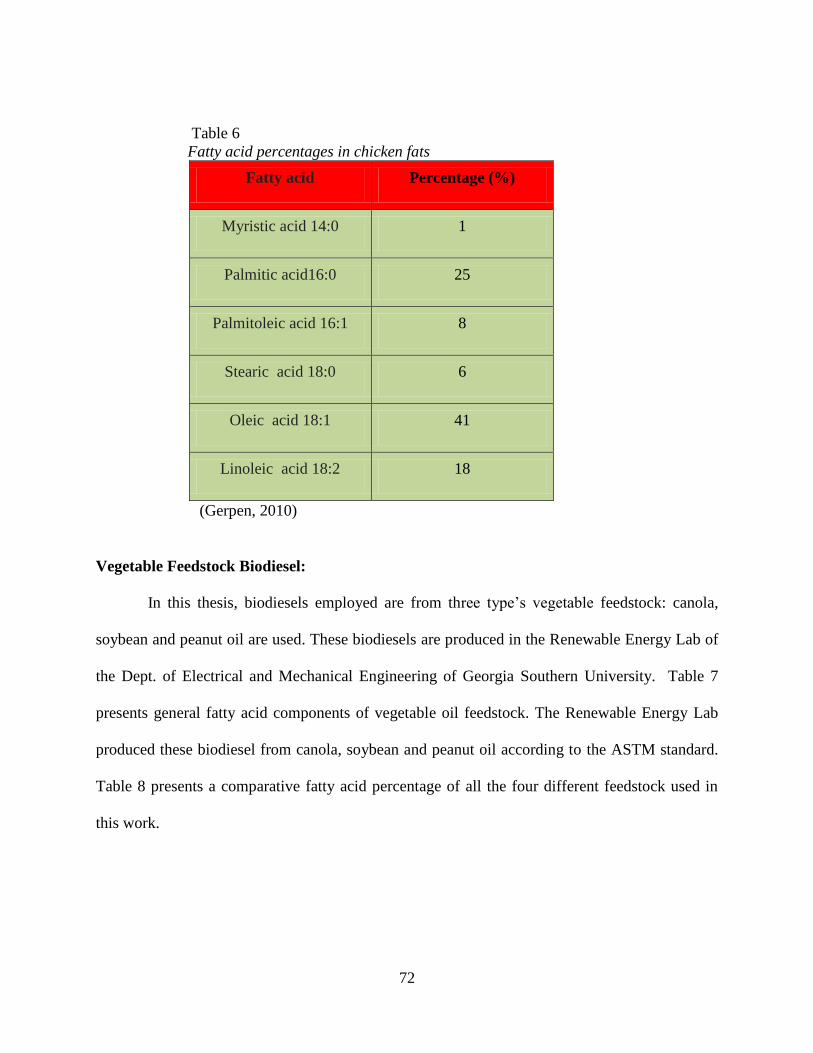
72
Table 6
Fatty acid percentages in chicken fats
Fatty acid Percentage (%)
Myristic acid 14:0 1
Palmitic acid16:0 25
Palmitoleic acid 16:1 8
Stearic acid 18:0 6
Oleic acid 18:1 41
Linoleic acid 18:2 18
(Gerpen, 2010)
Vegetable Feedstock Biodiesel:
In this thesis, biodiesels employed are from three type’s vegetable feedstock: canola,
soybean and peanut oil are used. These biodiesels are produced in the Renewable Energy Lab of
the Dept. of Electrical and Mechanical Engineering of Georgia Southern University. Table 7
presents general fatty acid components of vegetable oil feedstock. The Renewable Energy Lab
produced these biodiesel from canola, soybean and peanut oil according to the ASTM standard.
Table 8 presents a comparative fatty acid percentage of all the four different feedstock used in
this work.

73
Table 7
Fatty acid percentages in typical vegetable fat
Fatty acid Percentage (%)
Palmitic acid 16:0 15
Palmitoleic acid 16:1 8
Stearic acid 18:0 5
Oleic acid 18:1 25-30
Linoleic acid 18:2 45-50
(chemicalland21, 2008)
Table 8
Fatty acid percentages in different feedstock
Fatty acid Chicken fat
(%)
Soybean oil
(%)
Peanut oil
(%)
Canola oil
(%)
Palmitic acid 16:0 25 6-10 8-9 ND(no data)
Stearic acid 18:0 6 2-5 2-3 7
Oleic acid 18:1 41 20-30 50-65 54
Linoleic acid 18:2 18 50-60 20-30 30
Linolenic acid 18:3 ND 5-11 ND 7
(Rick, 2010)
3.11 Preparation of Biodiesel Diluted Engine Oil
In this work, the employed engine oil (15W 40) was diluted by the four different source
of biodiesel (e.g. peanut oil, Canola oil, Soybean oil and Chicken Fat). Engine oil dilutions by

74
the biodiesel were prepared for four different percentage, they were 5%, 10%, 20% and 30%. A
total 40ml mixture of engine oil and biodiesel was prepared for each of the percentages mixtures
of biodiesel. The volume fraction of engine oil and biodiesel oil was changed according to the
percentage in each 40 ml mixture. For 5% diluted engine oil, 38ml of engine oil and 2ml of
biodiesel were mixed together. For 10% diluted engine oil, 36ml of engine oil and 4 ml of
biodiesel were mixed together. For 20% diluted engine oil, 32ml of engine oil and 8 ml of
biodiesel were mixed together. For 30% diluted engine oil, 28ml of engine oil and 12 ml of
biodiesel were mixed together. To maintain the exact volumes of engine oil and biodiesel in the
mixture, a micropipette (United Scientific Supplies, Inc.) was used, with a 1-1000μl oil capacity
with 98.9% accuracy. After making the mixtures of engine oil and the biodiesel, a magnetic
stirrer was used for the homogeneous mixing of engine oil and biodiesel. Figure 49 presents
picture of the volume measurements of oil by micropipette and of the magnetic stirrer.

75
(a) (b)
Figure 49: (a) Volume measurements of oil by micropipette. (b) Magnetic stirrer for making
homogeneous mixture of engine oil and biodiesels.
3.12 Viscosity Measurement
Viscosity of the engine oil is an important characteristic of engine oils in engineering
applications. The dynamic viscosity of the diluted engine oil was measured with a Brookfield
Rotational Viscometers. This instrument measures the shearing stress on a spindle rotating at a
constant speed while it is immersed in the sample oil. The degree of spindle lag is indicated on a
rotating dial. This reading multiplied by a conversion factor, which is based on spindle size and
rotational speed, gives a value for viscosity in centipoises. The LCD display of the viscometer
shows dynamic viscosity reading of centipoises (cp) or milipascal seconds (mPaS), as well as
percent of torque, and speed.

76
After each of the experiments a mixture of engine oil and biodiesel is remains on the
surface of the disk. The amount of this leftover oil is very small to be measured the viscosity
with the available viscometer. Because of this problem an alternate method was followed in this
research work. After each test run the disk with the leftover oil was dipped in the corresponding
40ml mixture of engine oil and biodiesel and the viscosity was measured.
Viscosity of mixture after test run:
It is assumed that both the engine oil and the biodiesels are organic substance. When two
organic solution of different viscosity mixed together, following relationship is exist (Kern,
1965).
Where,
U = Viscosity of the mixture of leftover (used) diluted engine oil on
the disk (after test run) and the diluted engine oil(fresh)
U1 = Viscosity of biodiesel diluted engine oil (fresh)
W1 = Weight fraction of diluted engine oil (fresh)
U2 = Viscosity of leftover (used) diluted engine oil on the disk (after
test run)
W2 = Weight fraction of leftover (used) diluted engine oil on the
disk (after test run)
For this thesis work, it is assumed
W1 = 0.999
W2 = 0.001
77
3.13 Specific Wear Calculation
Sliding wear is commonly treated in terms of material loss, which is a function of
hardness of the material, sliding distance and normal load applied on the object. Frictional
coefficient (or frictional force) between the sliding components, which is also related to the
lubricity of lubricant, may greatly affect the wear rate. In this work, the dimensional wear
coefficient or specific wear is calculated with Archard’s Equation:
Where,
Ws = specific wear (in mm3/Nm)
V= wear volume (in mm3)
In this work,
m= mass loss (in grams)
ρ=density (in g/cm3)
For AISI 1018 steel,
ρ=7.87g/ cm3
Specific wear can be varies, depending upon contact material, load, environment and
lubricants (Kholi & Mittal, 2008). As contacted material, load and environment are kept
unchanged, specific wear can be correlated with the lubricants (i.e. biodiesel diluted engine oil).

78
CHAPTER 4
RESULTS AND DISCUSSIONS
4.1 Introduction
In this chapter, the experimental results are presented of the lubricity testing of biodiesel
diluted engine oil, of the dilution effects on the viscosity properties of mixture and of the surface
interactions of biodiesel diluted engine oil at the frictional surfaces. Specific wear for the
different feedstock-diluted engine oils are also presented and the observations of temperature
change at the frictional joint are also included.
4.2 Experimental Results of Biodiesel Diluted Engine Oil
Lube oil or engine oil is required to maintain a high viscosity index, a good thermal and
oxidative stability and a good lubricity. The overall lubricity quality of the oil should control the
wear rate and frictional force between the moving surfaces. In this work wear rate, frictional
force, viscosity changes are measured, and oxidative stability are observed to evaluate the
lubricity of the biodiesel diluted engine oils. Each experiment is conducted under the following
constant test -controlled parameters:
Relative sliding velocity of disk and ball = 0.15m/s,
Total sliding distance = 1 km,
Duration of each experiment = 6667 seconds or 1 Hr 52 minutes,
Normal load applied on the ball = 2kg or 19.62N,
Room temperature = 170 C to 19
0C,
Relative humidity = 55% -60% (Data according to Physical Plant of GSU), and

79
Surface roughness of steel disk = Maintained between 1μin to 10μin (presented in Appendix C)
4.2.1 Canola Oil Biodiesel Diluted Engine Oil
Canola oil biodiesel (COB) is made from vegetable feedstock. Its major fatty acid
components are stearic acid (7-9%), oleic acid (54%), linoleic acid (30%) and linolenic (7%).The
engine oil was diluted with the canola oil biodiesel at 5%, 10%, 20% and 30%. The effect of
dilution on the dynamic viscosity change of the freshly prepared diluted engine oil was observed.
Along with this, viscosity change of this diluted engine oil after the experiment also was
determined. Dynamic viscosity measurement was carried out at 240C. Figure 50 presents the
measured change of dynamic viscosity for the tested percentages of oil dilutions when they were
freshly prepared. The relation between the diluted engine oil viscosity and the percentage of
canola oil biodiesel in the engine oil (EO) fits a quadratic adjustment, which is presented below.

80
Figure 50: Viscosity change of EO when diluted by COB
Viscosity = 0.1507x2 -
9.4836x + 195.16
R² = 0.9986
0
50
100
150
200
250
0 10 20 30 40
Dynam
ic
Vis
cosi
ty o
f
Dil
ute
d E
ngin
e O
il a
t
24◦C
(c
p)
Percentage of COB in the EO (%)
Viscosity Change of Engine Oil When Diluted by Canola Oil
Biodiesel
Series1
Poly. (Series1)

81
Figure 51: Viscosity change of COB diluted EO after the experiment.
0
5
10
15
20
25
30
35
0% 10% 20% 30% 40%
Chan
ge
of
Dyam
ic V
isco
sity
at 2
4◦C
(Cp
)
Percentage of COB in Diluted EO
Viscosity Change of COB Diltuted EO After Test Run
Diluted EO by COB

82
Figure 51 presents the dynamic viscosity change of the diluted EO after the experiments.
It shows that increasing percentages COB, the dynamic viscosity sharply decreased, which is not
desirable in a good lubricant. This may happen due to local heat generation due to friction and
the tribo-chemical reactions of the COB components under friction
Specific wear was measured for the different dilution percentages of engine oil by CBO
(canola oil biodiesel), as presented in Figure 52. The 0% dilution represents the pure engine oil
(EO). The plot shows that for the 10 % dilution the measured specific wear was the lowest, and
that for the 20% dilution measured specific wear was the highest. This observed result could be
because of the interactions with the engine oil anti-wear additives ZDDP (Zinc Dialkyl Dithio
Phosphate), which usually bonds to the metallic surfaces to form a protective layer against wear.
The polar components in biodiesel (e.g. fatty acid methyl ester), may also attracts the ZDDP
molecules. Therefore, when ZDDP is not fully attracted to the surface or is less available to give
protection to surface, wear rates may increase.

83
Figure 52: Specific wear amount of the surface in presence of COB diluted EO.
0.00E+00
5.00E-06
1.00E-05
1.50E-05
2.00E-05
2.50E-05
0% 5% 10% 20% 30%
Sp
ecif
ic W
ear
(mm
3/N
m)
Percentage of Engine Oil Dilution by COB
Specific Wear of Surface for COB Diluted Engine oil
0%
5%
10%
20%
30%

84
The in-process friction force between the contact surfaces is presented in Figure 53 which
shows that friction force remained stable and the COB (Canola Oil Biodiesel) diluted engine oil
(EO) seemed able to provide an antifriction layer on the surface. For all the four dilution
percentages, frictional force did not significantly increased during test time. This means that no
lubrication failure occurred in the 1 km sliding contact (or in equivalent 1 hour 51 minutes, or
6667 sec). But for all tested four dilution percentages it takes about 1,000 second to build up an
adequate friction reducing layer on the surface. Figure 54 presents the variation of average
friction force during the test for different dilution percentages. After testing with COB diluted
engine oil for the four dilution percentage, an oxidized layer of oil was observed as left on the
surface which is presents in Figure 55 and this phenomenon was observed for all the four tested
percentages; it may be an indication of some reduced oxidative stability of engine oil when it is
diluted by COB.

85
Figure 53: In process friction force with the time for COB diluted EO

86
Figure 54: Average friction force between the contacted surfaces for COB diluted EO.
0.3
0.31
0.32
0.33
0.34
0.35
0.36
Aver
age
Fri
ctio
n F
orc
e(kg
)
COB Diluted EO
Friction Force Between Contacted Surface
5% COB Diluted EO
10% COB Diluted EO
20% COB Dilured EO
30% COB Diluted EO

87
Figure 55: The left over oxidized oil after a test run with a typical COB diluted EO.

88
4.2.2 Peanut Oil Biodiesel Diluted Engine Oil
Peanut oil Biodiesel (POB) is another promising vegetable feedstock for biodiesel. Its
major fatty acid components are palmitic acid (8-9%), oleic acid (50-65%), and linoleic acid (30-
40%). This oil also contains some 6-8% (total) of arachidic acid, arachidonic acid, behenic acid,
lignoceric acid and smaller amount of other fatty acids. The engine oil (EO) is diluted with the
peanut oil biodiesel (POB) at 5%, 10%, 20% and 30%. Figure 56 presents the change of dynamic
viscosity with these percentages of engine oil (EO) dilution. The relation between the diluted
engine oil viscosity and the percentage of peanut oil biodiesel (POB) in the engine oil (EO) fits a
quadratic adjustment as presented in the Figure 56. Figure 57 presents the dynamic viscosity
change of the diluted EO after the tests.
Figure 58 shows the specific wear at the tested surfaces for the different dilution
percentages of engine oil by POB. This plot indicates that at a 10% dilution of EO (engine oil)
the measured specific wear amount is the lowest for the tested interval.

89
Figure 56: Viscosity change of EO when diluted by POB
y = 0.1413x2 - 8.8353x + 189.73
R² = 0.9933
0
50
100
150
200
250
0 10 20 30 40
Dynam
ic V
isco
sity
of
Dil
ute
d E
ngin
e O
il a
t
24◦C
(Cp
)
Percentage of EO dilution by POB(%)
Viscosity Change of EO When Diluted by POB
Peanut oil BD
Poly. (Peanut oil BD)

90
Figure 57: Viscosity change of POB diluted EO after the experiment.
0
5
10
15
20
25
30
0% 10% 20% 30% 40%
Chan
ge
of
Dynam
ic V
isco
sity
at 2
4◦C
(C
p)
Percentage of POB in Diluted EO
Viscosity Change of POB Diluted EO After Test Run
Diluted EO by POB

91
Figure 58: Specific wear amount of the surface in presence of POB diluted EO.
0.00E+00
5.00E-06
1.00E-05
1.50E-05
2.00E-05
2.50E-05
0% 5% 10% 20% 30%
Sp
ecif
ic W
ear
(mm
3/N
m)
Percentage of Engine Oil Dilution by POB
Specific Wear of Surface for POB Diluted EO
0%
5%
10%
20%
30%

92
Figure 59: Average friction force between the contacted surfaces for POB diluted engine oil
0.3
0.31
0.32
0.33
0.34
0.35
0.36 A
ver
age
Fri
ctio
n F
orc
e(kg)
POB Diluted EO
Friction Force Between Contacted Surface
5% POB Diluted EO
10% POB Diluted EO
20% POB Diluted EO
30% POB Diluted EO
93
Average friction force is presented in Figure 59 and the measured value was the lowest
for the 30% dilution of EO by POB. The in-process friction force presented in Figure 60 shows
that an anti- friction layer was formed on the surface in a short time. For the 20% and 30% POB
(Peanut oil biodiesel) diluted EO (engine oil), the measured friction force is lower than that of
5% and 10%. This may be due to some unknown tribo-chemical reaction of diluted EO which
may enhance lubricity property of the engine oil.

94
Figure 60: In process friction force Vs the time for POB diluted EO

95
Figure 61 presents the temperature change during the test runs for the four different
mixture percentages. In the figure, T1 represents the temperature measured by the thermocouple
(Thermocouple-1 of Figure 43) which was inserted in the hollow space of the pin, while the pin
holds the ball at its tip; T2 represents the temperature measured by the thermocouple
(Thermocouple -2 of Figure 43) which was placed near the friction couple joint. In this work, test
chamber was not insulated and heat produced by the friction was left to dissipate. After the test
runs the color of diluted engine oil also was observed and is presented in Figure 62; it was
noticed a small degree of color change. That small change suggested that the diluted engine oil
does not significantly lose its stability through oxidation for the tested condition.

96
Figure 61: In process temperature profiles of ball and test chamber vs. time for POB diluted EO.
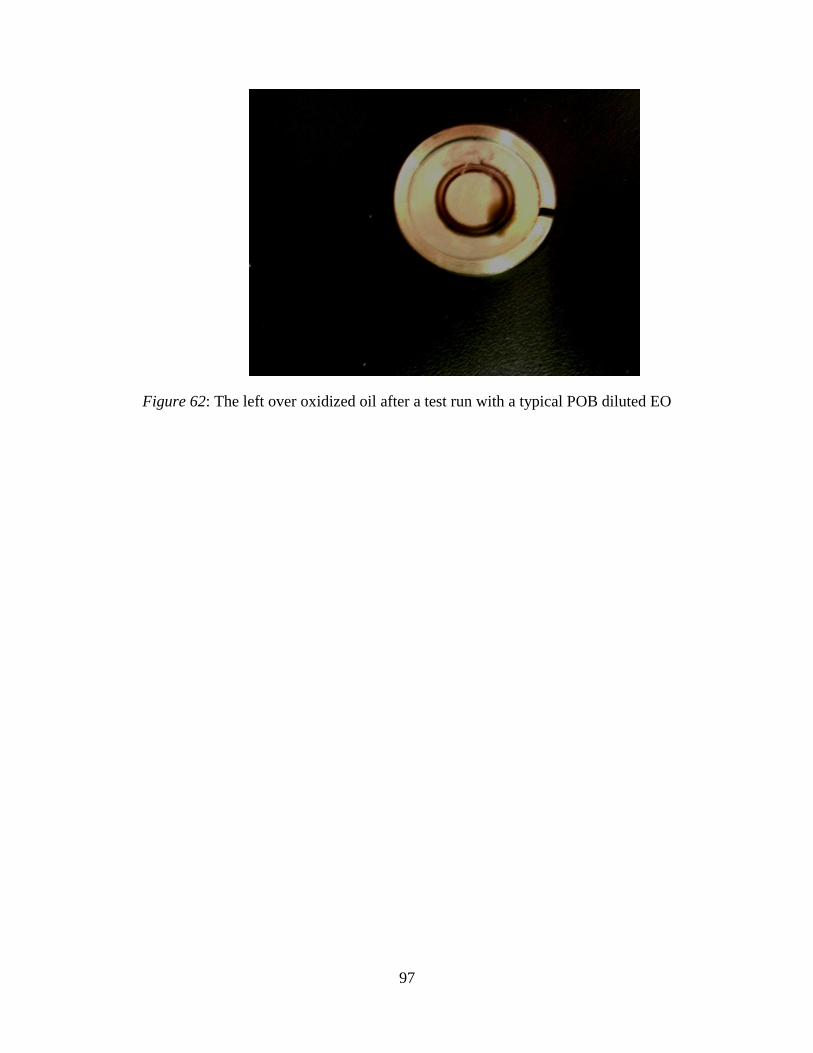
97
Figure 62: The left over oxidized oil after a test run with a typical POB diluted EO
98
4.2.3 Soybean Oil Biodiesel Diluted Engine Oil
Soybean oil Biodiesel (SOB) is a vegetable feedstock biodiesel. Their major fatty acid
components are palmitic acid (6-10%), oleic acid (20-30%), linoleic acid (50-60%) and stearic
acid (2-5%). The engine oil (EO) was diluted with soybean oil biodiesel (SOB) at 5%, 10%, 20%
and 30%. Figure 63 presents the measured dynamic viscosity for the tested percentage of freshly
prepared diluted engine oil (EO). The relation between the diluted engine oil viscosity and the
percentage of soybean oil biodiesel (SOB) in the engine oil (EO) fits a quadratic adjustment,
which is included in Figure 63. Figure 64 presents the dynamic viscosity change of the diluted
EO after the tests.
Figure 65 shows the measured specific wear amount from the worn surface at different
dilution percentages of engine oil by SOB. This plot also shows that for the 10% dilution of EO
the specific wear amount was minimum.

99
Figure 63: Measured viscosity of EO when diluted by SOB
y = 0.1069x2 - 8.1038x + 195.12
R² = 0.9882
0
50
100
150
200
250
0 10 20 30 40
Dynam
ic V
isco
sity
of
Dil
ute
d E
ngin
e O
il a
t
24◦C
(Cp
)
Percentage of EO dilution by SOB(%)
Viscosity Change of EO When Diluted by SOB
Soybean Oil BD
Poly. (Soybean Oil BD)

100
Figure 64: Viscosity change of SOB diluted EO after the experiment.
0
2
4
6
8
10
12
14
16
18
20
0% 5% 10% 15% 20% 25% 30% 35%
Chan
ge
of
Dynam
ic V
isco
sity
at 2
4◦C
(Cp
)
Percentage of SOB in Diluted EO
Viscosity Change of SOB Diluted EO After Test Run
Diluted EO by SOB

101
Figure 65: Specific wear amount of the surface in presence of SOB diluted EO.
-5.00E-06
6.10E-19
5.00E-06
1.00E-05
1.50E-05
2.00E-05
2.50E-05
0% 5% 10% 20% 30%
Sp
ecif
ic W
ear(
mm
3/N
m)
Percentage of Engine Oil Dilution by SOB
Specific Wear of the Surface for SOB Diluted EO
0%
5%
10%
20%
30%

102
Average friction force was measured minimum for the 30% dilution of EO by SOB, as it
presented in Figure 66. Figure 67 shows that in-process friction force reached a stable value
after a 2,000 seconds run, and that indicating that for diluted EO it would take about 2,000
seconds of run to form a low friction layer on the surface. Figure 67 shows that for the 30% SOB
dilution the friction force tends to slightly increase with time. After the test the color of the
diluted engine oil was also observed, and is presented in Figure 68. It was observed that for all
the tested percentage the diluted oil became darker after the test.

103
Figure 66: Average friction force between the contacted surfaces for SOB
Diluted engine oil.
0.29
0.3
0.31
0.32
0.33
0.34
0.35
0.36
Aver
age
Fri
ctio
n F
orc
e(K
g)
SOB Diluted EO
Friction Force Between Contacted Surface
5% SOB Diluted EO
10% SOB Diluted EO
20% SOB Diluted EO
30% SOB Diluted EO
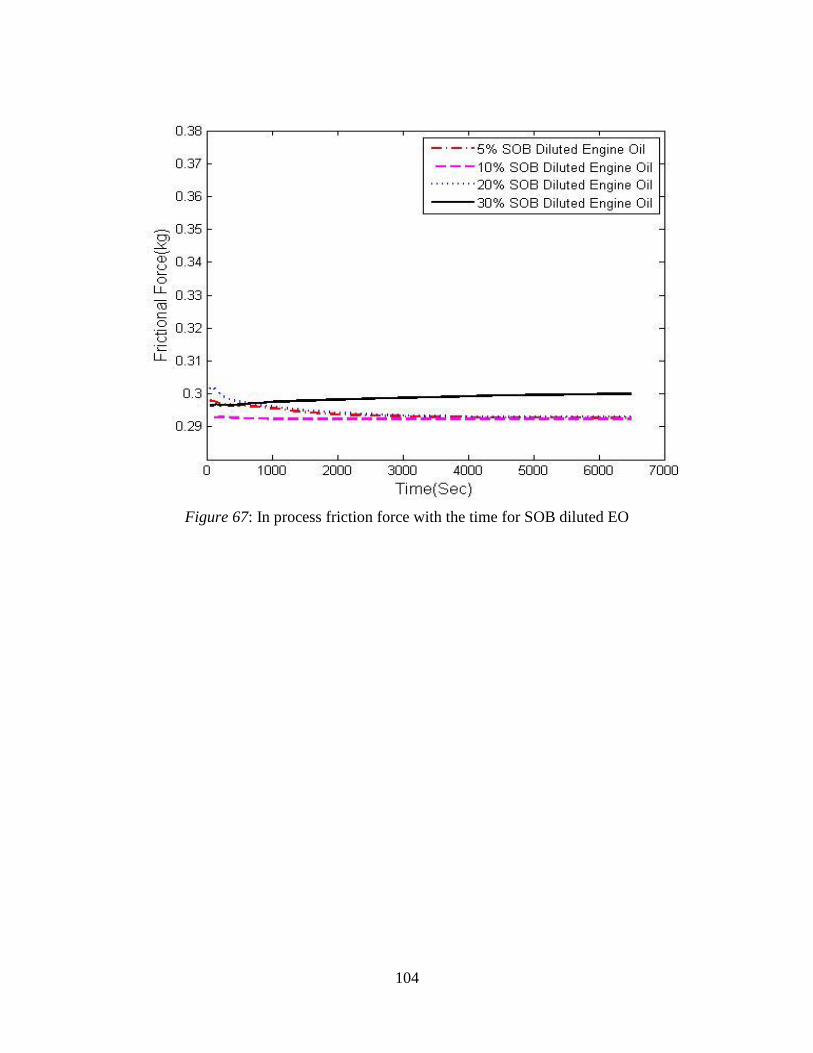
104
Figure 67: In process friction force with the time for SOB diluted EO

105
Figure 68: The left over oxidized oil after a test run with a typical SOB diluted EO
106
4.2.4 Chicken Fat Biodiesel Diluted Engine Oil
Animal fats are attractive feedstock for biodiesel, and Chicken Fat Biodiesel (CFB) is one
of the animal feedstock biodiesels that contains saturated fatty acids. Its major components are
palmitic acid (25%), oleic acid (41%), linoleic acid (18%) and stearic acid (6%). It contains
smaller amounts of some saturated fatty acids, such as linoleic acid, than those of vegetable
feedstock biodiesels.
Figure 69 presents the measured dynamic viscosity for the different tested percentages of
engine oil (EO) dilution. The relation between the diluted engine oil viscosity and the percentage
of chicken fat biodiesel (CFB) in the engine oil (EO) fits quadratic adjustments, which included
in Figure 69. Figure 70 presents the dynamic viscosity change of the diluted EO after the tests.
Figure 71 shows the measured specific wear amount for the tested worn disk surface at different
dilution percentages of engine oil (EO) by CFB. This plot shows that at a 10% dilution of EO the
specific wear amount was measured to be minimum.
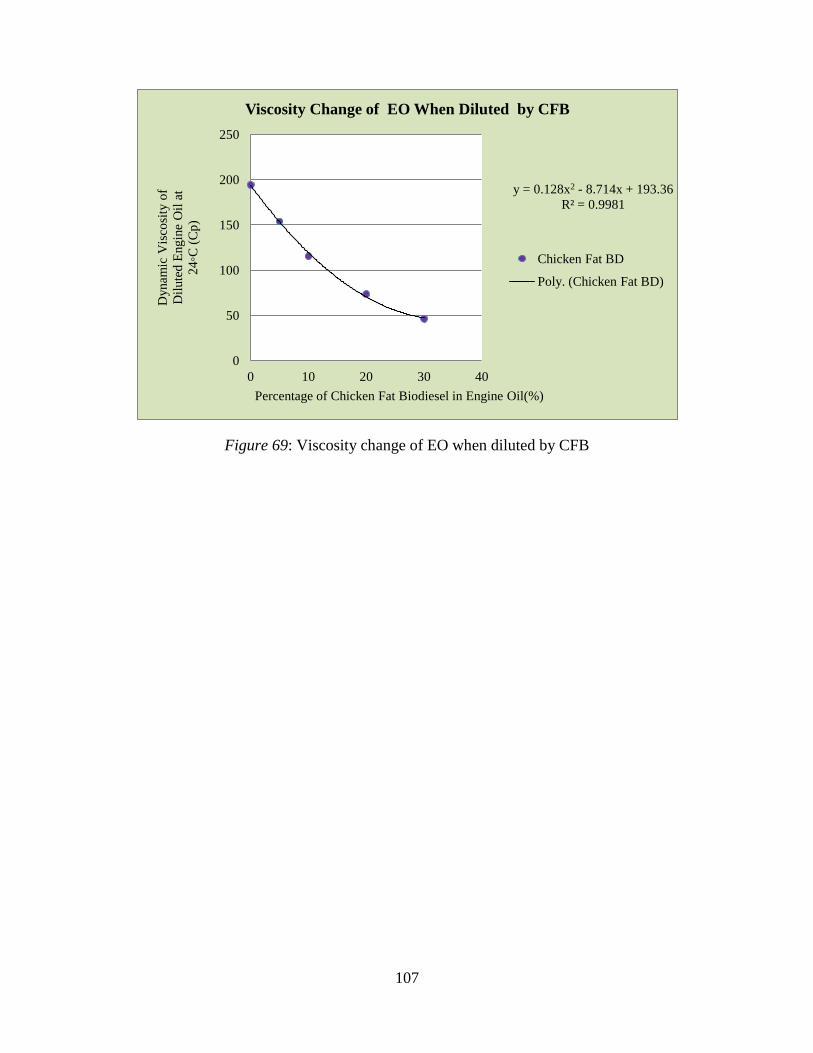
107
Figure 69: Viscosity change of EO when diluted by CFB
y = 0.128x2 - 8.714x + 193.36
R² = 0.9981
0
50
100
150
200
250
0 10 20 30 40
Dynam
ic V
isco
sity
of
Dil
ute
d E
ngin
e O
il a
t
24◦C
(C
p)
Percentage of Chicken Fat Biodiesel in Engine Oil(%)
Viscosity Change of EO When Diluted by CFB
Chicken Fat BD
Poly. (Chicken Fat BD)

108
Figure 70: Viscosity change of CFB diluted EO after the experiment
0
5
10
15
20
25
30
35
40
45
50
0% 10% 20% 30% 40%
Chan
ge
of
Dynam
ic V
isco
sity
at 2
4◦C
(Cp
)
Percentage of CFB in Diluted EO
Viscosity Change of CFB Diluted EO After Test Run
Diluted EO by CFB

109
The measured average friction force was found minimum for the 30% dilution of EO by
CFB as presented in Figure 72. During the test, the friction force reached a stable value after a
3000 seconds run. Figure 73 presents the in-process friction force for all percentage of CFB
diluted EO.
After each test run no significant color change of the engine oil mixture was observed,
which is an indication of good oxidative stability. Typical leftover oil after a test run is presented
in Figure 74.

110
Figure 71: Specific wear amount of the surface in presence of CFB diluted EO.
-5.00E-06
5.90E-19
5.00E-06
1.00E-05
1.50E-05
2.00E-05
2.50E-05
0% 5% 10% 20% 30%
Sp
ecif
ic W
ear(
mm
3/N
m)
Percentage of EO Dilution CFB
Specific Wear of Surface for CFB Diluted Engine Oil
0%
5%
10%
20%
30%

111
Figure 72: Average friction force between the contacted surfaces for CFB
diluted engine oil(EO).
0.29
0.3
0.31
0.32
0.33
0.34
0.35
0.36
Aver
age
Fri
ctio
n F
orc
e (k
g)
CFB Diluted EO
Friction Force Between Contacted Surface
5% CFB Diluted EO
10% CFB Diluted EO
20% CFB Diluted EO
30% CFB Diluted EO

112
Figure 73: In process friction force with the time for CFB diluted EO

113
Figure 74 : The left over oxidized oil after a test run with a typical CFB diluted EO

114
4.3 Friction and Wear Test for Pure Biodiesel
Friction force and wear in the presence of all the four employed B100 or pure biodiesel
(B100: 100% biodiesel) were tested, and the measured friction forces for pure engine oil (15W
40) were used as reference for comparison. Figure 75 presents in-process friction for the B100 of
COB, POB, SOB and CFB. The results indicate that B100 from CFB yields a similar friction
force (or lubricity performance) than that of EO (15W 40). The POB (peanut oil biodiesel)
friction force became similar to that of EO after a 3,000 seconds run. The friction forces for
COB and SOB are comparatively higher than those of EO, POB and CFB.

115
Figure 75: In process friction force with the time for B100 for the four tested biodiesel and EO

116
Specific wear of the surface as measured for all the four types B100 are presented in
Figure 90. The animal fat feedstock biodiesel (chicken fat biodiesel) yielded the minimum
amount of specific wear. Among the vegetable feedstock biodiesels POB yielded the minimum
amount of specific wear. The SOB and COB produce comparatively higher specific wear than
those of the CFB and POB. Specific wear of the surface for pure 15W 40 was also determined
and it is shown in Figure 76 as reference. Although POB and CFB produced lower specific wear,
it was five times greater than that of 15W 40.

117
Figure 76: Specific wear amount of the surface in presence of all four types B100 and pure EO
0.00E+00
2.00E-06
4.00E-06
6.00E-06
8.00E-06
1.00E-05
1.20E-05
1.40E-05
1.60E-05
Sp
ecif
ic W
ear(
mm
3/N
m)
Pure 15W 40 and B100 for Different Feedstock
Specific Wear of Surface for B100 and Pure EO
100% EO
100% CFB
100% POB
100% SOB
100% COB

118
4.4 Overall Comparison of Results
Dynamic viscosity changes patterns are similar for all the four test percentages and types
of biodiesel and they can be adjusted by a quadratic fits as presented in Figure 77. After test run,
the measured dynamic viscosity changes are presents in Figure 78. This figure shows that in the
5% to 20% interval for SOB diluted EO dynamic viscosity significantly dropped as compared to
the other three. In the 20% to 30% SOB and COB diluted EO exhibit almost same pattern. In the
entire tested interval CFB and POB shows the lowest dynamic viscosity drop.

119
Figure 77: Viscosity change of EO when diluted by Biodiesel
40
60
80
100
120
140
160
180
200
0 10 20 30 40
Dynam
ic V
isco
sity
of
Dil
ute
d E
ngin
e O
il a
t
24◦C
(Cp
)
Percentage of Biodiesel in the Engine Oil(%)
Viscosity Change of Engine Oil When Diluted by Biodiesel
BD from Canola Oil
BD from Peanut Oil
BD from Soybean Oil
BD from Chicken Fat

120
Figure 78: Viscosity change of diluted EO after the experiment
0
5
10
15
20
25
30
35
40
45
50
0% 10% 20% 30% 40%
Chan
ge
of
Dynam
ic V
isco
sity
at 2
4◦C
(Cp
)
Percentage of CFB in Diluted EO
Viscosity Change of Diluted EO After Test Run
Diluted EO by CFB
Diluted EO by POB
Diluted EO By COB
Diluted EO by SOB

121
Figure 79: Specific wear amount of the surface in presence of all four types Biodiesel and
Diesel oil diluted Engine oil.
0.00E+00
5.00E-06
1.00E-05
1.50E-05
2.00E-05
2.50E-05 S
pec
ific
Wea
r(m
m3
/Nm
)
Diluted Engine Oil
0%
5%
10%
20%
30%

122
Figure 79 presents the summary of measured wear for all mixtures of the four tested
biodiesel on SAE 15W40 oil, as compared with those from fossil diesel in engine oil mixtures.
The employed engine oil ( SAE 15W 40) also was diluted with fossil diesel, as a set of reference
mixtures, for the same 5%, 10%, 20% and 30% volume ratios, and pin-on-disk tests were carried
out for each mixtures for the same test conditions than those of biodiesel mixtures. For 20% and
30% dilution, the specific wear amount seems to increase as compared to those of 5% and 10%
dilution for the SOB, COB and POB diluted EO; the specific wear amount was higher than that
for CFB diluted EO. The summery of the figure 79 also shows that for the four biodiesels, any
degree of mineral-oil dilution by the tested biodiesels reduces the wear protection performance
of the engine oil in the investigated intervals, even at small amounts, such as the tested 5%
dilution. However, the measured levels of wear for all four biodiesel mixtures, are not
substantially different than corresponding wear values for mixtures of fossil-diesel in same
SAE15W40 engine oil.

123
CHAPTER 5
CONCLUSIONS AND RECOMMENDATIONS FOR FUTURE WORK
Literature review of this thesis work revealed that engine oil contamination can be one of
the main reasons of early engine oil degradation and of eventual engine cessation. Oil can be
become contaminated when unburned or incomplete burnt fuel blows by through the piston rings
and ends up in the crankcase. Although some limited engine oil dilution by diesel engine fuel is
acceptable but when the engine is fueled by biodiesel or biodiesel blend then engine oil dilution
rate and it effects can be different than those from the regular diesel fuel. This is mainly because
of the penetrating, solvencies, and lower distillation temperature of biodiesel than that of diesel
fuel.
Research shows that biodiesel or FAME fuel dilution had a negative impact on engine
oil performance when methyl esters of biodiesel partially degraded and interacted with the
ZDDP anti-wear additives. Biodiesel in the engine oil caused oxidation which produced acid
components and a reduction in TBN (Total Base Number). The effects are influenced by the
FAME properties of biodiesel and it depends upon the feedstock and employed
transesterification process. Feedstock are responsible for various chain length, position ,
number and nature of double bonds or various types acid content in FAME and FAME acid
contents are usually identified as an important viscosity factor in the biodiesel. Recent research
suggested that various types acid contents in FAME such as, FFA, glycerol, antioxidant, palmitic
acid, tecopherol , asolectin helps to reduced WSD or surface wear where as some other FAME

124
components, such as linoleic acid plays a role to interact with the ZDDP anti-wear additives and
increse wear rate on the surface .
In this thesis work the employed pin-on-disk tribometer was refurbished with an updated
data acquisition system. The new data acquisition system acquires and stores in-process friction
force and temperature at the friction joint. This research work showed the feasibility of
employing a pin-on-disk tribometer for testing wear and friction force changes for the mixtures
of biodiesel and engine oil on selected metal surfaces of AISI 1018 steel. All the data collected
during the experiment are compared and some conclusions are drawn about effects of biodiesel
dilution in engine oil.
In this work, specific wear was measured for the different dilution percentages of engine
oil by CBO (canola oil biodiesel). The result shows that for the 10 % dilution the measured
specific wear was the lowest and that for the 20% dilution was the highest. These observed
results could be because of the interactions with the engine oil anti-wear additives ZDDP (Zinc
Dialkyl Dithio Phosphate), which usually bonds to the metallic surfaces to form a protective
layer against wear. The polar components in biodiesel (e.g. fatty acid methyl ester), may also
attracts the ZDDP molecules. Therefore, when ZDDP is not fully attracted to the surface or is
less available to give protection to surface and wear rates may increase. After testing with COB
diluted engine oil for the four dilution percentage, an oxidized layer of oil was observed as left
on the surface and this is observed for all the four tested percentages and it may be an indication
of some reduced oxidative stability of engine oil when it is diluted by COB.
For the 30% dilution of EO by POB, measured average friction force value was the
lowest. The in-process friction force shows that an anti- friction layer was formed on the surface
in a short time. Also for the 20% and 30% POB (Peanut oil biodiesel) diluted EO (engine oil),
the measured friction force is almost steady in the entire 6000s experimental duration. This may

125
be due to some unknown chemical reaction of diluted EO and the contact materials. Small
changes of leftover oil suggested that the POB diluted engine oil does not significantly lose its
stability through oxidation.
For the 30% dilution of EO by SOB, average friction force was measured minimum and
in-process friction force reached a stable value after a 2,000 seconds run, and that indicates that
for diluted EO it would take about 2000 seconds of run to form a low friction layer on the
surface but for the 30% SOB dilution the friction force tends to slightly increases with time. For
all the tested percentage the diluted oil became darker after the test, indicating reduced oxidation
stability for SOB diluted engine oil
For the 30% dilution of EO by CFB, the measured average friction force was found
minimum and during the test, the friction force reached a stable value after a 3,000 seconds run
for all percentage of CFB diluted EO. After each test run no significant color change of the
engine oil mixture was observed, which is an indication of good oxidative stability for the CFB
diluted EO.
Specific wear amounts of the surface measured for all the four types B100 and the animal
fat feedstock biodiesel (chicken fat biodiesel) yielded the minimum amount of specific wear.
Among the vegetable feedstock biodiesels the POB yielded the minimum amount of specific
wear. The SOB and COB produces comparatively higher specific wear than those of the CFB
and POB. Specific wear of the surface for pure 15W 40 was also determined as reference.
Although POB and CFB produced lower specific wear, it was five times greater than that of
SAE15W 40 engine oil.
Dynamic viscosity change patterns are similar for all the four test percentages and types
of biodiesel. After the test run, measured dynamic viscosity of the leftover oil on the surface
shows that in the 5% to 20% interval for SOB diluted EO dynamic viscosity significantly

126
dropped as compared to the other three. In the 20% to 30% SOB and COB diluted EO exhibit
almost same pattern. In the entire tested interval CFB and POB shows the less dynamic viscosity
dropping.
From all the results of this work some general conclusions can also be drawn. The most
important overall conclusion is that, any degree of engine oil dilution by biodiesel reduces the
performance of engine oils even at small amount, such as the tested 5%. For all the tested
biodiesel feedstock dilution at 10% yielded the lowest amounts of surface wear. A probable
reason is may be at the 10% dilution, polor components of biodiesel may exert a little attraction
to the ZDDP of engine oil and ZDDP additives can provide a good wear protection on the
surface.
The overall performance of the tested animal fat feedstock biodiesel diluted engine oil is
better than that of vegetable feedstock biodiesel dilution. Animal fat feedstock biodiesel contains
around 25% of palmitic acid, being higher than that of the vegetable feedstock biodiesel. Animal
fat biodiesel also contains smaller amount of linoleic acid than that of vegetable feedstock
biodiesel. This observation suggest that higher amounts of palmitic acid and lower amounts of
linoleic acid may play an important role in reducing the tested engine oil dilution effects by
biodiesel.
It was also found that among the tested vegetable feedstock biodiesel, peanut oil biodiesel
yields lower surface wear but also higher friction force at the friction joint as compare to those
measured for soybean oil biodiesel and canola oil biodiesel. Peanut oil biodiesel was also found
to yield a better lubricity than the other two vegetable feedstock biodiesels and this may be due
to lower linoleic acid content than for soybean and canola oil biodiesel. It was also observed that
canola oil biodiesel and soybean oil biodiesel diluted engine oil may be prone to faster oxidize in
presence of air and for small increases of temperature as compared to chicken fat biodiesel

127
diluted and peanut oil biodiesel diluted engine oils. The latter could be as stable as pure engine
oil.
The results are suggested that, this sliding contact tribometer exhibit a realistic and a
reproducible result over a wide range of testing condition. So the outcome of this bench test type
research work exhibit a good prediction of biodiesel dilution effect in engine oil and it can be
used as a reference for the future field test.
Remarks for Future Research
With the existing facilities linoeic acid and palmitic acid diluted engine oil can be tested
to observe their direct effect on surface wear and friction properties. A research with the similar
methodology can be performed with the second generation biodiesel i.e. biodiesel from non-food
feedstock. For future research, the existing pin-on-disk instrument should be employed with a
temperature controller of heater for allowing high temperature test and iron alloy can be used as
disk materials to represents the typical contact pairs of engine. Such research can be conducted
for the engine crankcase material at the elevated temperature and it can mimic the real engine
operating condition. A Profilometer can be employed to obtain the worn surface profile and
SEM techniques should be used to observe the surface microstructure change and wear pattern
resulting from the biodiesel diluted engine oil as lubricant. A more advance study of the effects
of biodiesel in engine oil should include by identification and quantification of the by-products
left on surface by using analysis techniques as FTIR and Raman spectroscopy.
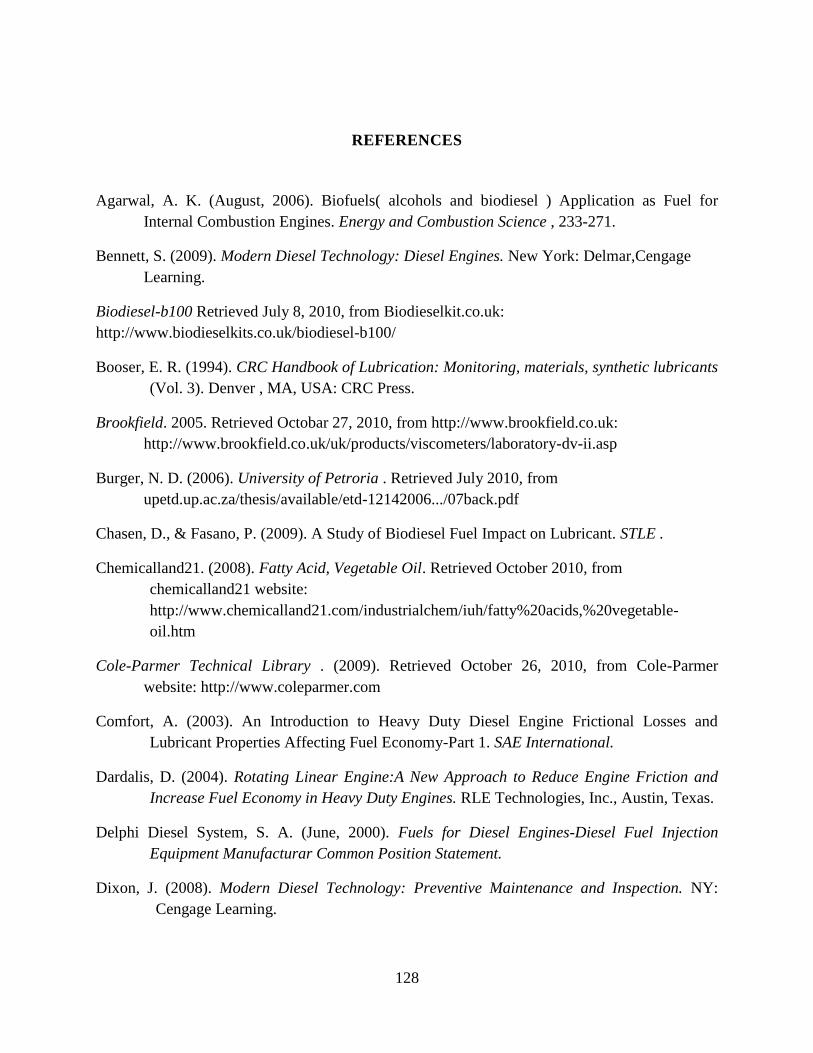
128
REFERENCES
Agarwal, A. K. (August, 2006). Biofuels( alcohols and biodiesel ) Application as Fuel for
Internal Combustion Engines. Energy and Combustion Science , 233-271.
Bennett, S. (2009). Modern Diesel Technology: Diesel Engines. New York: Delmar,Cengage
Learning.
Biodiesel-b100 Retrieved July 8, 2010, from Biodieselkit.co.uk:
http://www.biodieselkits.co.uk/biodiesel-b100/
Booser, E. R. (1994). CRC Handbook of Lubrication: Monitoring, materials, synthetic lubricants
(Vol. 3). Denver , MA, USA: CRC Press.
Brookfield. 2005. Retrieved Octobar 27, 2010, from http://www.brookfield.co.uk:
http://www.brookfield.co.uk/uk/products/viscometers/laboratory-dv-ii.asp
Burger, N. D. (2006). University of Petroria . Retrieved July 2010, from
upetd.up.ac.za/thesis/available/etd-12142006.../07back.pdf
Chasen, D., & Fasano, P. (2009). A Study of Biodiesel Fuel Impact on Lubricant. STLE .
Chemicalland21. (2008). Fatty Acid, Vegetable Oil. Retrieved October 2010, from
chemicalland21 website:
http://www.chemicalland21.com/industrialchem/iuh/fatty%20acids,%20vegetable-
oil.htm
Cole-Parmer Technical Library . (2009). Retrieved October 26, 2010, from Cole-Parmer
website: http://www.coleparmer.com
Comfort, A. (2003). An Introduction to Heavy Duty Diesel Engine Frictional Losses and
Lubricant Properties Affecting Fuel Economy-Part 1. SAE International.
Dardalis, D. (2004). Rotating Linear Engine:A New Approach to Reduce Engine Friction and
Increase Fuel Economy in Heavy Duty Engines. RLE Technologies, Inc., Austin, Texas.
Delphi Diesel System, S. A. (June, 2000). Fuels for Diesel Engines-Diesel Fuel Injection
Equipment Manufacturar Common Position Statement.
Dixon, J. (2008). Modern Diesel Technology: Preventive Maintenance and Inspection. NY:
Cengage Learning.

129
Duffield, J., Shapouri, H., Graboski, M., McCormick, R., & Wilson, R. (1998). U.S Biodiesel
development:New Markets for Conventional and Genetically Modified Agricultural
Products. Economic Research Service, USAD, Washington, DC.
Edwards, D. (2009). Energy Trading and Investing. McGraw-Hill.
EPA. (1999). In-Use Marine Diesel Fuel. Fairfax ,VA.
F. D. Gunstone, J. L. (2007). The Lipid Handbook (Third edition). FL: CRC press.
Fang, H. L., Whitacre, S. D., Yamaguchi, E. S., & Boons, M. (2007). Biodiesel Impact on wear
protection of Engine oil. Powertrain & Fluid Systems Conference and Exhibition.
Chicago, IL.
Fitch, J. (2007, May). Four Lethel Diesel Engine Oil Contaminants. Machinery Lubrication .
Fuel Fact Sheet Retrieved July 26, 2010, from National Biodiesel Board website:
https://docs.google.com/viewer?url=http://www.biodiesel.org/pdf_files/fuelfactsheets/Lu
bricity.PDF
Garpen, J. V. (2004). Business Management for Biodiesel Producer. Oak Ridge: NREL.
Gerpen, J. V. (2010, October). Farm Energy. Retrieved October 2010, from Animal Fats for
Biodiesel Production :
http://www.extension.org/pages/Animal_Fats_for_Biodiesel_Production#Fatty_Acid_Co
ntent_of_Animal_Fats
Gili, F., Igartua, A., Luther, R., & Woydt, M. ( January 2010). The Impact of Biofuels on Engine
oil performance. TAE Esslingen, 17th Int. Colloquium Tribology. Germany.
Graboski, M. S.; McCormick, R. L.; J.D. Ross. (1996). Transient Emission from No.2 Diesel and
Biodiesel Blends in a DDC Series 60 Engines. Society of Automobile Engine
Technology.
Heywood, J. (1988). Internal Combustion Engine Fundamentals. New York: McGraw-Hill.
Hu, J., & Zexue Du, C. L. (2005). Study of Lubrication properties of Biodiesel as Fuel Lubricity
Enhancers. Fule ,Volume 84, Issues 12-13 , 1601-1606.
Jürgen Butt, H., Graf, K., & Kappl, M. (2003). Physics and Chemistry of Interface. Berlin:
Wiley-VCH.
Kern, D. Q. (1965). Process Heat Transfer. London: McGRAW-Hill.
Kholi, R., & Mittal, K. (2008). Developments in Surface Contamination and Cleaning. Norwich,
NY, US: William Andrew Inc.
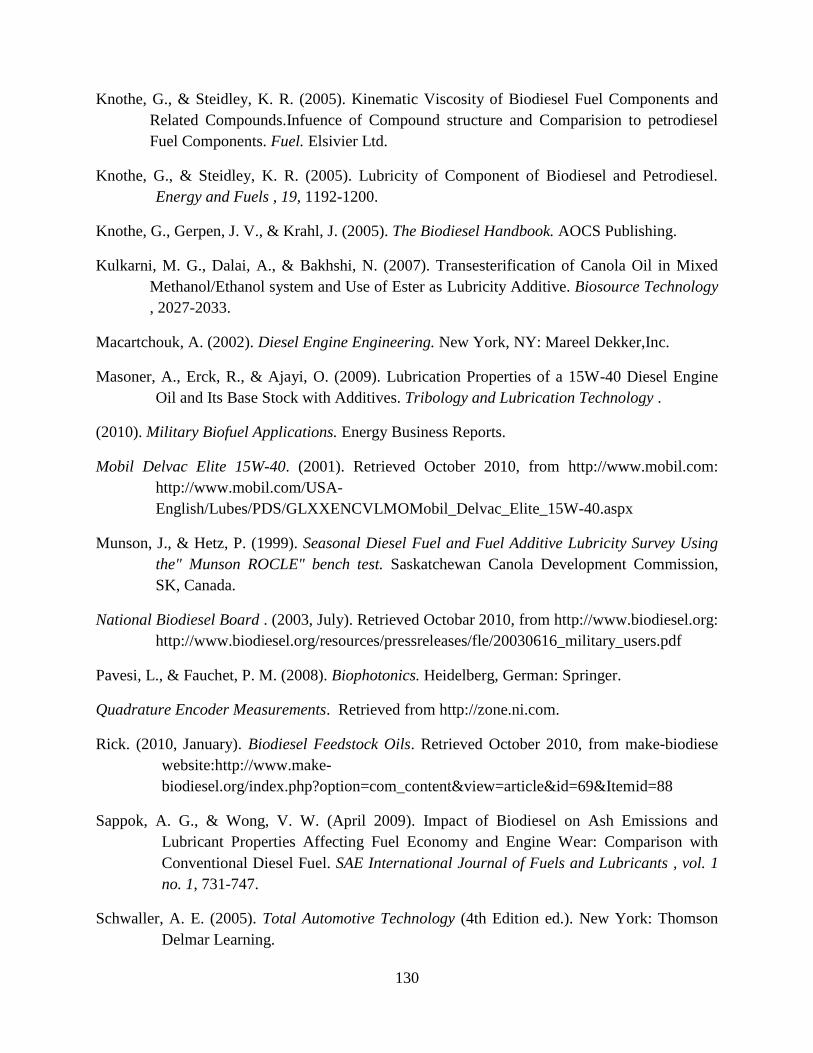
130
Knothe, G., & Steidley, K. R. (2005). Kinematic Viscosity of Biodiesel Fuel Components and
Related Compounds.Infuence of Compound structure and Comparision to petrodiesel
Fuel Components. Fuel. Elsivier Ltd.
Knothe, G., & Steidley, K. R. (2005). Lubricity of Component of Biodiesel and Petrodiesel.
Energy and Fuels , 19, 1192-1200.
Knothe, G., Gerpen, J. V., & Krahl, J. (2005). The Biodiesel Handbook. AOCS Publishing.
Kulkarni, M. G., Dalai, A., & Bakhshi, N. (2007). Transesterification of Canola Oil in Mixed
Methanol/Ethanol system and Use of Ester as Lubricity Additive. Biosource Technology
, 2027-2033.
Macartchouk, A. (2002). Diesel Engine Engineering. New York, NY: Mareel Dekker,Inc.
Masoner, A., Erck, R., & Ajayi, O. (2009). Lubrication Properties of a 15W-40 Diesel Engine
Oil and Its Base Stock with Additives. Tribology and Lubrication Technology .
(2010). Military Biofuel Applications. Energy Business Reports.
Mobil Delvac Elite 15W-40. (2001). Retrieved October 2010, from http://www.mobil.com:
http://www.mobil.com/USA-
English/Lubes/PDS/GLXXENCVLMOMobil_Delvac_Elite_15W-40.aspx
Munson, J., & Hetz, P. (1999). Seasonal Diesel Fuel and Fuel Additive Lubricity Survey Using
the" Munson ROCLE" bench test. Saskatchewan Canola Development Commission,
SK, Canada.
National Biodiesel Board . (2003, July). Retrieved Octobar 2010, from http://www.biodiesel.org:
http://www.biodiesel.org/resources/pressreleases/fle/20030616_military_users.pdf
Pavesi, L., & Fauchet, P. M. (2008). Biophotonics. Heidelberg, German: Springer.
Quadrature Encoder Measurements. Retrieved from http://zone.ni.com.
Rick. (2010, January). Biodiesel Feedstock Oils. Retrieved October 2010, from make-biodiese
website:http://www.make-
biodiesel.org/index.php?option=com_content&view=article&id=69&Itemid=88
Sappok, A. G., & Wong, V. W. (April 2009). Impact of Biodiesel on Ash Emissions and
Lubricant Properties Affecting Fuel Economy and Engine Wear: Comparison with
Conventional Diesel Fuel. SAE International Journal of Fuels and Lubricants , vol. 1
no. 1, 731-747.
Schwaller, A. E. (2005). Total Automotive Technology (4th Edition ed.). New York: Thomson
Delmar Learning.

131
Scott, D. (2009, December). The National Biodiesel Board (NBB). Retrieved Octobar 25, 2010,
from http://www.biodiesel.org/
Stuckey, B. N. (1972). Handbook of Food Additives (2nd edition ed.). (T. Furia, Ed.) Cleveland,
OH: CRC Press.
Sulek, M., Kulczycki, A., & Malysa, A. (2010). Assessment of the Lubricity of Compositions od
Fuel oil with Biocomponents Derived from Rape-seed. Wear 268 , 104-108.
Thornton, M., Alleman, T., Luecke, J., & McCormick, R. (June, 2009). Impact of Biodiesel Fuel
Blends Oil Dilution on Light-Duty Diesel Engine Operation. 2009 SAE International
Powertrain,Fuels and Lubricants Meeting. Florence, Italy.
Totten, G. E. (2001). Bench Testing of Industrial Fluid Lubrication and Wear properties Used in
machinary Application. . Danvers, MA: ASTM.
Tribology,(1994). Instructional Manual: T-11 High Temparature Pin-on-Disk Machine . Poland.
U.S Oilchek. (2007). Retrieved August 8, 2010, from
http://www.usoilcheck.com/oilchek/used+oil+analysis/tutorial/fuel+dilution.asp
Van Garpen, J. ( September, 1996). Cetane Number Testing of Biodiesel. Liquid Fuels and
Industrial Products from Renewable Sources. Nashville, Tennessee.
Wadumestheige, K., Ara, M., Salley, S. O., & Simon Ng, K. (2009). Investigation of Lubricity
Characteristics of Biodiesel in Petroleum Synthetic fuel. Energy and Fuels , 23, 2229-
2234.
Weiksner, J. M., Crump, S. L., & White, T. L. Understading Biodiesel Fuel Quality and
Performence. U.S Department of Energy.

132
APPENDIX A
Rest of the Temperature Change and In-Process Frictional Force Plot
Figure A1: In-process temperature profiles of ball and test chamber vs. time for CFB diluted EO

133
Figure A2: In-process temperature profiles of ball and test chamber vs. time for CFB diluted EO
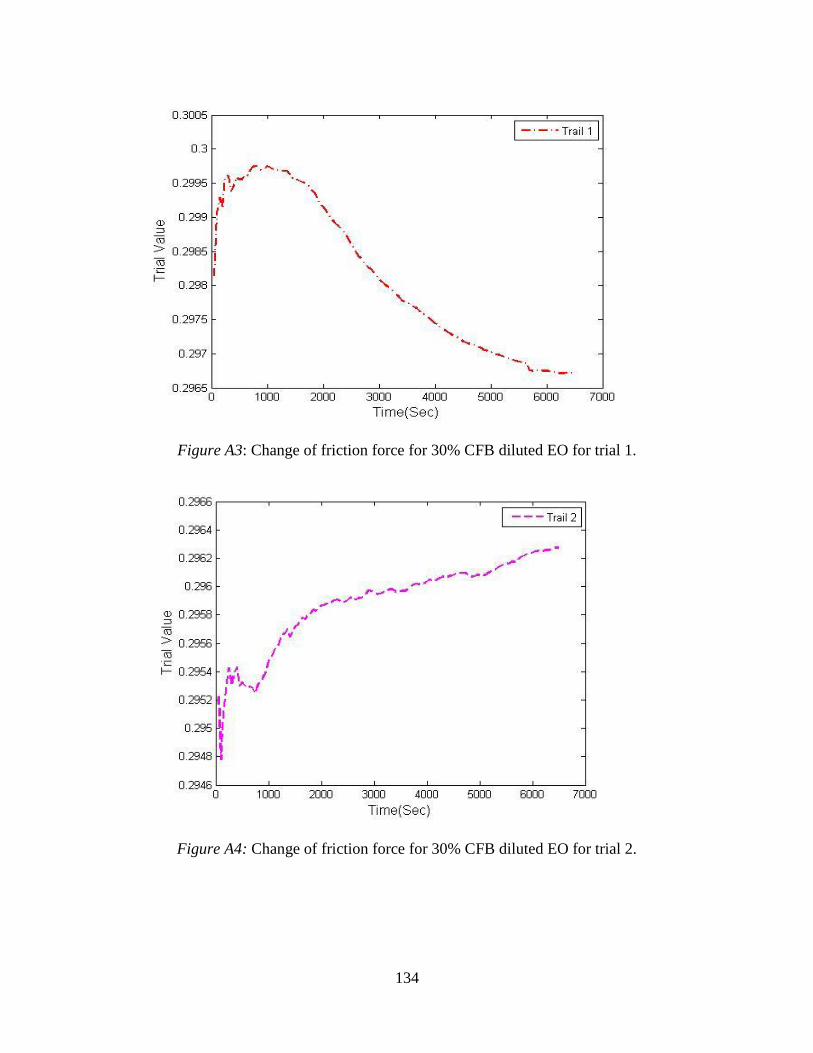
134
Figure A3: Change of friction force for 30% CFB diluted EO for trial 1.
Figure A4: Change of friction force for 30% CFB diluted EO for trial 2.

135
Figure A5: Change of friction force for 30% CFB diluted EO for trial 3.
Figure A6: Change of friction force for 30% CFB diluted EO for three trials.
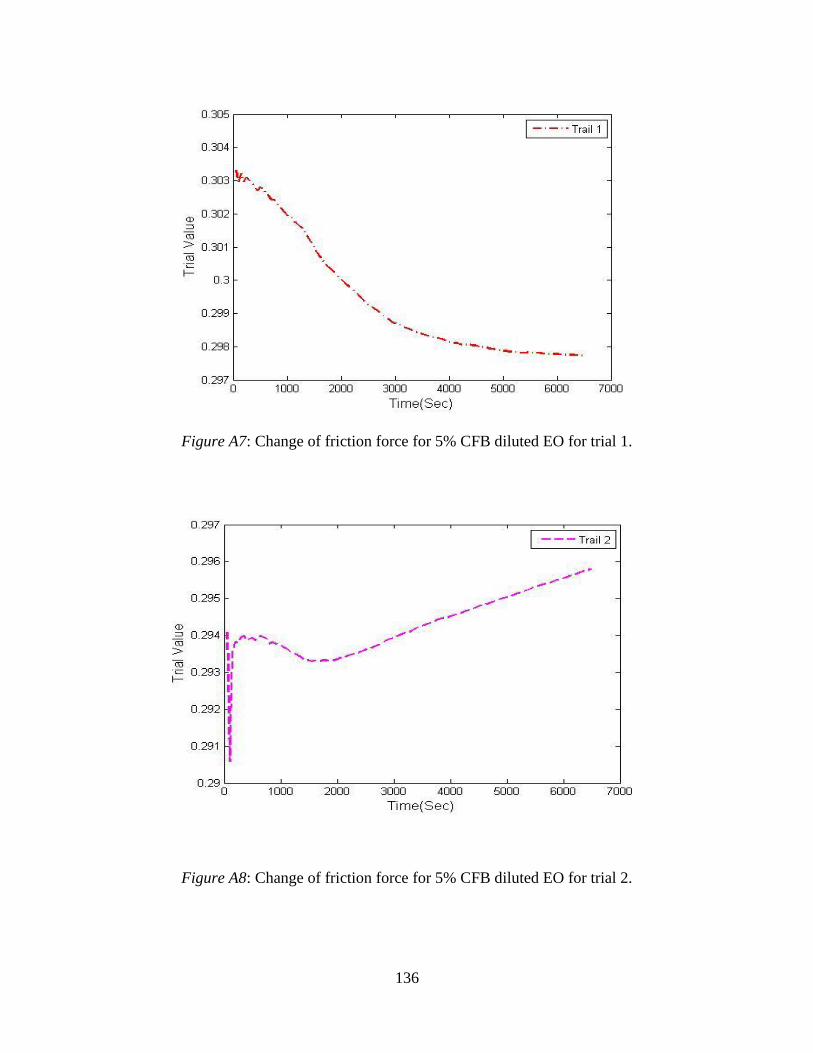
136
Figure A7: Change of friction force for 5% CFB diluted EO for trial 1.
Figure A8: Change of friction force for 5% CFB diluted EO for trial 2.
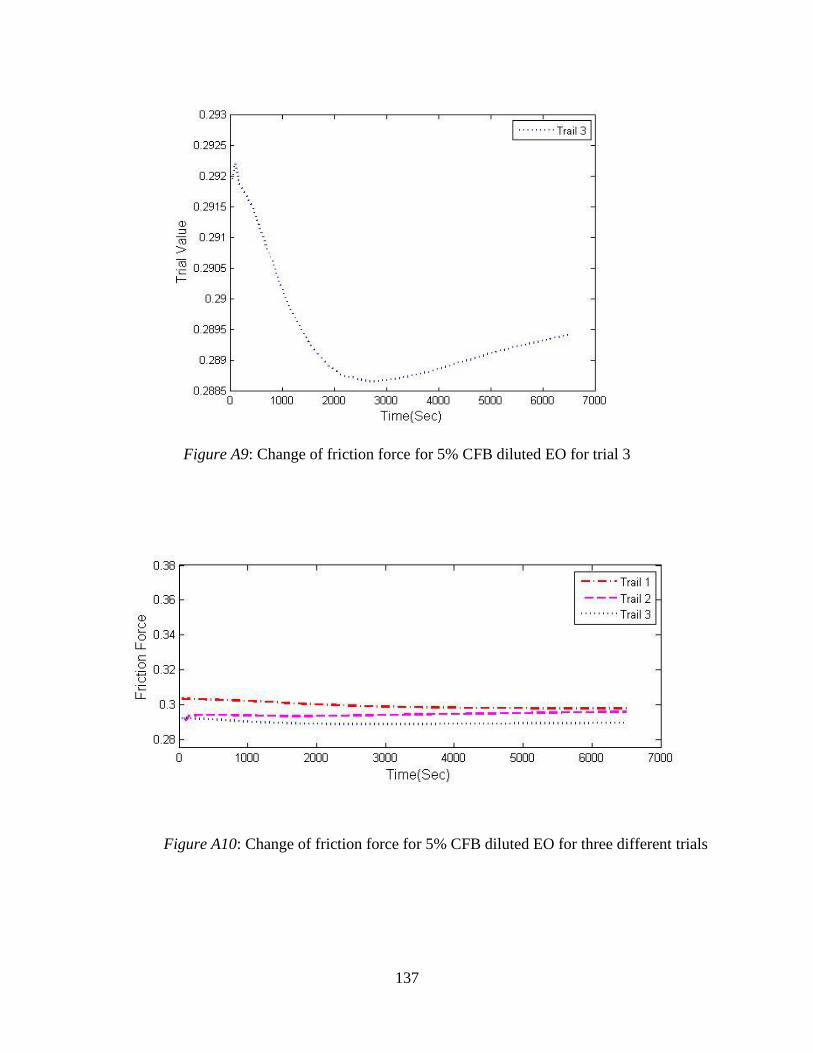
137
Figure A9: Change of friction force for 5% CFB diluted EO for trial 3
Figure A10: Change of friction force for 5% CFB diluted EO for three different trials

138
APPENDIX B
Developed MatLab Code for the Data Analysis
% this progarm will take data from xlsx sheet and draw plots close all; clear all; a=1; b=500; %% Reading data from xls file data=xlsread('canola data.xlsx'); % reading data from the Excel data sheet
% Making avergae every 500 data and then storing then a for i=1:1:130 % storing data every 100 intervel and storing for p=a:1:b; can5(p)=(data(p,2)); can10(p)=(data(p,3)); can20(p)=(data(p,4)); can30(p)=(data(p,5)); end; a=b+1; b=a+499;
canola5(i)=mean(can5); canola10(i)=mean(can10); canola20(i)=mean(can20); canola30(i)=mean(can30); end; %% getting time to plot for i=1:1:130 % storing data every 100 intervel and storing p=i*500; time(i)=data(p,1);
end; %% Plotting figure(1),plot(time,canola5,'-.r','linewidth',1.8); % ploting hold on; plot(time,canola10,'--m','linewidth',1.8); plot(time,canola20,':b','linewidth',1.8); plot(time,canola30,'-k','linewidth',1.8); ylim([0.28 0.38]); % setting y limit xlabel('Time(Sec)','Fontsize',12); ylabel('Frictional Force(kg)','Fontsize',12); legend('5% COB Diluted Engine Oil','10% COB Diluted Engine Oil',... '20% COB Diluted Engine Oil','30% COB Diluted Engine Oil');

139
% this progarm will take data from xlsx sheet and draw plots close all; clear all; a=1; b=500; %% Reading data from xls file data=xlsread('chicken fat.xlsx'); % reading data from the Excel data sheet
% Making avergae every 500 data and then storing then a for i=1:1:130 % storing data every 100 intervel and storing for p=a:1:b; cfb5(p)=(data(p,2)); cfb10(p)=(data(p,3)); cfb20(p)=(data(p,4)); cfb30(p)=(data(p,5)); end; a=b+1; b=a+499;
chickenfat5(i)=mean(cfb5); chickenfat10(i)=mean(cfb10); chickenfat20(i)=mean(cfb20); chickenfat30(i)=mean(cfb30); end; %% getting time to plot for i=1:1:130 % storing data every 100 intervel and storing p=i*500; time(i)=data(p,1);
end; %% Plotting figure(1),plot(time, chickenfat 5,'-.r','linewidth',1.8); % ploting hold on; plot(time, chickenfat 10,'--m','linewidth',1.8); plot(time, chickenfat 20,':b','linewidth',1.8); plot(time, chickenfat 30,'-k','linewidth',1.8); ylim([0.28 0.38]); % setting y limit xlabel('Time(Sec)','Fontsize',12); ylabel('Frictional Force( ^{o}C','Fontsize',12); legend('5% CFB Diluted Engine Oil','10% CFB Diluted Engine Oil',... '20% CFB Diluted Engine Oil','30% CFB Diluted Engine Oil');
% this progarm will take data from xlsx sheet and draw plots close all; clear all; a=1; b=500; %% Reading data from xls file data=xlsread('peanut.xlsx'); % reading data from the Excel data sheet
% Making avergae every 500 data and then storing then a for i=1:1:130 % storing data every 100 intervel and storing for p=a:1:b; pob5(p)=((data(p,2)); pob10(p)=(data(p,3)); pob20(p)=(data(p,4));

140
pob30(p)=(data(p,5)); end; a=b+1; b=a+499;
peanut5(i)=mean(pob5); peanut 10(i)=mean(pob10); peanut 20(i)=mean(pob20); peanut 30(i)=mean(pob30); end; %% getting time to plot for i=1:1:130 % storing data every 100 intervel and storing p=i*500; time(i)=data(p,1);
end; %% Plotting figure(1),plot(time, peanut5,'-.r','linewidth',1.8); % ploting hold on; plot(time, peanut 10,'--m','linewidth',1.8); plot(time, peanut 20,':b','linewidth',1.8); plot(time, peanut 30,'-k','linewidth',1.8); ylim([0.28 0.38]); % setting y limit xlabel('Time(Sec)','Fontsize',12); ylabel('Frictional Force(kg)','Fontsize',12); legend('5% POB Diluted Engine Oil','10% POB Diluted Engine Oil',... '20% POB Diluted Engine Oil','30% POB Diluted Engine Oil');
% this progarm will take data from xlsx sheet and draw plots close all; clear all; a=1; b=500; %% Reading data from xls file data=xlsread('soybean.xlsx'); % reading data from the Excel data sheet
% Making avergae every 500 data and then storing then a for i=1:1:130 % storing data every 100 intervel and storing for p=a:1:b; sob5(p)=(data(p,2)); sob10(p)=(data(p,3)); sob20(p)=(data(p,4)); sob30(p)=(data(p,5)); end; a=b+1; b=a+499;
soybean5(i)=mean(can5); soybean 10(i)=mean(can10); soybean 20(i)=mean(can20); soybean 30(i)=mean(can30); end;

141
%% getting time to plot for i=1:1:130 % storing data every 100 intervel and storing p=i*500; time(i)=data(p,1);
end; %% Plotting figure(1),plot(time, soybean 5,'-.r','linewidth',1.8); % ploting hold on; plot(time, soybean 10,'--m','linewidth',1.8); plot(time, soybean 20,':b','linewidth',1.8); plot(time, soybean 30,'-k','linewidth',1.8); ylim([0.28 0.38]); % setting y limit xlabel('Time(Sec)','Fontsize',12); ylabel('Frictional Force(kg)','Fontsize',12); legend('5% SOB Diluted Engine Oil','10% SOB Diluted Engine Oil',... '20% SOB Diluted Engine Oil','30% SOB Diluted Engine Oil');
% this progarm will take data from xlsx sheet and draw plots close all; clear all; a=2; b=500; %% Reading data from xls file data=xlsread('chicken fat.xlsx'); % reading data from the Excel data sheet
% Making avergae every 500 data and then storing then a for i=1:1:130 % storing data every 100 intervel and storing for p=a:1:b; T105(p)=((data(p,9))); T205(p)=(data(p,10));
T110(p)=((data(p,11))); T210(p)=(data(p,12));
T120(p)=((data(p,13))); T220(p)=(data(p,14));
T130(p)=((data(p,15))); T230(p)=(data(p,16)); end; a=b+1; b=a+499;
mT105(i)=mean(T105); mT205(i)=mean(T205);
mT110(i)=mean(T110); mT210(i)=mean(T210);
mT120(i)=mean(T120); mT220(i)=mean(T220);

142
mT130(i)=mean(T130); mT230(i)=mean(T230);
end; %% getting time to plot for i=1:1:130 % storing data every 100 intervel and storing p=i*500; time(i)=data(p,1);
end; %% Plotting figure(1),plot(time,mT105,'-.r','linewidth',1.8); % ploting hold on; plot(time,mT205,'--m','linewidth',1.8); ylim([15 20]); xlabel('Time(Sec)','Fontsize',12); ylabel('Temperature( ^{o}C)','Fontsize',12); legend('T1','T2');
figure(2),plot(time,mT110,'-.r','linewidth',1.8); % ploting hold on; plot(time,mT210,'--m','linewidth',1.8); ylim([15 20]); xlabel('Time(Sec)','Fontsize',12); ylabel('Temperature( ^{o}C)','Fontsize',12); legend('T1','T2');
figure(3),plot(time,mT120,'-.r','linewidth',1.8); % ploting hold on; plot(time,mT220,'--m','linewidth',1.8); ylim([15 20]); xlabel('Time(Sec)','Fontsize',12); ylabel('Temperature( ^{o}C)','Fontsize',12); legend('T1','T2');
figure(4),plot(time,mT130,'-.r','linewidth',1.8); % ploting ylim([15 20]); hold on; plot(time,mT230,'--m','linewidth',1.8); xlabel('Time(Sec)','Fontsize',12); ylabel('Temperature( ^{o}C)','Fontsize',12); legend('T1','T2');
figure(5), subplot(2,2,1),plot(time,mT105,'-.r','linewidth',1.8); % ploting hold on; plot(time,mT205,'--m','linewidth',1.8); ylim([15 20]); xlabel('Time(Sec)','Fontsize',12); ylabel('Temperature( ^{o}C)','Fontsize',12); legend('T1','T2'); title (['5% CFB Dilute Engine Oil'])
subplot(2,2,2),plot(time,mT110,'-.r','linewidth',1.8); % ploting hold on; plot(time,mT210,'--m','linewidth',1.8); ylim([15 20]); xlabel('Time(Sec)','Fontsize',12); ylabel('Temperature( ^{o}C)','Fontsize',12); legend('T1','T2');

143
title (['10% CFB Dilute Engine Oil'])
subplot(2,2,3),plot(time,mT120,'-.r','linewidth',1.8); % ploting hold on; plot(time,mT220,'--m','linewidth',1.8); ylim([15 20]); xlabel('Time(Sec)','Fontsize',12); ylabel('Temperature( ^{o}C)','Fontsize',12); legend('T1','T2'); title (['20% CFB Dilute Engine Oil'])
subplot(2,2,4),plot(time,mT130,'-.r','linewidth',1.8); % ploting hold on; plot(time,mT230,'--m','linewidth',1.8); ylim([15 20]); xlabel('Time(Sec)','Fontsize',12); ylabel('Temperature( ^{o}C)','Fontsize',12); legend('T1','T2'); title (['30% CFB Dilute Engine Oi
% this progarm will take data from xlsx sheet and draw plots close all; clear all; a=2; b=500; %% Reading data from xls file data=xlsread('peanut.xlsx'); % reading data from the Excel data sheet
% Making avergae every 500 data and then storing then a for i=1:1:130 % storing data every 100 intervel and storing for p=a:1:b; T105(p)=((data(p,9))); T205(p)=(data(p,10));
T110(p)=((data(p,11))); T210(p)=(data(p,12));
T120(p)=((data(p,13))); T220(p)=(data(p,14));
T130(p)=((data(p,15))); T230(p)=(data(p,16)); end; a=b+1; b=a+499;
mT105(i)=mean(T105); mT205(i)=mean(T205);
mT110(i)=mean(T110); mT210(i)=mean(T210);

144
mT120(i)=mean(T120); mT220(i)=mean(T220);
mT130(i)=mean(T130); mT230(i)=mean(T230);
end; %% getting time to plot for i=1:1:130 % storing data every 100 intervel and storing p=i*500; time(i)=data(p,1);
end; %% Plotting figure(1),plot(time,mT105,'-.r','linewidth',1.8); % ploting hold on; plot(time,mT205,'--m','linewidth',1.8); ylim([15 20]); xlabel('Time(Sec)','Fontsize',12); ylabel('Temperature( ^{o}C)','Fontsize',12); legend('T1','T2');
figure(2),plot(time,mT110,'-.r','linewidth',1.8); % ploting hold on; plot(time,mT210,'--m','linewidth',1.8); ylim([15 20]); xlabel('Time(Sec)','Fontsize',12); ylabel('Temperature( ^{o}C)','Fontsize',12); legend('T1','T2');
figure(3),plot(time,mT120,'-.r','linewidth',1.8); % ploting hold on; plot(time,mT220,'--m','linewidth',1.8); ylim([15 20]); xlabel('Time(Sec)','Fontsize',12); ylabel('Temperature( ^{o}C)','Fontsize',12); legend('T1','T2');
figure(4),plot(time,mT130,'-.r','linewidth',1.8); % ploting ylim([15 20]); hold on; plot(time,mT230,'--m','linewidth',1.8); xlabel('Time(Sec)','Fontsize',12); ylabel('Temperature( ^{o}C)','Fontsize',12); legend('T1','T2');
figure(5), subplot(2,2,1),plot(time,mT105,'-.r','linewidth',1.8); % ploting hold on; plot(time,mT205,'--m','linewidth',1.8); ylim([15 20]); xlabel('Time(Sec)','Fontsize',12); ylabel('Temperature( ^{o}C)','Fontsize',12); legend('T1','T2'); title (['5% POB Dilute Engine Oil'])
subplot(2,2,2),plot(time,mT110,'-.r','linewidth',1.8); % ploting hold on; plot(time,mT210,'--m','linewidth',1.8); ylim([15 20]);

145
xlabel('Time(Sec)','Fontsize',12); ylabel('Temperature( ^{o}C)','Fontsize',12); legend('T1','T2'); title (['10% POB Dilute Engine Oil'])
subplot(2,2,3),plot(time,mT120,'-.r','linewidth',1.8); % ploting hold on; plot(time,mT220,'--m','linewidth',1.8); ylim([15 20]); xlabel('Time(Sec)','Fontsize',12); ylabel('Temperature( ^{o}C)','Fontsize',12); legend('T1','T2'); title (['20% POB Dilute Engine Oil'])
subplot(2,2,4),plot(time,mT130,'-.r','linewidth',1.8); % ploting hold on; plot(time,mT230,'--m','linewidth',1.8); ylim([15 20]); xlabel('Time(Sec)','Fontsize',12); ylabel('Temperature( ^{o}C)','Fontsize',12); legend('T1','T2'); title (['30% POB Dilute Engine Oil'])
% this progarm will take data from xlsx sheet and draw plots close all; clear all; a=2; b=500; %% Reading data from xls file data=xlsread('soybean.xlsx'); % reading data from the Excel data sheet
% Making avergae every 500 data and then storing then a for i=1:1:130 % storing data every 100 intervel and storing for p=a:1:b; T105(p)=((data(p,9))); T205(p)=(data(p,10));
T110(p)=((data(p,11))); T210(p)=(data(p,12));
T120(p)=((data(p,13))); T220(p)=(data(p,14));
T130(p)=((data(p,15))); T230(p)=(data(p,16)); end; a=b+1; b=a+499;
mT105(i)=mean(T105); mT205(i)=mean(T205);
mT110(i)=mean(T110); mT210(i)=mean(T210);
mT120(i)=mean(T120);

146
mT220(i)=mean(T220);
mT130(i)=mean(T130); mT230(i)=mean(T230);
end; %% getting time to plot for i=1:1:130 % storing data every 100 intervel and storing p=i*500; time(i)=data(p,1);
end; %% Plotting figure(1),plot(time,mT105,'-.r','linewidth',1.8); % ploting hold on; plot(time,mT205,'--m','linewidth',1.8); ylim([15 20]); xlabel('Time(Sec)','Fontsize',12); ylabel('Temperature( ^{o}C)','Fontsize',12); legend('T1','T2');
figure(2),plot(time,mT110,'-.r','linewidth',1.8); % ploting hold on; plot(time,mT210,'--m','linewidth',1.8); ylim([15 20]); xlabel('Time(Sec)','Fontsize',12); ylabel('Temperature( ^{o}C)','Fontsize',12); legend('T1','T2');
figure(3),plot(time,mT120,'-.r','linewidth',1.8); % ploting hold on; plot(time,mT220,'--m','linewidth',1.8); ylim([15 20]); xlabel('Time(Sec)','Fontsize',12); ylabel('Temperature( ^{o}C)','Fontsize',12); legend('T1','T2');
figure(4),plot(time,mT130,'-.r','linewidth',1.8); % ploting ylim([15 20]); hold on; plot(time,mT230,'--m','linewidth',1.8); xlabel('Time(Sec)','Fontsize',12); ylabel('Temperature( ^{o}C)','Fontsize',12); legend('T1','T2');
figure(5), subplot(2,2,1),plot(time,mT105,'-.r','linewidth',1.8); % ploting hold on; plot(time,mT205,'--m','linewidth',1.8); ylim([15 20]); xlabel('Time(Sec)','Fontsize',12); ylabel('Temperature( ^{o}C)','Fontsize',12); legend('T1','T2'); title (['5% SOB Dilute Engine Oil'])
subplot(2,2,2),plot(time,mT110,'-.r','linewidth',1.8); % ploting hold on; plot(time,mT210,'--m','linewidth',1.8); ylim([15 20]); xlabel('Time(Sec)','Fontsize',12); ylabel('Temperature( ^{o}C)','Fontsize',12);

147
legend('T1','T2'); title (['10% SOB Dilute Engine Oil'])
subplot(2,2,3),plot(time,mT120,'-.r','linewidth',1.8); % ploting hold on; plot(time,mT220,'--m','linewidth',1.8); ylim([15 20]); xlabel('Time(Sec)','Fontsize',12); ylabel('Temperature( ^{o}C)','Fontsize',12); legend('T1','T2'); title (['20% SOB Dilute Engine Oil'])
subplot(2,2,4),plot(time,mT130,'-.r','linewidth',1.8); % ploting hold on; plot(time,mT230,'--m','linewidth',1.8); ylim([15 20]); xlabel('Time(Sec)','Fontsize',12); ylabel('Temperature( ^{o}C)','Fontsize',12); legend('T1','T2'); title (['30% SOB Dilute Engine Oil'])

148
APPENDIX C
SAMPLE PREPARATION
Sample Steel Disk Cutting Process: Parting Operation by Horizontal Lathe
The 25.4 mm diameter steel disk with the width 6 ±1 mm were made by a G 0554
Grizzy gear head floor type horizontal lathe machine. A picture of the lathe used in this work is
presented in Figure C1. The round steel bar or the work piece is hold by the three-jaw self
centering chuck with the help of a rotating clamp, which is presented in Figure C2. Parting
operation of the lathe is applied to slice the round bar, and in this operation of lathe a blade-like
cutting tool, which is shown in Figure C3, is plunged directly into the work piece to cut it off.
Figure C1: Lathe used for making disks in the thesis work

149
The Figure C4 presents the work pieces rotational direction and cutting tools direction of
the parting operation of lathe. The parting operation requires low speed of the spindle; in this
work a 200-250 rpm was maintained to cut the disk. At the end of the cutting process a rough
surface with a protruding part from the center of the disk was obtained. Figure C5 presents the
surface profile of the disk after sliced with the lathe
Figure C2: The chuck holding the round bar in the parting operation.
Figure C3: Carbide cutting tool used for parting operation

150
Figure C4: Basic schematics of parting operation
Figure C5: Surface profile of the disk after parting operation

151
Parting operation also leaves a sharp edge at the end of the work piece. A file was used to
chamfer the edge to avoid hazard. For chamfering the edge, the lathe was running at low speed
(below 100rpm) and a smooth cut file was placed at the edge of work piece at a 45 degree angle.
This yielded a filing edge which is presented in Figure C6.
Figure C6: Chamfering the work- piece edges with file.
Polishing of Steel Disk with the File
The rough disk surface which was presented in Figure C5 is polished with the double cut
flat file to remove the protruding surface. After that a bastard file, a second cut file and a smooth
file are sequentially used. After this polishing with the files, a disk with a surface roughness in
the range 100 to 150μin (Ra value) was obtained. The surface roughness of the disk was
measured with a Mitutoyo SJ 210 roughness measuring tester which is shown in Figure C10.

152
Figure C7: Surface of the disk after polishing with file
Polishing of Steel Disk with Surface Grinder
After polishing the disk with the files, a surface grinder shown in Figure C8 is used to get
a smoother surface. A magnetic chuck in the surface grinder machine holds the work piece or the
disk on it, while a silicon dioxide grinding wheel rotates at 100 rpm on contact with the disk. The
feed rate was adjusted by hand. After polishing the disk with the surface grinder, a surface
roughness in a range 40 to 60 μin (Ra value) was obtained.

153
Figure C8: Surface grinder used for surface finish.
Polishing of Disk with Grit Paper
After polishing the disk with the surface grinder, a 240, 320, 400 and finally 600 grit sand
paper sequences was used. This process yields a mirror like polished surface as presented in
Figure C9. Finally, the disk surfaces are tested to have a roughness in the range of 1 to 10 μin
(Ra value).
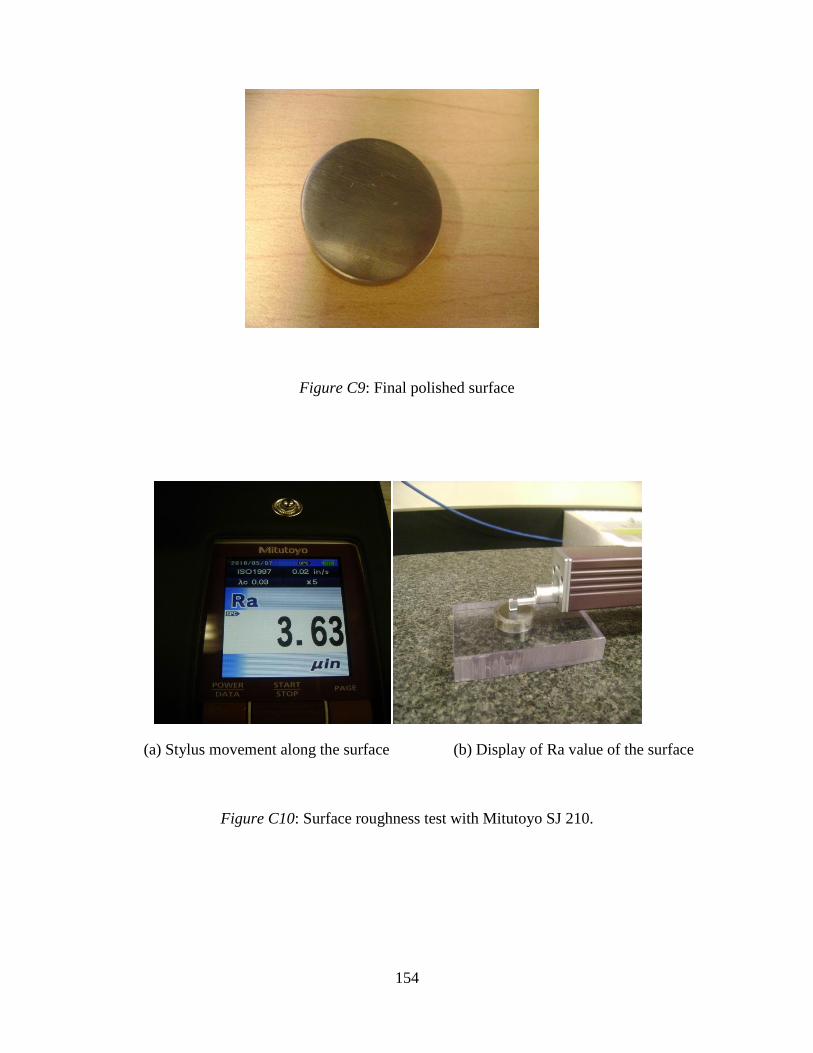
154
Figure C9: Final polished surface
(a) Stylus movement along the surface (b) Display of Ra value of the surface
Figure C10: Surface roughness test with Mitutoyo SJ 210.

![Investigations on Mechanical and Tribological Behaviour of ... › pdf › JMMCE_2013072317260956.pdffatigue and microcracking [6]. Wear is defined as damage to a solid surface, generally](https://img.pdfslide.us/doc/110x75/60b8643c907453512948938b/investigations-on-mechanical-and-tribological-behaviour-of-a-pdf-a-jmmce.jpg)