Embed Size (px)
Citation preview

Investigations of distributions of point defect clusters in lopezite crystals
by etch topography
M. Szurgot1
1 Center of Mathematics and Physics, Technical University of Lodz, Al. Politechniki 11, 90 924 Lodz, Poland
Point defect clusters in potassium bichromate (lopezite) crystals formed during crystal growth and post-growth treatment
with gamma rays from Co source were revealed by chemical etching and analysed. It was established that clusters formed
during crystal growth and localized by flat-bottomed etch pits are non-uniformly distributed in these crystals, and exhibit
sectorial and zonal arrangements. Density of clusters of point defects in various growth sectors is in the range between ten
to four and ten to five inverse square centimetre, and in regions of inclusions and growth bands is one to two order of
magnitude higher. The density of point defect clusters in lopezite crystals grown in low-temperature range (<40 oC) is one
order magnitude higher than density of clusters in crystals grown in high-temperature region (>40 oC). Point defect
clusters and microinclusions are often present in the same sectors. Gamma radiation creates point defects and at high doses
also post-growth dislocations.
Keywords point defects; chemical etching; potassium bichromate; lopezite; radiation induced defects; AFM
1. Introduction
Point defects are present in each crystal, and affect many processes in crystals and modify many physico-chemical
properties of crystals. Some of them are associated with foreign atoms introduced into the crystal during its growth, or
during various post-growth treatments. Point defects markedly modify the optical, electrical, mechanical, magnetic, and
thermodynamic properties of crystals, especially properties of semiconductor crystals, but also ionic and metallic
crystals. Point defect clusters can be formed by heat treatment and by irradiation. Therefore, formation and distribution
of point defects in crystals are related to methods and conditions of crystal growth, and related to post-growth
treatments. Point defects occur individually or form clusters. Clusters can be conventionally revealed by chemical
etching because they are instantaneous centers of preferred dissolution.
Various types of defects in potassium bichromate (lopezite, KBC) crystals have been revealed and studied by X-ray
topography [1], and by chemical etching [2-8]. Inclusions, growth bands and dislocations in synthetic lopezite crystals
have been already intensively studied [1-8]. Etch topography enabled us to localize also point-defect clusters in lopezite
crystals [2], but according to the author’s knowledge detailed studies of the density and distributions of these defects
has not been studied, yet. Recently, the zonal distribution of point defect clusters has been observed [5]. The aim of the
paper was to reveal and analyze point defect clusters occurrence and distributions, and to reveal defects formed by
gamma radiation in lopezite crystals. Localization of point defect clusters formed during crystal growth and post growth
treatment have been revealed by etch topography, and their densities, sectorial and zonal distributions studied.
2. Experimental
Lopezite crystals were grown from aqueous solutions with or without stirring. The growth temperature was either kept
constant in the 5-97 oC range or was lowered at constant rate 0.6-2.5K/hr in the temperature range between 65 and 25
oC. The details of the experimental procedure for crystal growth are described in our earlier papers [4,9]. Growth
temperature of crystals is indicated in parentheses. Lop (35) means the lopezite crystal was grown at 35 oC, and Lop
(40-24) means that the solution during crystallization was constantly cooled from 40 to 24 oC. Point defect clusters,
dislocations, growth bands and growth sector boundaries were revealed on 100, 010 and 001 cleaved surfaces by
etching in various etchants, mainly in formic acid [2-8]. The etched surfaces were examined under optical Zeiss
microscopes in reflection and in transmission, under scanning electron microscopes Tescan VEGA 5135 and Tesla BS
340, and under AFM Veeco Multimode V microscope. Apart from the point defect clusters created during growth of
crystals the post-growth defects formed by γ–quanta from a cobalt gun (γ-quanta from 60
Co, E γ=1.27 MeV and 1.33
MeV) were analyzed. The absorbed γ-ray dose rate was 0.5 Mrad/h (0.14 krad/sec), and doses 100 Mrad.
Microscopy: Science, Technology, Applications and Education A. Méndez-Vilas and J. Díaz (Eds.)
©FORMATEX 2010 2137
______________________________________________

3. Results and discussion
3.1 Pattern of defects revealed by etch topography
Polygonal crystals consist of sectors, i.e. parts grown on various faces. Physical properties of crystals can differ in
different sectors and identification of growth sectors and determination of defects content are important for
characterization of crystalline materials. Microstructure of crystals is revealed during chemical etching and various
optical, electron and AFM microscopes are applied for visualisation and detailed analysis of etch patterns. Figure 1
presents an etch topograph of one of lopezite crystals with its sectors, and the schematic diagram of images of various
defects revealed during chemical etching is shown in Figure 2.
Fig. 1 Etch topograph of Lop (40-24) crystal showing growth bands (GB), growth sector boundaries (GSB), and dislocations (D)
revealed as pyramidal etch pits and as dislocation etch grooves. Induced striations (induced growth bands, GB) have been created
during growth cycles consisted of time intervals 15 min with vigorous stirring, and 15 min without stirring of mother solution.
Etched in HCOOH at 22 oC for 1s. Plane of observation: (100).
Etch topography is the useful method not only in revealing various defects in crystals, but also various phases in
terrestrial and extraterrestrial rocks [10-12], and in investigations of crystal growth history [13]. Figures 1 and 3-5 show
examples of etch topographs obtained on 001 and 100 cleavage faces of lopezite crystals. Typical etch patterns
consist of etch pits, and etch grooves corresponding to various types of defects: dislocations (D), growth bands (GB),
growth sector boundaries (GSB), and point defect clusters (CL, FP).
Fig. 2 Images of various defects in crystals formed during chemical etching. CL-cluster of point defects, FP-flat bottomed etch pit,
IS- impurity striation (growth band), EG – etch groove, D – dislocation, DCEP – centric dislocation etch pit, DEG – dislocation etch
groove, DEPs – dislocation etch pits. dcrit is the minimal distance of dislocation line to be revealed as an etch groove.
Impurity striations called also type I growth bands delineate the instantaneous position of a growth front in a crystal.
They are localized by etch grooves, by rows of dislocation etch pits, and by rows of flat-bottomed etch pits (Rys. 2) [5].
The striations are straight and run parallel to the corresponding edge of a crystal [4-6]. Impurity striations play as
important role in crystal growth investigations as tree rings (growth rings) play in investigations of tree growth. These
structures are seen in cross sections of crystals, and trees, respectively.
Growth sector boundaries also form etch grooves. Their directions are determined by relative growth velocity of two
adjacent faces. Narrow sector boundaries are sites of intersection of growth bands belonging to two adjacent sectors
(Fig. 1). Thick sector boundaries represent sectors of small faces appearing and vanishing during crystal growth [8].
Dislocations, linear defects, are detected by etch topography as pyramidal etch pits, as etch grooves, and as grooves
associated with eccentric etch pits [6]. It depends on the inclination of a dislocation line with respect to the etching
plane. If the dislocation line runs perpendicular to the etching plane then a centric pit forms (Fig. 2), if obliquely
eccentric etch pit associated with an etch groove [6]. Eccentricity of a pit is a measure of the direction of the dislocation
line with respect to the etching (observation) plane [10,11]. When the dislocation line lies in the plane of observation, or
in the parallel plane not too deep into the interior of the crystal (d < dcrit), an etch groove is formed (Figs. 1, 2) [6,7]. For
Microscopy: Science, Technology, Applications and Education A. Méndez-Vilas and J. Díaz (Eds.)
2138 ©FORMATEX 2010
______________________________________________

lopezite dcrit ≈ 100 µm [6]. Dislocation etch grooves in 1)1(0 sector of the Lop (40-24) crystal are shown in Figure 1,
and dislocation etch pits in Lop (35) crystal in Figure 3. Figure 4 presents a 3D AFM image of the etched lopezite
crystal revealing pyramidal, dislocation etch pits, and two regions with different impurity content.
On local crystal defects such as point defect clusters, impurity precipitations, and microinclusions flat-bottomed etch
pits (FP) are formed (Figs. 2, 3). Flat-bottomed etch pits have been revealed in various crystals [10,11].
Fig. 3 Pyramidal, dislocation etch pits, and flat-bottomed etch pits (FP) revealed in Lop (35) crystal after etching successively in
H2O for 1s and in HCOOH for 1s. Optical image. Plane of observation: (001).
a) b)
Fig. 4 (a) 3D AFM image of the etched lopezite crystal revealing pyramidal, dislocation etch pits localized in two distinct regions.
The light grey area of the crystal was grown under forced convection regime, and the dark grey area was formed under free
convection regime of crystal growth. The topograph shows that density of dislocation etch pits within the dark grey region (impurity
striation area) is one order of magnitude larger (7x 106 cm-2) than in the area grown under forced convection (7x 105 cm-2). The
boundary between the two regions is sharp and reveals the flat, shallow terrace with depth about 90 nm with respect to the
neighbouring area. This means that the linear dissolution rate in the impurity striation area is slightly larger than in purer area grown
under forced convection regime. (b) AFM profile of one of the dislocation etch pits shown in Fig. a). The profile enables one to
determine the mean etch pit slope which is equal to 0.45. Plane of observation: (a) (100). Sector ).1(01
3.2 Revelation and identification of point defect clusters
Point-defect clusters are revealed by chemical etching as flat-bottomed etch pits because they are local, instantaneous
centers of dissolution [10,11]. Flat-bottomed pits are nucleated spontaneously during etching at clusters of vacancies
produced in crystals by neutron or gamma irradiation, or by annealing of crystals at elevated temperatures, and at
vacancy clusters produced by quenching crystals from elevated temperatures, as well as at impurity clusters formed
during crystal growth since the vacancy and impurity clusters modify the nucleation kinetics through a lowering of the
surface energy [10,11].
The presence of impurities and vacancy clusters accelerates the general surface dissolution of crystals. Dissolution
rates of crystals at low undersaturations, where reaction rate is surface controlled, are strongly dependent on defect
density, especially on density of dislocations and point-defect clusters, but at high undersaturations, where transport
control dominates, dissolution rate is little influenced by defect density [14].
Microscopy: Science, Technology, Applications and Education A. Méndez-Vilas and J. Díaz (Eds.)
©FORMATEX 2010 2139
______________________________________________
The bulk undersatoration affects the linear dissolution rates and etch patterns [10,11]. The flat-bottomed etch pits are
also formed when dislocations move away under applied stress from their initial to the new positions [10,11]. In
general, the formation and revelation of flat-bottomed etch pits are conditioned by etching conditions and post-growth
treatment of crystals.
To reveal point defect clusters, growth bands and growth sector boundaries in lopezite crystals relatively slow
etchants are preferred [4]. Addition of bi- and trivalent metal chlorides such as SrCl2•6 H2O, CdCI2, CuCl2•2 H2O,
CoCl2•6 H20 and HAuCl4•4 H20 to the slow etchants such as CH3OH and C2H5OH is desirable since the time of etching
is shortened, and more contrasting flat pits are formed at point defect clusters. This feature has been established during
revelation of growth bands and sector boundaries [4]. The flat-bottomed etch pits at point defect clusters disappear with
the time of etching, but new ones appear if deeper lying clusters are present. Only freshly cleaved surfaces of KBC
crystals were etched during these investigations, since etch resistant layers can be formed over a few minutes when
cleaved crystals are stored in air [15].
An analysis of etch topographs on matched halves of lopezite crystals has shown that two groups of flat-bottomed of
etch pits can be distinguished. Etch pits belonging to the first group have not correspondence pits on matched halve, and
those belonging to the second group have the correspondence pits. The flat-bottomed etch pits that have the
correspondence pits are formed at large point-defect clusters, and examples of such pits have been reported in
potassium bichromate crystals in our previous paper [2]. Since density of large clusters is low in lopezite crystals, most
of flat-bottomed pits localize smaller point-defect clusters.
It has been assumed in this paper that the majority of flat-bottomed etch pits localize clusters of foreign and native
ions and vacancies in lopezite crystals and distributions of flat-bottomed etch pits represent distributions of point-defect
clusters being atomic-size complexes containing foreign atoms. To verify the possibilities of dislocation etchants in
revealing of post growth point-defects clusters selected lopezite crystals were irradiated with gamma quanta from a
cobalt 60 source. Since applied here etchants revealed also the radiation induced defects, they proved that are able to
localize defects in crystals independently of the method of their formation.
3.3 Distribution and densities of clusters of point defects in lopezite crystals
Figures 5, 6, and 7 show that flat-bottomed etch pits localizing point-defect clusters are non-uniformly distributed in
lopezite crystals. They exhibit anisotropic sectorial and zonal distributions. Point defect clusters can be found in each
sector as isolated, randomly distributed flat-bottomed etch pits but their density in some sectors is particularly high. Our
data indicate that (100), ,00)1( (010), 0),1(0 01),1( 1),1(0 (012), 11),1( ),11(1 ),1(00 and (001) sectors exhibit a large
number of clusters of point defects (Figs 5, 6, and Table 1).
Table 1 Sectors of lopezite crystals with high content of point defect clusters.
Plane of observation Sector
(100) (100), ,00)1( (010), 0),1(0 01),1( ,1)1(0 )1(00
(010) (100), (010), 01),1( ),1(00 (001)
(001) (100), (010), 0),1(0 01),1( (012), ,11)1( ),111( (001)
In these sectors average FPs densities are in the range between 1.5•104 cm
-2 and 8•10
5 cm
-2, usually 10
5 cm
-2. The local
densities of FPs in the regions of inclusions and growth bands are of the order of 106
cm-2
, typically 4•106
cm-2
, and
1.6•106
cm-2
for inclusions and growth bands, respectively, i.e. one to two orders of magnitude higher (Figs 7, 8, and
Table 2). The gamma irradiated lopezite crystals have also high densities of FPs (5•105
cm-2
). In some sectors flat-
bottomed pits are numerous and form background continuum. FPs density in various sectors of one and the same
crystal varies from a few per cent to eight times. The sectorial distributions indicate that the impurities present in
growth environment are adsorbed and captured by particular crystal faces.
Table 2 Density of clusters of point defects in lopezite crystals.
Average density
in sectors
Inclusions
region
Growth bands
region
γ-irradiated
crystals
1.5•104 - 8•10
5 cm
-2 4•10
6 cm
-2 1.3•10
6 cm
-2 5•10
5 cm
-2
Microscopy: Science, Technology, Applications and Education A. Méndez-Vilas and J. Díaz (Eds.)
2140 ©FORMATEX 2010
______________________________________________
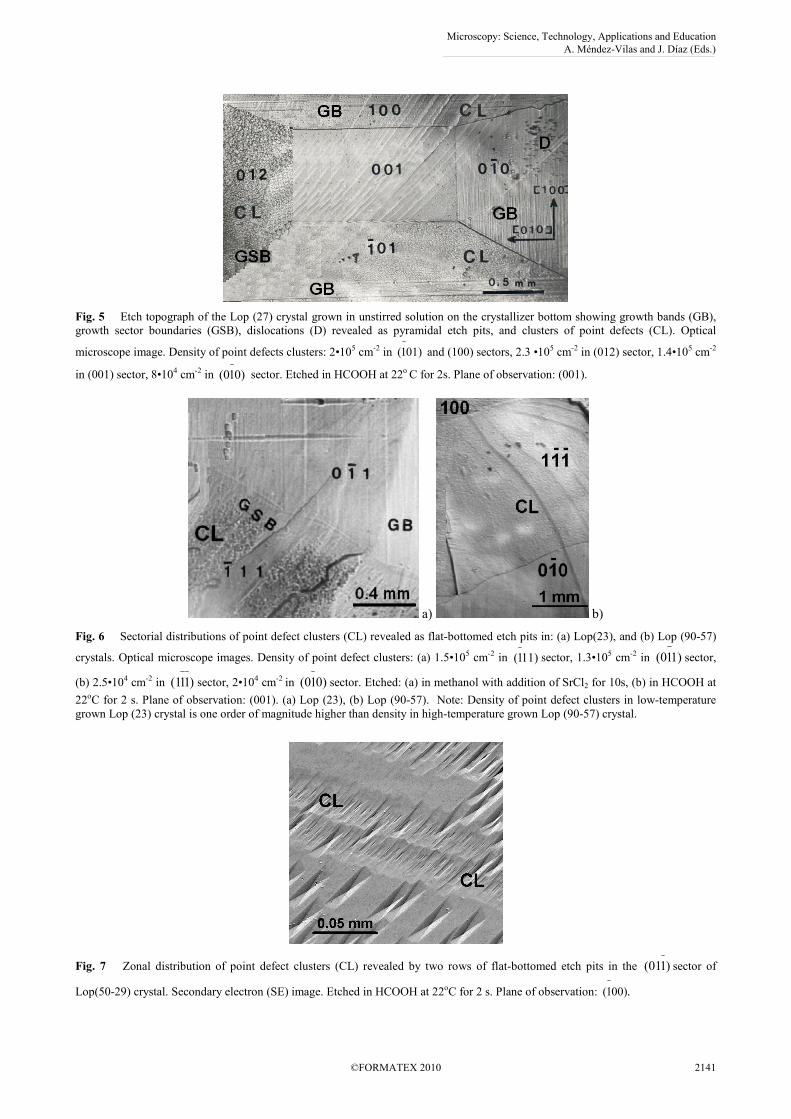
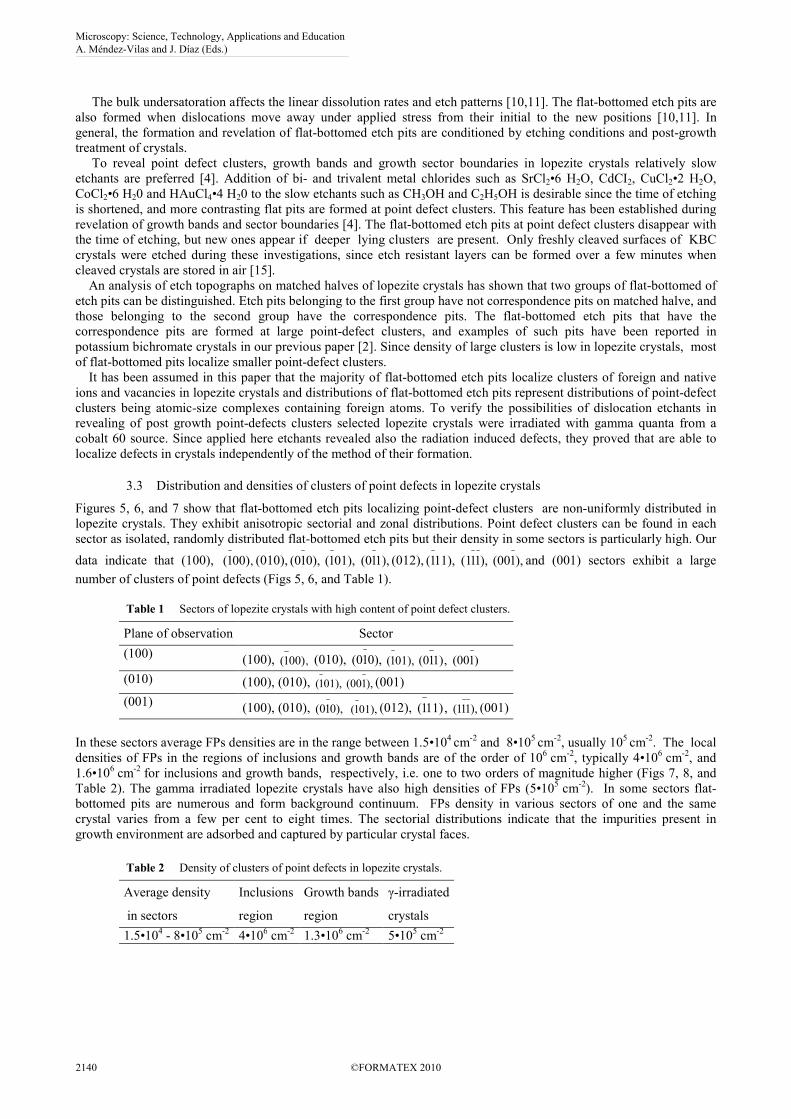
Fig. 5 Etch topograph of the Lop (27) crystal grown in unstirred solution on the crystallizer bottom showing growth bands (GB),
growth sector boundaries (GSB), dislocations (D) revealed as pyramidal etch pits, and clusters of point defects (CL). Optical
microscope image. Density of point defects clusters: 2•105 cm-2 in 01)1( and (100) sectors, 2.3 •105 cm-2 in (012) sector, 1.4•105 cm-2
in (001) sector, 8•104 cm-2 in 0)1(0 sector. Etched in HCOOH at 22o C for 2s. Plane of observation: (001).
a) b)
Fig. 6 Sectorial distributions of point defect clusters (CL) revealed as flat-bottomed etch pits in: (a) Lop(23), and (b) Lop (90-57)
crystals. Optical microscope images. Density of point defect clusters: (a) 1.5•105 cm-2 in 11)1( sector, 1.3•105 cm-2 in 1)1(0 sector,
(b) 2.5•104 cm-2 in )11(1 sector, 2•104 cm-2 in 0)1(0 sector. Etched: (a) in methanol with addition of SrCl2 for 10s, (b) in HCOOH at
22oC for 2 s. Plane of observation: (001). (a) Lop (23), (b) Lop (90-57). Note: Density of point defect clusters in low-temperature
grown Lop (23) crystal is one order of magnitude higher than density in high-temperature grown Lop (90-57) crystal.
Fig. 7 Zonal distribution of point defect clusters (CL) revealed by two rows of flat-bottomed etch pits in the )1(01 sector of
Lop(50-29) crystal. Secondary electron (SE) image. Etched in HCOOH at 22oC for 2 s. Plane of observation: .00)1(
Microscopy: Science, Technology, Applications and Education A. Méndez-Vilas and J. Díaz (Eds.)
©FORMATEX 2010 2141
______________________________________________

3.4 Formation of clusters of point defects in lopezite crystals
Lefaucheux et al. by X-ray topography [1], and Szurgot and Sangwal by etch topography [16], established that
inclusions are the source of dislocations in lopezite crystals. This is a general property of growth dislocations, verified
for a large number of various crystalline materials. Figure 8 reveals that flat-bottomed etch pits delineating point-defect
clusters are nucleated in regions of captured microinclusions, i.e. in regions with high impurity content. This means that
dislocations, localized here as pyramidal etch pits, and point defects are created in these regions, and their density is
high. Our previous and present results concerning spatial distributions of various defects in synthetic lopezite crystals
show that the three types of defects: inclusions [4], impurity striations (growth bands) [4,5] and point defect clusters
(Table 1) are localized in the same sectors.
a) b)
Fig. 8 Formation of flat-bottomed etch pits (FP) at inclusions and around inclusions in Lop (23) crystals. Inclusions are seen here
as black spots. Crystals were etched: (a) in methanol with addition of CoCl2 for 3 min, (b) in solution H3PO4 in acetone (1:3) for 45
s. Density of point defect clusters localized by flat-bottomed etch pits: (a) 4•104 cm-2, (b) 4•106 cm-2. Plane of observation: (a), (b)
).1(00 Optical microscope. Images taken in transmission.
Localization of point defect clusters in sites of nucleation of flat-bottomed etch pits is generally accepted, and it is
accepted also in potassium bichromate crystals [15]. Certain flat-bottomed pits in lopezite crystals reveal dislocation
loops. Since some FPs can nucleate also directly at microinclusions and at precipitations, the density of FPs in regions
with high impurity concentration is expected to be significant. As a result, density of point defect clusters in these
sectors determined by etch topography is rather overestimated, and some other techniques, especially X-ray topography
are desirable. Nevertheless, the etch topography revealed that point defects clusters, dislocations, dislocation loops,
precipitations and impurity striations coexist in the same sectors of the lopezite crystals (e.g. Figs. 8 and 9).
Figure 6 reveals that density of point defect clusters in lopezite crystals grown in low-temperature range (<40 oC) is
one order magnitude higher than density of clusters in crystals grown in high temperature region (>40 oC). This result
is expected since the capture of inclusions, density of dislocations, and intensity of growth bands are higher in lopezite
crystals grown at low temperatures [1,4,5].
Point-defect clusters revealed in lopezite crystals have been created during crystal growth, and in selected
experiments during post-growth treatment by gamma irradiation. The measurements of content of trace elements by
EDXRF technique revealed the presence of foreign elements, mainly Ca (~0.2 wt%), Al (~0.2 wt%), Cu (~0.03 wt%), S
(~0.2 wt%), and Bi (~0.01 wt %) [5]. The same foreign elements were present also in starting potassium bichromate
powders applied for crystallization. Ions of these foreign elements captured by the growing crystals should contribute to
the observed anisotropic distribution of point defect clusters in the lopezite crystals.
Concentration of trapped impurities is either constant or variable in crystals, and various types of nonuniformities:
sectorial, zonal and structural are formed during crystallization [17, 18]. Point-defect clusters distributions exhibit two
types of impurity nonuniformities in lopezite crystals. Sectorial distribution of flat-bottomed etch pits shown in Figs. 5,
and 6 is due to impurity trapping differently by different faces. The zonal nonuniformity shown in Figs. 5-7 is
represented by growth bands occurring in a large number of growth sectors of lopezite crystals. This means that
impurities inside various growth sectors are also distributed in layers parallel to the growth fronts. Such a zonal
distribution is due to different incorporation of impurities at different moments during crystal growth of one and the
same face [17]. Incorporated impurities in lopezite crystals change locally lattice constants, and resultant stress gives
rise to dislocations, growth bands, and to point defect clusters.
Which of the identified foreign elements are responsible for the observed distributions of point defect clusters
remains an open question, but the preferred, sectorial and zonal localization of impurities in lopezite crystals has been
proven by etch topography. It is expected that the sectorial and zonal distributions of point-defect clusters will lead to
sectorial and zonal changes in physical properties of lopezite crystals.
Since the most of the faces of lopezite crystals, in sectors of which the high density of point defect clusters has been
established (Table 1), grow by layer mechanisms [9], the mechanisms of surface adsorption seem to be responsible for
Microscopy: Science, Technology, Applications and Education A. Méndez-Vilas and J. Díaz (Eds.)
2142 ©FORMATEX 2010
______________________________________________

the capture of impurities by such flat faces [18]. Detailed analysis of impurity capture anisotropy in lopezite crystals
should take into consideration different factors: effect of growth conditions, crystallographic structure of faces, and
nature of impurities. This is not an easy task since lopezite crystals depending on growth conditions are bounded by
about thirty faces, usually F faces, but also by S and K faces [9].
Preliminary calculations of differences in impurity concentration for various sectors of lopezite crystals based on
Burton-Prim-Slichter (BPS) model of volume diffusion [19], and anisotropy of growth rate [20] have shown that the
differences in lopezite crystals are of the order of 0.1-0.4 %. To determine the sectorial differences in impurity
concentration the expressions derived by the author have been used. According to Szurgot the relative changes in
concentration of impurities in various sectors of crystals are expressed by dimensionless coefficient Ωsec defined as
Ωsec = (Cs(act)(hkl) - Cs(act)(001)) /Cs(act)(001), (1)
where Cs(act)(hkl) and Cs(act)(001) are concentrations of impurities in sectors (hkl), and (001), respectively. The relative
intersectorial impurity change coefficient Ωsec is given by
Ωsec = (R(001)•δ/D)•(Rrel(hkl) – 1), (2)
where R(001) is the linear growth rate of the reference (001) face, Rrel(hkl) is the relative growth velocity of (hkl) and (001)
faces (Rrel(hkl) = R(hkl) /R(001)), δ is the boundary layer thickness, D is the diffusion coefficient. Let us assume that δ/D =
1000 s/cm, which is a reasonable value. In low temperature growth range, at relative supersaturation 4%, R(001) =
2.5•10-6
cm/s, and Rrel(hkl) = 2.5 for (010) face. Substituting these values into equation (2) gives R(001)•δ/D = 2.5•10-3
, and
Ωsec = 0.37 %. The exemplary value is too small to explain variations of point defect clusters density in various
lopezite sectors. Assuming that density of point defects clusters is proportional to impurity concentration, the
calculation of Ωsec is possible. Substituting values of point defect cluster densities for (001) and (010) faces of Lop (27)
crystal (Fig. 5) into equation (1) gives Ωsec = 43%, i.e. the value two orders of magnitude higher than predicted. This
means that either sectorial distributions of point defect clusters in lopezite crystals are due to differences in the kinetics
of impurity adsorption, and the contribution of the volume diffusion and growth rate anisotropy is small, or contribution
of density of flat-bottomed etch pits nucleated directly on micro-inclusions is significant in some sectors of crystals.
3.5 Post growth defects formed by γ-quanta from a cobalt 60
Co gun
The point-defect clusters created by gamma radiation from 60
Co source have been also revealed and analyzed. Figures
9 a and b present etch topographs of lopezite crystals irradiated with γ–rays from the cobalt 60
Co gun. The absorbed γ-
ray dose rate was 0.14 krad/sec, and doses 100 Mrad. The etch topographs show that new flat-bottomed etch pits and
new pyramidal etch pits are formed during irradiation. This means that the post growth clusters of point defects and the
post growth dislocations and dislocation loops are created inside KBC crystals at high dose rate and high dose. In
addition, dislocation displacement in irradiated lopezite crystals can be also noted (Fig. 9a).
a) b)
Fig. 9 Etch topographs of lopezite crystals revealing defects formed during gamma irradiation. FP- point defects clusters, Di- post-
growth dislocations, DL- moved dislocations and/or dislocation loops, D- growth dislocations. (a) The old, growth dislocations are
seen as large, pyramidal etch pits, and the new dislocations revealed by second etching are seen as smaller pyramidal etch pits. (b)
region with the high density (5•105 cm-2) of point defect clusters (localized by FPs) due to post-growth treatment with gamma
irradiation. The crystals were irradiated with γ–rays for 20 h at dose rate about 0.5 Mrad/h, and dose 100 Mrad. Etched in solution
H3PO4 in methanol (1:2) at 22oC. Time of etching: before irradiation 30 s, after irradiation 30 s. Plane of observation: (001).
The irradiation of ammonium perchlorate crystals with γ–rays, X-rays, and UV light leads to thermal decomposition of
crystals during which ClO3-
ions (proton traps) are formed in the lattice under the action of radiation [21]. It was
Microscopy: Science, Technology, Applications and Education A. Méndez-Vilas and J. Díaz (Eds.)
©FORMATEX 2010 2143
______________________________________________

established that at small doses of irradiation with X-rays (102-103 rad) density of dislocations is not changed [22,23],
and irradiation with γ–rays at medium doses (0.01 Mrad) leads to dislocation displacement in these crystals. If however,
dose absorbed by the crystal exceeds 0.1 Mrad, a noticeable increase in the number of dislocations occurs [22,23]. Our
results for lopezite crystals confirm the findings that at high dose rate and high dose new dislocations are formed in
irradiated crystals, and certain dislocations are moved to the new positions. However, the dose rate and dose applied for
lopezite crystals are higher than those used for ammonium perchlorate.
4. Conclusions
Clusters of point defects containing ions of foreign elements can be localized in lopezite crystals by etch topography.
Clusters localized as flat-bottomed etch pits are non-uniformly distributed in these crystals, and sectorial and zonal
arrangements are common. Density of point defect clusters in various growth sectors of lopezite crystals is in the range
between 104
cm-2
and 105
cm-2
, but in regions of inclusions and growth bands is higher, of the order of 106
cm-2
. Growth
temperature affects the density of clusters of point defect clusters, and the high-temperature grown lopezite crystals
(>40 oC) have one order of magnitude lower density of clusters in comparison to low-temperature grown crystals.
Gamma irradiation creates point defects in irradiated regions and at high doses also post-growth dislocations and
dislocation loops. Etch topography is a valuable tool for localization of point defect clusters in lopezite crystals
independently of the method of their formation. Densities of point defect clusters can be overestimated in sectors and in
growth bands containing a large number of inclusions since flat-bottomed pits nucleate also directly at microinclusions.
Acknowledgements I am grateful to Dr Witold Szymański and Dr Mariusz Dudek for AFM images, and to Mr Włodzimierz
Wypych for SEM images of lopezite crystals.
References
[1] Lefaucheux F, Robert MC, Sangwal K. X-ray topographic study of potassium bichromate crystals; effect of the growth
temperature on the crystalline quality. J. Cryst. Growth. 1984;67:541-548.
[2] Sangwal K, Szurgot M. Etching studies on potassium dichromate (KBC) crystals; Cryst. Res. Technol. 1982;17:49-55.
[3] Szurgot M, Sangwal K. Influence of free convection on the formation of growth defects in potassium bichromate crystals grown
from aqueous solutions; Cryst. Res. Technol. 1987;22:1477-1484.
[4] Szurgot M, Sangwal K, Karniewicz J. Study of inclusions and growth bands in potassium bichromate crystals grown from
aqueous solutions; Cryst. Res. Technol. 1985;20:645-654.
[5] Szurgot M. Investigations of impurity striations in potassium bichromate crystals; Cryst. Res. Technol. 2010;45:347-354.
[6] Szurgot M. Formation of dislocation etch grooves in potassium bichromate crystals; Cryst. Res. Technol. 1990;25:71-79.
[7] Szurgot M. Geometrical properties of dislocations in potassium bichromate crystals; Cryst. Res. Technol. 1990;25:285-296.
[8] Szurgot M. On the formation of thick sector boundaries by appearance and disappearance of faces of crystals; Cryst. Res. Technol. 1993;28:511-518.
[9] Sangwal K, Szurgot M. Growth morphology of potassium bichromate crystals. J. Cryst. Growth. 1987;80:351-365.
[10] Sangwal K. Etching of crystals - theory, experiment and application, Amsterdam, North-Holland: 1987.
[11] Heimann RB. Principles of chemical etching – the art and science of etching crystals. In: Grabmaier J, ed. Crystals: growth,
properties and applications 8, Berlin: Springer;1982:173-224. [12] Szurgot M, Rożniakowski K, Wojtatowicz TW, Polański K. Investigation of microstructure and thermophysical properties of
Morasko iron meteorites; Cryst. Res. Technol. 2008;43:921-930.
[13] Szurgot M, Prywer J. Growth velocities and disappearance of faces of crystals; Cryst. Res. Technol. 1991;26:147-153.
[14] Schott J, Brantley S, Crear D, Guy C, Borcsik M, Willaime C. Dissolution kinetics of strained calcite; Geochim Cosmochim.
Acta. 1989;53:373-382.
[15] Plomp M, van Enckevort WJP, Vlieg E. Etching and surface termination of K2Cr2O7 001 faces observed using in situ atomic
force microscopy; J. Cryst. Growth. 2000;216:413-427.
[16] Szurgot M, Sangwal K. On the growth morphology of K2Cr2O7 (KBC) crystals; Cryst. Res. Technol. 1982;17:39-47.
[17] Chernov AA. Crystallization processes. In: Chernov AA, ed. Modern crystallography III:crystal growth, Berlin:
Springer;1984:1-297. [18] Sangwal K. Additives and crystallization processes: from fundamentals to applications, Chichester, Wiley: 2007. [19] Burton JA, Prim RC, Slichter WP. The distribution of solute in crystals grown from a melt; J. Chem. Phys. 1953;21:1987-1996.
[20] Szurgot M. Growth anisotropy of lopezite crystals; Chemical Geology. 1990;84:329-330.
[21] Boldyrev VV. Thermal decomposition of ammonium perchlorate; Tetrochim. Acta. 2006;443:1-36.
[22] Ivanov EJu, Khairetdinov EF, Mulina TV. Photothermochemical process in ammonium perchlorate crystals:I; J. Solid State
Chem. 1978;26:209-213.
[23] Ivanov EYu, Boldyrev VV, Khairetdinov EF. Photothermochemical process in ammonium perchlorate crystals:II; J. Solid State
Chem. 1978;26:215-221.
Microscopy: Science, Technology, Applications and Education A. Méndez-Vilas and J. Díaz (Eds.)
2144 ©FORMATEX 2010
______________________________________________