Embed Size (px)
Citation preview
Investigation on the Effect of Geometrical and Geotechnical Parameterson Elongated Offshore Piles Using Fuzzy Inference SystemsAli AMINFARa, Alireza MOJTAHEDIb, *, Hamid AHMADIb, Mohammad Hossain AMINFARb
aCivil Engineering Department, Islamic Azad University, Tabriz Branch, Tabriz, IranbFaculty of Civil Engineering, University of Tabriz, Tabriz, Iran
Received November 25, 2015; revised October 10, 2016; accepted December 16, 2016
©2017 Chinese Ocean Engineering Society and Springer-Verlag Berlin Heidelberg
AbstractAmong numerous offshore structures used in oil extraction, jacket platforms are still the most favorable ones inshallow waters. In such structures, log piles are used to pin the substructure of the platform to the seabed. The pile’sgeometrical and geotechnical properties are considered as the main parameters in designing these structures. In thisstudy, ANSYS was used as the FE modeling software to study the geometrical and geotechnical properties of theoffshore piles and their effects on supporting jacket platforms. For this purpose, the FE analysis has been done toprovide the preliminary data for the fuzzy-logic post-process. The resulting data were implemented to create FuzzyInference System (FIS) classifications. The resultant data of the sensitivity analysis suggested that the orientationdegree is the main factor in the pile’s geometrical behavior because piles which had the optimal operational degree ofabout 5° are more sustained. Finally, the results showed that the related fuzzified data supported the FE model andprovided an insight for extended offshore pile designs.Key words: pile, soil, FEM, offshore jacket platform, pile-soil interaction, fuzzy-logic, fuzzification
Citation: Aminfar, A., Mojtahedi, A., Ahmadi, H., Aminfar, M. H., 2017. Investigation on the effect of geometrical and geotechnicalparameters on elongated offshore piles using fuzzy inference systems. China Ocean Eng., 31(3): 378–388, doi: 10.1007/s13344-017-0044-z
1 IntroductionOil and gas are the foundations of any developing na-
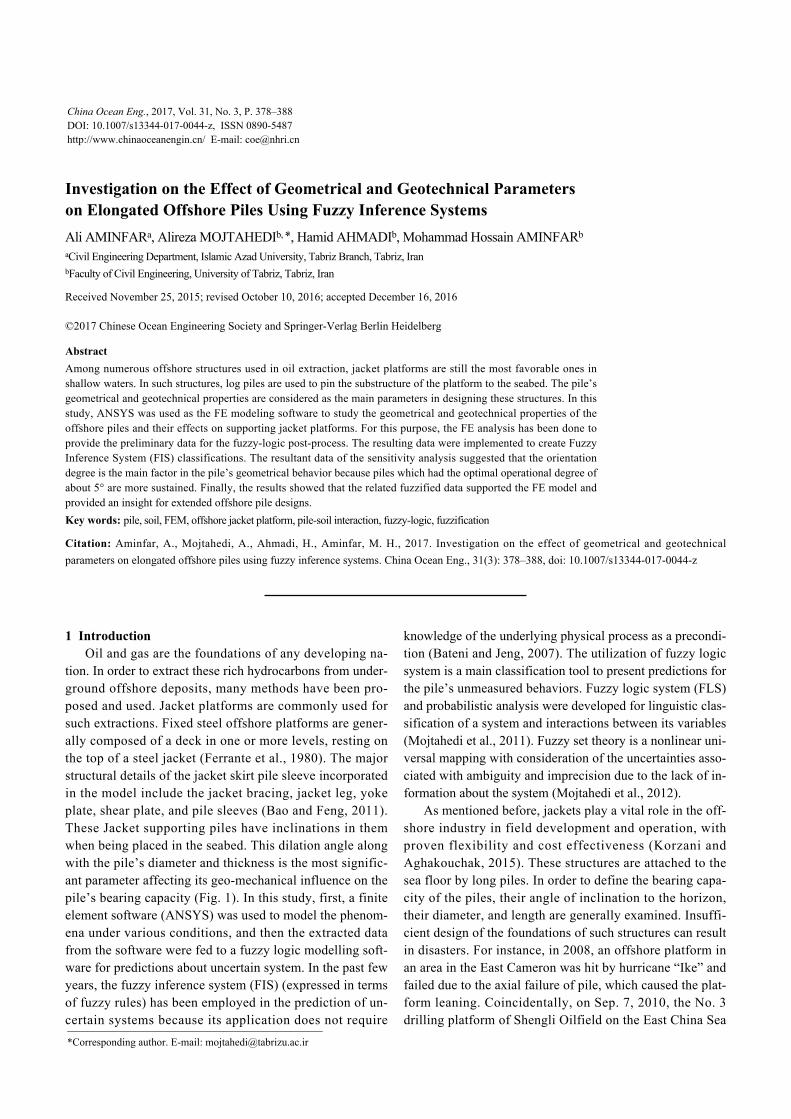
tion. In order to extract these rich hydrocarbons from under-ground offshore deposits, many methods have been pro-posed and used. Jacket platforms are commonly used forsuch extractions. Fixed steel offshore platforms are gener-ally composed of a deck in one or more levels, resting onthe top of a steel jacket (Ferrante et al., 1980). The majorstructural details of the jacket skirt pile sleeve incorporatedin the model include the jacket bracing, jacket leg, yokeplate, shear plate, and pile sleeves (Bao and Feng, 2011).These Jacket supporting piles have inclinations in themwhen being placed in the seabed. This dilation angle alongwith the pile’s diameter and thickness is the most signific-ant parameter affecting its geo-mechanical influence on thepile’s bearing capacity (Fig. 1). In this study, first, a finiteelement software (ANSYS) was used to model the phenom-ena under various conditions, and then the extracted datafrom the software were fed to a fuzzy logic modelling soft-ware for predictions about uncertain system. In the past fewyears, the fuzzy inference system (FIS) (expressed in termsof fuzzy rules) has been employed in the prediction of un-certain systems because its application does not require
knowledge of the underlying physical process as a precondi-tion (Bateni and Jeng, 2007). The utilization of fuzzy logicsystem is a main classification tool to present predictions forthe pile’s unmeasured behaviors. Fuzzy logic system (FLS)and probabilistic analysis were developed for linguistic clas-sification of a system and interactions between its variables(Mojtahedi et al., 2011). Fuzzy set theory is a nonlinear uni-versal mapping with consideration of the uncertainties asso-ciated with ambiguity and imprecision due to the lack of in-formation about the system (Mojtahedi et al., 2012).
As mentioned before, jackets play a vital role in the off-shore industry in field development and operation, withproven flexibility and cost effectiveness (Korzani andAghakouchak, 2015). These structures are attached to thesea floor by long piles. In order to define the bearing capa-city of the piles, their angle of inclination to the horizon,their diameter, and length are generally examined. Insuffi-cient design of the foundations of such structures can resultin disasters. For instance, in 2008, an offshore platform inan area in the East Cameron was hit by hurricane “Ike” andfailed due to the axial failure of pile, which caused the plat-form leaning. Coincidentally, on Sep. 7, 2010, the No. 3drilling platform of Shengli Oilfield on the East China Sea
China Ocean Eng., 2017, Vol. 31, No. 3, P. 378–388DOI: 10.1007/s13344-017-0044-z, ISSN 0890-5487http://www.chinaoceanengin.cn/ E-mail: [email protected]
*Corresponding author. E-mail: [email protected]
was tilted by strong winds during typhoon “Malou” (Chenet al., 2015).
For this study, through the finite element analysis, pileswere positioned in various soil environments and the datacollected have been studied to introduce the optimum geo-metric solution to the supporting pile. In general, nonlinearpile-soil interaction is the most important source of nonlin-ear response of offshore platforms due to designing environ-mental loads. Hence, the lateral cyclic deflection of the plat-form using cyclic backbone curves is considerably higherthan the corresponding results under monotonic loads, andthe pile responses (deflections, shear forces and bendingmoments) by using cyclic curves are more sensitive to cyc-lic loads than those by using static backbone curves(Memarpour et al., 2012).
Stress distribution within such a large platform struc-ture is a dominant factor in the design procedure of an off-shore pile. The loading of an offshore structure consists oftwo vertical structural loads and lateral wave loads. Thepeak displacement of the pile significantly decreases as thewave period increases, In other words, shorter wave periodshave a more critical effect on the pile displacement. (Eicheret al., 2003).
In general, the loading of an offshore structure consistsof two components, the vertical structural loads and the lat-eral wave loads. The combination of these two loading com-ponents has a significant impact on how the pile reacts andthe way that the stress levels are distributed throughout thepile.
The main aim of this study is to investigate the effects ofthe combined loads on an offshore pile with respect to thevarious loading parameters. Results show that the orienta-tion degree must be considered as the main parameter toevaluate the pile’s geometrical behavior. Nevertheless, asnoticed in the literature, many practical problems and diffi-culties caused by various types of uncertainties make it acomplicated issue. On the other hand, there is no report that
directly focuses on the effects of the uncertainties. The mainscope of this study is to circumvent these major problemsby utilizing the concept of well-known techniques for off-shore platform pile design. Consequently, this problem isthe main objective for this study to scrutinize and develop arobust system that can consider the uncertainties and the ef-fects of nonlinearity on the relations between the mentionedparameters.
For this purpose, a combined algorithmic incorporationof fuzzy logic system (FL or FIS) and finite element model-ing (FE modeling) was used to study the effects of the geo-metrical and geotechnical parameters of offshore piles onthe supporting jacket platforms. This method has been pro-posed to consider the uncertainty problems with the consid-eration of benefits and some shortcomings in the literature.The concept of the method was developed based on the non-linear geometric characteristics of the related system re-sponses and the nonlinearities in the nature of the evaluatedsystem. The observed results imply that the method can beserved as an efficient technique to detect the effects of thesensitive parameters.
2 Materials and methods
2.1 Finite element modelingTo create a finite element model in the ANSYS soft-
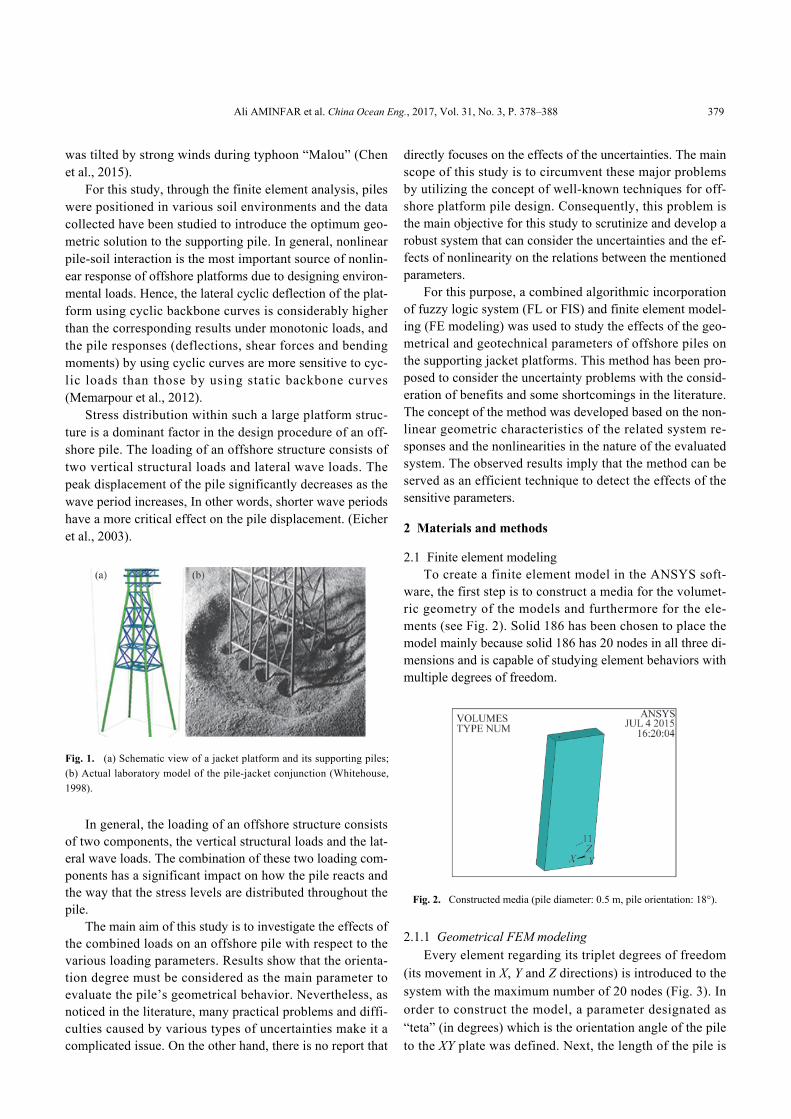
ware, the first step is to construct a media for the volumet-ric geometry of the models and furthermore for the ele-ments (see Fig. 2). Solid 186 has been chosen to place themodel mainly because solid 186 has 20 nodes in all three di-mensions and is capable of studying element behaviors withmultiple degrees of freedom.
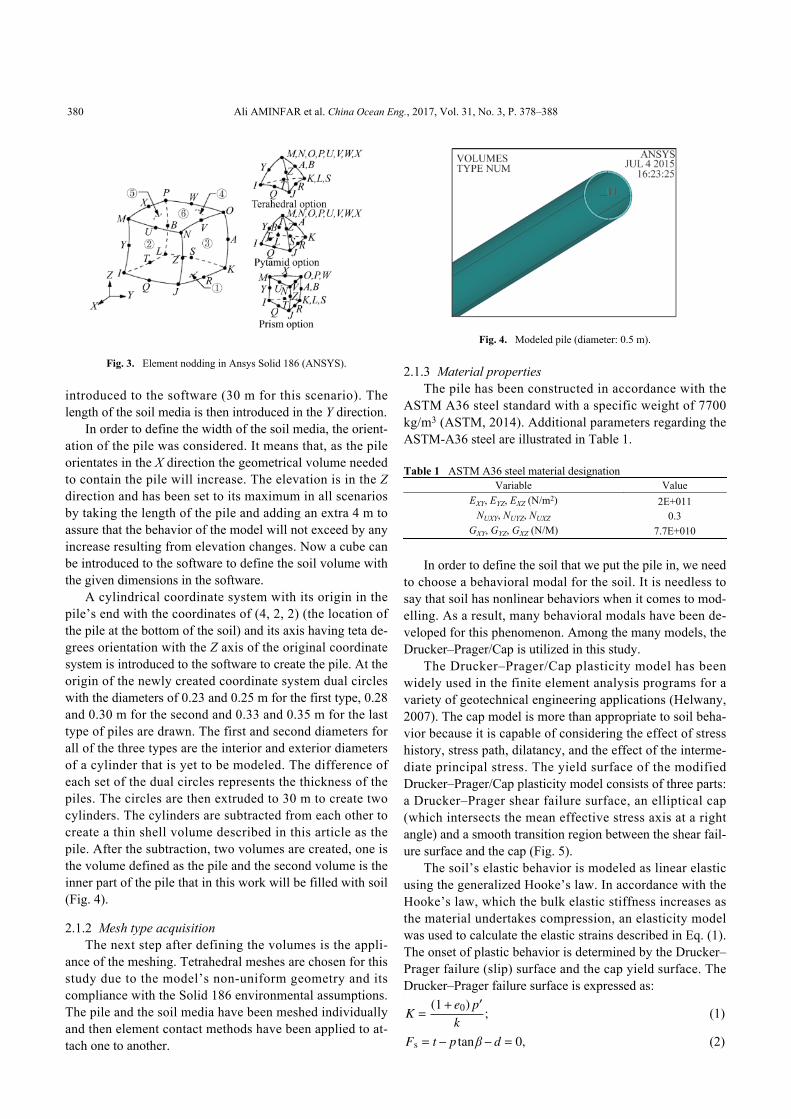
2.1.1 Geometrical FEM modelingEvery element regarding its triplet degrees of freedom
(its movement in X, Y and Z directions) is introduced to thesystem with the maximum number of 20 nodes (Fig. 3). Inorder to construct the model, a parameter designated as“teta” (in degrees) which is the orientation angle of the pileto the XY plate was defined. Next, the length of the pile is
Fig. 1. (a) Schematic view of a jacket platform and its supporting piles;(b) Actual laboratory model of the pile-jacket conjunction (Whitehouse,1998).
Fig. 2. Constructed media (pile diameter: 0.5 m, pile orientation: 18°).
Ali AMINFAR et al. China Ocean Eng., 2017, Vol. 31, No. 3, P. 378–388 379
introduced to the software (30 m for this scenario). Thelength of the soil media is then introduced in the Y direction.
In order to define the width of the soil media, the orient-ation of the pile was considered. It means that, as the pileorientates in the X direction the geometrical volume neededto contain the pile will increase. The elevation is in the Zdirection and has been set to its maximum in all scenariosby taking the length of the pile and adding an extra 4 m toassure that the behavior of the model will not exceed by anyincrease resulting from elevation changes. Now a cube canbe introduced to the software to define the soil volume withthe given dimensions in the software.
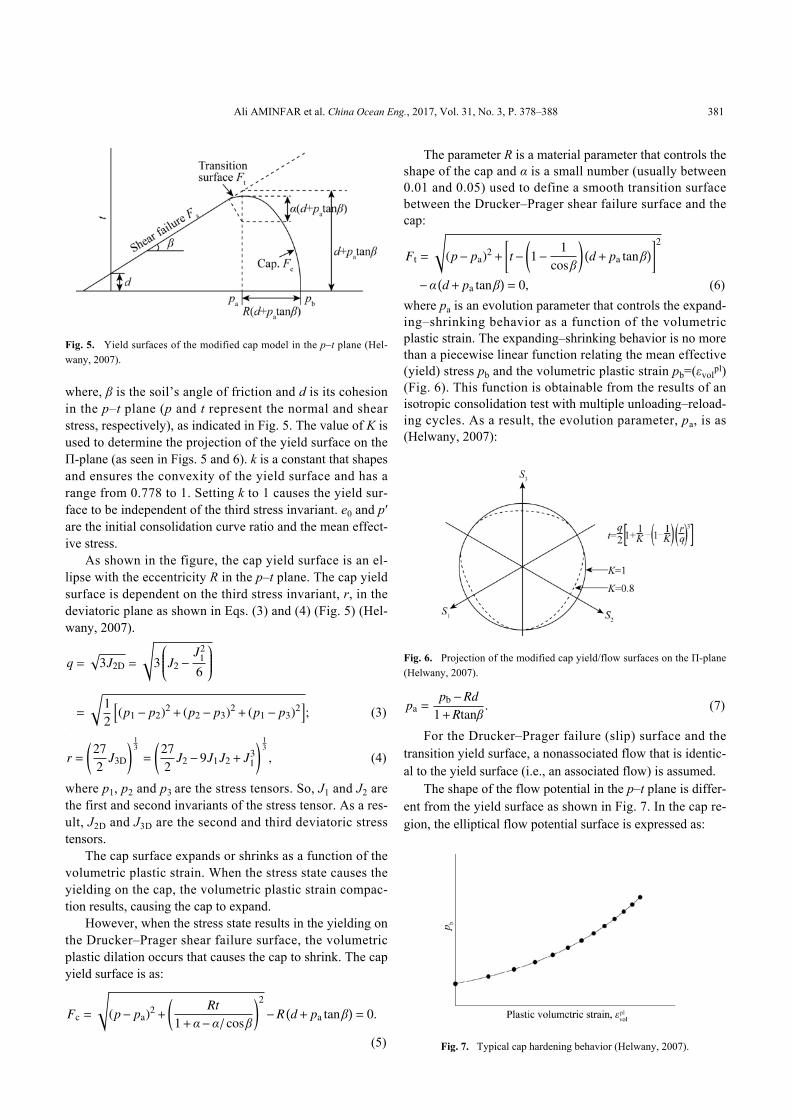
A cylindrical coordinate system with its origin in thepile’s end with the coordinates of (4, 2, 2) (the location ofthe pile at the bottom of the soil) and its axis having teta de-grees orientation with the Z axis of the original coordinatesystem is introduced to the software to create the pile. At theorigin of the newly created coordinate system dual circleswith the diameters of 0.23 and 0.25 m for the first type, 0.28and 0.30 m for the second and 0.33 and 0.35 m for the lasttype of piles are drawn. The first and second diameters forall of the three types are the interior and exterior diametersof a cylinder that is yet to be modeled. The difference ofeach set of the dual circles represents the thickness of thepiles. The circles are then extruded to 30 m to create twocylinders. The cylinders are subtracted from each other tocreate a thin shell volume described in this article as thepile. After the subtraction, two volumes are created, one isthe volume defined as the pile and the second volume is theinner part of the pile that in this work will be filled with soil(Fig. 4).
2.1.2 Mesh type acquisitionThe next step after defining the volumes is the appli-
ance of the meshing. Tetrahedral meshes are chosen for thisstudy due to the model’s non-uniform geometry and itscompliance with the Solid 186 environmental assumptions.The pile and the soil media have been meshed individuallyand then element contact methods have been applied to at-tach one to another.
2.1.3 Material propertiesThe pile has been constructed in accordance with the
ASTM A36 steel standard with a specific weight of 7700kg/m3 (ASTM, 2014). Additional parameters regarding theASTM-A36 steel are illustrated in Table 1.
In order to define the soil that we put the pile in, we needto choose a behavioral modal for the soil. It is needless tosay that soil has nonlinear behaviors when it comes to mod-elling. As a result, many behavioral modals have been de-veloped for this phenomenon. Among the many models, theDrucker–Prager/Cap is utilized in this study.
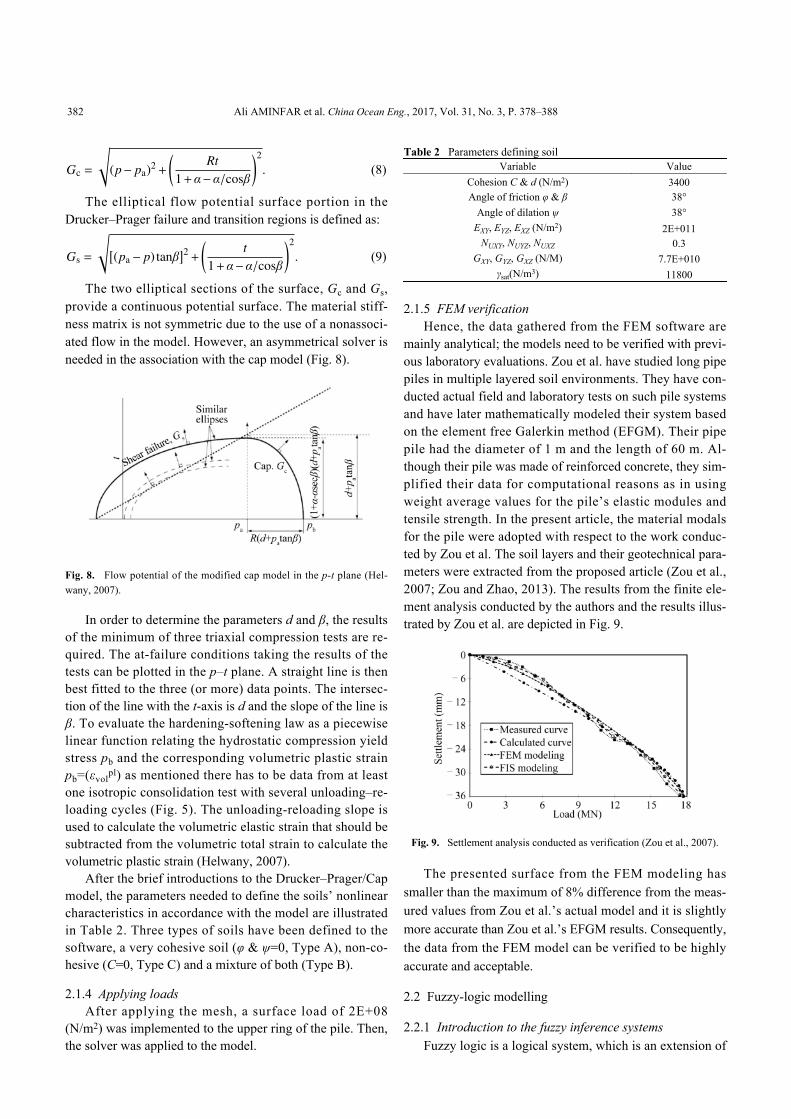
The Drucker–Prager/Cap plasticity model has beenwidely used in the finite element analysis programs for avariety of geotechnical engineering applications (Helwany,2007). The cap model is more than appropriate to soil beha-vior because it is capable of considering the effect of stresshistory, stress path, dilatancy, and the effect of the interme-diate principal stress. The yield surface of the modifiedDrucker–Prager/Cap plasticity model consists of three parts:a Drucker–Prager shear failure surface, an elliptical cap(which intersects the mean effective stress axis at a rightangle) and a smooth transition region between the shear fail-ure surface and the cap (Fig. 5).
The soil’s elastic behavior is modeled as linear elasticusing the generalized Hooke’s law. In accordance with theHooke’s law, which the bulk elastic stiffness increases asthe material undertakes compression, an elasticity modelwas used to calculate the elastic strains described in Eq. (1).The onset of plastic behavior is determined by the Drucker–Prager failure (slip) surface and the cap yield surface. TheDrucker–Prager failure surface is expressed as:
K =(1+ e0) p′
k; (1)
Fs = t− p tanβ−d = 0, (2)
Fig. 3. Element nodding in Ansys Solid 186 (ANSYS).
Fig. 4. Modeled pile (diameter: 0.5 m).
Table 1 ASTM A36 steel material designationVariable Value
EXY, EYZ, EXZ (N/m2) 2E+011NUXY, NUYZ, NUXZ 0.3
GXY, GYZ, GXZ (N/M) 7.7E+010
380 Ali AMINFAR et al. China Ocean Eng., 2017, Vol. 31, No. 3, P. 378–388
where, β is the soil’s angle of friction and d is its cohesionin the p–t plane (p and t represent the normal and shearstress, respectively), as indicated in Fig. 5. The value of K isused to determine the projection of the yield surface on theΠ-plane (as seen in Figs. 5 and 6). k is a constant that shapesand ensures the convexity of the yield surface and has arange from 0.778 to 1. Setting k to 1 causes the yield sur-face to be independent of the third stress invariant. e0 and p′are the initial consolidation curve ratio and the mean effect-ive stress.
As shown in the figure, the cap yield surface is an el-lipse with the eccentricity R in the p–t plane. The cap yieldsurface is dependent on the third stress invariant, r, in thedeviatoric plane as shown in Eqs. (3) and (4) (Fig. 5) (Hel-wany, 2007).
q =√
3J2D =
√3
J2−J2
1
6
=
√12
[(p1− p2)2+ (p2− p3)2+ (p1− p3)2
]; (3)
r =(
272
J3D
) 13
=
(272
J2−9J1J2+ J31
) 13
, (4)
where p1, p2 and p3 are the stress tensors. So, J1 and J2 arethe first and second invariants of the stress tensor. As a res-ult, J2D and J3D are the second and third deviatoric stresstensors.
The cap surface expands or shrinks as a function of thevolumetric plastic strain. When the stress state causes theyielding on the cap, the volumetric plastic strain compac-tion results, causing the cap to expand.
However, when the stress state results in the yielding onthe Drucker–Prager shear failure surface, the volumetricplastic dilation occurs that causes the cap to shrink. The capyield surface is as:
Fc =
√(p− pa)2+
(Rt
1+α−α/cosβ
)2
−R(d+ pa tanβ
)= 0.
(5)
The parameter R is a material parameter that controls theshape of the cap and α is a small number (usually between0.01 and 0.05) used to define a smooth transition surfacebetween the Drucker–Prager shear failure surface and thecap:
Ft =
√(p− pa)2+
[t−
(1− 1
cosβ
) (d+ pa tanβ
)]2
−α (d+ pa tanβ
)= 0, (6)
where pa is an evolution parameter that controls the expand-ing–shrinking behavior as a function of the volumetricplastic strain. The expanding–shrinking behavior is no morethan a piecewise linear function relating the mean effective(yield) stress pb and the volumetric plastic strain pb=(εvolpl)(Fig. 6). This function is obtainable from the results of anisotropic consolidation test with multiple unloading–reload-ing cycles. As a result, the evolution parameter, pa, is as(Helwany, 2007):
pa =pb−Rd
1+Rtanβ. (7)
For the Drucker–Prager failure (slip) surface and thetransition yield surface, a nonassociated flow that is identic-al to the yield surface (i.e., an associated flow) is assumed.
The shape of the flow potential in the p–t plane is differ-ent from the yield surface as shown in Fig. 7. In the cap re-gion, the elliptical flow potential surface is expressed as:
Fig. 5. Yield surfaces of the modified cap model in the p–t plane (Hel-wany, 2007).
Fig. 6. Projection of the modified cap yield/flow surfaces on the Π-plane(Helwany, 2007).
Fig. 7. Typical cap hardening behavior (Helwany, 2007).
Ali AMINFAR et al. China Ocean Eng., 2017, Vol. 31, No. 3, P. 378–388 381
Gc =
√(p− pa)2+
(Rt
1+α−α/cosβ
)2
. (8)
The elliptical flow potential surface portion in theDrucker–Prager failure and transition regions is defined as:
Gs =
√[(pa− p) tanβ
]2+
(t
1+α−α/cosβ
)2
. (9)
The two elliptical sections of the surface, Gc and Gs,provide a continuous potential surface. The material stiff-ness matrix is not symmetric due to the use of a nonassoci-ated flow in the model. However, an asymmetrical solver isneeded in the association with the cap model (Fig. 8).
In order to determine the parameters d and β, the resultsof the minimum of three triaxial compression tests are re-quired. The at-failure conditions taking the results of thetests can be plotted in the p–t plane. A straight line is thenbest fitted to the three (or more) data points. The intersec-tion of the line with the t-axis is d and the slope of the line isβ. To evaluate the hardening-softening law as a piecewiselinear function relating the hydrostatic compression yieldstress pb and the corresponding volumetric plastic strainpb=(εvolpl) as mentioned there has to be data from at leastone isotropic consolidation test with several unloading–re-loading cycles (Fig. 5). The unloading-reloading slope isused to calculate the volumetric elastic strain that should besubtracted from the volumetric total strain to calculate thevolumetric plastic strain (Helwany, 2007).
After the brief introductions to the Drucker–Prager/Capmodel, the parameters needed to define the soils’ nonlinearcharacteristics in accordance with the model are illustratedin Table 2. Three types of soils have been defined to thesoftware, a very cohesive soil (φ & ψ=0, Type A), non-co-hesive (C=0, Type C) and a mixture of both (Type B).
2.1.4 Applying loadsAfter applying the mesh, a surface load of 2E+08
(N/m2) was implemented to the upper ring of the pile. Then,the solver was applied to the model.
2.1.5 FEM verificationHence, the data gathered from the FEM software are
mainly analytical; the models need to be verified with previ-ous laboratory evaluations. Zou et al. have studied long pipepiles in multiple layered soil environments. They have con-ducted actual field and laboratory tests on such pile systemsand have later mathematically modeled their system basedon the element free Galerkin method (EFGM). Their pipepile had the diameter of 1 m and the length of 60 m. Al-though their pile was made of reinforced concrete, they sim-plified their data for computational reasons as in usingweight average values for the pile’s elastic modules andtensile strength. In the present article, the material modalsfor the pile were adopted with respect to the work conduc-ted by Zou et al. The soil layers and their geotechnical para-meters were extracted from the proposed article (Zou et al.,2007; Zou and Zhao, 2013). The results from the finite ele-ment analysis conducted by the authors and the results illus-trated by Zou et al. are depicted in Fig. 9.
The presented surface from the FEM modeling hassmaller than the maximum of 8% difference from the meas-ured values from Zou et al.’s actual model and it is slightlymore accurate than Zou et al.’s EFGM results. Consequently,the data from the FEM model can be verified to be highlyaccurate and acceptable.
2.2 Fuzzy-logic modelling
2.2.1 Introduction to the fuzzy inference systemsFuzzy logic is a logical system, which is an extension of
Fig. 8. Flow potential of the modified cap model in the p-t plane (Hel-wany, 2007).
Fig. 9. Settlement analysis conducted as verification (Zou et al., 2007).
Table 2 Parameters defining soilVariable Value
Cohesion C & d (N/m2) 3400Angle of friction φ & β 38°Angle of dilation ψ 38°
EXY, EYZ, EXZ (N/m2) 2E+011NUXY, NUYZ, NUXZ 0.3
GXY, GYZ, GXZ (N/M) 7.7E+010γsat(N/m3) 11800
382 Ali AMINFAR et al. China Ocean Eng., 2017, Vol. 31, No. 3, P. 378–388
multivalued logic. The purpose of the fuzzy logic is to mapan input space onto an output space, and the primary mech-anism for doing this is a list of if-then statements calledrules. All rules are evaluated in parallel, and the order of therules is unimportant. In other words, the fuzzy inference is amethod that interprets the values in the input vector and isbased on some set of rules, which assigns values to the out-put vector. As a part of Matlab, the fuzzy logic toolbox soft-ware can perform as a tool for solving problems with thefuzzy logic (Zandi Goharrizi et al., 2014).
In general, any fuzzy system contains the followingsteps:
(1) Inference system definition based on data: Analysisoperation is applied by the fuzzy inference engine. There areseveral fuzzy inference systems which can be utilized forthis purpose, such as Sugeno and Mamdani fuzzy inferencesystems which are two of the most important ones;
(2) Membership function definition: Input information ismade as fuzzy data by membership functions. This step isknown as fuzzification;
(3) Inference rule definition and combination;(4) Obtaining results and defuzzification if being needed
(Zandi Goharrizi et al., 2014).
2.2.2 Creating the fuzzy logic systemIn the following article, Mamdani fuzzy inference sys-
tems for investigation have been utilized. Fig. 10 illustrates
the Mamdani fuzzy inference systems for the settlementanalysis. For the other four parameters’ extracted from theFEM software “ANSYS”, similar systems have been utilized.
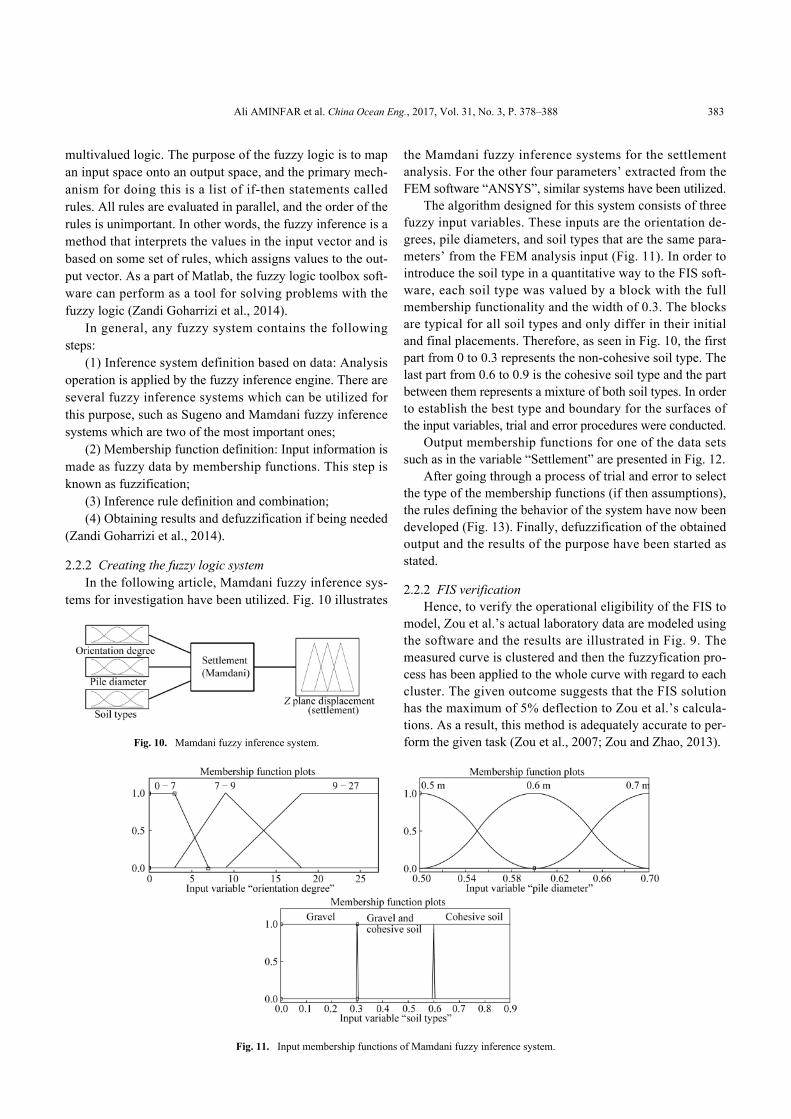
The algorithm designed for this system consists of threefuzzy input variables. These inputs are the orientation de-grees, pile diameters, and soil types that are the same para-meters’ from the FEM analysis input (Fig. 11). In order tointroduce the soil type in a quantitative way to the FIS soft-ware, each soil type was valued by a block with the fullmembership functionality and the width of 0.3. The blocksare typical for all soil types and only differ in their initialand final placements. Therefore, as seen in Fig. 10, the firstpart from 0 to 0.3 represents the non-cohesive soil type. Thelast part from 0.6 to 0.9 is the cohesive soil type and the partbetween them represents a mixture of both soil types. In orderto establish the best type and boundary for the surfaces ofthe input variables, trial and error procedures were conducted.
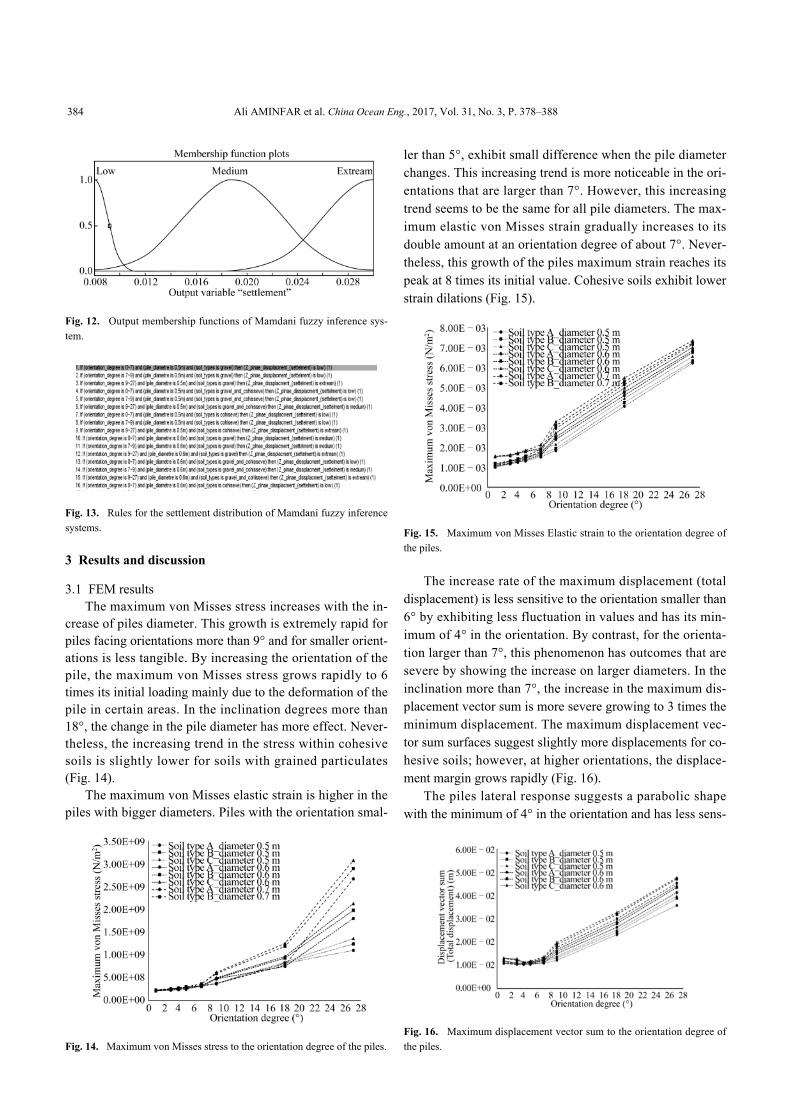
Output membership functions for one of the data setssuch as in the variable “Settlement” are presented in Fig. 12.
After going through a process of trial and error to selectthe type of the membership functions (if then assumptions),the rules defining the behavior of the system have now beendeveloped (Fig. 13). Finally, defuzzification of the obtainedoutput and the results of the purpose have been started asstated.
2.2.2 FIS verificationHence, to verify the operational eligibility of the FIS to
model, Zou et al.’s actual laboratory data are modeled usingthe software and the results are illustrated in Fig. 9. Themeasured curve is clustered and then the fuzzyfication pro-cess has been applied to the whole curve with regard to eachcluster. The given outcome suggests that the FIS solutionhas the maximum of 5% deflection to Zou et al.’s calcula-tions. As a result, this method is adequately accurate to per-form the given task (Zou et al., 2007; Zou and Zhao, 2013).
Fig. 10. Mamdani fuzzy inference system.
Fig. 11. Input membership functions of Mamdani fuzzy inference system.
Ali AMINFAR et al. China Ocean Eng., 2017, Vol. 31, No. 3, P. 378–388 383
3 Results and discussion
3.1 FEM resultsThe maximum von Misses stress increases with the in-
crease of piles diameter. This growth is extremely rapid forpiles facing orientations more than 9° and for smaller orient-ations is less tangible. By increasing the orientation of thepile, the maximum von Misses stress grows rapidly to 6times its initial loading mainly due to the deformation of thepile in certain areas. In the inclination degrees more than18°, the change in the pile diameter has more effect. Never-theless, the increasing trend in the stress within cohesivesoils is slightly lower for soils with grained particulates(Fig. 14).
The maximum von Misses elastic strain is higher in thepiles with bigger diameters. Piles with the orientation smal-
ler than 5°, exhibit small difference when the pile diameterchanges. This increasing trend is more noticeable in the ori-entations that are larger than 7°. However, this increasingtrend seems to be the same for all pile diameters. The max-imum elastic von Misses strain gradually increases to itsdouble amount at an orientation degree of about 7°. Never-theless, this growth of the piles maximum strain reaches itspeak at 8 times its initial value. Cohesive soils exhibit lowerstrain dilations (Fig. 15).
The increase rate of the maximum displacement (totaldisplacement) is less sensitive to the orientation smaller than6° by exhibiting less fluctuation in values and has its min-imum of 4° in the orientation. By contrast, for the orienta-tion larger than 7°, this phenomenon has outcomes that aresevere by showing the increase on larger diameters. In theinclination more than 7°, the increase in the maximum dis-placement vector sum is more severe growing to 3 times theminimum displacement. The maximum displacement vec-tor sum surfaces suggest slightly more displacements for co-hesive soils; however, at higher orientations, the displace-ment margin grows rapidly (Fig. 16).
The piles lateral response suggests a parabolic shapewith the minimum of 4° in the orientation and has less sens-
Fig. 12. Output membership functions of Mamdani fuzzy inference sys-tem.
Fig. 13. Rules for the settlement distribution of Mamdani fuzzy inferencesystems.
Fig. 14. Maximum von Misses stress to the orientation degree of the piles.
Fig. 15. Maximum von Misses Elastic strain to the orientation degree ofthe piles.
Fig. 16. Maximum displacement vector sum to the orientation degree ofthe piles.
384 Ali AMINFAR et al. China Ocean Eng., 2017, Vol. 31, No. 3, P. 378–388
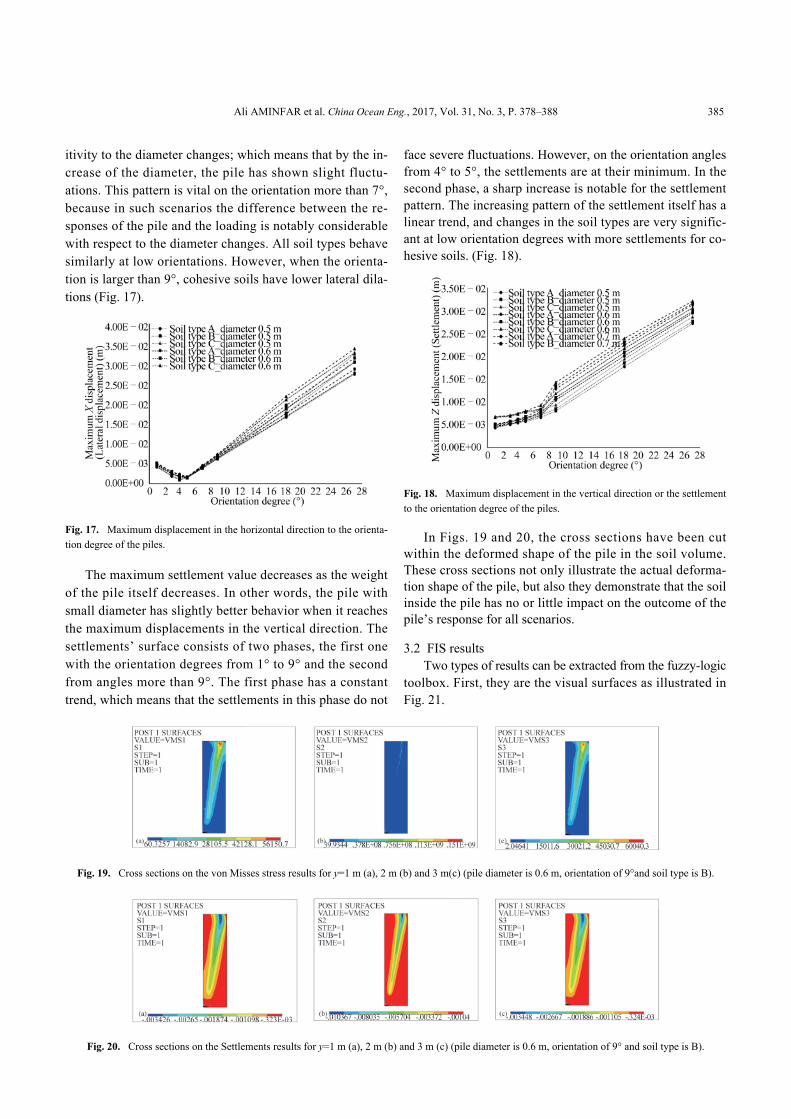
itivity to the diameter changes; which means that by the in-crease of the diameter, the pile has shown slight fluctu-ations. This pattern is vital on the orientation more than 7°,because in such scenarios the difference between the re-sponses of the pile and the loading is notably considerablewith respect to the diameter changes. All soil types behavesimilarly at low orientations. However, when the orienta-tion is larger than 9°, cohesive soils have lower lateral dila-tions (Fig. 17).
The maximum settlement value decreases as the weightof the pile itself decreases. In other words, the pile withsmall diameter has slightly better behavior when it reachesthe maximum displacements in the vertical direction. Thesettlements’ surface consists of two phases, the first onewith the orientation degrees from 1° to 9° and the secondfrom angles more than 9°. The first phase has a constanttrend, which means that the settlements in this phase do not
face severe fluctuations. However, on the orientation anglesfrom 4° to 5°, the settlements are at their minimum. In thesecond phase, a sharp increase is notable for the settlementpattern. The increasing pattern of the settlement itself has alinear trend, and changes in the soil types are very signific-ant at low orientation degrees with more settlements for co-hesive soils. (Fig. 18).
In Figs. 19 and 20, the cross sections have been cutwithin the deformed shape of the pile in the soil volume.These cross sections not only illustrate the actual deforma-tion shape of the pile, but also they demonstrate that the soilinside the pile has no or little impact on the outcome of thepile’s response for all scenarios.
3.2 FIS resultsTwo types of results can be extracted from the fuzzy-logic
toolbox. First, they are the visual surfaces as illustrated inFig. 21.
Fig. 17. Maximum displacement in the horizontal direction to the orienta-tion degree of the piles.
Fig. 18. Maximum displacement in the vertical direction or the settlementto the orientation degree of the piles.
Fig. 19. Cross sections on the von Misses stress results for y=1 m (a), 2 m (b) and 3 m(c) (pile diameter is 0.6 m, orientation of 9°and soil type is B).
Fig. 20. Cross sections on the Settlements results for y=1 m (a), 2 m (b) and 3 m (c) (pile diameter is 0.6 m, orientation of 9° and soil type is B).
Ali AMINFAR et al. China Ocean Eng., 2017, Vol. 31, No. 3, P. 378–388 385
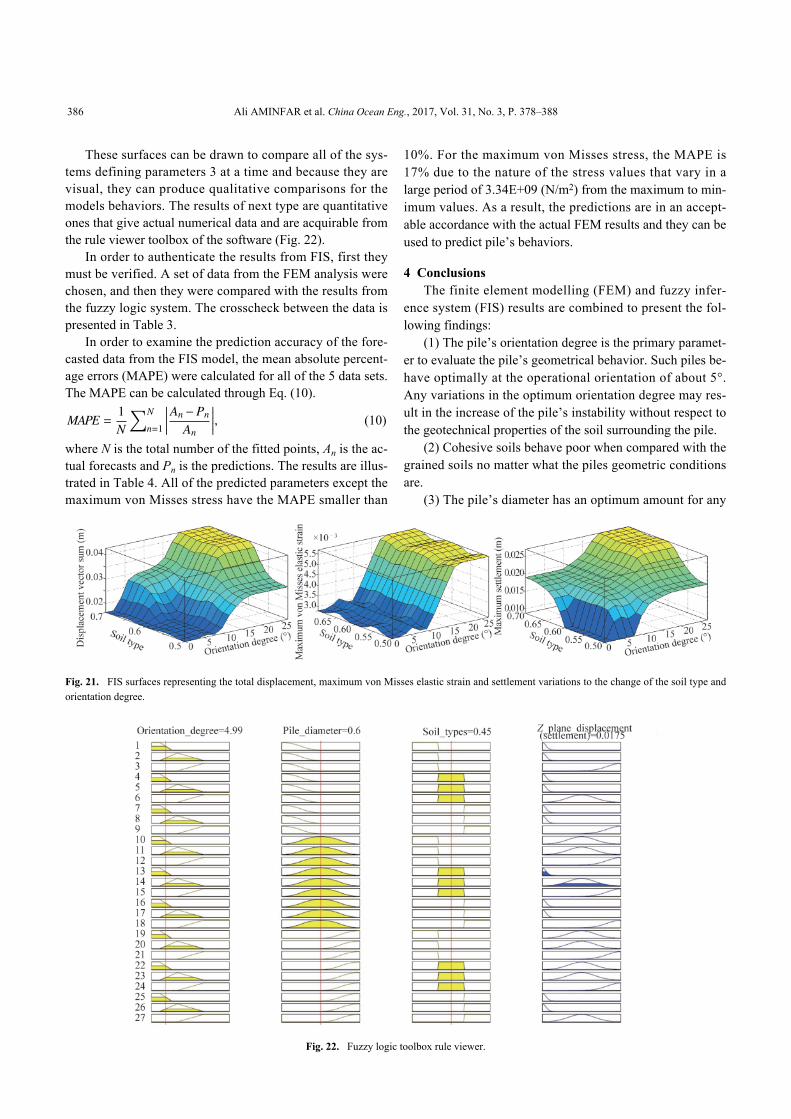
These surfaces can be drawn to compare all of the sys-tems defining parameters 3 at a time and because they arevisual, they can produce qualitative comparisons for themodels behaviors. The results of next type are quantitativeones that give actual numerical data and are acquirable fromthe rule viewer toolbox of the software (Fig. 22).
In order to authenticate the results from FIS, first theymust be verified. A set of data from the FEM analysis werechosen, and then they were compared with the results fromthe fuzzy logic system. The crosscheck between the data ispresented in Table 3.
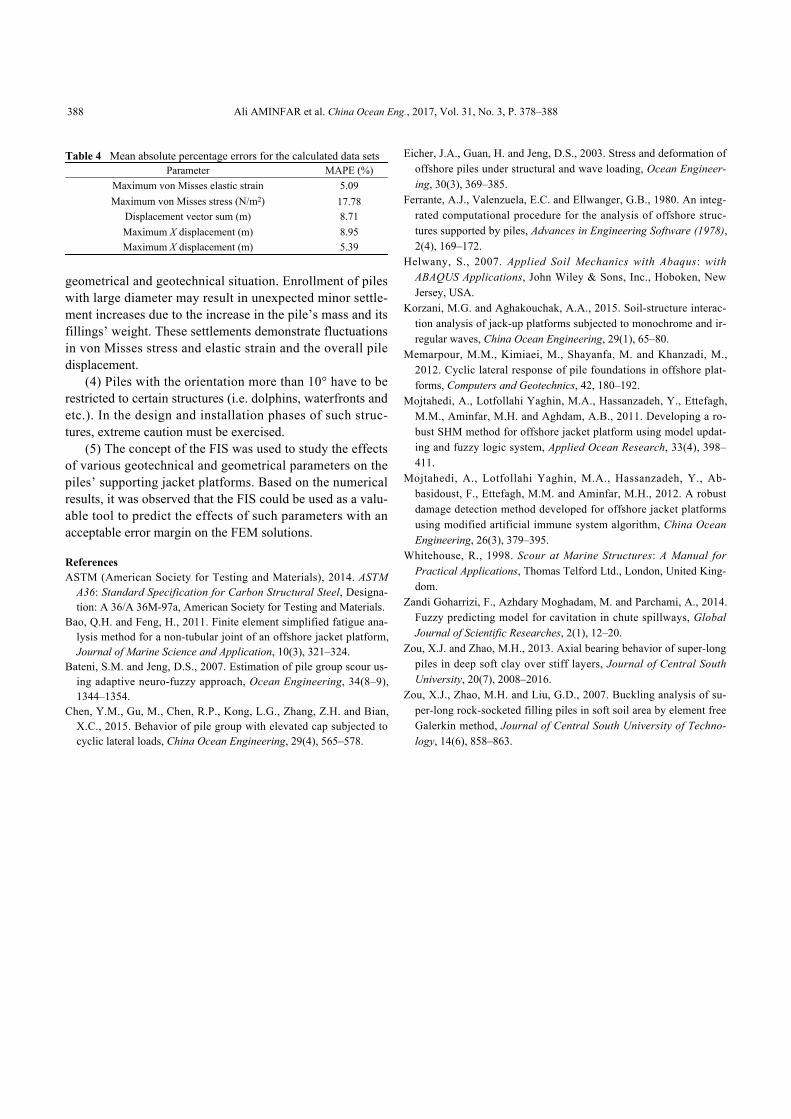
In order to examine the prediction accuracy of the fore-casted data from the FIS model, the mean absolute percent-age errors (MAPE) were calculated for all of the 5 data sets.The MAPE can be calculated through Eq. (10).
MAPE =1N
∑N
n=1
∣∣∣∣∣An−Pn
An
∣∣∣∣∣, (10)
where N is the total number of the fitted points, An is the ac-tual forecasts and Pn is the predictions. The results are illus-trated in Table 4. All of the predicted parameters except themaximum von Misses stress have the MAPE smaller than
10%. For the maximum von Misses stress, the MAPE is17% due to the nature of the stress values that vary in alarge period of 3.34E+09 (N/m2) from the maximum to min-imum values. As a result, the predictions are in an accept-able accordance with the actual FEM results and they can beused to predict pile’s behaviors.
4 ConclusionsThe finite element modelling (FEM) and fuzzy infer-
ence system (FIS) results are combined to present the fol-lowing findings:
(1) The pile’s orientation degree is the primary paramet-er to evaluate the pile’s geometrical behavior. Such piles be-have optimally at the operational orientation of about 5°.Any variations in the optimum orientation degree may res-ult in the increase of the pile’s instability without respect tothe geotechnical properties of the soil surrounding the pile.
(2) Cohesive soils behave poor when compared with thegrained soils no matter what the piles geometric conditionsare.
(3) The pile’s diameter has an optimum amount for any
Fig. 21. FIS surfaces representing the total displacement, maximum von Misses elastic strain and settlement variations to the change of the soil type andorientation degree.
Fig. 22. Fuzzy logic toolbox rule viewer.
386 Ali AMINFAR et al. China Ocean Eng., 2017, Vol. 31, No. 3, P. 378–388
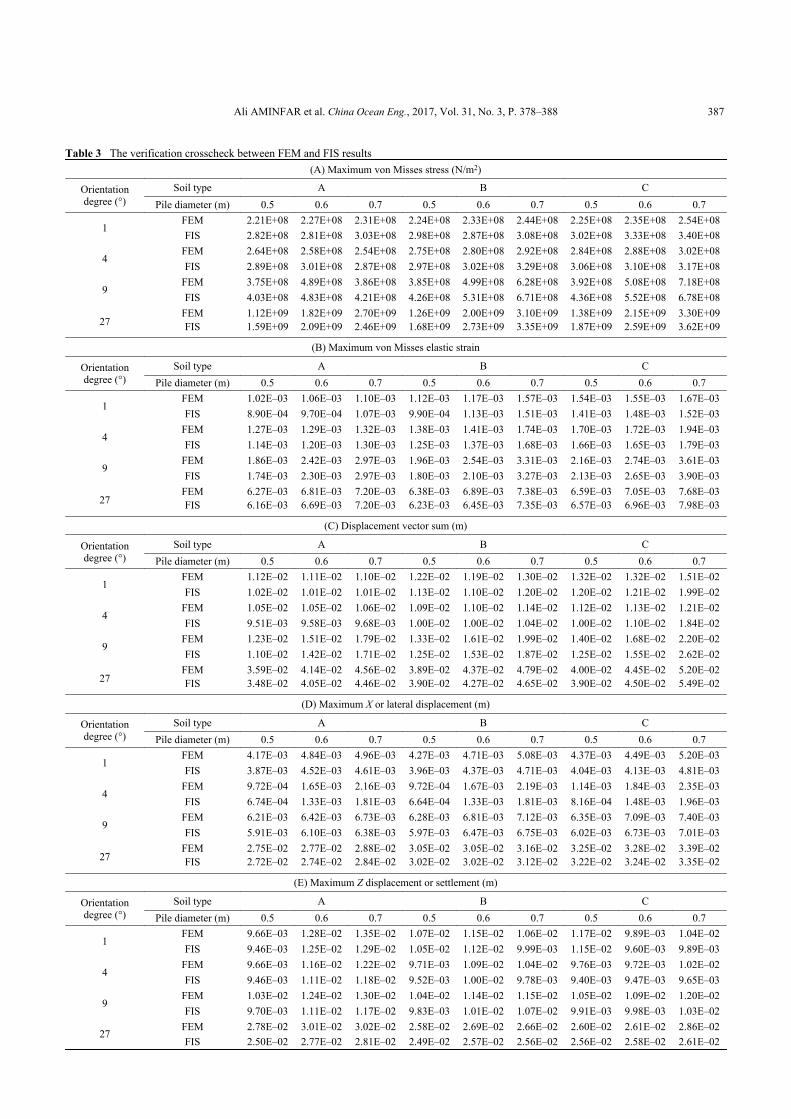
Table 3 The verification crosscheck between FEM and FIS results(A) Maximum von Misses stress (N/m2)
Orientationdegree (°)
Soil type A B CPile diameter (m) 0.5 0.6 0.7 0.5 0.6 0.7 0.5 0.6 0.7
1FEM 2.21E+08 2.27E+08 2.31E+08 2.24E+08 2.33E+08 2.44E+08 2.25E+08 2.35E+08 2.54E+08FIS 2.82E+08 2.81E+08 3.03E+08 2.98E+08 2.87E+08 3.08E+08 3.02E+08 3.33E+08 3.40E+08
4FEM 2.64E+08 2.58E+08 2.54E+08 2.75E+08 2.80E+08 2.92E+08 2.84E+08 2.88E+08 3.02E+08FIS 2.89E+08 3.01E+08 2.87E+08 2.97E+08 3.02E+08 3.29E+08 3.06E+08 3.10E+08 3.17E+08
9FEM 3.75E+08 4.89E+08 3.86E+08 3.85E+08 4.99E+08 6.28E+08 3.92E+08 5.08E+08 7.18E+08FIS 4.03E+08 4.83E+08 4.21E+08 4.26E+08 5.31E+08 6.71E+08 4.36E+08 5.52E+08 6.78E+08
27FEM 1.12E+09 1.82E+09 2.70E+09 1.26E+09 2.00E+09 3.10E+09 1.38E+09 2.15E+09 3.30E+09FIS 1.59E+09 2.09E+09 2.46E+09 1.68E+09 2.73E+09 3.35E+09 1.87E+09 2.59E+09 3.62E+09
(B) Maximum von Misses elastic strain
Orientationdegree (°)
Soil type A B CPile diameter (m) 0.5 0.6 0.7 0.5 0.6 0.7 0.5 0.6 0.7
1FEM 1.02E–03 1.06E–03 1.10E–03 1.12E–03 1.17E–03 1.57E–03 1.54E–03 1.55E–03 1.67E–03FIS 8.90E–04 9.70E–04 1.07E–03 9.90E–04 1.13E–03 1.51E–03 1.41E–03 1.48E–03 1.52E–03
4FEM 1.27E–03 1.29E–03 1.32E–03 1.38E–03 1.41E–03 1.74E–03 1.70E–03 1.72E–03 1.94E–03FIS 1.14E–03 1.20E–03 1.30E–03 1.25E–03 1.37E–03 1.68E–03 1.66E–03 1.65E–03 1.79E–03
9FEM 1.86E–03 2.42E–03 2.97E–03 1.96E–03 2.54E–03 3.31E–03 2.16E–03 2.74E–03 3.61E–03FIS 1.74E–03 2.30E–03 2.97E–03 1.80E–03 2.10E–03 3.27E–03 2.13E–03 2.65E–03 3.90E–03
27FEM 6.27E–03 6.81E–03 7.20E–03 6.38E–03 6.89E–03 7.38E–03 6.59E–03 7.05E–03 7.68E–03FIS 6.16E–03 6.69E–03 7.20E–03 6.23E–03 6.45E–03 7.35E–03 6.57E–03 6.96E–03 7.98E–03
(C) Displacement vector sum (m)
Orientationdegree (°)
Soil type A B CPile diameter (m) 0.5 0.6 0.7 0.5 0.6 0.7 0.5 0.6 0.7
1FEM 1.12E–02 1.11E–02 1.10E–02 1.22E–02 1.19E–02 1.30E–02 1.32E–02 1.32E–02 1.51E–02FIS 1.02E–02 1.01E–02 1.01E–02 1.13E–02 1.10E–02 1.20E–02 1.20E–02 1.21E–02 1.99E–02
4FEM 1.05E–02 1.05E–02 1.06E–02 1.09E–02 1.10E–02 1.14E–02 1.12E–02 1.13E–02 1.21E–02FIS 9.51E–03 9.58E–03 9.68E–03 1.00E–02 1.00E–02 1.04E–02 1.00E–02 1.10E–02 1.84E–02
9FEM 1.23E–02 1.51E–02 1.79E–02 1.33E–02 1.61E–02 1.99E–02 1.40E–02 1.68E–02 2.20E–02FIS 1.10E–02 1.42E–02 1.71E–02 1.25E–02 1.53E–02 1.87E–02 1.25E–02 1.55E–02 2.62E–02
27FEM 3.59E–02 4.14E–02 4.56E–02 3.89E–02 4.37E–02 4.79E–02 4.00E–02 4.45E–02 5.20E–02FIS 3.48E–02 4.05E–02 4.46E–02 3.90E–02 4.27E–02 4.65E–02 3.90E–02 4.50E–02 5.49E–02
(D) Maximum X or lateral displacement (m)
Orientationdegree (°)
Soil type A B CPile diameter (m) 0.5 0.6 0.7 0.5 0.6 0.7 0.5 0.6 0.7
1FEM 4.17E–03 4.84E–03 4.96E–03 4.27E–03 4.71E–03 5.08E–03 4.37E–03 4.49E–03 5.20E–03FIS 3.87E–03 4.52E–03 4.61E–03 3.96E–03 4.37E–03 4.71E–03 4.04E–03 4.13E–03 4.81E–03
4FEM 9.72E–04 1.65E–03 2.16E–03 9.72E–04 1.67E–03 2.19E–03 1.14E–03 1.84E–03 2.35E–03FIS 6.74E–04 1.33E–03 1.81E–03 6.64E–04 1.33E–03 1.81E–03 8.16E–04 1.48E–03 1.96E–03
9FEM 6.21E–03 6.42E–03 6.73E–03 6.28E–03 6.81E–03 7.12E–03 6.35E–03 7.09E–03 7.40E–03FIS 5.91E–03 6.10E–03 6.38E–03 5.97E–03 6.47E–03 6.75E–03 6.02E–03 6.73E–03 7.01E–03
27FEM 2.75E–02 2.77E–02 2.88E–02 3.05E–02 3.05E–02 3.16E–02 3.25E–02 3.28E–02 3.39E–02FIS 2.72E–02 2.74E–02 2.84E–02 3.02E–02 3.02E–02 3.12E–02 3.22E–02 3.24E–02 3.35E–02
(E) Maximum Z displacement or settlement (m)
Orientationdegree (°)
Soil type A B CPile diameter (m) 0.5 0.6 0.7 0.5 0.6 0.7 0.5 0.6 0.7
1FEM 9.66E–03 1.28E–02 1.35E–02 1.07E–02 1.15E–02 1.06E–02 1.17E–02 9.89E–03 1.04E–02FIS 9.46E–03 1.25E–02 1.29E–02 1.05E–02 1.12E–02 9.99E–03 1.15E–02 9.60E–03 9.89E–03
4FEM 9.66E–03 1.16E–02 1.22E–02 9.71E–03 1.09E–02 1.04E–02 9.76E–03 9.72E–03 1.02E–02FIS 9.46E–03 1.11E–02 1.18E–02 9.52E–03 1.00E–02 9.78E–03 9.40E–03 9.47E–03 9.65E–03
9FEM 1.03E–02 1.24E–02 1.30E–02 1.04E–02 1.14E–02 1.15E–02 1.05E–02 1.09E–02 1.20E–02FIS 9.70E–03 1.11E–02 1.17E–02 9.83E–03 1.01E–02 1.07E–02 9.91E–03 9.98E–03 1.03E–02
27FEM 2.78E–02 3.01E–02 3.02E–02 2.58E–02 2.69E–02 2.66E–02 2.60E–02 2.61E–02 2.86E–02FIS 2.50E–02 2.77E–02 2.81E–02 2.49E–02 2.57E–02 2.56E–02 2.56E–02 2.58E–02 2.61E–02
Ali AMINFAR et al. China Ocean Eng., 2017, Vol. 31, No. 3, P. 378–388 387
geometrical and geotechnical situation. Enrollment of pileswith large diameter may result in unexpected minor settle-ment increases due to the increase in the pile’s mass and itsfillings’ weight. These settlements demonstrate fluctuationsin von Misses stress and elastic strain and the overall piledisplacement.
(4) Piles with the orientation more than 10° have to berestricted to certain structures (i.e. dolphins, waterfronts andetc.). In the design and installation phases of such struc-tures, extreme caution must be exercised.
(5) The concept of the FIS was used to study the effectsof various geotechnical and geometrical parameters on thepiles’ supporting jacket platforms. Based on the numericalresults, it was observed that the FIS could be used as a valu-able tool to predict the effects of such parameters with anacceptable error margin on the FEM solutions.
ReferencesASTM (American Society for Testing and Materials), 2014. ASTM
A36: Standard Specification for Carbon Structural Steel, Designa-tion: A 36/A 36M-97a, American Society for Testing and Materials.
Bao, Q.H. and Feng, H., 2011. Finite element simplified fatigue ana-lysis method for a non-tubular joint of an offshore jacket platform,Journal of Marine Science and Application, 10(3), 321–324.
Bateni, S.M. and Jeng, D.S., 2007. Estimation of pile group scour us-ing adaptive neuro-fuzzy approach, Ocean Engineering, 34(8–9),1344–1354.
Chen, Y.M., Gu, M., Chen, R.P., Kong, L.G., Zhang, Z.H. and Bian,X.C., 2015. Behavior of pile group with elevated cap subjected tocyclic lateral loads, China Ocean Engineering, 29(4), 565–578.
Eicher, J.A., Guan, H. and Jeng, D.S., 2003. Stress and deformation ofoffshore piles under structural and wave loading, Ocean Engineer-ing, 30(3), 369–385.
Ferrante, A.J., Valenzuela, E.C. and Ellwanger, G.B., 1980. An integ-rated computational procedure for the analysis of offshore struc-tures supported by piles, Advances in Engineering Software (1978),2(4), 169–172.
Helwany, S., 2007. Applied Soil Mechanics with Abaqus: withABAQUS Applications, John Wiley & Sons, Inc., Hoboken, NewJersey, USA.
Korzani, M.G. and Aghakouchak, A.A., 2015. Soil-structure interac-tion analysis of jack-up platforms subjected to monochrome and ir-regular waves, China Ocean Engineering, 29(1), 65–80.
Memarpour, M.M., Kimiaei, M., Shayanfa, M. and Khanzadi, M.,2012. Cyclic lateral response of pile foundations in offshore plat-forms, Computers and Geotechnics, 42, 180–192.
Mojtahedi, A., Lotfollahi Yaghin, M.A., Hassanzadeh, Y., Ettefagh,M.M., Aminfar, M.H. and Aghdam, A.B., 2011. Developing a ro-bust SHM method for offshore jacket platform using model updat-ing and fuzzy logic system, Applied Ocean Research, 33(4), 398–411.
Mojtahedi, A., Lotfollahi Yaghin, M.A., Hassanzadeh, Y., Ab-basidoust, F., Ettefagh, M.M. and Aminfar, M.H., 2012. A robustdamage detection method developed for offshore jacket platformsusing modified artificial immune system algorithm, China OceanEngineering, 26(3), 379–395.
Whitehouse, R., 1998. Scour at Marine Structures: A Manual forPractical Applications, Thomas Telford Ltd., London, United King-dom.
Zandi Goharrizi, F., Azhdary Moghadam, M. and Parchami, A., 2014.Fuzzy predicting model for cavitation in chute spillways, GlobalJournal of Scientific Researches, 2(1), 12–20.
Zou, X.J. and Zhao, M.H., 2013. Axial bearing behavior of super-longpiles in deep soft clay over stiff layers, Journal of Central SouthUniversity, 20(7), 2008–2016.
Zou, X.J., Zhao, M.H. and Liu, G.D., 2007. Buckling analysis of su-per-long rock-socketed filling piles in soft soil area by element freeGalerkin method, Journal of Central South University of Techno-logy, 14(6), 858–863.
Table 4 Mean absolute percentage errors for the calculated data setsParameter MAPE (%)
Maximum von Misses elastic strain 5.09Maximum von Misses stress (N/m2) 17.78
Displacement vector sum (m) 8.71Maximum X displacement (m) 8.95Maximum X displacement (m) 5.39
388 Ali AMINFAR et al. China Ocean Eng., 2017, Vol. 31, No. 3, P. 378–388