Embed Size (px)
Citation preview

Investigation of TubularHandling of Bicarbonate in Man
A NEWAPPROACHUTILIZING STABLE
CARBONISOTOPE FRACTIONATION
ZvI-HAI BURBEA, BOAZ Luz, BOAZ LAZAR, JOSEPH WINAVER, and ORI S. BETTER,Department of Nephrology, RambamHospital, Haifa and Faculty ofMedicine, Technion; Institute of Earth Sciences, Hebrew University,Jerusalem, Israel
A B S T R A C T Two alternative mechanisms have beenproposed for tubular reabsorption of bicarbonate: (a)H' secretion and CO2reabsorption and (b) direct reab-sorption of HCO3. In an attempt to differentiate be-tween the two mechanisms, the present study utilizedthe natural abundance of stable carbon isotopes ('3C,'2C) in the urinary total CO2. This novel methodologyused mass spectrometric analysis of 13C/12C ratios inurinary total CO2under normal conditions and duringacetazolamide treatment. Blood and respiratory CO2were analyzed to yield reference values.
The results demonstrate that alkaline urine is pref-erentially enriched with 13C relative to the blood. Itis suggested that this fractionation results from re-action out of isotopic equilibrium in which HCOSconverts to CO2 during the reabsorption process inthe distal nephron. The presence of carbonic an-hydrase in the proximal nephron results in rapid iso-topic exchange between CO2 and HCO- and keepsthem in isotopic equilibrium. The ratio of urinary13C/12C increases strikingly after acetazolamide ad-ministration and consequent inhibition of carbonicanhydrase in the proximal tubule. Although it is pos-sible that in the latter case high HCO3generates theCO2 (ampholyte effect), the isotope fractionation in-dicates that CO2 rather than HCO- is reabsorbed. Incontrast, at low urinary pH and total CO2values, thecarbon isotope composition approaches that of blood
Dr. Burbea's present address is Internal Department, SorokaMedical Center, Beer-Sheba, Israel. Dr. Lazar's present ad-dress is Department of Geological Sciences, Harvard Uni-versity, Cambridge, MA02138. Address reprint requests toDr. Better at RambamHospital, Haifa, Israel 35254.
Received for publication 29 July 1982 and in revisedform 23 June 1983.
CO2. This indicates rapid CO2 exchange betweenurine and blood, through luminal membrane highlypermeable to CO2. These results could be anticipatedby a mathematical model constructed to plot 13C con-centration of urinary total CO2.
It is concluded that the mechanism of HCO3 rec-lamation in man (and, by inference, in other mammalsas well) works by conversion of HCO3 to CO2 andreabsorption of CO2.
INTRODUCTION
More than 99% of the filtered load of bicarbonate isreabsorbed along the nephron under normal conditions.Although the relative contribution of each nephronsegment to this process is established, the mechanismof HCO3 reabsorption is hotly debated. Pitts and Al-exander (1) originally proposed that bicarbonatereabsorption and urinary acidification are mediatedby H+ secretion (1, 2). Accordingly, the secreted pro-tons combine with the filtered bicarbonate in thetubular lumen. The carbonic acid thus formed is thendehydrated to CO2and water, with the catalytic aidof the carbonic anhydrase present at the brush border.
This theory was challenged by Brodsky and Schilb(3) and Maren (4, 5), who argued against H+ ion se-cretion as the sole mediator of bicarbonate reabsorption.They suggested direct HCO3 transport as an importantalternative mechanism. The experimental data fa-voring H+ secretion are based largely on the dem-onstration of a negative disequilibrium pH either inthe proximal nephron during carbonic anhydrase in-hibition (6-9) or spontaneously in the distal neph-ron (6-8).
The finding of a more acidic pH in situ under theseconditions was assumed to indicate an accumulation
J. Clin. Invest. © The American Society for Clinical Investigation, Inc. * 0021-9738/83/12/2125/12 $1.00 2125Volume 72 December 1983 2125-2136

of carbonic acid above its equilibrium concentration,thus favoring H' ion secretion (10). Nevertheless,the recent demonstration by several laboratories, thatCO2tension in the proximal (11-14) as well as in thedistal tubule exceeds the systemic arterial Pco2, castsdoubt on the validity of the previously reported dis-equilibrium pH values. Recently, measurements ofdisequilibrium pH were performed in vivo by DuBoseet al. (9), using a new aspiration pH electrode. Thisshowed no disequilibrium in the distal tubule undernormal conditions. In vivo negative disequilibriumpH was also found in the collecting duct (15, 16).
The demonstration of high tubular Pco2 raised thequestion whether there was a limitation in transe-pithelial CO2 diffusion. The presently available ex-perimental data are conflicting. Results compatiblewith very high permeability of tubular epitheliumto CO2were obtained by DuBose et al. (12, 17), War-nock and Rector (18), and Schwartz et al. (19). Incontrast, studies by Malnic and Mello Aires (20) andSohtell (21) suggest that a transepithelial diffusionbarrier for CO2 might exist.
Finally, another disputed issue is the interpretationof increased urine minus blood Pco2 gradient duringbicarbonate infusion. Originally, it was proposed thatH' secretion into bicarbonate rich tubular fluid inthe distal nephron resulted in the formation and sub-sequent delayed dehydration of carbonic acid. In fact,urine minus blood Pco2 gradient has been used as asemiquantitative index of H' secretion in the distalnephron (22-24), but this assumption has recentlybeen questioned by Arruda and co-workers (25, 26)and Maren (27). Both groups suggest that the in-creased Pco2 in highly alkaline urine is a result ofthe physicochemical properties of the bicarbonatesolution, the so-called "ampholyte" effect, rather thanas a result of distal secretion of H' ion.
In spite of an increasing interest in the theoreticalaspects of the renal CO2system and the latest meth-odological progress in this field, which has been sum-marized in two excellent recent reviews by Malnic(28, 29), no consensus on HCO3 reabsorption hasbeen reached. In the hope of clearing up this problem,we introduced a new method for studying the renalCO2 system. The method is based on measurementsof stable carbon isotopes ('3C/'2C) ratios in total CO2(TC' = CO2- + HCO3 + H2CO3 + CO2) of urinesamples and interpretation of the results in terms ofnatural isotopic fractionation during the process ofurine formation.
' Abbreviations used in this paper: a, fractionation factor;BTC, blood TC; 6, deviation in isotopic values; f, fractionalexcretion of TC; TC, total CO2; UTC, urinary TC.
In recent years, although application of stable car-bon isotopes as tracers has become a standard tech-nique in various biomedical fields (30-34), naturalchanges in isotope ratios due to biochemical reactionshave not received much attention.
Carbon isotopes resemble one another in theiratomic structures, but they differ somewhat in theirchemical and biochemical properties (35) and thusthe 13C/'2C ratio varies among natural materials (35,36). In other words, carbon isotopes are fractionatedbetween chemical species involved in reactions.
The present study reports variations in carbon iso-tope fractionation of TC between urine (UTC) andblood (BTC) by human kidney, in normal physiologicalconditions as well as during carbonic anhydrase in-hibition.
Theoretical considerationsIsotopic equilibrium. It is essential to understand
the isotopic fractionation between dissolved CO2 andHCO3. This fractionation involves transfer of 12C and'SC from CO2 to HCO3, as expressed in the followingisotopic reaction:
13CO2 + H12CO3C 12C02 + H'3CO. (1)
In general, HCO- is more enriched in 13C than CO2.This enrichment, however, is rather small; it can beexpressed as follows:
O(HC-CO2)= (13C/12C)CO' (
where a(HCO-CO2) is the 13C fractionation factor be-tween HCO3 and CO2. The degree of fractionationdepends both on whether CO2 and HCO3 are in iso-topic equilibrium or not and on temperature. A sys-tem in chemical equilibrium is not necessary in iso-topic equilibrium. The time needed to approach iso-topic equilibrium depends on the rate of transferfrom CO2 to HCO3 and according to Mills and Urey(37) is on the order of minutes. We might expect,however, shorter equilibration time in systems inwhich the transfer is catalyzed by carbonic anhydrase.
The expected equilibrium fractionation factor atbody temperature (37°C) can be estimated fromDeuser and Degens (38) as a = 1.006.
When performing routine measurements, it is eas-ier and more accurate to measure deviations in iso-topic ratios (6) from a known standard, rather thanto measure absolute ratios. Thus, the change in iso-topic ratio is expressed in per mill (per thousand;%oo) deviation from the international PDB2 standard(613C) (39), by the following equation:
2 PDB is a CaCO3standard prepared from a fossil belamnite
2126 Z.-V. Burbea, B. Luz, B. Lazar, J. Winaver, and 0. S. Better
6 3C (7°°) = [1(i3C/2C) -_] x 1,000. (3)
Thus, in 6 notation, 5'3C of HCO- is 6%o larger (orheavier) than 6'3C of CO2 at 370C.
It is important to note that 6b3C measurements arenot performed separately on dissolved CO2 orHCO-. They are made on the TC gas that is extractedfrom a urine sample. For this reason, the results area weighted average of 613C of dissolved CO2 andHCO- (and in fact also H2CO3and COB-). In equi-librium systems that exchange rapidly with an infinitereservoir of CO2 gas, 613C of total dissolved CO2 isthus a function of pH (and temperature). It becomeslower at low pH (-4), where the dissolved speciesare dominated by CO2and becomes --6%o higher atpH of 7, where HCO- is the dominant species. If weassume isotopic equilibrium, 613C of both CO2 andHCO- can be estimated from measurements of 613Cof total dissolved CO2 (613CTC):
'3C,02 + 6 (5'3C HCO0(at 370C), (4)
'13CTC = (5'3CCC2. (CO2/TC)
+ 613CHCOK* (HCO-/TC). (5)
Relative proportions of CO2 and HCO- are deter-mined from chemical equilibrium reactions (Appen-dix I). The same logic is used in calculating 5'3C ofarterial blood from 6'3C of venous blood and respi-ratory CO2 (Eq. 10 below).
Carbonate ion and H2CO3were neglected in Eq. 5.The former species is relatively rare in most cases, andbecomes more significant only at elevated pH values(Appendix I). In addition, isotopic fractionation be-tween CO2- and CO2 is fairly similar to HCO-and CO2 fractionation. The fractionation factor isa(co3- co2) = 1.0064 (39). The isotopic composition ofH2CO3 is unknown, but this species is also very rare(Appendix I) and does not pose a problem in esti-mating isotopic compositions.
Isotopic distillation. A major goal of the presentstudy was to understand the isotopic effects of theconversion of bicarbonate to CO2. Since CO2has less13C than does HCO-, removal of CO2 from a solutioncontaining both CO2 and HCO- should enrich thesolution in 13C. If this process continues and if CO2is removed immediately, and is not allowed to ree-
(Belamnitella americana) from the Pee Dee formation. It iscustomary to express 'SC enrichment or depletion with respectto this international standard. The standard itself is no longeravailable, but many substandards were prepared and areavailable. Our calibration is done with respect to PDB-IVfrom Prof. S. Epstein, California Institute of Technology.
quilibrate (isotopically), the TC in the system willbecome progressively more and more enriched in"3C. Similar isotopic distillation is known to occur innatural processes and has been studied in detail,especially in connection with evaporation of water(40, 41).
The degree of "3C enrichment (or b'3C increase)in the remaining TC expressed as a function of afraction (f) of the amount at the beginning of theprocess, can be easily calculated:
b'3C final = (1,000 + V53C initial)X - 1,000, (6)
where a is the fractionation factor between CO2andHCO3(-1.006 at 370C). For the derivation of Eq.6, see Appendix II.
If renal absorption of HCO- involves its transitionto CO2 without isotopic reequilibrium, then UTC,which is a small fraction of the TC filtered, shouldbecome very enriched in '3C. For example, if 99%of the filtered load is absorbed (f = 0.01) and if theinitial 613C (that of the glomerular filtrate) is -207oo,the final 5'3C is calculated as 7.5%o. In this case, 613Chas been enriched by 27.5%oo. This process is dem-onstrated graphically in Fig. 7. In an attempt to findout whether such enrichment takes place in the hu-man kidney, we performed a series of experiments.
Weassumed that no isotopic fractionation occursduring glomerular filtration, and hence that 613C ofarterial BTC represents 6'3C of glomerular filtrate.Previous studies have demonstrated that 613C of totalCO2 in blood is rather constant in a certain humanpopulation (42, 43) and is determined by the isotopicratio in the diet (43-45). There is a relatively largereservoir of carbon in the body, which is not easilyaffected by occasional meals (33, 46).
METHODSTest group. Six healthy (serum creatinine 0.8-1.1 mg/
100 ml) volunteers (age 25-37 yr, from the Department ofGeology at the Hebrew University of Jerusalem), provideda total of 44 urine samples. All the volunteers had normalcapability for acidifying urine. Each individual gave a morn-ing urine sample, two or three samples of daytime urine,and two or three samples after oral administration of 500mgacetazolamide in one dose. Three of them gave two sam-ples after oral administration of 80 mg furosemide (Lasix)in one dose.
Experimental procedure. Each volunteer voided in a slowstream and completely filled a 100-cm3 glass bottle and thenclosed it hermetically. This precaution was taken in orderto minimize CO2 escape. The samples were analyzed fromwithin a few minutes up to 2 h after urination. Immediatelyafter opening the sample, pH was determined (accuracy,±0.05 pH units), and the bottle sample connected to the CO2extraction line (Fig. 1). UTC was determined and 6'3C of thecollected CO2was measured on a double inlet double collector
Stable Carbon Isotope in Studying Renal CO2 Transport 2127
Ascaritefilter
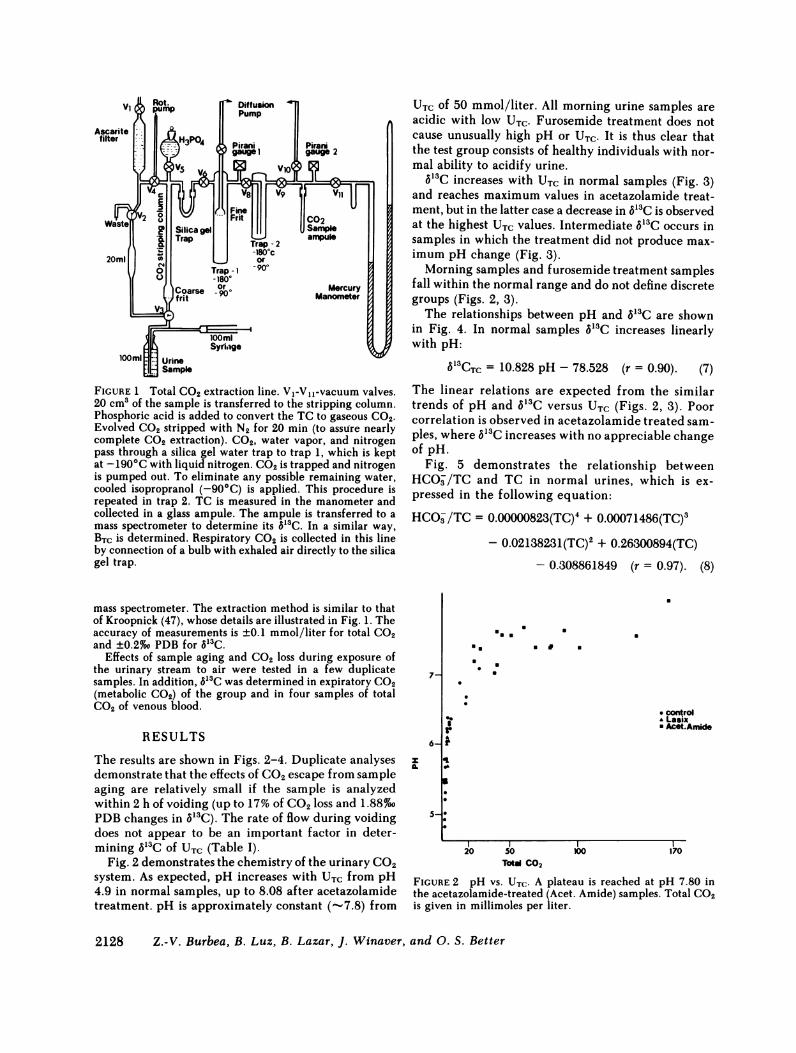
FIGURE 1 Total CO2extraction line. VI-Vl1-vacuum valves.20 cm3 of the sample is transferred to the stripping column.Phosphoric acid is added to convert the TC to gaseous CO2.Evolved CO2 stripped with N2 for 20 min (to assure nearlycomplete CO2 extraction). CO2, water vapor, and nitrogenpass through a silica gel water trap to trap 1, which is keptat -190°C with liquid nitrogen. CO2 is trapped and nitrogenis pumped out. To eliminate any possible remaining water,cooled isopropranol (-90°C) is applied. This procedure isrepeated in trap 2. TC is measured in the manometer andcollected in a glass ampule. The ampule is transferred to amass spectrometer to determine its 5'3C. In a similar way,BTC is determined. Respiratory CO2 is collected in this lineby connection of a bulb with exhaled air directly to the silicagel trap.
mass spectrometer. The extraction method is similar to thatof Kroopnick (47), whose details are illustrated in Fig. 1. Theaccuracy of measurements is ±0.1 mmol/liter for total CO2and ±0.2%o PDB for 613C.
Effects of sample aging and CO2 loss during exposure ofthe urinary stream to air were tested in a few duplicatesamples. In addition, 8'3C was determined in expiratory CO2(metabolic CO2) of the group and in four samples of totalCO2 of venous blood.
RESULTS
The results are shown in Figs. 2-4. Duplicate analysesdemonstrate that the effects of CO2escape from sampleaging are relatively small if the sample is analyzedwithin 2 h of voiding (up to 17% of CO2loss and 1.88%oPDBchanges in b'3C). The rate of flow during voidingdoes not appear to be an important factor in deter-mining V'3C of UTC (Table I).
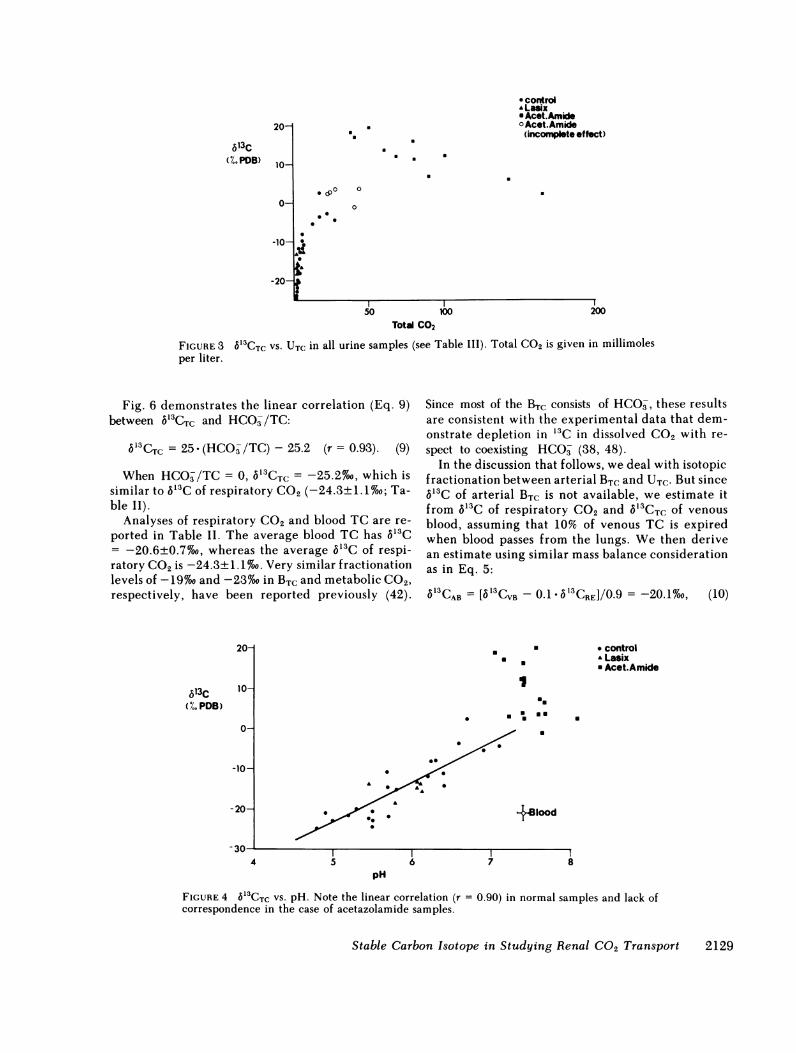
Fig. 2 demonstrates the chemistry of the urinary CO2system. As expected, pH increases with UTC from pH4.9 in normal samples, up to 8.08 after acetazolamidetreatment. pH is approximately constant (-.7.8) from
UTC of 50 mmol/liter. All morning urine samples areacidic with low UTC. Furosemide treatment does notcause unusually high pH or UTC. It is thus clear thatthe test group consists of healthy individuals with nor-mal ability to acidify urine.
6'3C increases with UTC in normal samples (Fig. 3)and reaches maximum values in acetazolamide treat-ment, but in the latter case a decrease in S'3C is observedat the highest UTC values. Intermediate 6'3C occurs insamples in which the treatment did not produce max-imum pH change (Fig. 3).
Morning samples and furosemide treatment samplesfall within the normal range and do not define discretegroups (Figs. 2, 3).
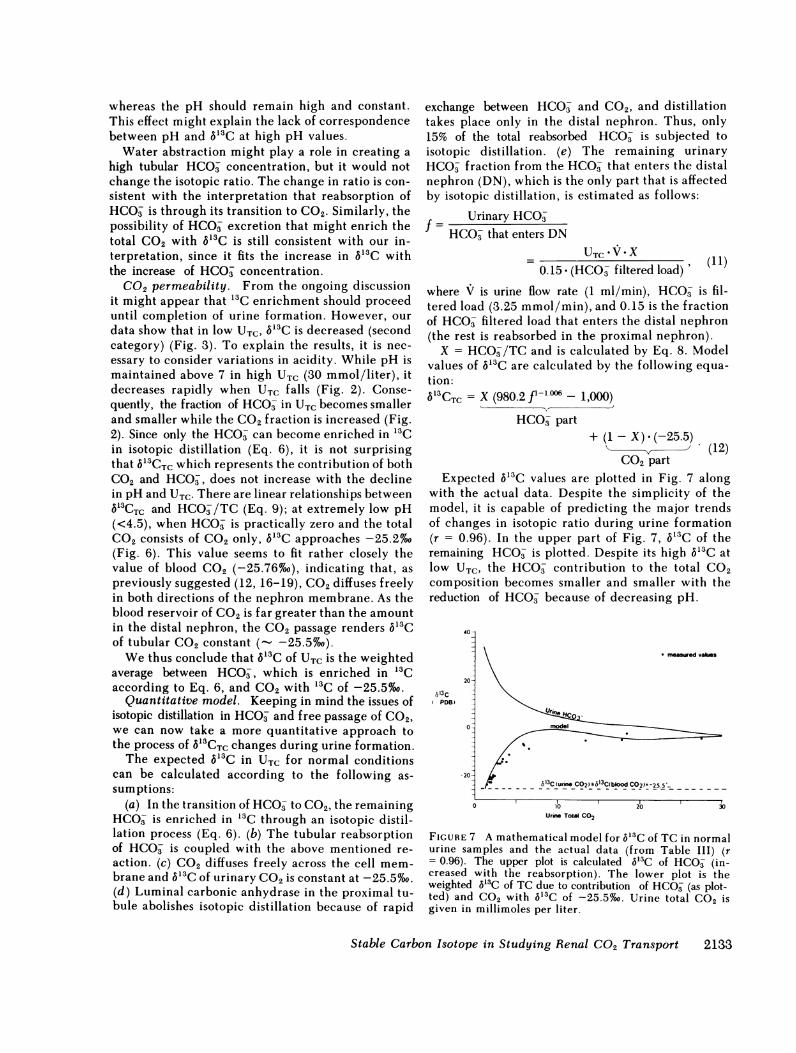
The relationships between pH and 6'3C are shownin Fig. 4. In normal samples 5'3C increases linearlywith pH:
6'3CTC = 10.828 pH - 78.528 (r = 0.90). (7)The linear relations are expected from the similartrends of pH and 6'3C versus UTC (Figs. 2, 3). Poorcorrelation is observed in acetazolamide treated sam-ples, where 6'3C increases with no appreciable changeof pH.
Fig. 5 demonstrates the relationship betweenHCO-/TC and TC in normal urines, which is ex-pressed in the following equation:
HCO /TC = 0.00000823(TC)4 + 0.00071486(TC)3
- 0.02138231(TC)2 + 0.26300894(TC)
- 0.308861849 (r = 0.97). (8)
7-
6-
zIL
5-
a. a
a.
TrA0*
a a U
* control* Lasix* AcetAmide
*1
20 50ToMl CO2
100 170
FIGURE 2 pH vs. UTC. A plateau is reached at pH 7.80 inthe acetazolamide-treated (Acet. Amide) samples. Total CO2is given in millimoles per liter.
2128 Z.-V. Burbea, B. Luz, B. Lazar, J. Winaver, and 0. S. Better
0
.
613C(%. PDB)
Total CO2
FIGURE 3 613CTC VS. UTC in all urine samples (see Table III). Total CO2 is given in millimolesper liter.
Fig. 6 demonstrates the linear correlation (Eq. 9)between 613CTC and HCO-/TC:
b'3CTC = 25 (HCO-/TC)-25.2 (r = 0.93). (9)
When HCO/TC = 0, 5'3CTC = -25.2%o, which issimilar to 5'3C of respiratory C02 (-24.3±1.1%o; Ta-ble II).
Analyses of respiratory CO2 and blood TC are re-
ported in Table II. The average blood TC has 5'3C= -20.6±0.7%7o, whereas the average 5'3C of respi-ratory CO2 is -24.3±1.1oo. Very similar fractionationlevels of -19%o and -23%o in BTC and metabolic C02,respectively, have been reported previously (42).
Since most of the BTC consists of HCO-, these resultsare consistent with the experimental data that dem-onstrate depletion in '3C in dissolved CO2 with re-
spect to coexisting HCO- (38, 48).In the discussion that follows, we deal with isotopic
fractionation between arterial BTC and UTC. But sinceV53C of arterial BTC is not available, we estimate itfrom 513C of respiratory CO2 and 5'3CTC of venous
blood, assuming that 10% of venous TC is expiredwhen blood passes from the lungs. We then derivean estimate using similar mass balance considerationas in Eq. 5:
6'CAB = [b CVB - 0.1 * aCRE]/0.9 = -20.1%0, (10)
20-
613C(%. PDB)
10-
0-
-10-
-20-
4
a
* controlA Lasix* Acet.Amide
I,
uma
+81ood
6 7 8pH
FIGURE 4 6l'CTC VS. pH. Note the linear correlation (r = 0.90) in normal samples and lack ofcorrespondence in the case of acetazolamide samples.
Stable Carbon Isotope in Studying Renal C02 Transport
* control. Lasix* Acet.Amideo Acet.Amide
(incomplete effect)
0 (pO0 0
00
00.
a
aa
.
0
00 0
0
2129

1.0-
0.8-
0.6--
0.4-)
0 -0.2-
. U
us a
mUI
5 10 15Unne Total CO2
FIGURE 5 The HCO3 fraction of TCUrine total CO2 is given in millimo
where 6"CAB, 6aCVB, 6"CRE refarterial blood, and respiratory C
If we take 1.5/25 for the mol-HCO- of arterial blood, we can uV'3C of dissolved CO2gas in art(culated V'3C (-25.8%o) is fairl3respiratory CO2 (-24.3±1.17%o)
From Table III and Fig. 3 itsignificant "3C enrichment in 1arterial BTC (-20.1%o) occurs intion process (up to 20%o in theup to 40%o in the acetazolamidc
DISCUSSION
The changes in urine 5'3C and Itwo categories (Fig. 3): The firstsamples with high UTCand acetaziples. These alkaline samples (Fig. iin '3C with respect to arterial blowwith respect to glomerular filtrate.includes normal samples with deirosemide-treated samples (Fig. 3creases as reabsorption proceeds a]V'3C of -25.2%o (Figs. 3 and 6;is, therefore, what are the dominaurinary 5'3C in the high TC an(first category) and in the low TC i
pH (secondary category).Isotopic distillation through H4
reaction. The process of '3C encategory indicates that carbon ipreferentially from the tubularsorbed HCO, is depleted in '3CHCO- is enriched. This preferereadily explained by a simpleprocess, if reabsorption requirHCO- to CO2. In this chemicallower 5'3C, and if it is removed fwithout requilibration, the rem,
bular TC becomes enriched in '"C. Whether this isthe case can be tested quantitatively by using Eq. 6.
If we assume in all cases of acetazolamide treat-ments a daily filtered load of total CO2of 5,000 mmol,then 150 and 50 mmol/liter are -3 and 1% of thetotal. Wecan apply Eq. 6 to calculate expected 5'3Cif we express these in fractions rather than permil-lages. In these cases of UTC of 150 mmol/liter (Fig.3), observed 6V3C is ''2%o. We calculate now the
20 25 30 expected 6'3C if isotopic distillation took place.Expected 6'3C = (1,000 + 613CAB) fl-a - 1,000
against TC (r = 0.97). = 0.7%o, where V'3C of arterial blood (513CAB) isles per liter. -20.1%o, f = 0.03 (3%), and a = 1.006. In the same
way, we calculated expected 5'3C for the case of UTC= 50 mmol/liter (f = 0.01) as 7.49o0. Wecompared
.er to venous blood, this with an observed value of - 12%oo. Recalling thatJO2, respectively. fairly crude assumptions have been made with regardar ratios of CO02 and to daily filtered load, the results were rather en-ise Eq. 5 to calculate couraging, and seemed to support CO2 reabsorptionerial blood. The cal- and not direct HCO reabsorption at least in the case
similar to 513C of of acetazolamide treatment.(Table II). Effective carbonic anhydrase inhibition resultedis evident that very in greater b'3C than in normal samples at the same
UTC with respect to UTC (Fig. 3). This indicated that in the presence ofthe HCO- reabsorp- carbonic anhydrase, CO2and HCOsexchange carbonnormal samples and isotopes vary rapidly, and that isotopic equilibriuma-treated samples). is maintained. Clearly, isotopic distillation can take
place only if the separated species do not exchangewith each other. This latter condition may exist nor-mally in the distal nephron and during complete car-
UTC seem to fall into bonic anhydrase inhibition in the proximal nephron.one includes normal Thus, our findings are consistent with the classicalolamide-treated sam-2) are highly enrichedod, and, presumably,The second category
creasing UTC and fu-1). Here, "3C/'2C de-nd seems to approachEq. 9). The questionnt factors controllingd alkaline pH rangerange and low urinary
C03 - CO2chemicalirichment in the firstIsotopes are removed
fluid and the reab-while the remainingntial removal can be
isotope distillationres the transition of
reaction, CO2 has aFrom the tubular fluidaining fraction of tu-
a-m.-i
.
UUl
Belood
0.4 0.6 0.8HCOf /Total CO2
FIGURE 6 6'3CTC against HCO- fraction of TC (r = 0.98).Note that the results of this figure do not correspond withEq. 5, because both TC and pH vary with the abscissa,whereas TC is constant in Eq. 5.
2130 Z.-V. Burbea, B. Luz, B. Lazar, J. Winaver, and 0. S. Better
.6

TABLE IDuplicates of Aging Samples and Injected Sample
Duplicate No. Donor Aging time pH UT 653C [COO, [HCOaV
h mmol/1iter %o PDB mmol/Liter
1 A 0 6.20 4.25 -11.99 1.88 2.37A 1 6.20 3.87 -11.99 1.71 2.16
2 A 0 7.10 27.52 -4.73 2.50 25.02A 1 7.10 22.73 -2.85 2.07 20.66
3 C 0 5.20 2.03 -21.78 1.80 0.23C 3 5.20 1.56 -24.20 1.38 0.18
4 D 0 5.50 1.84 -23.00 1.47 0.37D 1.5 5.50 2.22 -22.96 1.77 0.45
5 B 0 6.90 13.35 -5.58 1.83 11.52B 1 6.90 13.30 -5.39 1.82 11.48
6 Et 0 5.00 1.98 -22.94 1.84 0.15Et 4 5.00 1.79 -24.08 1.66 0.13
7 F 0 6.70 18.49 2.31 3.71 14.78F 3 6.70 18.21 2.53 3.66 14.55
8 C 0 5.80 3.54 -15.16 2.36 1.18C 1 5.80 3.11 -14.54 2.07 1.04
9 A 0 5.70 3.87 -14.53 2.77 1.10A 7 5.70 3.35 -13.38 1.87 1.48
10 A§ - 6.30 6.13 -8.05 2.37 3.76A - 6.30 6.10 -8.00 2.36 3.74
Values calculated from Appendix I.t Morning samples.§ Sample forcefully injected by syringe.
model of bicarbonate reabsorption through CO2gen-eration and opposed to direct HCO- transfer as sug-gested by Brodsky and Schilb (3) and Maren (4, 5).
TABLE II6'3C of Venous BTC and Respiratory CO2
61'C
Donor BTc Respiratory CO,
(%o PDB)
A -21.64 -24.45B -20.06 -25.04Bo -20.34 -
C -20.54 -25.87D - -22.93E - -23.83F - -23.56
±SD -20.6±0.7 -24.3±1.1
Donor received acetazolamide.
The case of carbonic anhydrase inhibition calls forspecial attention. High Pco2 values have been mea-sured during acetazolamide treatment, as well asduring bicarbonate loading (2, 23, 25). The cause ofthe high Pco2, however, is controversial. WhileMaren (27) and Arruda et al. (25, 26) attribute CO2formation from HCO- to ampholyte effect, Stine-baugh et al. (23, 24) claim that this effect alone cannotaccount for the phenomenon. Recently, DuBose andassociates (16) reviewed the theories for the highurinary Pco2 and claim that delayed dehydrationand the CO2 counter-current system play an impor-tant role in determining urinary Pco2. Our data areinsufficient to resolve this problem, but they seem toindicate that whatever the source for the high Pco2,the carbon isotopic enrichment results from CO2transfer and not from direct HCO- reabsorption. Theresults shown in Fig. 4 might lend some support forCO2 formation at high pH due to ampholyte effect.CO2 reabsorption should result in increased 6'3C,
Stable Carbon Isotope in Studying Renal C02 Transport 2131
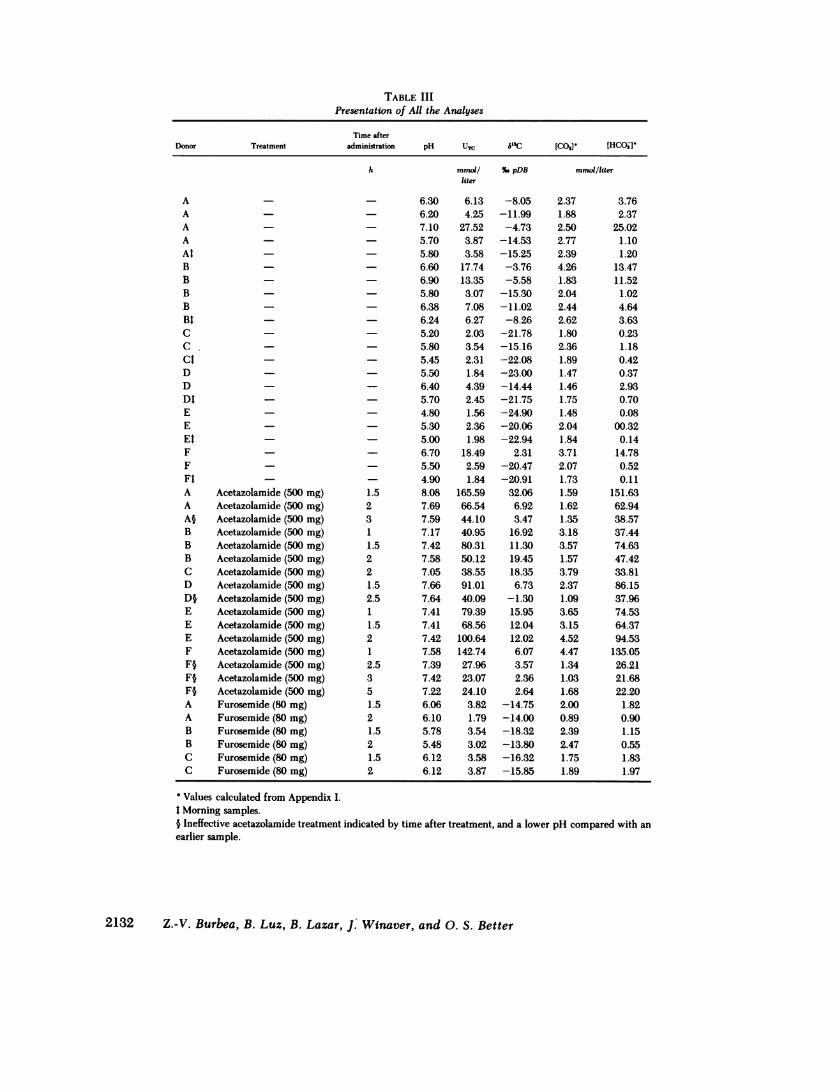
TABLE IIIPresentation of All the Analyses
Time afterDonor Treatment adm
AAAAAtBB_BBBtCC.CtDDDtEEEtFFFtA Acetazolamide (500 mg)A Acetazolamide (500 mg)A§ Acetazolamide (500 mg)B Acetazolamide (500 mg)B Acetazolamide (500 mg)B Acetazolamide (500 mg)C Acetazolamide (500 mg)D Acetazolamide (500 mg)D§ Acetazolamide (500 mg)E Acetazolamide (500 mg)E Acetazolamide (500 mg)E Acetazolamide (500 mg)F Acetazolamide (500 mg)F§ Acetazolamide (500 mg)F§ Acetazolamide (500 mg)F§ Acetazolamide (500 mg)A Furosemide (80 mg)A Furosemide (80 mg)B Furosemide (80 mg)B Furosemide (80 mg)C Furosemide (80 mg)C Furosemide (80 mg)
inistration pH UTC 5'3C
h mmol/ %.pDBliter
- 6.30 6.13 -8.05- 6.20 4.25 -11.99- 7.10 27.52 -4.73- 5.70 3.87 -14.53- 5.80 3.58 -15.25- 6.60 17.74 -3.76- 6.90 13.35 -5.58- 5.80 3.07 -15.30- 6.38 7.08 -11.02- 6.24 6.27 -8.26- 5.20 2.03 -21.78- 5.80 3.54 -15.16- 5.45 2.31 -22.08- 5.50 1.84 -23.00- 6.40 4.39 -14.44- 5.70 2.45 -21.75- 4.80 1.56 -24.90- 5.30 2.36 -20.06- 5.00 1.98 -22.94- 6.70 18.49 2.31- 5.50 2.59 -20.47- 4.90 1.84 -20.911.5 8.08 165.59 32.062 7.69 66.54 6.923 7.59 44.10 3.471 7.17 40.95 16.921.5 7.42 80.31 11.302 7.58 50.12 19.452 7.05 38.55 18.351.5 7.66 91.01 6.732.5 7.64 40.09 -1.301 7.41 79.39 15.951.5 7.41 68.56 12.042 7.42 100.64 12.021 7.58 142.74 6.072.5 7.39 27.96 3.573 7.42 23.07 2.365 7.22 24.10 2.641.5 6.06 3.82 -14.752 6.10 1.79 -14.001.5 5.78 3.54 -18.322 5.48 3.02 -13.801.5 6.12 3.58 -16.322 6.12 3.87 -15.85
[COO, [HCOjV'
mmol/liter
2.371.882.502.772.394.261.832.042.442.621.802.361.891.471.461.751.482.041.843.712.071.731.591.621.353.183.571.573.792.371.093.653.154.524.471.341.031.682.000.892.392.471.751.89
3.762.37
25.021.101.20
13.4711.52
1.024.643.630.231.180.420.372.930.700.08
00.320.14
14.780.520.11
151.6362.9438.5737.4474.6347.4233.8186.1537.9674.5364.3794.53
135.0526.2121.6822.20
1.820.901.150.551.831.97
2132 Z.-V. Burbea, B. Luz, B. Lazar, J: Winaver, and 0. S. Better
* Values calculated from Appendix I.t Morning samples.§ Ineffective acetazolamide treatment indicated by time after treatment, and a lower pH compared with anearlier sample.
whereas the pH should remain high and constant.This effect might explain the lack of correspondencebetween pH and b63C at high pH values.
Water abstraction might play a role in creating ahigh tubular HC03 concentration, but it would notchange the isotopic ratio. The change in ratio is con-sistent with the interpretation that reabsorption ofHCO- is through its transition to CO2. Similarly, thepossibility of HCO- excretion that might enrich thetotal CO2 with 5'3C is still consistent with our in-terpretation, since it fits the increase in 6'3C withthe increase of HC03 concentration.
CO2 permeability. From the ongoing discussionit might appear that "3C enrichment should proceeduntil completion of urine formation. However, ourdata show that in low UTC, V13C is decreased (secondcategory) (Fig. 3). To explain the results, it is nec-essary to consider variations in acidity. While pH ismaintained above 7 in high UTC (30 mmol/liter), itdecreases rapidly when UTC falls (Fig. 2). Conse-quently, the fraction of HCO- in UTCbecomes smallerand smaller while the CO2 fraction is increased (Fig.2). Since only the HC0- can become enriched in '3Cin isotopic distillation (Eq. 6), it is not surprisingthat b53CTC which represents the contribution of bothCO2 and HC0-, does not increase with the declinein pH and UTC. There are linear relationships between5'3CTc and HCO/TC (Eq. 9); at extremely low pH(<4.5), when HC0- is practically zero and the totalCO2 consists of CO2 only, 513C approaches -25.2%o(Fig. 6). This value seems to fit rather closely thevalue of blood CO2 (-25.76%o), indicating that, aspreviously suggested (12, 16-19), CO2diffuses freelyin both directions of the nephron membrane. As theblood reservoir of CO2 is far greater than the amountin the distal nephron, the CO2 passage renders 5'3Cof tubular CO2 constant (- -25.5%o).
Wethus conclude that 613C of UTC is the weightedaverage between HCO-, which is enriched in 13Caccording to Eq. 6, and CO2 with '3C of -25.5%o.
Quantitative model. Keeping in mind the issues ofisotopic distillation in HCO- and free passage of C02,we can now take a more quantitative approach tothe process of 6'3CTC changes during urine formation.
The expected S'3C in UTC for normal conditionscan be calculated according to the following as-sumptions:
(a) In the transition of HCO3- to CO2, the remainingHCO- is enriched in '3C through an isotopic distil-lation process (Eq. 6). (b) The tubular reabsorptionof HCO is coupled with the above mentioned re-action. (c) CO2 diffuses freely across the cell mem-brane and 613C of urinary CO2 is constant at -25.5%oo.(d) Luminal carbonic anhydrase in the proximal tu-bule abolishes isotopic distillation because of rapid
exchange between HCO- and CO2, and distillationtakes place only in the distal nephron. Thus, only15% of the total reabsorbed HCO is subjected toisotopic distillation. (e) The remaining urinaryHCO- fraction from the HCO that enters the distalnephron (DN), which is the only part that is affectedby isotopic distillation, is estimated as follows:
Urinary HCO0=
tHCO3- that enters DNUTC V *X
0.15 (HCO- filtered load)' (11)
where V is urine flow rate (1 ml/min), HCO- is fil-tered load (3.25 mmol/min), and 0.15 is the fractionof HCO- filtered load that enters the distal nephron(the rest is reabsorbed in the proximal nephron).
X= HCO-/TC and is calculated by Eq. 8. Modelvalues of 513C are calculated by the following equa-tion:(S3CT = X (980.2 f'" - 1,000)
HCO- part+ (1 - X) * (-25.5) (12)
CO2 partExpected 653C values are plotted in Fig. 7 along
with the actual data. Despite the simplicity of themodel, it is capable of predicting the major trendsof changes in isotopic ratio during urine formation(r = 0.96). In the upper part of Fig. 7, 3'3C of theremaining HCO- is plotted. Despite its high V3C atlow UTC, the HCO- contribution to the total CO2composition becomes smaller and smaller with thereduction of HCO because of decreasing pH.
40-
20-
,s13CPDB -
0--
2
* measmwedvalues
F - - b613C (urine CO rlgM3Cblood COV=-2sooC 2 63~ lo_0 ) 25 5
0 10 20Urine Total C02
30
FIGURE 7 A mathematical model for 6'3C of TC in normalurine samples and the actual data (from Table III) (r= 0.96). The upper plot is calculated 6'3C of HCO- (in-creased with the reabsorption). The lower plot is theweighted 6'3C of TC due to contribution of HCO- (as plot-ted) and CO2 with 613C of -25.5%o. Urine total CO2 isgiven in millimoles per liter.
Stable Carbon Isotope in Studying Renal C02 Transport 2133
The model 6'3C is somewhat higher than the ob-served values. This greater enrichment can be ex-plained by certain isotopic exchanges betweenHCO- and CO2 in the distal tubule which are nottaken into account by the model.
Kinetic effects. Finally, it is necessary to considerkinetic effects on isotopic fractionation. It has beendemonstrated that where a nonreversible reactionoccurs, the heavier isotopes are concentrated in theremaining reactant. Thus, it might be proposed that"3C enrichment in UTC is the result of kinetic frac-tionation that occurs during direct HCOj transferthrough the luminal membrane. This mechanism isunlikely, for it cannot explain the higher '3C en-richment that occurs during acetazolamide treatment.In turn, 5'3C of acetazolamide-treated samples seemsto fit isotope distillation with fractionation factor (a)of magnitude similar to that derived experimentallyfor the system CO2 - HCO- (38). In addition, highCO2 permeability is indicated by decreasing 5'3C oflow pH samples.
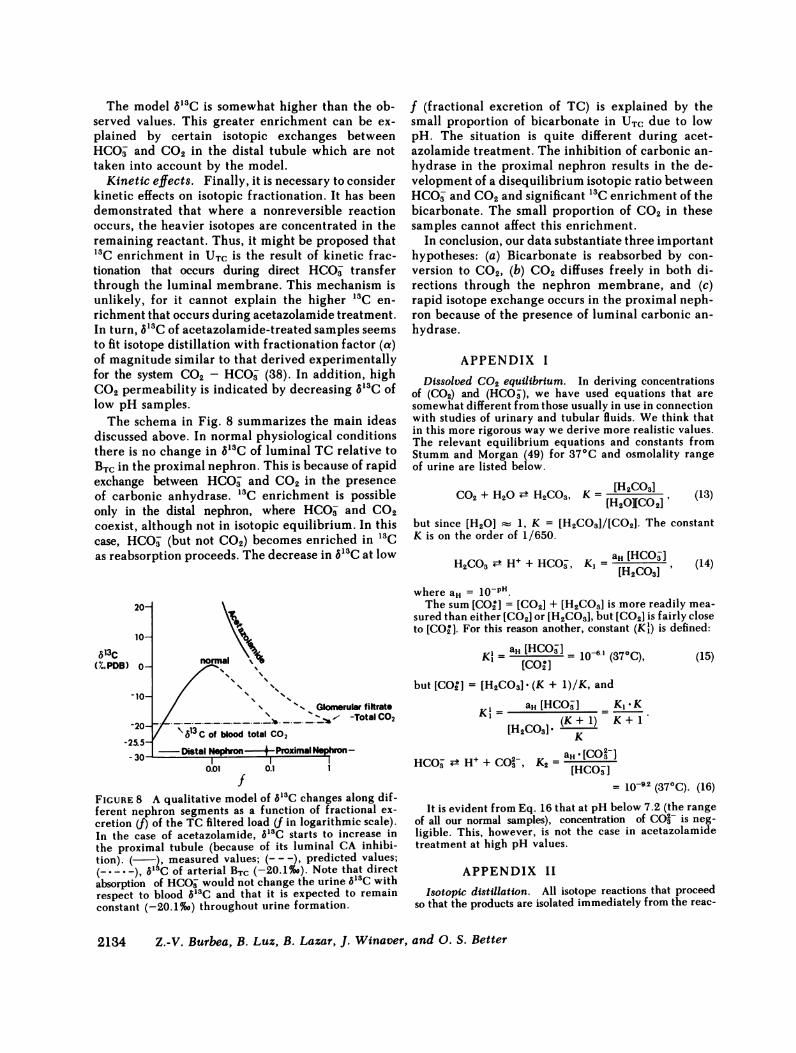
The schema in Fig. 8 summarizes the main ideasdiscussed above. In normal physiological conditionsthere is no change in 6'8C of luminal TC relative toBTC in the proximal nephron. This is because of rapidexchange between HCO- and CO2 in the presenceof carbonic anhydrase. '3C enrichment is possibleonly in the distal nephron, where HCO- and CO2coexist, although not in isotopic equilibrium. In thiscase, HCO- (but not CO2) becomes enriched in '3Cas reabsorption proceeds. The decrease in 6C3G at low
20-
10-cS13C
nra
(%.PDB) 0-
-10- "Glomerular fiftrate
-20 , > ^ a,-Total CO2-20-_; _.__...._._..._._.__-25.5
\13 C of blood total CO2-25.5-
- 30 -Distal Nephron -4Proximal Nephronf-0.01 0.1 1
fFIGURE 8 A qualitative model of 613C changes along dif-ferent nephron segments as a function of fractional ex-cretion (f) of the TC filtered load (f in logarithmic scale).In the case of acetazolamide, 5C3G starts to increase inthe proximal tubule (because of its luminal CA inhibi-tion). ( ), measured values; ---), predicted values;
(----), 5'C of arterial BTC (-20.1%0). Note that directabsorption of HCGO would not change the urine V'3C withrespect to blood 613C and that it is expected to remainconstant (-20.1%o) throughout urine formation.
f (fractional excretion of TC) is explained by thesmall proportion of bicarbonate in UTC due to lowpH. The situation is quite different during acet-azolamide treatment. The inhibition of carbonic an-hydrase in the proximal nephron results in the de-velopment of a disequilibrium isotopic ratio betweenHCO- and CO2and significant '3C enrichment of thebicarbonate. The small proportion of CO2 in thesesamples cannot affect this enrichment.
In conclusion, our data substantiate three importanthypotheses: (a) Bicarbonate is reabsorbed by con-version to CO2, (b) CO2 diffuses freely in both di-rections through the nephron membrane, and (c)rapid isotope exchange occurs in the proximal neph-ron because of the presence of luminal carbonic an-hydrase.
APPENDIX IDissolved C02 equilibrium. In deriving concentrations
of (CO2) and (HCO-), we have used equations that aresomewhat different from those usually in use in connectionwith studies of urinary and tubular fluids. We think thatin this more rigorous way we derive more realistic values.The relevant equilibrium equations and constants fromStumm and Morgan (49) for 370C and osmolality rangeof urine are listed below.
C02 + H20 4 H2C03, K = [H2C0]] (13)[H2O][C02] 13
but since [H20] 1, K = [H2C03]/[C02]. The constantK is on the order of 1/650.
aH [HCO]H2C03 4± H+ + HCO-, K, = [HC3 (14)
where aH = IO-pH.The sum [C0'] = [CO2] + [H2C03] is more readily mea-
sured than either [CO2] or [H2C03], but [CO2] is fairly closeto [CGO]. For this reason another, constant (Kl) is defined:
Kl=aH [HCO3-] =l-1(7CK, [G0] = 10 -61 (370G),
but [CG2O] = [H2CO3] * (K + 1)/K, and
Kl = aH [HCO-] K,*K[H2C03]. (K + 1) K + 1
.[CO+i]HCO- 4 H+ + GCi2 K2 = aHGO3
(15)
= 10-92 (370C). (16)
It is evident from Eq. 16 that at pH below 7.2 (the rangeof all our normal samples), concentration of C02- is neg-ligible. This, however, is not the case in acetazolamidetreatment at high pH values.
APPENDIX II
Isotopic distillation. All isotope reactions that proceedso that the products are isolated immediately from the reac-
2134 Z.-V. Burbea, B. Luz, B. Lazar, J. Winaver, and 0. S. Better
tants will progressively change the isotopic compositions ofthe reactants (40, 41).
Below, we derive the Rayleigh distillation equation, whichis useful for isotopic distillation processes.
Welet A and B designate the amount of the species con-taining the abundant and rare isotopes, respectively(H12CO- and H'3CO-, for example). The reaction rate ofeach species is proportional to its abundance, and the rateof reaction of each species is different (H 12CO has a slowerrate).
dA = -KA *A, (17)
dB = -KB * B, (18)
a = KA/KB, (19)
dA AdB
= a-B. (20)
Rewriting in integral form, we get
fBdB 1 (A dAJBO-aJAOA ' (21)sB aJAA
where Ao and Bo are the initial amounts, and A and B thefinal amounts of reactants. By integration, we obtain either
In (B/Bo) = (1/a) In (A/Ao) (22)or
(B/Bo) = (A/AO)'/'. (23)Dividing both sides by A/AO, we obtain
(B/A)/(BO/AO) = B/A/BO/AO = (A/AO)1/a-1. (24)Since B is only a trace of A + B, the fraction (f) of theremaining reactants is equal to A/Ao. In addition, a isonly slightly different from 1, and 1 - a is a close ap-proximation of 1/a - 1. Thus,
(B/A)/(BO/AO) = fl-a (25)Weconsider the reaction HCO- + H+ - CO2+ H20, Eq.25 takes the following form:
(3C/'2C) final = fl-a (26)('3C/12C) initial (6
Wenow change from ratios to the 6 notation (Eq. 3), asfollows:
(13C/12C) final= [10-3 (613C final) + 1] ('3C/'2C) PDB. (27)
('3C/'2C) initial is expressed in a similar way:
10-3 (13C final) - 110-3 (13C initial) -1 f (28)
By arrangement, we obtain Eq. 6:
613C final = (1,000 + 6'3C initial) -fl- - 1(000The CO2 produced in the reaction is 6%o depleted in
613C with respect to HCO3(at 37°C). Thus, the fraction-ation factor a equals 1.006.
ACKNOWLEDGMENTSThe authors are grateful to T. D. DuBose, Jr., and M. Luccifrom Galveston, TX; S. Glick from Beer-Sheba, Israel; N.
Kurtzman from Chicago, IL; F. C. Rector from San Francisco,CA; and H. Schwartz from McMaster University, Ontario,Canada, for discussing the results and for their useful sug-gestions. The remarks of two reviewers were very helpful inimproving the manuscript. The authors are also grateful toMs. Ruby Snyder Weiss for devoted secretarial assistance,and to Mr. Saul Winderbaum (Department of Geology, He-brew University) for mass-spectrometric analyses.
REFERENCES
1. Pitts, R. F., and R. S. Alexander. 1945. The nature ofthe renal tubular mechanism for acidifying the urine.Am. J. Physiol. 144:239-254.
2 Pitts, R. F., and W. D. Lotspeich. 1946. Bicarbonate andthe renal regulation of acid base balance. Am. J. Physiol.147:138.
3. Brodsky, W. A., and T. P. Schilb. 1974. The means ofdistinguishing between hydrogen secretion and bicar-bonate reabsorption: theory and applications to reptilianbladder and mammalian kidney. Curr. Top. Membr.Transp. 5:161-224.
4. Maren, T. H. 1967. Carbonic anhydrase: chemistry,physiology and inhibition. Physiol. Rev. 47:595-781.
5. Maren, T. H. 1974. Chemistry of the renal absorptionof bicarbonate. Can. J. Physiol. Pharmacol. 52:1041-1050.
6. Rector, F. C., Jr., N. W. Carter, and D. W. Seldin. 1965.The mechanism of bicarbonate reabsorption in the prox-imal and distal tubules of the kidney. J. Clin. Invest.44:279-290.
7. Viera, F. L., and G. Malnic. 1968. Hydrogen ion secretionby rat renal cortical tubules as studied by an antimonymicroelectrode. Am. J. Physiol. 214:710-718.
8. Malnic, G., M. Mello Aires, and G. Giebisch. 1972. Mi-cropuncture study of renal tubular hydrogen ion transportin the rat. Am. J. Physiol. 222:147-158.
9. DuBose, T. D., L. R. Pucacco, D. W. Seldin, and N. W.Carter. 1981. Determination of disequilibrium pH in therat kidney in vivo: evidence for hydrogen secretion. Am.J. Physiol. 240 (Renal, Fluid, Electrolyte Physiol.9):F138-F146.
10. Warnock, D. G., and F. C. Rector, Jr. 1981. Renal acid-ification mechanisms. In The Kidney. B. Brenner andF. C. Rector, Jr., editors. W. B. Saunders Co., Phila-delphia. 440-494.
11. Karlmrk, B., and B. G. Danielson. 1974. Titratable acid,pCO2, bicarbonate and ammonium ions along rat prox-imal tubule. Acta Physiol. Scand. 91:243-258.
12. DuBose, T. D., Jr., L. R. Pucacco, D. W. Seldin, N. W.Carter, and J. P. Kokko. 1978. Direct determination ofPco2 in rat renal cortex. J. Clin. Invest. 62:338-348.
13. Sohtell, M. 1979. pCO2of the proximal tubular fluid andthe efferent arteriolar blood in the rat kidney. Acta Phy-siol. Scand. 105:137-145.
14. Gennari, F. J., C. R. Caflish, C. Johns, and J. J. Cohen.1979. Demonstration of a pCO2 gradient between earlyand late proximal tubules and between early proximaltubules and star vessels in the rat kidney. Kidney Int.16:815A. (Abstr.)
15. Graber, M. L., H. H. Bengele, J. H. Schwartz, andE. A. Alexcander. 1981. pH and pCO2 profiles of the ratinner medullary collecting duct. Am. J. Physiol. 241(Renal, Fluid, Electrolyte Physiol. 10):F659-F668.
16. DuBose, T. D., Jr. 1982. Hydrogen ion secretion by thecollecting duct as a determinant of urine to blood Pco2gradient in alkaline urine. J. Clin. Invest. 69:145-156.
Stable Carbon Isotope in Studying Renal CO2 Transport 2135
17. DuBose, T. D., Jr., L. R. Pucacco, M. S. Lucci, andN. W. Carter. 1979. Micropuncture determination ofpH, Pco2 and total CO2 concentration in accessiblestructures of the rat renal cortex. J. Clin. Invest. 64:476-482.
18. Warnock, D. G., and F. C. Rector. 1978. CO2permeabilityand bicarbonate generation by the isolated perfused rab-bit proximal straight tubule. Kidney Int. 11:576A. (Abstr.)
19. Schwartz, G. J., A. M. Weinstein, R. E. Steele, J. L.Stephenson, and M. B. Burg. 1981. CO2 permeability ofrabbit proximal convoluted tubules. Am. J. Physiol. 240(Renal, Fluid, Electrolyte Physiol. 3):F231-F244).
20. Malnic, G., and M. Mello Aires. 1971. Kinetic study ofbicarbonate reabsorption in proximal tubule of the rat.Am. J. Physiol. 220:1759-1767.
21. Sohtell, M. 1979. pCO2 of the proximal tubular flud andthe efferent arteriolar blood in the rat kidney. Acta Phy-siol. Scand. 105:137-145.
22. Halperin, M. L., M. B. Goldstein, A. Haig, M. D. Johnson,and B. J. Stinebaugh. 1974. Studies on the pathogenesisof type I (distal) renal tubular acidosis as revealed bythe urinary Pco2 tensions. J. Clin. Invest. 53:669-677.
23. Stinebaugh, B. J., R. Esquenazi, F. X. Schloeder. W. N.Suki, M. B. Goldstein, and M. L. Halperin. 1980. Controlof the urine blood pCO2gradient in alkaline urine. Kid-ney Int. 17:31-39.
24. Stinebaugh, B. J., F. X. Schloeder, S. C. Tam, M. B.Goldstein, and M. L. Halperin. 1981. Pathogenesis ofdistal renal tubular acidosis. Kidney Int. 19:1-7.
25. Arruda, J. A. L., L. Mascimento, S. K. Kumair, andN. A. Kurtzman. 1977. Factors influencing the formationof urinary carbon dioxide tension. Kidney Int. 11:307-317.
26. Arruda, J. A. L., L. Nascimento, P. K. Mehta, D. R.Rademacher, J. T. Sehy, C. Westenfelder, and N. A.Kurtzman. 1977. The critical importance of urinary con-centrating ability in the generation of urinary carbondioxide tension. J. Clin. Invest. 60:922-935.
27. Maren, T. H. 1978. CO2 equilibria in the kidney: theproblems of elevated CO2 tension, delayed dehydration,and disequilibrium pH. Kidney lnt. 14:395-405.
28. Malnic, G. 1980. CO2 equilibria in renal tissue. Am. J.Physiol. 239 (Renal, Fluid, Electrolyte Physiol. 8):F307-F318.
29. Malnic, G. 1981. Cellular mechanisms of urinary acid-ification. Miner. Electrolyte Metab. 5:66-82.
30. Matwigoff, N. A., and D. G. Ott. 1973. Stable isotopetracers in the life sciences and medicine. Science (Wash.DC). 181:1125-1133.
31. Lacorix, M. 1973. Glucose naturally labeled with "3C usefor metabolic studies. Science (Wash. DC). 181:445.
32. Jacobson, B. S., B. N. Smith, S. Epstein, and G. Laties.1976. The prevalence of '3C in respiratory CO2 as an
indicator of the type of endogenous substrate. J. Gen.Physiol. 55:1.
33. Schoeller, D. A., P. D. Klein, J. B. Watkins, T. Heim,and W. C. MacLean Jr. 1982. "3C abundances of nutrientsand the effect of variation in '3C isotopic abundances oftest meals formulated for 13CO2 breath tests. Am. J. Clin.Nutr. 33:2375.
34. Schoeller, D. A., P. D. Klein, W. C. MacLean, Jr., J. B.Watkins, and E. Van Santen. 1981. Fecal "3C analysisfor the detection and quantitation of intestinal malab-sorption. J. Lab. Clin. Med. 97:439.
35. Urey, H. C. 1947. The thermodynamic properties of iso-topic substances. J. Chem. Soc. (Lond.). 562-582.
36. Craig, M. 1953. Geochemistry of stable carbon isotopes.Geochim. Cosmochim. Acta. 3:53-92.
37. Mills, G. A., and Urey, H. C. 1940. The kinetics of isotopicexchange between carbon dioxide, bicarbonate ion, car-bonate ion and water. J. Am. Chem. Soc. 62:1019-1037.
38. Deuser, W. G., and E. T. Degens. 1967. Carbon isotopefractionation in the CO2 (gas) - CO2 (aq) - HCO-(aq).Nature (Lond.). 215:1033-1035.
39. Friedman, I., and J. O'Neil, Jr. 1977. Compilation ofstable isotope fractionation factors of geochemical in-terest. US Geol. Survey. 440K:1-12.
40. Dansgaard, W. 1964. Stable isotopes in precipitation.Tellus. 16:436.
41. Broecker, W. S., and V. M. Oversby. 1971. ChemicalEquilibria in the Earth. McGraw-Hill Book Co., Inc.,New York. 1-318.
42. Lyon, T. P., and M. S. Baxter. 1978. Stable carbonisotope in human tissues. Nature (Lond.). 273:750-751.
43. Gaffney, J. S., A. P. Irsa, L. Friedman, and D. N.Slatkin. 1978. Natural '3C/12C ratio variations in hu-man populations. Biomed. Mass Spectrom. 5:495-497.
44. DeNiro, M. J., and S. Epstein. 1976. You are what youeat (plus a few %o). The carbon isotope cycle in food.Geol. Soc. Am. Prog. 8:834. (Abstr.)
45. DeNiro, M. J., and S. Epstein. 1978. Influence of dieton the distribution of carbon isotopes in animals. Ceo-chim. Cosmochim. Acta. 42:495.
46. Minson, D. J., and A. Ludlow. 1975. Differences incarbonic isotope ratios of milk and hair from cattlegrazing tropical and temperate pastures. Nature(Lond.). 256:602.
47. Kroopnick, P. 1974. Correlation between "3C and CO2in surface water and atmospheric CO2. Earth Planet.Sci. Lett. 22:397-403.
48. Wendt, I. 1968. Fractionation of carbon isotopes andtemperature in the system C02-gas-CO2s in solution.Earth Planet. Sci. Lett. 4:64-68.
49. Stumm, W., and J. J. Morgan. 1981. Aquatic chemistry.John Wiley & Sons, New York. Second ed. 780.
2136 Z.-V. Burbea, B. Luz, B. Lazar, J. Winaver, and 0. S. Better