Embed Size (px)
Citation preview

International Journal of Tropical Medicine 11 (5): 175-181, 201 6 ISSN: 1816-3319
Medwell Journals, 201 6
i Shoaib Rahimi, 'Younes Sohrabi, "Seyedeh Shadi Charganeh, 1Katayoon Bavandpour, 1Farshad Rahmani Tabar, iDiyari Abdollahzadeh and 'Mandi Dabirian
'Department of Environmental Health Engineering, Students Research Committee, Kermanshah University of Medical Sciences, Kermanshah, Iran
'Department of Environmental Health Engineering, School of Public Health, Zabol University of Medical Sciences, Zabol, Iran
'Social Determinants in Health Promotion Research Center, Hormozgan University of Medical Sciences, Bandar Abbas, Iran
Abstract: Physical, chemical and microbial properties of drinking water are the base of judging its drinkability. Undesirable changes in these parameters can threaten consumers' health. Therefore, the purpose of this study is to investigate the physical, chemical and microbial quality of drinking water and compare it to national standards. This cross-sectional descriptive study was conducted in 2011-201 4. Moment sampling was done from the water of distribution network of 15 locations in the city. Totally, 1780 samples were collected for microbial analysis and 30 samples were collected for chemical analysis. Standard methods according to the book "standard method" were used to carry out the experiments. Research results showed that the remaining chlorine in 2012 was zero in 22 samples and <0.2 Mg L -1 in 3 samples. Fecal coliform was negative in all cases. In addition, the physical and chemical parameters under study were standard. In 2013, the remaining chlorine was zero in 16 cases and >0.8 Mg L -1 in. 23 cases. Thermo-tolerant coliform was also observed in 1 case. All the parameters were standard and desirable. In 2014, the remaining chlorin. e in. the distribution network was zero in 19 cases and it was between 0.1-0.4 in. one case and >0.8 in. 8 cases. Also in 2014, no coliforms were observed in the cases. It was clarified in. physicochemical experiments that the amount of fluoride is less that the standard level. The health quality of drinking water in Kamyaran City is not problematic and it is not standard in. many cases in terms of the remaining chlorine and fluoride.
Key words: Microbial, physicochemical, quality, drinking, water
INTRODUCTION
Now a days, water scarcity problem and environmental degradation are considered as one of the greatest problems of human society. The main. reasons for water scarcity is population growth, improvement in living standards, climate change and lack of proper management of water resources. In this context wastewater treatment and wastewater recirculation are the most important strategy in. the development of water resources management which can play an important role in relation to water shortages (Mariolakos, 2007). Every day, millions of liters of sewage entering to rivers by factories and industrial centers of the world, the seas and soil resources and in. fects humans living environment and other living organisms such as plants and animals (Taunsstein et al., 1989).
Industries that have a poor management, by contaminated soil, water and air caused deterioration of environmental resources (UNEP, 1997). The industrial waste is one of the environmental problems in human societies. Generally, in. dustrial wastewater quality is different according to the type of produced products in each in. dusty (Arceivala, 1998; Dutta, 1994). Rajaram and Das (2008) in. their study entitled water contamination by industrial wastewater in India believe that India moves toward the impose stricter guidelines than industrial waste-water for pollution control and more efforts of people are in order to reduce the risk to public health related to toxic pollutants that mostly colorless and odorless and is expected to enter the ecosystem.
With the development of in. dustry in. Germany, Industrial wastewater production increased in the country
Corresponding Author: Mandi Dabirian, Social Determinants in Health Promotion Research Center, Hormozgan University of Medical Sciences, Bandar Abbas, Iran
175
Investigation of the status of quality of waste water in kangavar industrial city

ant. I Trop. Med., 11 (5): 175-181, 2016
to the extent that in 1999-3000 reached to the million cubic meters, the figure at that time was >30% of produced sewage in the country (Reemtsma et al., 1999). The difference in the quantity and quality of manufacturing, industrial operations and the great variety of chemicals that used in industrial units, including matters that the waste management industry is far more specialized and more complex than their urban waste water (Wang et al., 2004; Water Environment Federation, 2008). The most important feature of industrial waste water is high fluctuations quantity and high diversity in quality including parameters of harmful chemicals, toxin. s, COD and BOD of heavy metals (Wang et al., 2004; Nemerow, 2007).
Discharges raw sewage and untreated industrial into to the environment is one of the serious problems that currently threaten Iran's water and soil resources. Studies on the shores of the Caspian Sea (Parizanganeh and Lakhan, 2007) and the Persian Gulf (Nahid et al., 2007) in the North and South of the country have been carried out and confirm' s the pollution caused by industrial wastewater in these areas. At the moment have been presented a variety of models for the management of industrial waste in. the world, especially in. developing countries. These models have been written based on a comprehensive database. However, in. many developing countries due to the lack of reliable data and the lack of a systematic database, management of wastewater mostly based on cross-sectional surveys or by trial and error (Loftis et al., 1987).
For example, European countries such as Germany and France use of comprehensive and updated database systems based on continuous monitoring and control while developing countries such as Slovenia only will suffice of provided annual statistics and information by industry (Reemtsma et al., 1999; Sabic, 2005). Today, developing control systems and industrial waste management in each country is one of the basic principles of environmental protection. The experience of industrialized countries has shown that with applying for control programs and waste management principles reduce the cost-of removal and clearing the infection from the environment 10-1 00 times. The waste management industry in addition to environmental benefits also includes significant economic benefits (Karami et al., 2011).
At the moment, there isn't accurate and reliable statistics on the quantity and quality of industrial wastewater and the way of their purification (Torabian and Mahjouri, 2004) and in. this regard has been conducted one of the case studies and cross-sectional which we can mention the following cases: evaluating of
Tehran in. dustrial wastewater during the years 1995-1998
by Torabian and Mahjouri (2004), quantitative and qualitative study of industrial wastewater of Amol Industrial park 2006 (Sadeghpoor et al., 2009), evaluate the efficiency of wastewater treatment plants, Salman Shahr Industrial park in. the removal of pollutants and possible use of effluent in 2008, evaluate the efficiency of
Bu-Ali-Hamedan industrial wastewater treatment plant in 2005 (Naddafi et al., 2005), evaluate the efficiency of Kermanshah wastewater treatment plants in slaughterhouse cattle 2004 (Farzadkia, 2003) and Hamedan in 2005 (Farzadkia, 2005) of case studies and cross-sectional in. other countries can mentioned the
investigations that be carried out in Jordan in 2002. In this study, reported the significant amounts of heavy metals like chromium, nickel, lead, cadmium, copper, zinc and iron industry was in. the waste water outlet (Mohsen and Saber, 2003).
In order to create a control system and waste
management industry in the country, the various organizations and institutions including the Department of Industries and Min. es, Department of the Environment, Ministry of Health, the organization for statistics and information and university research centers, consulting engineers should work closely together. It is obvious that
the first step towards realizing the system is an accurate and updated database of environmental in. dustries and then determine the rankings is this in. dustry (Karami et al., 2011). This study was carried out aim. ed to environmental ranking established industries in. the Kangavar industrial park based on the quantity and quality of industrial
wastewater in 2014. The results of this research can be used as recorded preliminary data database.
MATERIALS AND METHODS
This is cross-sectional study was conducted in
the Kangavar industrial park. In this study, chemical industrial zone (rubber parts, production of packaging drinking straw, polystyrene foam, Microlament fertilizer, double-wall pipes), metal zone industries (minibuses of ambulances body manufacture, Tanker trailer manufactures , shed industries, aluminum um doors and
windows making), zone in. food in. dustry (dried corn, pasta, food, mayonnaise, sauces food, variety of food, animal feed), textile in. dustries zone (cotton blanket producing) g) and in. dustrial and sanitary wastewater production was evaluated in. terms of qualitative and quantitative parameters. Referring to the in. dustrial park
and wastewater samples were collected in 3 L polyethylene contain' ers. A total of 400 samples was
176

■ Inclustrial(El.od) • Saritarv(13oN
1.59 1.613 1.34
0 Dried corn Macaroni Foodstuffs Food
Food Sauces Sauces
1.36.
07 0.99
Macaron 2 Food 2 food Animalfeed Sauces industry
5
a
3
2
1
4.13
6.88
COD sanitary
i. !' 4
0A1
Macaroni Dried
0.96 ■ corn
1.33 II 0.17
Macaroni Z
4.47
0.31
Food Sauces
2.F1
0-39 NMI
Foodstuffs
6 T COD industry • 4.53
.■.■ 0.32 0.23 nett
Aninialleeu 2 food 2 Food Sauces industry
1 7
6
5
4
3
2
1
0
ant. I Trop. Med., 11 (5): 175-181, 2016
harvested and transferred to the laboratory and pilot Medical University School of Public Health. Then according to laboratory standard method book based on 2008 version, tests were performed. In this study, investigated the wastewater parameters, types of industry, TSS, COD BOD5 in industrial and sanitary wastewater of this industry. Excel software was used to analyze the obtained data.
RESULTS AND DISCUSSION
According to the results of the highest production of BOD5 food zone in wastewater of the animal feed industry (5/6 kg d-1 ) and the lowest BOD5 of Pasta Industries 2 (0/7 kg d -1 ), also in Sanitary sewer, the highest amount of BOD5 (0/62 kg d -1 ) related to the animal feed industry and the lowest amount of BOD5 is related to the pasta industries 2 (0/09 kg d -1 ) (Fig. 1).
The highest amount of COD in the food zone of
waste water industries related to the dry corn industries (6/88 kg d-1 ) and the lowest is in the food zone related to the Food industry field (1/65 kg d -1 ). In the Sanitary wastewater the highest amount is related to the animal feed industry zone (1/12 kg d -1 ) and the lowest is related to the pasta industry (Taunsstein et al., 1989) with the
amount of (0/17 kg d -1 ) (Fig. 2). In the food zone the highest TSS in wastewater
industries was related to animal feed industry (14 kg d -1 )
and the lowest was in the pasta industry 2 (0/79 kg d -1 ). Also in sanitary industry the highest TSS was related to the animal feed industry (0/75 kg d -1 ) and the lowest amount was related to the food industries (0/15 kg d -1 ).
In the zone of the textile (Industry Cotton blanket) the BOD of industrial waste water was (0/28 kg d -1 ) and sanitary (0/11 kg d -1 ), TSS in industrial wastewater (0/57 kg d-1 ) and Sanitary wastewater (0/13 kg d - I) and the amount of COD in industrial waste water was (1/43 kg d-1 ) and Sanitary wastewater was (0/19 kg d -1 ) (Fig. 4).
In plastic zone the highest BOD5 was in wastewater of Microlament fertilizer industry (4/5 kg d -1 ) and the lowest amount was from of poly-styrene foam (0/14 kg d-1 ). In Sanitary waste water in the plastic zone the highest BOD5 was in. Microlament fertilizer industry and the production of plastic pieces (0/25 kg d -1 ) and the lowest was in the polystyrene foam industry (0/13 kg d -1 ) (Fig. 5).
In plastic zone the TSS highest amount of plastic zone was in. wastewater of Microlament fertilizer industry (2/48 kg d-1 ) and the lowest was in polystyrene foam industry (0/09 kg d -1 ). In sanitary wastewater the highest amount of TSS related to Microlament fertilizer industry and production of plastic parts (0/3 kg d -1 ) and the lowest amount was in the packaging drinking straw tape industry (0/23 kg d -1 ) (Fig. 6).
In the plastic zone the highest COD of industrial wastewater was related to the Microlament fertilizer production industry (5/82 kg d -1 ) and was the lowest in
Fig. 1: BOD5 in in. dustrial and sanitary wastewater of food zone industry
Fig. 2: COD in. industrial and sanitary wastewater of food industries zone
177

5 4,5
4
3,5 3
2.5
2 1.5
1 0.5
0.47 0.21
Doub le Polyethylene
Pipe
M , = 0.25
Microlament
fertiliter
BOO industry
0.14 0.13
polystyrene
foam
0.2 0.19 -
Packaging
drinking stow tape
I BOO sanitary
0.26 0.25
--
0
Rubber parts
Int. Trop. Med., 11 (5): 175-181, 2016
14 14
12 TS5 industry T55 sanitary 10
8
4.8
4 2.27 1.15
2.24 1.96 1.9 2 75
MI5 22 01a 21 26 27
0 Dried corn Animaffeed 2 food
industry 2 Food Sauces
Macaroni2 Food Sauces
Foodstuffs Macaroni
Fig. 3: TSS in industrial and sanitary wastewater separation in various industries food zone
1.6
1.4
1.2
1
0.8
0.6
0.4
0.2
0
0.28
■ sir dip BOD BOD
industry sanitary TSS industry TSS sanitary COD COD
industry sanitary
(cotton blankets)
Fig. 4: Parameters in industrial and sanitary wastewater in the textile industry industrial and sanitary wastewater (cotton blankets)
Fig. 5: BOD5 in industrial and sanitary wastewater in various plastic zone industries
7 6
COD sanitary sanitary5
4
3 1.67
2 1.24 1.26
1 m 0.38 0.46 0.37 0.33 . 0.24 1 0.45 0 0
0 M ■ ∎ ■ ■ ■ ■ Double Microlament polystyrene Packaging Rubber parts
Polyethylene fertilizer foam drinking straw Pipe tape
Fig. 6: The amount of TSS in industrial and sanitary wastewater in plastic zone industry
178
LBOD industryJ.
0.81
0.03
1.2
1
0.8
0.6
0.2
BOD sanitary 1.05
C.48 I
0
Int. Trop. Med., 11 (5): 175-181, 2016
2.5 2.48
2 I T55 industry "BS sanitary U
1.5 ked
1
05 0.31 0 . 25 0.3
0 . 0 0A5 0.23 0 . 0,1 0.3
Double Microlament polystyrene Packaging Rubber parts Polyethylene fertilizer torn drinking straw
Pipe tape
Fig. 7: COD in. industrial and sanitary wastewater in various in. dustries of plastic zone
Doors and Production sites T anker trailers Tanker trailers windows of minibuses of aluminum AM11111Ariel:q
Fig. 8: BOD in industrial and sanitary wastewater in various metal zone in. dustry
manufacture of polystyrene foam (0/37 kg d -1 ). In plastic zone the highest amount was related to the manufacturing plastic parts (0/45 kg d -1 ) and the lowest amount of COD was packaging drinking straw tape industry (0/24 kg d -1 ) (Fig. 7).
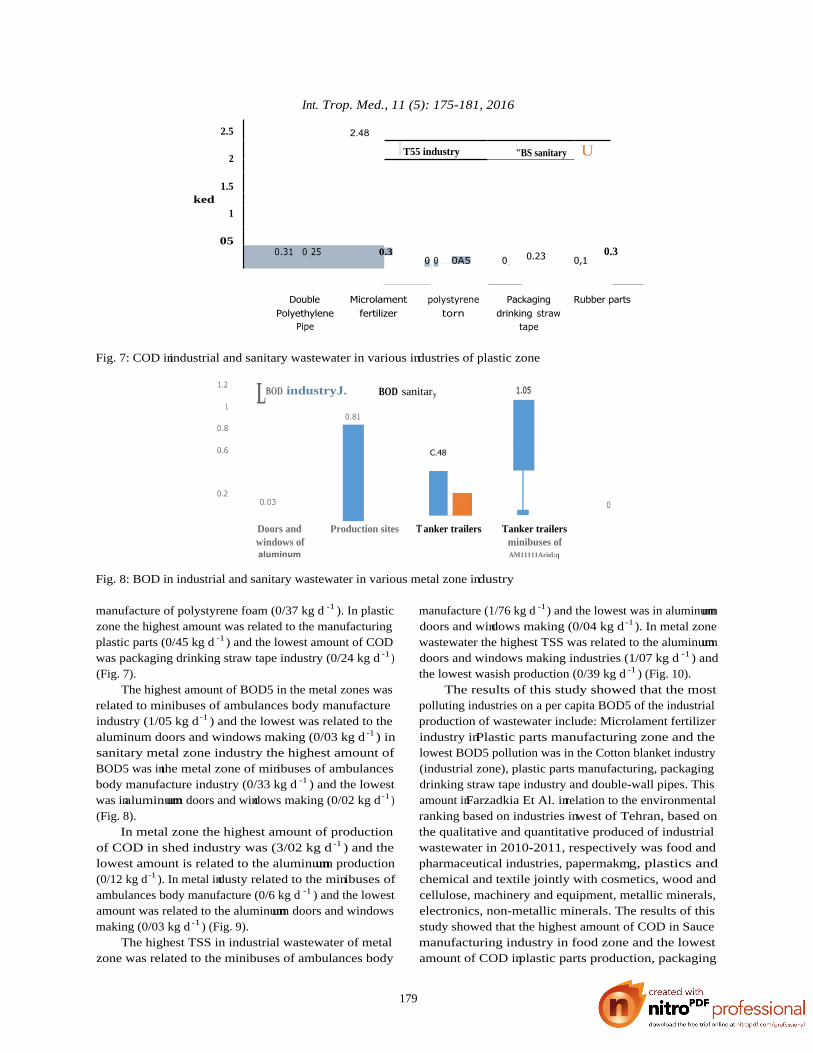
The highest amount of BOD5 in the metal zones was related to minibuses of ambulances body manufacture industry (1/05 kg d -1 ) and the lowest was related to the aluminum doors and windows making (0/03 kg d -1 ) in sanitary metal zone industry the highest amount of BOD5 was in. the metal zone of min. ibuses of ambulances body manufacture industry (0/33 kg d -1 ) and the lowest was in. aluminum um doors and win. dows making (0/02 kg d -1 ) (Fig. 8).
In metal zone the highest amount of production of COD in shed industry was (3/02 kg d -1 ) and the lowest amount is related to the aluminum um production (0/12 kg d-1 ). In metal in. dusty related to the min. ibuses of ambulances body manufacture (0/6 kg d -1 ) and the lowest amount was related to the aluminum um doors and windows making (0/03 kg d -1 ) (Fig. 9).
The highest TSS in industrial wastewater of metal zone was related to the minibuses of ambulances body
manufacture (1/76 kg d -1) and the lowest was in aluminum um doors and win. dows making (0/04 kg d -1 ). In metal zone wastewater the highest TSS was related to the aluminum um doors and windows making industries (1/07 kg d -1 ) and the lowest wasish production (0/39 kg d -1 ) (Fig. 10).
The results of this study showed that the most polluting industries on a per capita BOD5 of the industrial production of wastewater include: Microlament fertilizer industry in. Plastic parts manufacturing zone and the lowest BOD5 pollution was in the Cotton blanket industry (industrial zone), plastic parts manufacturing, packaging drinking straw tape industry and double-wall pipes. This amount in. Farzadkia Et Al. in. relation to the environmental ranking based on industries in. west of Tehran, based on the qualitative and quantitative produced of industrial wastewater in 2010-2011, respectively was food and pharmaceutical industries, papermakm. g, plastics and chemical and textile jointly with cosmetics, wood and cellulose, machinery and equipment, metallic minerals, electronics, non-metallic minerals. The results of this study showed that the highest amount of COD in Sauce manufacturing industry in food zone and the lowest amount of COD in. plastic parts production, packaging
179

ant. I Trop. Med., 11 (5): 175- 181, 2016
3.5
3
2.5
2
1.5
1
0.5
0
3.02
1.93
0.12
■ i .
Doors and windows of Production sites
aluminum
Tanker trailers Tanker trailers minibuses of
ambulances
Fig. 9: COD in industrial and sanitary wastewater in various metal zone industry
2
1.5
1
0.5
Doors and windows of aluminum
Production sites Tanker trailers Tanker trailers minibuses of ambulances
Fig. 10: TSS in. industrial and sanitary wastewater in. various metal zone indu
drinking straw and double wall Polyethylene Pipe was in the plastic zone. The results of the Farzadkia studied showed that the abundance of Papermaking, plastic and chemical, machinery and equipment, textiles, food and pharmaceutical, cosmetics, wood and cellulose, metallic minerals, non-metallic min. erals.
Separation of wastewater from another waste such as separation and blood processing industries, slaughterhouses and meat packing wastewater are the successful example of this action (Farzadkia, 2003, 2005). Applied simple and in. expensive treatment sewage sludge such as lime or reuse of this sludge, if possible is from the experiences that is used efficiently in. many industrialized countries (Farzadkia et al., 2009). The results of a study by Torabian in. the years 1994-1998 on five main. groups: food, beverage industry, textile, chemical, metal and non-metallic minerals was conducted in Tehran and showed that in the food, textile and metal industry, respectively 8, 18 and 8% that was proper treatment and provided effluent standards. Effluent discharge in. the food and textile in. dustries were 64/2 and 48/8% of surface water and in. nonmetallic mineral and metallic mineral industries, respectively is 86 and 83% of surface water (Torabian and Mahjouri, 2004). Due to the water shortage in the region and the risk of contamination of water resources is appropriate to revise the water consumption
methods and to minimize water consumption. The program that has been implemented in most developed countries including the US as a first step towards developing environmentally friendly industries. The results of this study showed that a number of established in. dustries in the area of treated wastewater for reuse are transferred to the agricultural lands. Drought crisis in Iran should be emphasized the reuse required the treated wastewater, systematic approach to water management and sanitation in the country, especially in. industries can largely solve the problem of water shortage in the country (Farzadkia, 2003). This industrial zone in. the SIA region happened in Kuwait, this area with daily production of 31,000 m 3 of industrial waste with 3,000 m 3 of sanitation was the first industrial area in. Kuwait that transfer their wastewater without treatment into to the Persian Gulf. After managing principles and the sewage treatment plant, the total wastewater in. the region for irrigation of green spaces was used to the dry zone and very little water (Muzaini, 1998).
CONCLUSION
Given that this amount is higher than Iran EPA's standards for discharge into the pollutants BOD: (mg 1, -1 = 50), COD: (mg 1, -1 = 100), TSS: (mg 1, -1 = 60)
180

Int. J. Trop. Med., 11 (5): 175-181, 2016
and for receiving agricultural water BOD: (mg L -1 = 100), COD: (mg L -1 = 200), TSS: (mg L -1 = 1 0) which drop of this industrial wastewater effluent or used without purification for agriculture due to irreparable damage on the environment and public health and wellbeing. The new nanotechnology methods is new trend in environmental sciences (Taghavi et al., 2013; Amini et al., 2014), this new trend must be used for removal pollution from water.
REFERENCES
of nanotechnology in food industries. Elect. Phys., 6: 962-968.
Arceivala, 5.1., 1988. Wastewater Treatment for Pollution Control. 2nd Edn., Tata McGraw Hill Publishing Co. Ltd., New Delhi, India, ISBN: 100074630024.
Dutta, P.K., 1994. An overview of textile pollution and its remedy. Indian J. Environ. Prot., 14: 443-446.
Farzadkia, M., 2003. Efficiency of waste stabilization ponds for slaughterhouse wastewater treatment in Kermanshah Iran. Every Thing About Water 1., 2003: 54-56.
Farzadkia, M., 2005. Efficiency of AB process for slaughterhouse wastewater treatment. Int. J. Ecol. Environ. Sci., 31: 139-143.
Farzadkia, M., N. Jaafarzadeh and L. Loveimi-Asl, 2009. Optimization of bacteriological quality of biosolids
Karami, M.A., M. Farzadkia, A. Jonidi, R. Nabizadeh and M.R. Gohari et al., 2011. Quantitative and qualitative investigation of industrial solid waste in industrial plants located between Tehran and Karaj. Iran Occup. Health, 8: 1 4-23.
Loftis, 1. C., P.S. Porter and G. Settembre, 1987. Statistical analysis of industrial wastewater monitoring data. J. Water Pollut. Control Fed., 59: 145-151.
Mariolakos, I., 2007. Water resources management in the framework of sustainable development. Desalin., 213: 147-151.
Mohsen, M.S. and 1.0. Saber, 2003. Potential of industrial wastewater reuse. Desalin., 152: 281-289.
Muzaini, S.A., 1998. Industrial wastewater management in Kuwait. Desalin., 115: 57-62.
Naddafi, K., F. Vaezi, M. Farzadkia and T.A.R. Kimiaei, 2005. [Study of aerated lagoons in treating industrial effluent from industrial Bou-Ali zone in Hamedan (In Persian)]. Water Wastewater 1., 16: 47-53.
Nahid, P., M. Vosoughi, I. Aalemzadeh and A.M. Sanati, 2007. [Bioremediation of pahs for the Persian gulf water by RBCp and MBBR contactors (In Persian)]. J. Water Wastewater, 62: 12-19.
Nem erow, N.L ., 2010. Industrial Waste Treatment: Contemporary Practice and Vision for the Future. Butterworth-Heinemann, UK., ISBN-13: 978-0-12-372493-9.
Parizanganeh, A. and V.C. Lakhan, 2007. A survey of heavy metal concentrations in the surface sediments along the Iranian coast of the Caspian sea. J. Water Wastewater, 63: 1-12.
industrial effluents in India: Discharge scenarios and case for participatory ecosystem specific local regulation. Futures, 40: 56-69.
Reemtsma, T., A. Putschew and M. Jekel, 1999. Industrial wastewater analysis: A toxicity-directed approach. Waste Manage., 19: 181-188.
Sabic, D., 2005. Industrial wastewater generation and treatment-data collection and gaps to questionnaire requirements. Proceedings of the IWG-Env International Workshop on Water Statistics, June 20-22, 2005, IWG-Env Publisher, Vienna, Austria, Europe, pp: 1-7.
Sadeghpoor, M., B. Hosseini and G.D. Najafpour, 2009. Assessment of wastewater treatment plant's performance in Amol Industrial Park. Am. Eurasian J. Agric. Environ. Sci., 5: 707-711.
the environment and outdoor workplaces. Electron. Physician, 5: 706-712.
T auns stein, N., W. Fres enius and W. Schnider, 1989. Wastewater Technology, Collection, Treatment and Analysis of Wastewater. Springer, Berlin, Germany, pp: 68-90.
Torabian, A. and M. Mahjouri, 2004. An investigation on the industrial wastewater in Tehran province. Water Wastewater, 50: 34-45.
UNEP., 1997. The environmental management at industrial estates. UNEP Publication, London, England. pp: 150-152
Wang, L.K., Y.T. Hung, H.H. Lo and C. Yapijakis, 2004. Handbook of Industrial and Hazardous Wastes Treatment. 2nd Edn., Marcel Dekker Inc, New York, USA., Pages: 550.
Water Environment Federation, 2008. Industrial Wastewater Management, Treatment and Disposal. 3rd Edn., WEF Press, USA., Pages: 567.
181
Amini S.M, Gilaki M and Karchani M, 2014. Safety Rajaram, T. and A. Das, 2008. Water pollution by
by lime addition. Iran J. Environ. Health Sci. Taghavi S.M, Momenpour M , Azarian M, Ahmadian M Eng., 6: 29-34. and Souri Fet al., 2013. Effects of nanoparticles on